")
Back to Journals » Patient Preference and Adherence » Volume 13
Patients’ Perspective And Usefulness Of Pictograms In Short-Term Antibiotic Therapy – Multicenter, Randomized Trial
Authors Merks P , Świeczkowski D, Balcerzak M , Drelich E, Białoszewska K , Cwalina N, Zdanowski S , Krysiński J , Gromadzka G, Jaguszewski M
Received 4 May 2019
Accepted for publication 14 August 2019
Published 2 October 2019 Volume 2019:13 Pages 1667—1676
DOI https://doi.org/10.2147/PPA.S214419
Checked for plagiarism Yes
Review by Single anonymous peer review
Peer reviewer comments 2
Editor who approved publication: Dr Johnny Chen
Piotr Merks,1,2,* Damian Świeczkowski,3,* Marcin Balcerzak,4 Ewelina Drelich,2,4 Katarzyna Białoszewska,5 Natalia Cwalina,3 Szymon Zdanowski,3 Jerzy Krysiński,6 Grażyna Gromadzka,1 Miłosz Jaguszewski3
1Faculty of Medicine, Collegium Medicum, Cardinal Stefan Wyszyński University, Warsaw, Poland; 2Piktorex sp. z o.o., Warsaw, Poland; 3First Department of Cardiology, Medical University of Gdańsk, Gdańsk, Poland; 4Farenta Polska sp. z o.o., Warsaw, Poland; 5Department of Paediatric Dentistry, Medical University of Warsaw, Warsaw, Poland; 6Department of Pharmaceutical Technology, Faculty of Pharmacy, Nicolaus University in Toruń, Toruń, Poland
*These authors contributed equally to this work
Correspondence: Piotr Merks
Faculty of Medicine, Collegium Medicum, Cardinal Stefan Wyszyński University, Wóycickiego 1/3, 01-938, Warsaw, Poland
Tel +48 22 602 101 979
Email [email protected]
Purpose: To evaluate the practical utility of pharmaceutical pictograms in routine practice in community pharmacy. The primary outcome (composite endpoint) consisted of three elements: i) complete use of the whole package of medication, ii) taking the recommended dose twice a day, and iii) subjective assessment of patients’ perspective on medical information about antibiotic therapy obtained during the pharmacy consultation measured by Net Promoter Score in scale from 1 to 10 where 1 is the lowest and 10 the highest possible rating.
Patients and methods: A multicenter, randomized controlled study was conducted. Community pharmacies (n = 64) which agreed to participate in the study were assigned to one of two groups: i) study – providing an antibiotic with pictograms placed on the external packaging of the medicinal product containing information about drug regimen (n = 32); or ii) control – providing an antibiotic according to usual pharmacy practice (n = 32). Two semi-structured interviews were performed. Data were collected from 199 patients with a mean age ± SD of 45.5 ± 17.0 years.
Results: In the control group, 15.7% of participants discontinued therapy before using the whole package compared with 13.4% of participants in the study group. In the control group, 81.3% of patients reported that they always took the medication twice a day as recommended by their healthcare providers compared with 80.4% of patients in the study group. The Net Promoter Score was higher for pharmacy practice with than without pictograms (71.3% vs 51.5%, respectively, p<0.005). The chance that a patient was an advocate of pharmaceutical services (scores 9 and 10) was twice as likely in the case of pharmaceutical practice supported by pictograms (p<0.02). The composite endpoint was achieved more frequently in the population using pictograms, however this difference was not statistically significant (p<0.34).
Conclusion: The pharmaceutical pictograms are readily accepted by patients and could prove to be a valuable support for pharmacists in conducting pharmaceutical care. Further representative research is needed to evaluate the true effectiveness of this solution.
Keywords: antibiotic therapy, adherence to treatment, pictograms, pharmaceutical care, satisfaction, patient perspective, pharmacist
Introduction
The relationship between adherence to treatment regimen and achieving satisfactory outcomes is a well-established paradigm in medicine. Previous studies on this relationship have focused mainly on chronic diseases and long-term therapy, for instance, the use of antiplatelet therapy after percutaneous coronary interventions due to acute coronary syndromes.1 Recently, we have observed a new trend in evaluating adherence to short-term pharmacotherapy. This is a matter of paramount importance in the case of antibiotic therapy, where it is essential to tailor treatments to individual patients, but also balance the huge challenge for global public health that antibiotic resistance is.2 It should be noted that prescribing antibiotics is one of the most frequently applied ways of treatment, not only in the short-term but also in long-term pharmacotherapy – for example the treatment of cystic fibrosis.3 Several studies have proved that improving adherence to the recommended antibiotic treatment could lead to improving the quality of patient care.4–6 In the community pharmacy setting, Fernandes et al proved that elderly patients with ingestion difficulties, and those who experienced poor satisfaction with the information provided by physicians, are particularly affected by the non-adherence phenomenon.7
A French study revealed that, despite the high level of knowledge about antibiotics, knowledge that these drugs are not effective for viral infections and how excessive consumption could lead to resistance, patient behavior still remains inappropriate.8 Educational campaigns are useful to improve patient’s awareness however, effectiveness of these interventions seems to be short-lived and doubtful in the long-term observation.9,10 Due to the high accessibility of community pharmacies, it is important to note that this setting could become a vital place to minimize the potential harm associated with the inappropriate usage of antibiotics.11 Pharmacists should have an effective tool which is directly dedicated to improving adherence, characterized by high patient acceptability and easily applied in routine settings.
Pharmaceutical pictograms have been described in the literature, however it is still not widely implemented in community pharmacies as a way of optimizing pharmacotherapy, even in countries where pharmaceutical care has a long tradition.12 Pharmaceutical pictograms should be accepted as a potential tool that pharmacists can include in their pharmaceutical care. These small labels placed on the external packaging of medicinal products could contain information about side effects, precautions or the recommended dosage.13 Apart from the necessary step of validation to ensure that pictograms are reliable and well-understood by patients, research is limited to exploring the patient’s perspective of pictograms. Aware of this gap in knowledge, the aim of our study was to evaluate the practical utility of pharmaceutical pictograms in routine practice in community pharmacy.
Materials And Methods
General Information
Our study was an example of a multicenter, randomized controlled study (Figure 1), conducted in 64 communities pharmacies that are part of FARENTA’s research network in Poland between 14.11.2016 and 15.12.2016. The ethical committee approved the study in current form, and we obtained informed consent from all participants in line with ethical guidelines used in similar studies. Community pharmacies (n = 64) which agreed to participate in the study were assigned to one of the two groups: i) study group – providing an antibiotic with pictograms placed on the external packaging of the medicinal product containing information about drug regimen (n = 32) or ii) control group – providing an antibiotic according to usual pharmacy practice (n = 32) (Figure 1). The dimension of each pictogram was 30 × 30 mm. The medical information contained on the pharmaceutical pictograms was consistent with the information provided by the Marketing Authorization Holder (MAH) in official documentation attached to the drug portfolio. All pictograms used in our study were previously evaluated.14
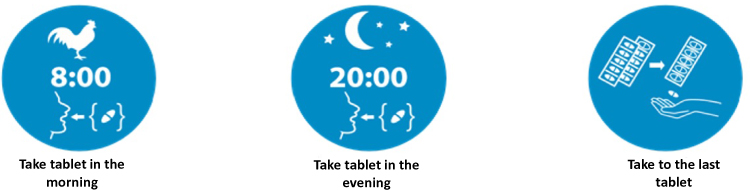 |
Figure 1 The pictograms used in the study. |
Inclusion And Exclusion Criteria
We included adults (above 18 years of age) who agreed to participate in the project and re-contact with pharmacy staff during the second follow-up interview. For inclusion into the study, the individuals must have purchased an antibiotic containing amoxicillin or amoxicillin with clavulanic acid during their visit in the community pharmacy, regardless of the brand name of the drug product. In addition, pharmacy staff must have identified on the prescriptions the recommendation for administering the drug in two divided doses for a specified period of treatment. It should be mentioned here that in the Polish legal framework, providing the information referring to proper administration and use of the medication is a prerequisite to reimburse the costs of drug products from public funds. We excluded patients using antibiotics in liquid formulations, those taking the drug in three divided doses, those who required a non-standard treatment regimen, or those requiring long-term pharmacotherapy (e.g. treatment of Lyme disease). In any such case, the indication was confirmed by pharmacy staff during the initial conversation with the patient.
The Primary Outcome
The primary outcome (composite endpoint) consisted of three elements: i) complete use of the whole package of medication, ii) taking the recommended dose twice a day, and iii) subjective assessment of patients’ perspective on medical information about antibiotic therapy obtained during the pharmacy consultation (dispensing of the drug in the community pharmacy).
The Study Protocol And Research Tool
The main research tool was a semi-structured interview based on two authorial questionnaires prepared by a member of the research team and tested for face and content validity during the pilot study. The first interview was conducted during the initial visit in the community pharmacy and after the dispensation. The first questionnaire included questions regarding the year of birth, sex, trade name of antibiotic, dose, number of tablets in package, length of therapy, scheme of dosage and indications for use of antibiotics. The second interview was conducted after 7–20 days, depending on the duration of treatment (information obtained from prescription), ideally the day after the patient took the last recommended dose of antibiotic. The second interview was conducted in the community pharmacy setting or by telephone if the patient agreed to this form of contact. The second questionnaire included questions regarding the resolution of symptoms, completion of a course of treatment, reasons for discontinuation of therapy, the regularity of drug taking, possible adverse reactions and subjective assessment of information on the use of the drug. Face and content validity of questionnaires were assessed in the preliminary stage of our project. The items were discussed among members of the research team in order to improve understandability. Additional tests, e.g. readability measure by Gunning Fog Index, were used to ensure that questions were understood by participants. The detailed characteristics of the study protocol are presented in Figure 2.
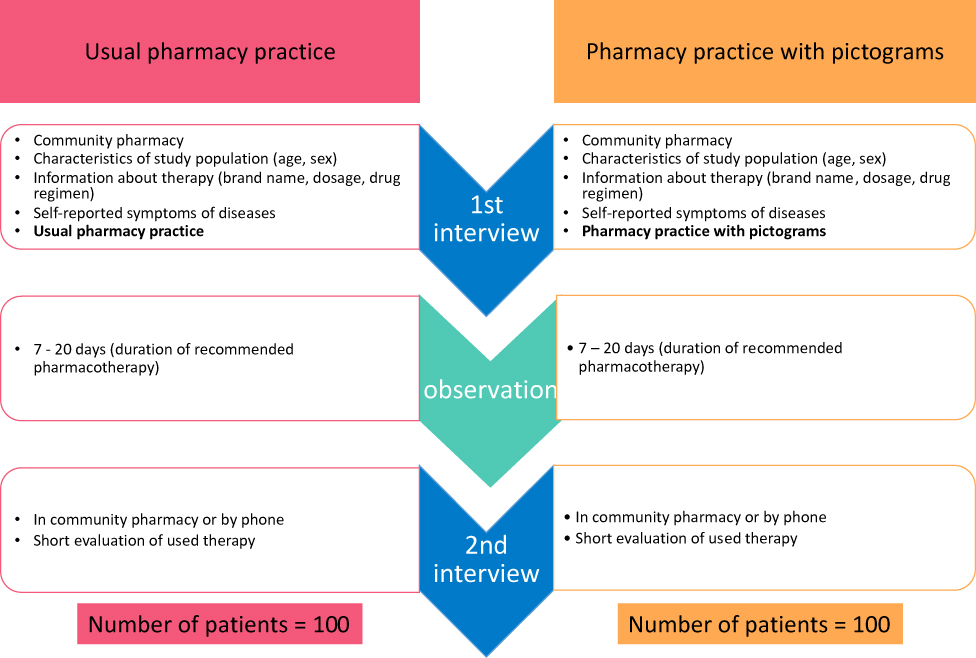 |
Figure 2 The study protocol – detailed characteristic. |
Practical utility was measured using the following self-declared indicators: i) relief of symptoms after antibiotic therapy, ii) use of the entire package of the drug (use of the recommended course of treatment), iii) taking the medications twice a day as it was recommended, iv) patients’ perspective on medical information provided by pharmacy staff in community pharmacy (scale from 1 to 10 where 1 is the lowest and 10 the highest possible rating). The last indicator was measured by Net Promoter Score Calculation, provided in the form of a one-single question aimed to assess how willing consumer is to recommend a particular product to other users. This technique widely used in marketing research was adopted in our study on a 10-point scale. Patients were subsequently assigned to one of the three groups as it is described in methodological suggestions.15 In view of patients’ perspectives, we divided their responses into three categories: i) advocates (score 9 and 10), ii) the indifferent (neutral opinion; score 7 and 8) and iii) critics (scores 1–6). In cases where patients discontinued the recommended treatment, pharmacists collected information about the reasons for this phenomenon, for instance, if any adverse events had occurred, information about their nature was also collected.
Patients, irrespective of whether they were included in the study group or the control group, both, completed the same questionnaires and their interviews were conducted with the same rigorous methodology. During the research period, the investigators constantly evaluated the quality of obtained information, e.g. monitoring whether the number of interviews conducted in particular community pharmacy did not exceed the number of assigned pictograms. Community pharmacy staff could only order a new set of pictograms after enrollment of a certain number of patients into the study group.
The project was run under Ethical Commission Approval from Collegium, Medicum in Bydgoszcz, Poland (in polish: Komisja Bioetyczna Uniwersytetu Mikołaja Kopernika w Toruniu przy Collegium Medicum im. Ludwika Rydygiera w Bydgoszczy). The consent of the patient was written delivered via the electronic system, all was documented by Farenta.
Statistical Analysis
The normality of the analysed continuous variables was determined using Kolmogorov–Smirnov and Lilliefors tests. Data on age and duration of therapy were presented as mean and standard deviation as they were normally distributed. A Student’s t-test was used to compare two groups of normally distributed data. Qualitative data are described as ratios with percentages. Comparisons between groups were performed using the chi-square test with Yates correction, if appropriate, or the Fisher exact test when the hypothesis for the chi-square test was not fulfilled. Based on the differences between the percentage of advocates and critics, we calculated the Net Promoter Score for community pharmacies in both groups. Results of multiple logistic regression are expressed as an adjusted odds ratio (OR) and a 95% confidence interval (95% CI). Significance was set at p < 0.05. All statistical analyses were performed using STATISTICA 12.0 software (StatSoft PL, Cracow, Poland).
Results
In the case of the study group, where patients used pictograms, 114 interviews were conducted, while 97 interviews were finally analyzed. In the control group of patients, who were treated with typical pharmacy practice, we conducted 121 interviews. However, for analysis, we only registered 102 patients. Flow study for both the groups is presented in Figure 3. As mentioned in the methodology section, we constantly evaluated the quality of the obtained data. We detected some misleading information, e.g. some of the patients did not fulfill inclusion criteria (recommended dosage regime – 3 tablets per day); in one community pharmacy more interviews were performed than assigned pictograms; or as in the case of six patients, the second interview was performed more than once. In the first two situations, we decided to withdraw the data from our final analysis. When multiple interviews were conducted with the same patient, we contacted pharmacy staff to clarify the problem and then analyzed the appropriate data. During the study, the second interview was not successful in 21 patients. The detailed characteristics of the study protocol are presented in Table 1.
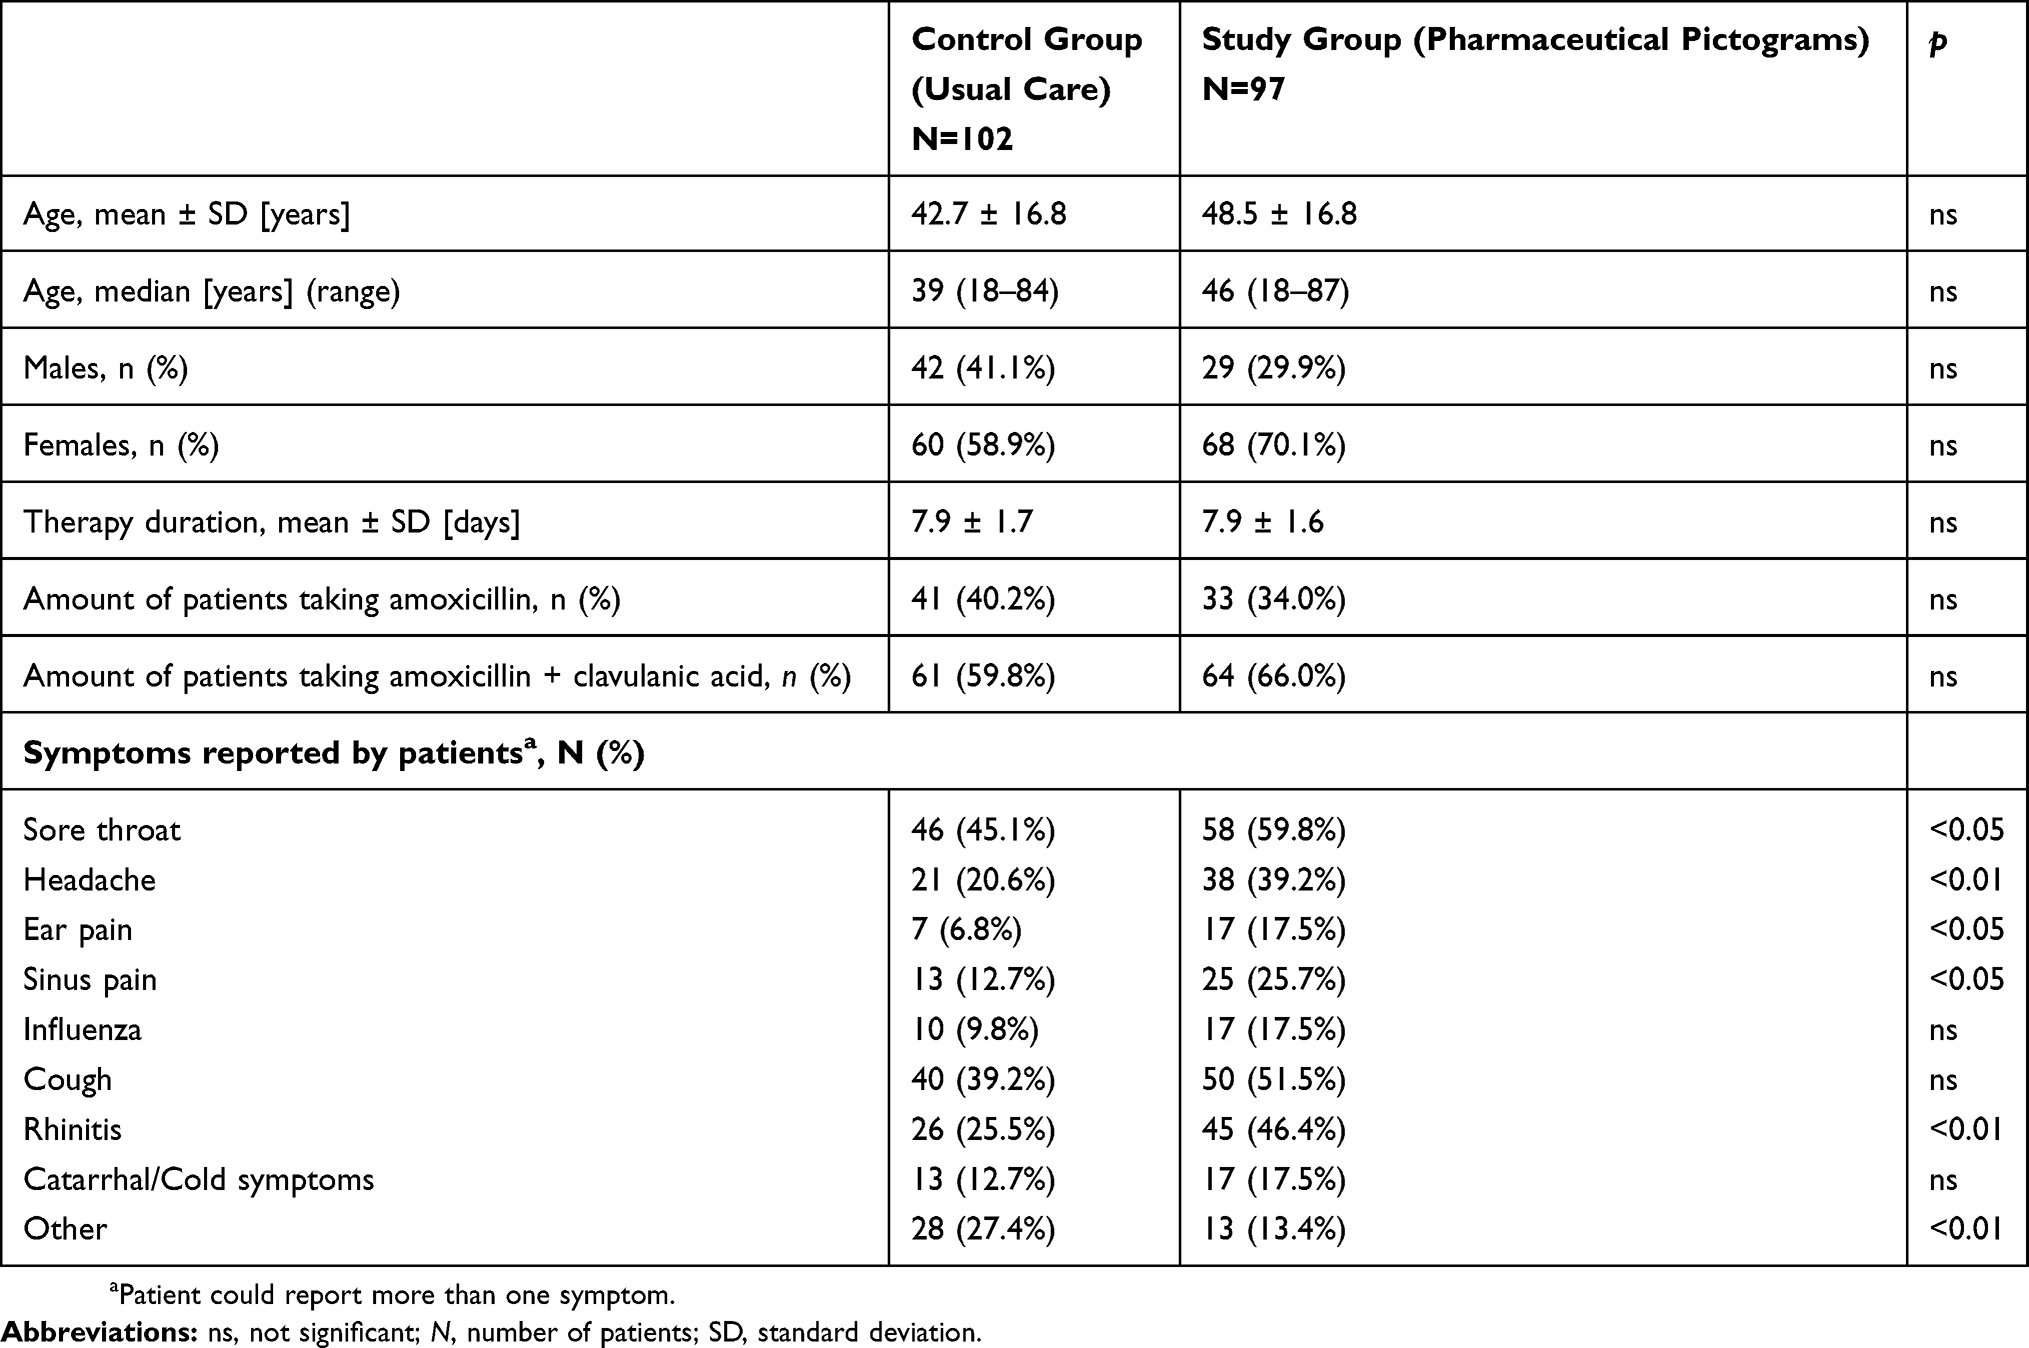 |
Table 1 Characteristics Of Study Population |
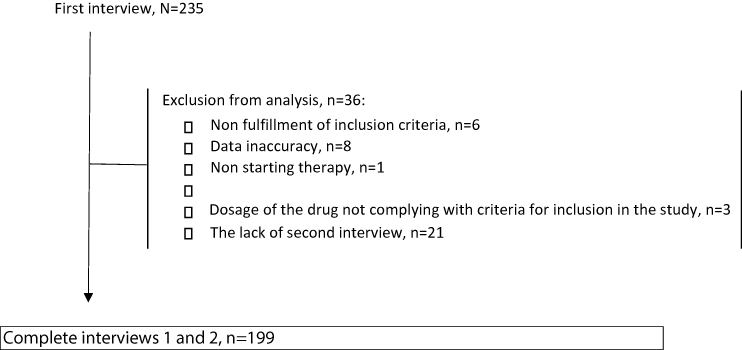 |
Figure 3 The study flow – summary. |
Characteristic Of Study Population
Data were collected from 199 patients with a mean age ± SD of 45.5 ± 17.0 years. 64.3% of the patients were women (n = 128). 37.2% of patients (n = 74) used antibiotics consisting only of amoxicillin and 62.8% (n = 125) of participants used products containing amoxicillin with clavulanic acid. On average, patients reported 2.43 symptoms which could indicate the necessity of using antibiotics. Results of the study show that patients in the control group most often complained of a sore throat (52.3%), cough (45.2%), rhinitis (35.7%) and headache (29.6%). Less commonly, patients described sinus pain (19.1%), other catarrhal/cold symptoms (15.1%), influenza (13.6%) and ear pain (12.1%). Other reasons for antibiotic use included surgical interventions, inflammation of internal organs, or fever. Table 1 shows the characteristics of the patient population in the control and study groups. Patients included into the study group more often than those from the control group had sore throat, headache, ear pain, sinus pain and rhinitis and less frequently had other symptoms, as shown in Table 1. The prevalence of other symptoms reported by patients did not differ between the two groups analyzed.
The Practical Utility Of Pictograms – Relief Of Symptoms
In the study group, 89 patients (91.7%) declared that the symptoms subsided, and 13.4% of participants discontinued therapy before using the whole package (n = 13). In the control group, 86 patients (84.3%) stated relief from their symptoms after antibiotic therapy.
The Practical Utility Of Pictograms – Use Of The Entire Package Of The Drug
85 patients (83.3%) completed the recommended course of treatment and used the entire package of the drug. Table 2 shows the detailed reasons for discontinuation of recommended therapy. Among patients who decided to discontinue the recommended pharmacotherapy, the majority of patients (46.6%) indicated that relief of their symptoms was the primary reason for discontinuation.
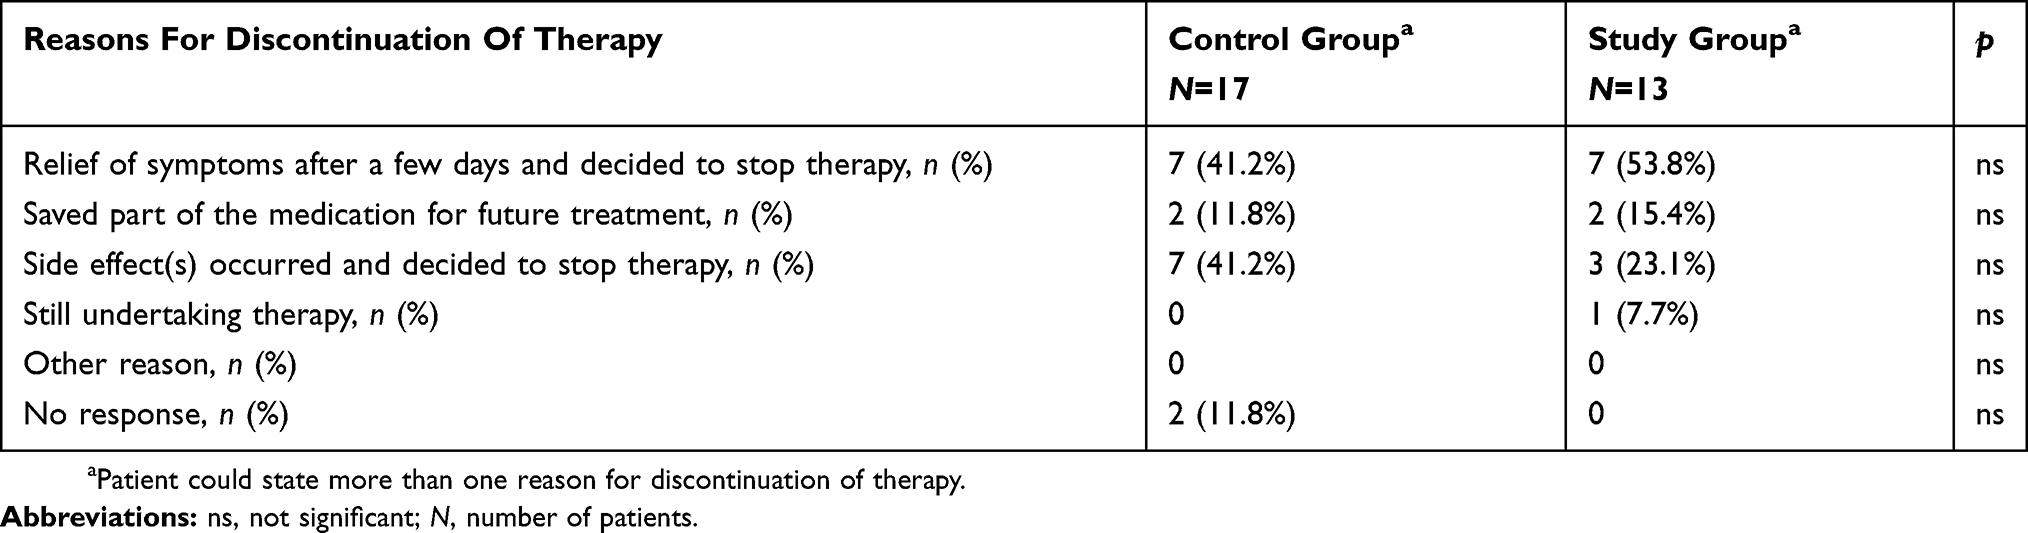 |
Table 2 The Reasons For Discontinuation Of Recommended Therapy – Detailed Summary |
The Practical Utility Of Pictograms – Taking The Medications Twice A Day
In the study group, 80.4% (n=78) of patients always took the medications twice a day (recommended regimen) and about one in five of participants (18.5%; n=18) reported that they usually took the drug as it was recommended. One individual in this group (1.0%) decided to only sometimes follow the medical recommendations. In the control group (standard care), 81.3% (n = 83) of patients reported that they always took the medication twice a day as recommended by their healthcare providers. However, 16.6% of patients (n = 17) indicated that they usually took the medication twice a day and two (1.9%) participants specified that they only occasionally used the drug twice a day.
The Practical Utility Of Pictograms – Patients’ Perspective On Medical Information
In the study group (using pictograms), 76.6% of patients particularly supported standard care (advocates), whereas in the control group (standard care) the same perspective was represented by 61.6% of participants.
Figure 4 shows the percentage of patients who were advocates, the patients who indicated a neutral perspective, and the number of critics in each of the groups.
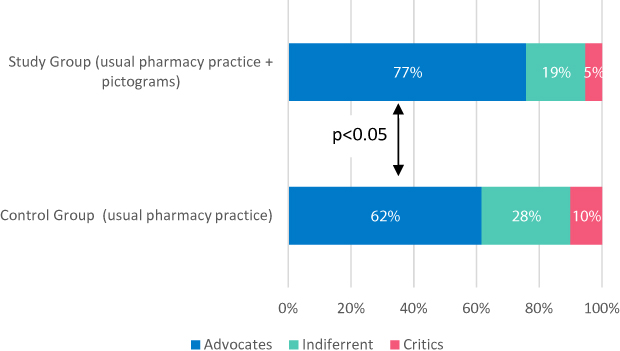 |
Figure 4 The advocates, neutral perspective patients and the critics in each group – summary. |
It should be noted that the net promotor score was higher for pharmacy practice with pictograms when compared to standard care, respectively, 71.3% versus 51.5%. Regression analysis showed that the percentage of patients completing the full course of antibiotic and also taking the drug twice a day, as recommended, was similar in both groups.
The chance that a patient was an advocate of pharmaceutical services (scores 9 and 10) was twice as likely in the case of pharmaceutical practice supported by pictograms as shown in Table 3. However, we did not find any statistical significance between the study and control groups in the context of symptom relief, completion of antibiotic therapy as recommended by the healthcare professionals, and taking the recommended dose twice a day. The results of logistic regression analysis are presented in Figure 5. Table 4 outlines the endpoint analysis, which revealed that the composite endpoint was achieved more frequently in the population using pictograms, however this difference was not statistically significant.
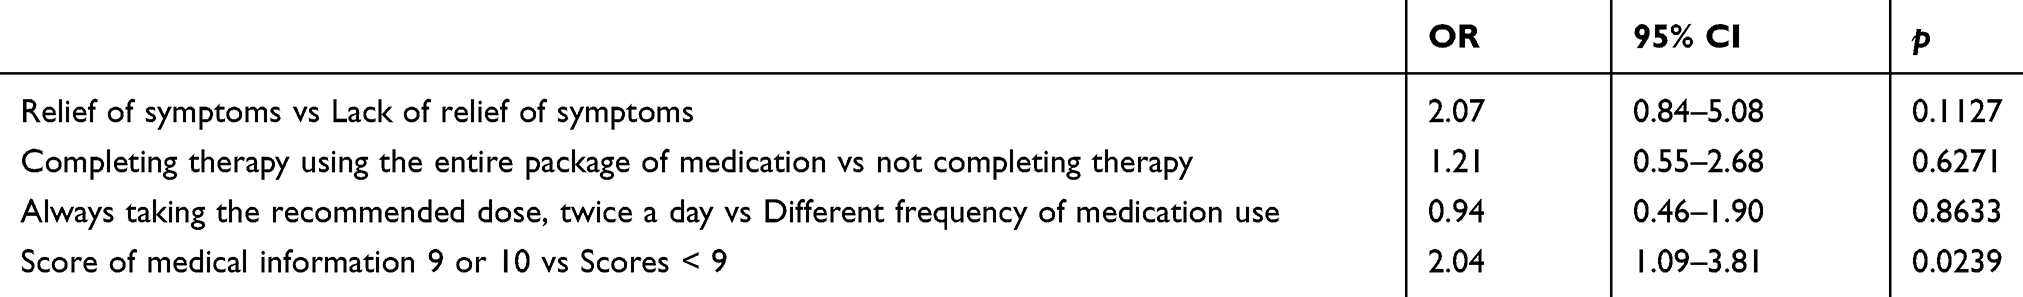 |
Table 3 Logistic Regression – Analysis And Summary |
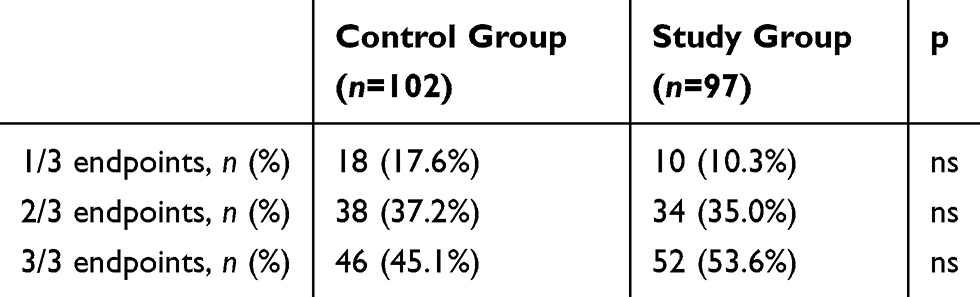 |
Table 4 Number Of Endpoints Achieved By Patients |
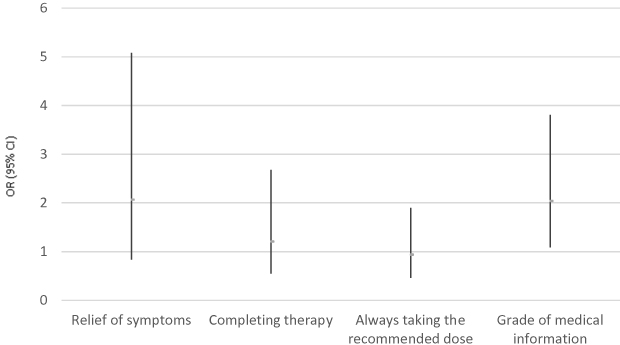 |
Figure 5 Odds ratio (OR) and 95% confident intervals (95% CI) for endpoints in the study group. |
Discussion
As mentioned before, adherence to antibiotic therapy remains a relevant clinical problem. Implementation of pictograms in routine settings should be strongly considered as a useful tool in the process of optimizing pharmacotherapy and achieving more satisfactory outcomes. We believe that promoting this kind of medical information is an important step to introducing pharmaceutical care in Poland. In our study, we found that pharmaceutical pictograms are highly accepted by Polish patients and that pictograms have a positive impact on the patient’s perspective of services available in community pharmacies. In the group where pictograms were used, the difference between the percentage of advocates and critics was almost 20% higher compared to the group treated with standard care. Moreover, the patients who had received pictograms less frequently decided to discontinue their treatment before the time recommended by healthcare providers. Finally, the composite endpoint was more frequently achieved in the study population, although the difference was not statistically significant.
The prerequisite to introducing pictograms into routine practice remains validation as a process of evaluating the readability and understanding of pictograms. Van Beusekom et al proved that low-literate populations would benefit most from the use of pictograms, but only if pictograms are properly prepared and validated.16 It should be noted that our pictograms were validated in line with rigorous methodology, among others, that is described by Vaillancourt et al17. Previous studies have proved that pictograms are well-understood by patients, even if patients have some personal preferences, for instance, insisting on the use of graphics with explanatory texts to achieve greater readability and avoiding possible misunderstanding. Consequently, this approach improves the safety profile of pictograms.18–20 Our study revealed that pictograms are greatly accepted by patients and that the medical information contained in pictograms is better understood by the patient, and thus, a preferable form of presentation. These results are consistent with previous observations.21 Nevertheless, we did not find a statistical correlation between the use of pictograms and adherence to recommendations, for instance in the context of following the prescribed drug regimen. The same conclusion was found in a Finnish study in which Hämeen-Anttila et al suggested that a patient’s well-understanding of pictograms does not correspond with a greater understanding of information in drug leaflets.22 Still, pictograms are valuable resource in routine practice, and their use should be supplemented with an oral explanation, as proved in regards to HIV-positive patients.23 Based on this study and so-far knowledge in the field, new studies should be conducted among low-literate patients, also in well-developed countries e.g. Poland. Beyond reasonable doubts, we can expect that low-literate patients are those for whom pharmaceutical pictograms are the most helpful in a relatively complex process of understanding drug-related information.
A number of strengths and limitations warrant mention. Firstly, we understand that we enrolled a limited number of patients, and we would like to emphasize that in the case of research performed in Poland, it is particularly difficult to recruit participants in trials conducted in the community pharmacy setting. This is mainly due to the fact that pharmaceutical care and the clinical role of pharmacists are still in the initial stages and pharmacy practice mainly focuses on dispensing medications. We noticed that the difference between the study and control groups did not reach statistical significance in the context of many clinically relevant factors, however, keeping in mind the limited number of patients enrolled in this study, the results should not be determined as final before wider implementation of pictograms into routine settings is done. Moreover, different limitations should be briefly highlighted. Firstly, the authorial questionnaires were only validated in terms of face and content validity. Although the choice of outcomes was based on extensive literature review and discussed with highly experienced scientists and practitioners, we cannot underestimate the subjectivity in this selection. Thirdly, there may exist psychological bias in patients’ responses due to the fact that interviewers were pharmacists, with whom patients may not be willing to share all beliefs and opinions. Despite the fact that our study is an example of a cluster randomized study, participation bias should be also taken into consideration. Further studies are warranted.
To the best of our knowledge, our study is the first scientific attempt to apply a study protocol mainly used in clinical studies (control and study groups, randomization) into research conducted in the routine community pharmacy setting in Poland. The randomization of particular community pharmacies to one of the study groups could be understood as a potential limitation. Patient randomization was not possible in this case, due to some external barriers, predominantly associated with the logistics and a lack of an appropriate number of staff. Moreover, the duration of the study was relatively short, although it is of vital importance to remember that we evaluated only patients who used antibiotics for acute illness, where in accordance with current guidelines the exposure to antibiotics should be relatively short and intense. Last but not least, the group was too small to show the significant differences in adverse outcomes between both groups using pictograms and standard care.
Conclusions
In our study, we demonstrated that pharmaceutical pictograms are readily accepted by patients and could prove to be a valuable support for pharmacists in conducting pharmaceutical care. However, further representative research is needed to evaluate the true effectiveness of this solution. We believe that pictograms can change the image of the pharmacy profession not only in Poland but also in those countries where pharmaceutical care is still in the initial stages.
Sources of funding
The pictogram validation study was sponsored by the Warsaw based Piktorex sp. z o.o. that has received financial support from LQT Fund S.A. in Gdańsk, and from The National Centre of Research and Development in Warsaw, on the basis of the Contract on Support within the Systemic Project “Bridge Alfa”, concluded on 3 December 2015. This financial support is non-refundable public aid within the meaning of section § 30 Paragraph 3 in relation to section § 31 of the Regulation of the Minister of Science and Higher Education 25 February 2015 regarding conditions for granting public aid, and de minimis aid by The National Centre of Research and Development (reference number of the aid programme SA. 35857 (2012/X)), exempt from notification obligation, provided for in Art. 108 of the Treaty on the functioning of the European Union, pursuant to Art. 21 of the Commission Regulation (EU) No 651/2014 17 June 2014 declaring certain categories of aid compatible with the internal market in application of Articles 107 and 108 of the Treaty. All pictograms developed in the project are owned and registered in the Polish Patent Office.
Author Contributions
All authors contributed towards data analysis, drafting and critically revising the paper, gave final approval of the version to be published, and agreed to be accountable for all aspects of the work.
Disclosure
It must be emphasized that this publication was created by Piktorex sp. z o.o. with financial support from LQT Fund S.A. in Gdańsk, and from The National Centre of Research and Development in Warsaw, on the basis of the Contract on Support within the Systemic Project “Bridge Alfa” from European Union (EU), concluded on 3 December 2015. PM is a an adjunct professor at the Faculty of Medicine, Collegium Medicum, Cardinal Stefan Wyszyński University, Warsaw, Poland and is a current employee of Piktorex sp. z o.o (August 2019). DŚ has received a honorarium from Piktorex sp. z o.o. MB and ED were employees of Farenta sp. z o.o at the time of the study. The authors report no other conflicts of interest in this work.
References
1. Swieczkowski D, Mogielnicki M, Cwalina N, et al. Medication adherence in patients after percutaneous coronary intervention due to acute myocardial infarction: from research to clinical implications. Cardiol J. 2016;23:483–490. doi:10.5603/CJ.a2016.0048
2. Feinstein M, Escandón-Vargas K, Reyes S, Hernández-Gómez C, Pallares CJ, Villegas MV. Improved outcomes when antibiotic prescribing guidelines are followed by healthcare providers: a colombian example to encourage adherence in hospital settings. Infect Control Hosp Epidemiol. 2017;1–2. doi:10.1017/ice.2017.45
3. Høgli JU, Garcia BH, Skjold F, Skogen V, Småbrekke L. An audit and feedback intervention study increased adherence to antibiotic prescribing guidelines at a Norwegian hospital. BMC Infect Dis. 2016;16(1):96. doi:10.1186/s12879-016-1426-1
4. Axelsson M. Report on personality and adherence to antibiotic therapy: a population-based study. BMC Psychol. 2013;1(1):24. doi:10.1186/2050-7283-1-24
5. Eells SJ, Nguyen M, Jung J, Macias-Gil R, May L, Miller LG. Relationship between adherence to oral antibiotics and postdischarge clinical outcomes among patients hospitalized with staphylococcus aureus skin infections. Antimicrob Agents Chemother. 2016;60(5):2941–2948. doi:10.1128/AAC.02626-15
6. Llor C, Hernández S, Bayona C, et al. A study of adherence to antibiotic treatment in ambulatory respiratory infections. Int J Infect Dis. 2013;17(3):e168–e172. doi:10.1016/J.IJID.2012.09.012
7. Fernandes M, Leite A, Basto M, et al. Non-adherence to antibiotic therapy in patients visiting community pharmacies. Int J Clin Pharm. 2014;36(1):86–91. doi:10.1007/s11096-013-9850-4
8. Demoré B, Mangin L, Tebano G, Pulcini C, Thilly N. Public knowledge and behaviours concerning antibiotic use and resistance in France: a cross-sectional survey. Infection. 2017;45:513–520. doi:10.1007/s15010-017-1015-2
9. Mazińska B, Strużycka I, Hryniewicz W. Surveys of public knowledge and attitudes with regard to antibiotics in Poland: did the European Antibiotic Awareness Day campaigns change attitudes? Gupta V, ed. PLoS One. 2017;12(2):e0172146. doi:10.1371/journal.pone.0172146
10. Roque F, Herdeiro MT, Soares S, Teixeira Rodrigues A, Breitenfeld L, Figueiras A. Educational interventions to improve prescription and dispensing of antibiotics: a systematic review. BMC Public Health. 2014;14(1):1276. doi:10.1186/1471-2458-14-1276
11. Sabry NA, Farid SF, Dawoud DM. Antibiotic dispensing in Egyptian community pharmacies: an observational study. Res Soc Adm Pharm. 2014;10(1):168–184. doi:10.1016/j.sapharm.2013.03.004
12. Barros IMC, Alcântara TS, Mesquita AR, Santos ACO, Paixão FP, Lyra DP. The use of pictograms in the health care: a literature review. Res Soc Adm Pharm. 2014;10(5):704–719. doi:10.1016/j.sapharm.2013.11.002
13. Montagne M. Pharmaceutical pictograms: a model for development and testing for comprehension and utility. Res Soc Adm Pharm. 2013;9(5):609–620. doi:10.1016/j.sapharm.2013.04.003
14. Merks P, Świeczkowski D, Balcerzak M, et al. The evaluation of pharmaceutical pictograms among elderly patients in community pharmacy settings – a multicenter pilot study. Patient Prefer Adherence. 2018;12:257–266. doi:10.2147/PPA.S150113
15. Net Promoter Score | Medallia. Available from: https://www.medallia.com/net-promoter-score/.
16. van Beusekom MM, Land-Zandstra AM, Bos MJW, van Den Broek JM, Guchelaar H-J. Pharmaceutical pictograms for low-literate patients: understanding, risk of false confidence, and evidence-based design strategies. Patient Educ Couns. 2017;100(5):966–973. doi:10.1016/j.pec.2016.12.015
17. Vaillancourt R, Truong Y, Karmali S, et al. Instructions for masking the taste of medication for children. Can Pharm J/Rev Des Pharm Du Canada. 2017;150(1):52–59. doi:10.1177/1715163516669383
18. Berthenet M, Vaillancourt R, Pouliot A. Evaluation, modification, and validation of pictograms depicting medication instructions in the elderly. J Health Commun. 2016;21 Suppl 1:27–33. doi:10.1080/10810730.2015.1133737
19. Korenevsky A, Vaillancourt R, Pouliot A, et al. How many words does a picture really tell? Cross-sectional descriptive study of pictogram evaluation by youth. Can J Hosp Pharm. 2013;66(4):219–226. doi:10.4212/cjhp.v66i4.1269
20. Ng AWY, Chan AHS, Ho VWS. Comprehension by older people of medication information with or without supplementary pharmaceutical pictograms. Appl Ergon. 2017;58:167–175. doi:10.1016/j.apergo.2016.06.005
21. Monteiro SP, Huiskes R, Van Dijk L, Van Weert JCM, De Gier JJ. How effective are pictograms in communicating risk about driving-impairing medicines? Traffic Inj Prev. 2013;14(3):299–308. doi:10.1080/15389588.2012.710766
22. Hämeen-Anttila K, Kemppainen K, Enlund H, Bush Patricia J, Marja A. Do pictograms improve children’s understanding of medicine leaflet information? Patient Educ Couns. 2004;55(3):371–378. doi:10.1016/j.pec.2003.04.006
23. Wilby K, Marra CA, Da Silva JH, Grubisic M, Harvard S, Lynd LD. Randomized controlled trial evaluating pictogram augmentation of HIV medication information. Ann Pharmacother. 2011;45(11):1378–1383. doi:10.1345/aph.1Q091
 © 2019 The Author(s). This work is published and licensed by Dove Medical Press Limited. The full terms of this license are available at https://www.dovepress.com/terms.php and incorporate the Creative Commons Attribution - Non Commercial (unported, v3.0) License.
By accessing the work you hereby accept the Terms. Non-commercial uses of the work are permitted without any further permission from Dove Medical Press Limited, provided the work is properly attributed. For permission for commercial use of this work, please see paragraphs 4.2 and 5 of our Terms.
© 2019 The Author(s). This work is published and licensed by Dove Medical Press Limited. The full terms of this license are available at https://www.dovepress.com/terms.php and incorporate the Creative Commons Attribution - Non Commercial (unported, v3.0) License.
By accessing the work you hereby accept the Terms. Non-commercial uses of the work are permitted without any further permission from Dove Medical Press Limited, provided the work is properly attributed. For permission for commercial use of this work, please see paragraphs 4.2 and 5 of our Terms.