")
Back to Journals » Cancer Management and Research » Volume 13
Pathologic-Based Nomograms for Predicting Overall Survival and Disease-Free Survival Among Patients with Locally Advanced Rectal Cancer
Authors Liu S , He F, Guan Y, Ju HQ, Ma Y, Li ZH , Fan XJ , Wan XB , Zheng J, Pang XL, Ma TH
Received 14 December 2020
Accepted for publication 4 February 2021
Published 22 February 2021 Volume 2021:13 Pages 1777—1789
DOI https://doi.org/10.2147/CMAR.S296593
Checked for plagiarism Yes
Review by Single anonymous peer review
Peer reviewer comments 2
Editor who approved publication: Dr Chien-Feng Li
Shuai Liu,1,* Fang He,1,* Ying Guan,2,* Huai-Qiang Ju,3,* Yan Ma,1 Zhen-Hui Li,4 Xin-Juan Fan,5 Xiang-Bo Wan,1 Jian Zheng,1 Xiao-Lin Pang,1 Teng-Hui Ma6
1Department of Radiation Oncology, The Sixth Affiliated Hospital of Sun Yat-Sen University, Guangdong Provincial Key Laboratory of Colorectal and Pelvic Floor Diseases, Guangzhou, 510655, People’s Republic of China; 2Department of Radiation Oncology, Affiliated Tumor Hospital of Guangxi Medical University, Cancer Institute of Guangxi Zhuang Autonomous Region, Nanning, 530000, People’s Republic of China; 3Collaborative Innovation Center for Cancer Medicine, State Key Laboratory of Oncology in South China, Sun Yat-Sen University Cancer Center, Guangzhou, 510030, People’s Republic of China; 4Department of Radiology, The Third Affiliated Hospital of Kunming Medical University, Yunnan Cancer Hospital, Yunnan Cancer Center, Kunming, 650118, People’s Republic of China; 5Department of Pathology, The Sixth Affiliated Hospital of Sun Yat-Sen University, Guangdong Provincial Key Laboratory of Colorectal and Pelvic Floor Diseases, Guangzhou, 510655, People’s Republic of China; 6Department of Colorectal Surgery, The Sixth Affiliated Hospital of Sun Yat-Sen University, Guangdong Provincial Key Laboratory of Colorectal and Pelvic Floor Diseases, Guangdong Institute of Gastroenterology, Guangzhou, 510655, People’s Republic of China
*These authors contributed equally to this work
Correspondence: Xiao-Lin Pang
Department of Radiation Oncology, The Sixth Affiliated Hospital of Sun Yat-Sen University, Guangdong Provincial Key Laboratory of Colorectal and Pelvic Floor Diseases, Guangzhou, 510655, People’s Republic of China
Tel/Fax + 86-02087343373
Email [email protected]
Teng-Hui Ma
Department of Colorectal Surgery, The Sixth Affiliated Hospital of Sun Yat-Sen University, Guangdong Provincial Key Laboratory of Colorectal and Pelvic Floor Diseases, Guangdong Institute of Gastroenterology, Guangzhou, 510655, People’s Republic of China
Email [email protected]
Purpose: Preoperative neoadjuvant therapy is standard before surgery for locally advanced rectal cancer in current clinical treatment. However, patients with the same clinical TNM stage before treatment vary in clinical outcomes. More and more studies noted that pathological findings after preoperative neoadjuvant therapy are better prognostic factors to determine prognosis than clinical TNM stage in patients with locally advanced rectal cancer. The purpose of this study is to develop and validate models based on pathological findings to predict overall survival (OS) and disease-free survival (DFS).
Patients and Methods: A total of 3026 patients from two hospitals were included. The endpoint was OS and DFS. Significant predictors of OS on multivariate analysis were used to establish the nomogram.
Results: The Harrell’s C index for OS prediction was 0.72 (95% confidence interval [CI], 0.68 to 0.77) in the training cohort, 0.66 (95% CI, 0.60 to 0.72) and 0.68 (95% CI, 0.64 to 0.73) in the internal and external validation cohorts. Using this nomogram, high- and low-risk groups for OS were defined in the training cohort. The 3-year OS was 78.1% (95% CI: 72.4– 84.2%) for the high-risk group and 95% (95% CI: 93.6– 96.5%) in the low-risk group (HR: 4.42, 95% CI: 3.22– 6.05; P< 0.001). This finding was also applied in the two external cohorts. Similarly, a nomogram that contained the same indices was developed and validated to predict for DFS.
Conclusion: Nomograms based on pathological findings are a reliable tool to predict 3-year OS and DFS rate in patients with locally advanced rectal cancer.
Keywords: locally advanced rectal cancer, nomogram, pathological findings, overall survival, disease-free survival
Introduction
Colorectal cancer is the third common tumor in the world. The incidence and mortality patterns of colorectal cancers are generally similar in men and women.1 Rectal cancers account for 39% of the colorectal cancers. There are about 376,300 new cases each year in China.2 More than 70% are locally advanced rectal cancers.3 For this group of patients, preoperative neoadjuvant therapy followed by total mesorectal excision (TME) is the standard treatment.
Initially, the existing clinical staging system determined the application of preoperative therapy and the prediction of prognosis. However, patients with the same TNM stage before treatment vary in clinical outcomes. Preoperative treatments reduce the tumour burden and obtain a certain tumor downstaging. Good pathological results after neoadjuvant radiotherapy and chemotherapy are often associated with improved survival in patients with rectal cancer. In the era of neoadjuvant therapy, accumulated studies demonstrate that treatment response is one of the most important factors for predicting final outcome.4,5 Therefore, a model developed by factors after treatment can be useful to select patients with poor prognosis, who may benefit from intensive follow-up and obtain an improvement in overall survival (OS) and disease-free survival (DFS).
In 2011, nomograms were developed and validated on the basis of five major European randomized clinical trials to predict local recurrence, distant metastases, and survival for European patients with rectal cancer. These nomograms were based on pre-treatment factors such as clinical tumor stage, treatment factors and pTNM stage. From current point of view, the clinical tumor stage and treatment courses are suboptimal. Also, it is not clear whether these models can apply in Chinese patients. In 2015, Shen et al developed a nomogram in a single cohort among 277 Chinese patients with locally advanced rectal cancer.6 In 2019, Li et al developed and validated a nomogram among a multi-center cohort of Chinese patients.7 These two studies also included pre-treatment factors and both had a major limitation on the sample size. Compared to the number of influencing factors included, the sample size was relatively small.
In this study, our main objective was to develop and validate nomograms based on pathological findings that would predict OS and DFS rate for patients who had received preoperative treatment and undergone standard TME.
Patients and Methods
Study Cohort
The study followed the Declaration of Helsinki, and the ethical application was approved by the local ethics committee of the sixth affiliated hospital, Sun Yat-sen University, Guangzhou, People’s Republic of China. Because of the nature of the retrospective study, the Ethics Committee exempted the need for informed consent. All patient records were anonymized before analysis. Finally, 3026 patients with histologically confirmed adenocarcinoma of the rectum formed the study cohort in the analysis from two academic institutions in China. Two thousand and forty patients recruited from the sixth affiliated hospital, Sun Yat-sen University (SYSU6th), of whom 1427 patients (SYSU6th-A) comprised the training cohort for model development and 613 constituted the internal validation cohort (SYSU6th-B); 986 patients from the Sun Yat-Sen University Cancer Center (SYSUCC) formed the external validation cohort. All patients received surgery between 2008 and 2018.
Patients who met the following criteria were included in the study: Patients diagnosed rectal adenocarcinoma (mucinous adenocarcinoma was excluded) according to the confirmation of histopathologic results before treatment; patients with locally advanced rectal cancer (stage II–III according to pelvic MRI); no distant metastasis was found by computed tomography of the abdomen and chest, or [18F]fluorodeoxyglucose positron emission tomography-computed tomography scan at the time of diagnosis; the location of the tumor was within 15 cm of the anal margin; all patients underwent radical surgical excision. Patients with unstable cardiac disease or synchronous malignancies were excluded.
All patients included were staged according to the 8th edition of the International Union against Cancer/American Joint Committee on Cancer (UICC/AJCC) Staging System. Factors related to postoperative situation including age, sex, tumor location, yp T stage, yp N stage, TRG status, tumor differentiation, surgical methods, surgical margin, CRM, LVI, PNI, and adjuvant chemotherapy were collected for analysis.
Treatment Protocol Before Surgery
All patients received neoadjuvant therapy before surgery including combined radio-chemotherapy and radiotherapy or chemotherapy alone. Chemotherapy treatments consist of fluoropyrimidine or capecitabine-based regimens. Chemotherapy combined with radiotherapy were delivered before, concurrently with or after long-course radiotherapy (45–50 Gy in 25–28 fractions) as induction, concurrent or consolidate chemotherapy. Induction or consolidate chemotherapy were administered before or after short-course radiotherapy (25 Gy in 5 fractions).
Statistical Analysis
Our primary endpoint was overall survival. Secondary endpoint was disease-free survival. Overall survival was calculated as the time from the first day of any treatment to death from any cause. Disease-free survival was calculated from the day of surgery to the first recurrence or metastasis at any site, death due to disease or treatment. Patients who were alive at the last follow-up were regarded as censored data.
SPSS version 23.0 for Windows (IBM Corporation, Armonk, NY, USA) was used for statistical analysis to identify independent factors. Kaplan–Meier method was used to calculate overall survival and disease-free survival. Log-rank test was used to compare. We did a univariate Cox regression analysis to test the association between the covariates and OS/DFS in the training cohort. Independent significance factors were tested in a multivariate Cox regression analysis using forward: LR selection.
Nomograms were developed based on the significant factors of multivariate analysis and conducted with R software (version 3.6.1; http://www.R-project.org). P<0.05 was considered statistically significant and statistical significance levels reported in this manuscript were all two-sided. The performance of a nomogram was measured based on its discrimination, calibration and clinical use. Discrimination was measured by Harrell’s C index and calibration was measured by calibration curve. Calibration curves were evaluated by plotting the observed rates against the nomogram predicted probabilities graphically. Clinical usefulness was evaluated by decision curve analysis.8
Results
Patient Demographics in Development Cohort and Validation Cohort
Clinical characteristics of patients used for statistics in the analysis are listed in Table 1. Median follow-up was 34 months (interquartile range [IQR]: 22–54) for patients in the SYSU6th-A cohort, 30 months (17–58) for those in the SYSU6th-B cohort, and 51 months (37–75) in the SYSUCC cohort. In the SYSU6th-A cohort, the 3-year OS rate was 92.0% (95% CI: 90.4–93.6%), the 3-year DFS rate was 76.2% (95% CI: 73.7–78.7%). In the SYSU6th-B cohort, the 3-year OS rate was 86.4% (95% CI: 83.1–89.7%), the 3-year DFS rate was 74.4% (95% CI: 70.1–78.7%). In the SYSUCC cohort, the 3-year OS rate was 91.0% (95% CI: 89.2–92.8%), the 3-year DFS rate was 83.8% (95% CI: 81.4–86.2%).
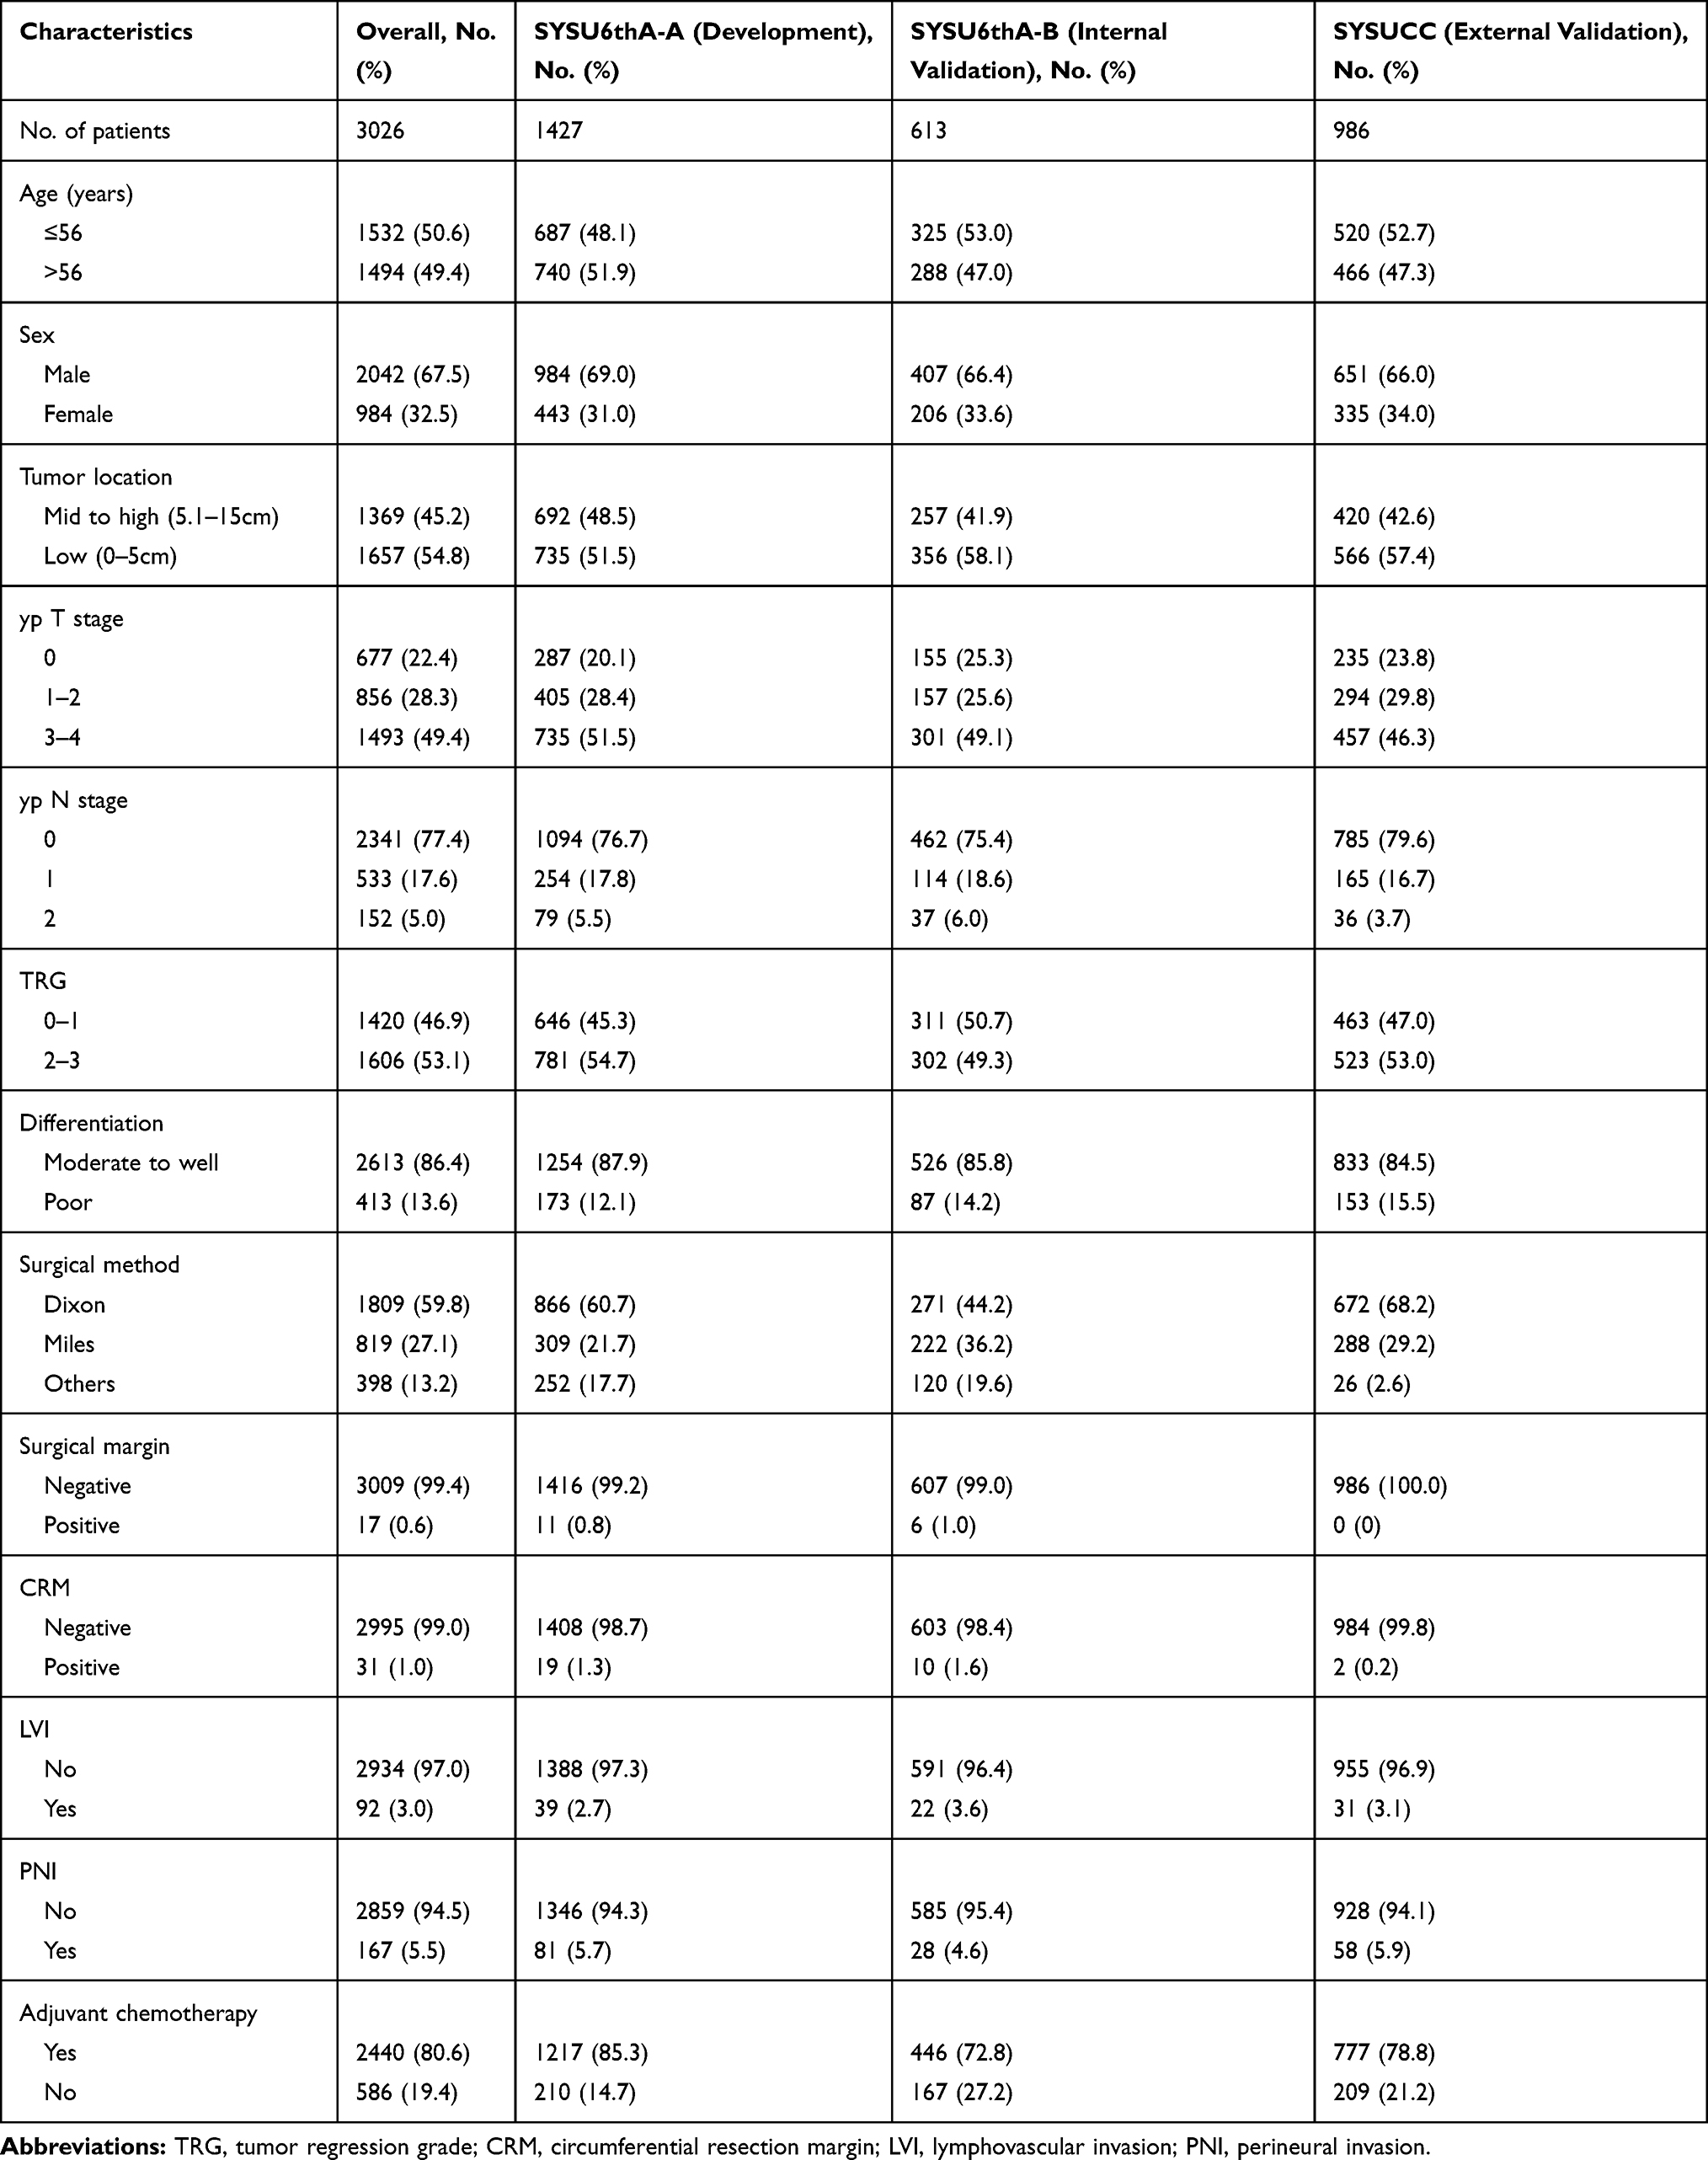 |
Table 1 Clinical Characteristics of Patients in the Development, Internal, and External Validation Cohorts |
Independent Prognostic Factors for OS in the SYSU6th-A Cohort
Firstly, the factors listed in Table 1 were tested for their association with OS in the SYSU6th-A cohort. Then, the covariates with P<0.2 in the univariate analysis were included in the multifactor analysis. At last, significant predictors of OS on multivariate analysis were advanced yp T stage (yp T stage 1–2 v 0; yp T stage 3–4 v 0), advanced yp N stage (yp N stage 1 v 0; yp N stage 2 v 0), lower tumor location (low v mid to high), poor differentiation (poor v moderate to well) and without adjuvant chemotherapy (Table 2).
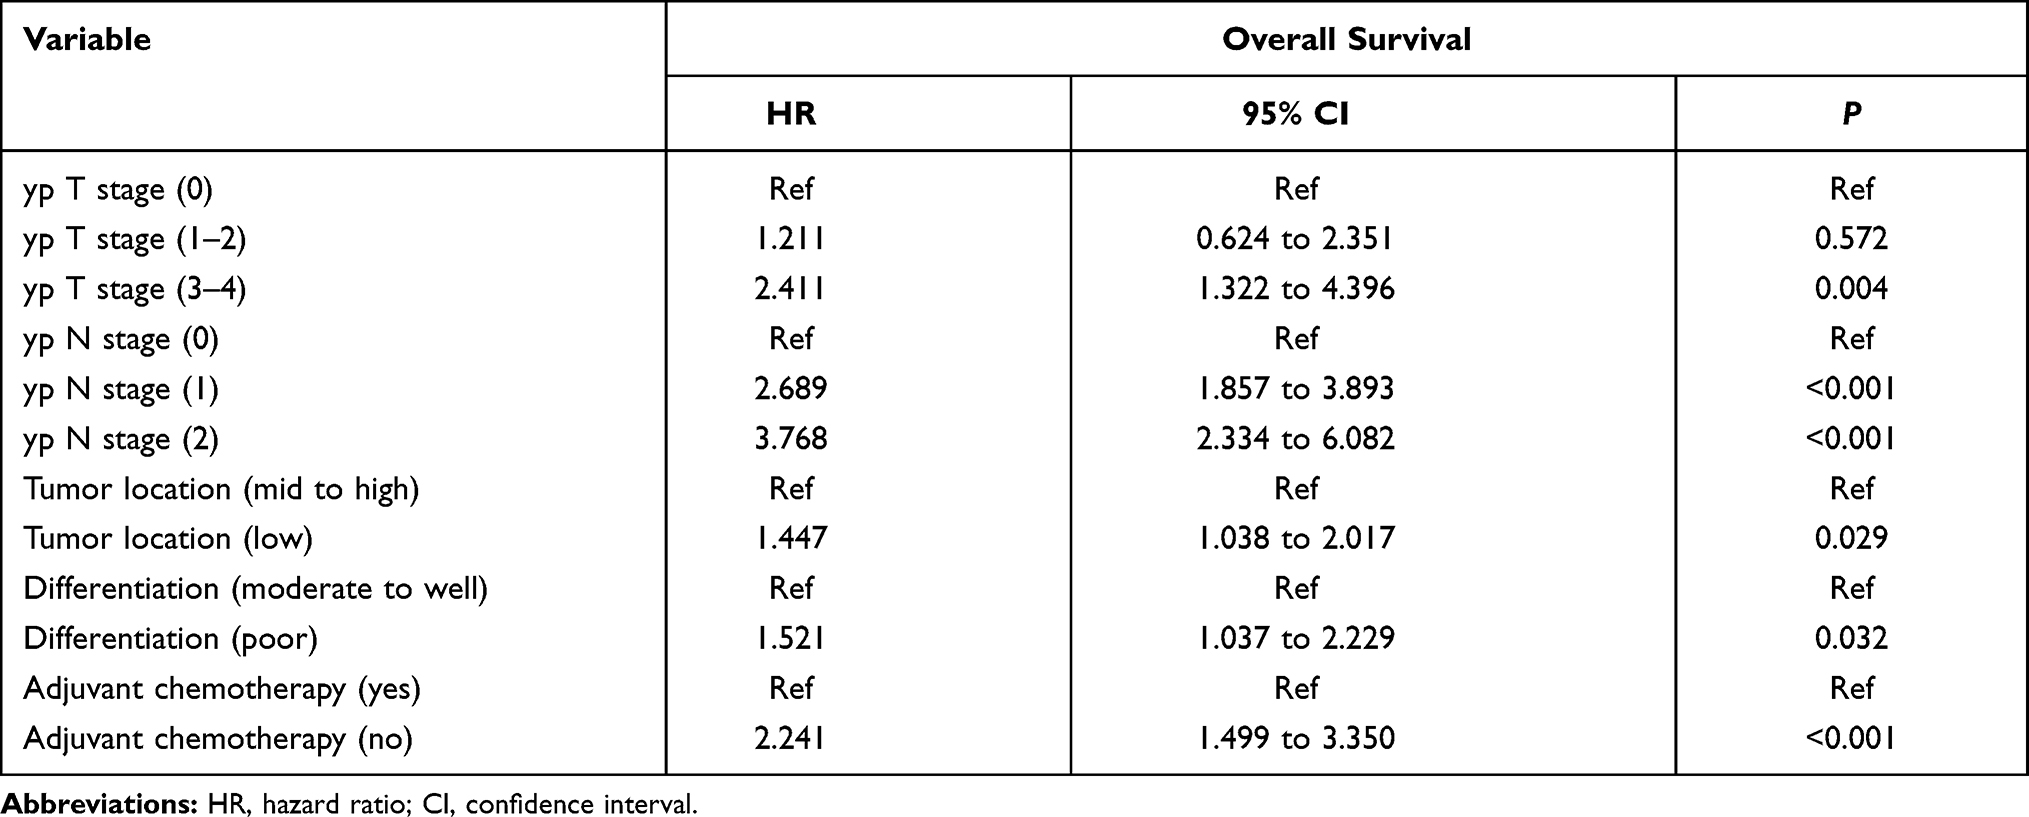 |
Table 2 Multivariate Analysis of the Development Cohort |
Prognostic Nomogram for OS in the SYSU6th-A Cohort
The prognostic nomogram comprised of five significant covariates for OS in the SYSU6th-A cohort is shown in Figure 1A. The Harrell’s C index for OS prediction was 0.72 (95% CI, 0.68 to 0.77). The calibration plot showed good agreement between actual observation and the probability of OS predicted by nomogram at 2 or 3 years (Figure 2A).
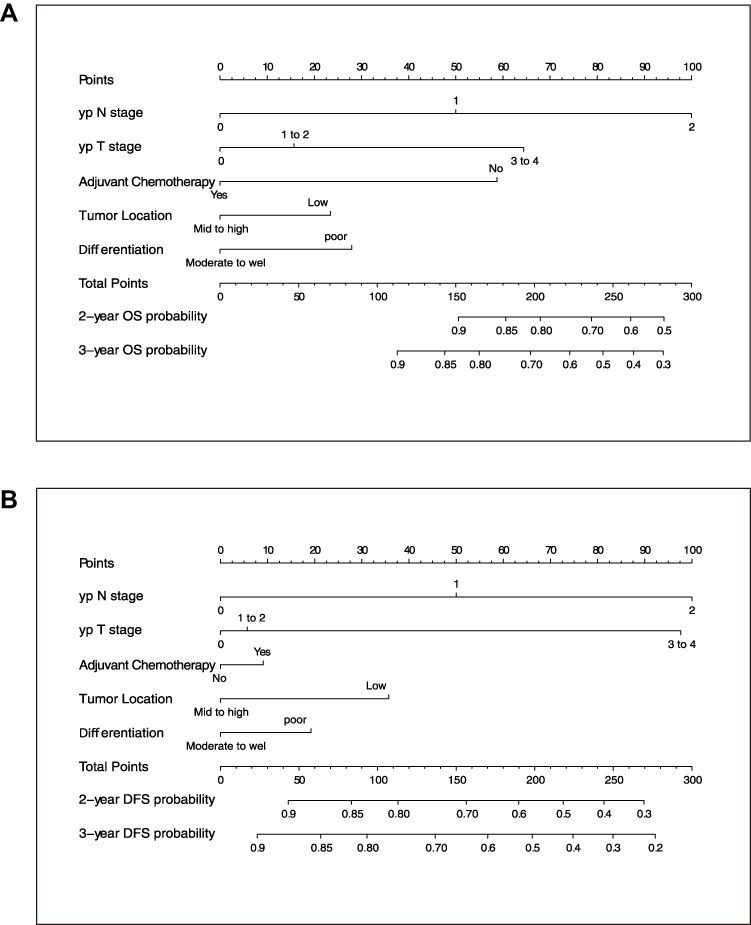 |
Figure 1 Developed nomograms for overall survival and disease-free survival. (A) Nomogram A to predict overall survival. (B) Nomogram B to predict disease-free survival. The two prognostic nomograms were both developed in the development cohort (SYSU6thA-A cohort) with the common five significant covariates. |
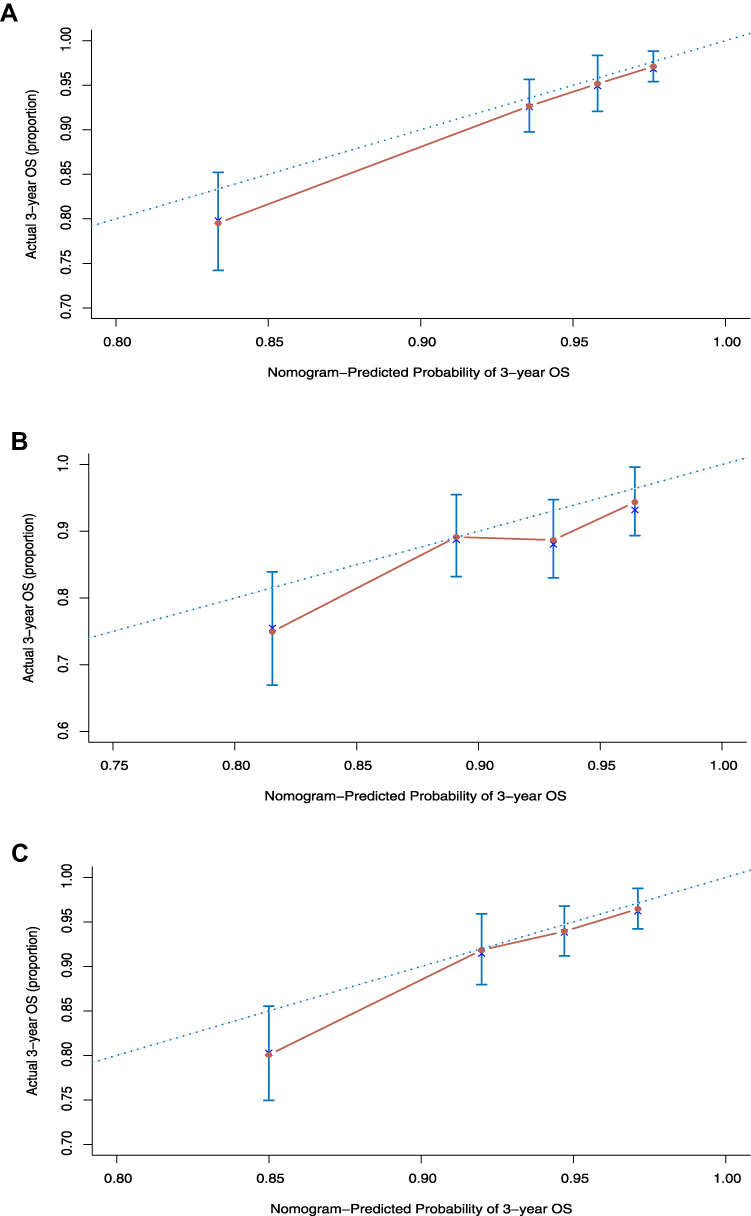 |
Figure 2 Calibration curves of nomograms to predict overall survival at 3 years in development and validation cohorts. (A) Calibration curve of the nomogram in the SYSU6thA-A development cohort. (B) Calibration curve of the nomogram in the SYSU6thA-B internal validation cohort. (C) Calibration curve of the nomogram in the external validation SYSUCC cohort. The actual 3-year overall survival is plotted on the y axis; the predicted probability by nomogram is plotted on the x axis. The dotted line represents a perfect prediction made by an ideal model. Smooth lines represent the performance of the nomogram, and dots represent corresponding observed rates with 95% CIs. |
Validation of the Nomogram for OS Prediction
We validated the predictive accuracy of the developed nomogram for OS in two validation cohorts: an internal cohort of 613 patients from SYSU6th-B and an external cohort of 986 patients from SYSUCC. The Harrell’s C index of the nomogram for predicting OS yielded 0.66 (95% CI, 0.60 to 0.72) and 0.68 (95% CI, 0.64 to 0.73) in the SYSU6th-B and SYSUCC cohorts, respectively. The calibration curves between prediction and observation for the two validation cohorts in predicting 3-year OS are shown in Figure 2B and C.
Clinical Use
The decision curve analysis for the nomogram is presented in Figure 3. The decision curve showed that it was better to use the nomogram to predict 3-year OS than either the treat-all-patients or the treat-none-patients scheme.
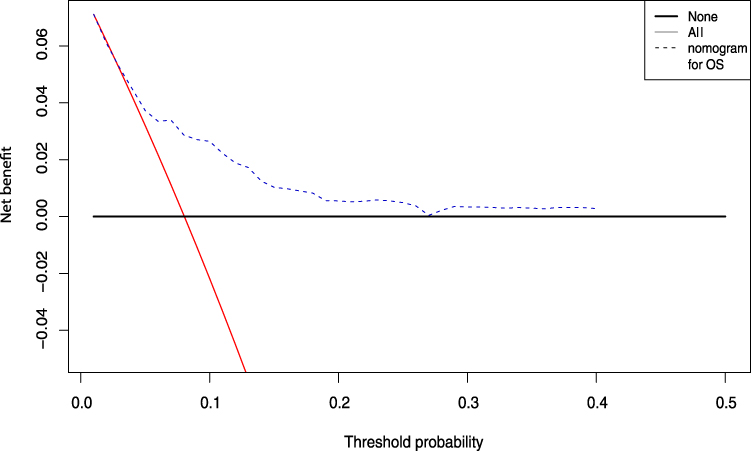 |
Figure 3 Decision curve analysis for the nomogram to predict overall survival. The y axis measures the net benefit. The net benefit is a result that the proportion of patients who are true positive subtracts the proportion of patients who are false positive, weighting by the relative harm of undetected tumor compared with the harm of unnecessary treatment. The blue dotted line represents the nomogram. The red line represents the assumption that all patients are treated. The black line represents the assumption that no patients are treated. |
Classification of High- and Low-Risk Subgroups for OS
By using this nomogram, we were able to clarify high- and low-risk groups for OS in the training cohort and two validation cohorts. The classification into the high-risk and low-risk subgroups was dependent on a cut-off according to clinical use (>115 and ≤115, respectively). This assigned 339 (23.8%) of 1427 patients to the high-risk group and 1088 (76.2%) to the low-risk group. The 3-year OS was 78.1% (95% CI: 72.4–84.2%) for the high-risk group and 95% (95% CI: 93.6–96.5%) in the low-risk group (HR: 4.42, 95% CI: 3.22–6.05; P<0.001; Figure 4A). Using the same cut-off score of 115, we were able to define validation cohorts into two subgroups, respectively. In the SYSU6th-B internal validation cohort, 176 (28.7%) of 613 patients were categorized into the high-risk group and 437 patients (71.3%) into the low-risk group, which showed significantly different on OS (HR: 2.58, 95% CI: 1.74–3.82; P<0.001; Figure 4B). Similarly, in the SYSUCC external validation cohort, 206 (20.9%) of 986 patients were classified into the high-risk group and 780 patients (79.1%) into the low-risk group. Patients with high-risk scores had shortened OS (HR: 3.64, 95% CI: 2.64–5.02; P<0.001; Figure 4C).
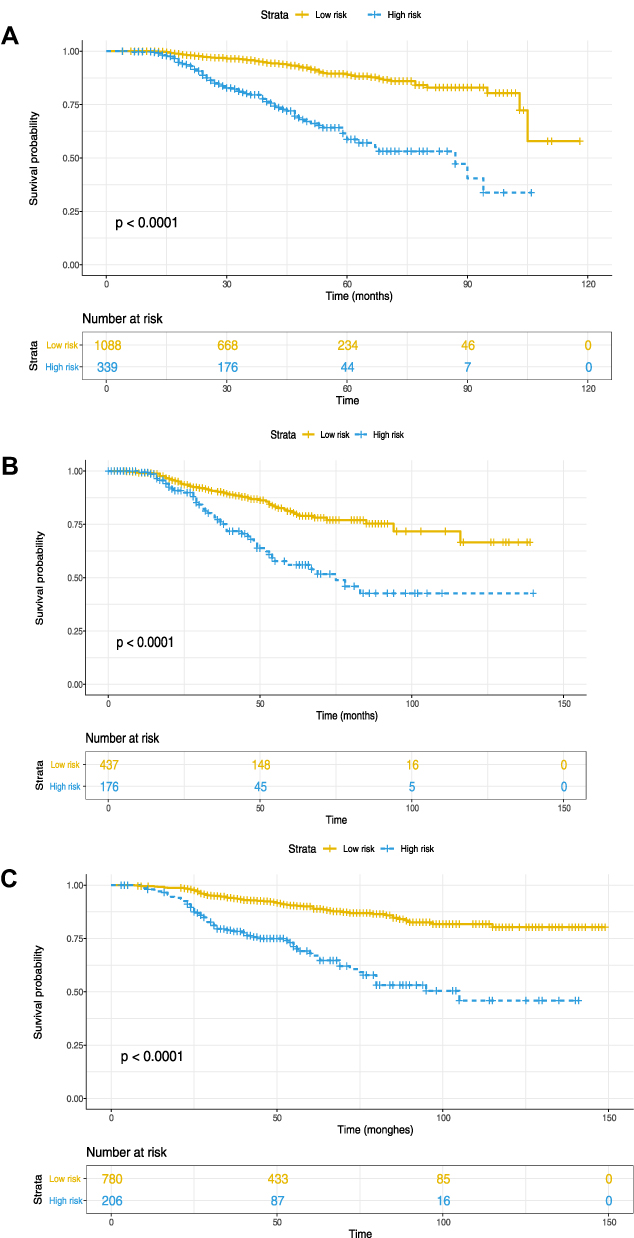 |
Figure 4 Clinical risk stratification based on nomogram for OS and the plot of overall survival of different risk subgroups. (A) OS in the low-risk and high-risk subgroups classified by a cut-off of ≤115 and>115, respectively, in the SYSU6thA-A development cohort; OS in the low-risk and high-risk subgroups classified by the same cut-off of 115 in (B) the SYSU6thA-B internal validation cohort and (C) the external validation SYSUCC cohort. |
Construction and Validation of a Nomogram for DFS
We hypothesized that a nomogram that consisted of the same five covariates would predict for DFS. With use of the five-factor nomogram (Figure 1B), the Harrell’s C index for DFS between the training and validation cohorts (C=0.71 v 0.72 [SYSU6th-B] and 0.68 [SYSUCC]) was comparable. The calibration plots were closely matched between the prediction by nomogram and actual observation for predicting DFS at 3 years in the training and two validation cohorts (Figure 5). By using the same cut-off score 65 (≤65 and>65, respectively), patients were categorized into the low-risk and high-risk subgroups. Patients with high-risk scores had shortened disease-free survival in the training cohort (Figure 6A), the SYSU6th-B internal validation cohort (Figure 6B), and in the SYSUCC external validation cohort (Figure 6C). These findings confirmed our hypothesis and demonstrated the utility of our nomogram for predicting outcomes and risks.
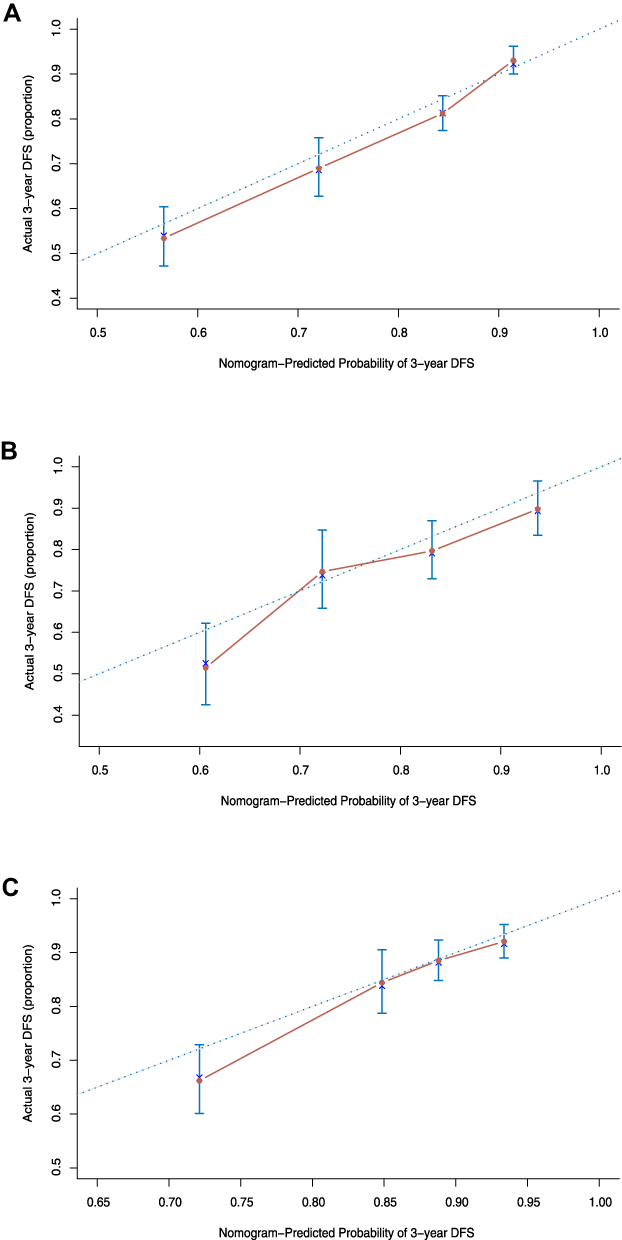 |
Figure 5 Calibration curves of the nomogram to predict disease-free survival at 3 years in development and validation cohorts. (A) Calibration curve of the nomogram in the SYSU6thA-A development cohort. (B) Calibration curve of the nomogram in the SYSU6thA-B internal validation cohort. (C) Calibration curve of the nomogram in the external validation SYSUCC cohort. The actual 3-year disease-free survival is plotted on the y axis; the predicted probability by nomogram is plotted on the x axis. The dotted line represents a perfect prediction made by an ideal model. Smooth lines represent the performance of the nomogram, and dots represent corresponding observed rates with 95% CIs. |
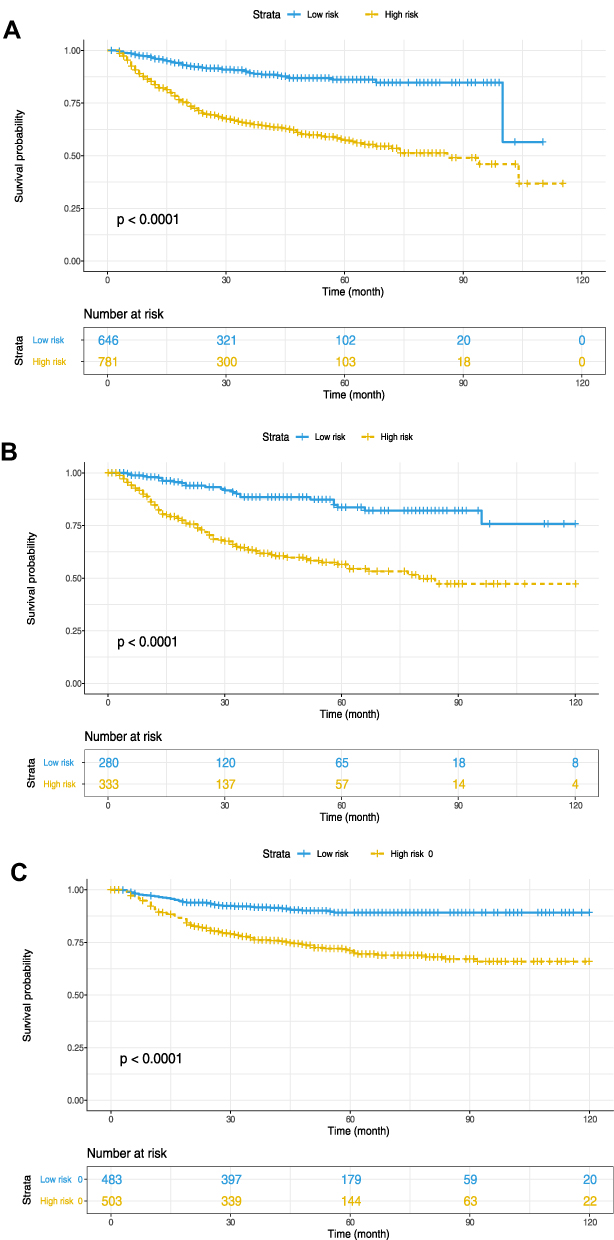 |
Figure 6 Clinical risk stratification based on nomogram for DFS and the plot of disease-free survival of different risk subgroups. (A) DFS in the low and high-risk subgroups classified by a cut-off of ≤65 and>65, respectively, in the SYSU6thA-A development cohort; DFS in the low and high-risk subgroups classified by the same cut-off of 65 in (B) the SYSU6thA-B internal validation cohort and (C) the external validation SYSUCC cohort. |
Discussion
In current multi-center, retrospective cohort study, we finally developed prognostic nomograms based on five clinical factors to predict the risk of DFS and OS in locally advanced rectal cancer. The results were validated in an internal validation cohort and an external validation cohort. By using these nomograms, we classified patients into high-risk and low-risk groups who had significantly different prognosis. Patients fall into the low-risk group would probably have favorable outcomes while patients with high risk may need intensive follow-up.
Many factors may influence the prognosis of patients with advanced rectal cancer, such as age,9–11 gender,12,13 body mass index,14 the initial clinical stage,15,16 tumor location,17,18 carcinoembryonic antigen levels,19,20 neoadjuvant radiotherapy or chemotherapy,21,22 the sequence of radiotherapy and chemotherapy,23,24 the interval between radiotherapy and surgery,25,26 surgical options,27,28 pathological outcomes,29,30 and adjuvant chemotherapy.31,32 In this study, all patients received neoadjuvant treatment regimens followed by TME. Nowadays, more studies found that survival in patients interrelated closely with post-therapy pathologic findings, regardless of pretherapy clinical stage. The final pathologic outcomes are the most reliable marker of overall survival in patients received neoadjuvant therapy.5,33 The prognostic factors in down-staged patients may need discussions to be improved. We agree with these studies, therefore, in addition to basic features such as age and sex, we mainly studied the pathological factors including tumor location, yp T stage, yp N stage, tumor differentiation, surgical margin, CRM, LVI, and PNI, and adjuvant chemotherapy. Finally, advanced yp T stage, advanced yp N stage, lower tumor location, poor differentiation and without adjuvant chemotherapy are factors of poor prognosis. These factors contributed to the construction of the five-variable model.
In the early study, Borschitz, T et al reported that pathologic stage after treatment was highly predictive of survival. Local recurrence rates were different in different pathologic stage: ypT1, 2%; ypT2, 6%-20%; ypT3, 43%.34 The result appeared to be similar in recent studies. Daniel D et al analyzed 44,320 patients with rectal cancer between 2004 and 2014 and confirmed that it was not the clinical stage but the final pathologic stage best predicted long-term outcomes. Pathologic T1N0 patients displayed equivalent survival patterns with cT1N0 disease, regardless of baseline presentation. It seemed that pre-treatment clinical stage had little influence on survival in patients undergoing neoadjuvant therapy.5 Our findings are in agreement with these studies, therefore, yp T stage and yp N stage are chosen as factors in multivariate analysis and they do demonstrate important role in nomogram.
Many studies noted that tumor location of the rectal cancer affected the final outcomes significantly.17 The main reason for this was the increased difficulty in surgery due to complex anatomy and narrow space at the bottom of the pelvic. Yang et al35 noted that low rectal cancer had higher risk of tumor relapse after laparoscopic resection than mid-rectal and upper-rectal cancers. This may be caused by higher rates of positive CRM and permanent stoma in low rectal cancer. Frambach et al36 considered a distance of the rectal cancer from the anal verge ≤5 cm was the risk factor for recurrence and lung metastasis. Sunil et al18 analyzed 827 patients and concluded that low tumors were less likely to have a pCR which was associated with better prognosis. In the present study, we also found that tumor distance from the anal verge was an independent predictor of clinical outcomes.
Compared with patients with moderately- and well-differentiated rectal cancer, those with rectal cancer in poorly differentiated usually have a worse prognosis. Biologically, poorly differentiated cancers are more aggressive than the more differentiated tumors. Moreover, de-differentiated tumors are more often found to have vascular and neural structures invasion and histological boundaries transgression.37,38 In Qiu et al39 study, unresponsiveness or poor response was mostly occurred in patients with poor differentiation37 and T4, whom always had poor prognosis.
The impact of adjuvant chemotherapy in the multidisciplinary management of locally advanced rectal cancer remains controversial. Its role is questioned in some studies.40,41 These studies did not show a survival advantage with adjuvant chemotherapy. However, discordant data could be found in literatures on this issue. Some studies showed benefits with adjuvant chemotherapy.32 In current study, OS and DFS were improved among those patients treated with adjuvant chemotherapy. The limited compliance with chemotherapy regimens maybe the reason of negative results in previous studies with no benefits. More strong evidences are needed to prove the role of adjuvant chemotherapy in rectal cancer.
Our nomograms might propose a simple method to predict prognosis in locally advanced rectal cancer. The performance of nomograms was verified in two validation cohorts. However, our study has several limitations. First, these nomograms were developed on a retrospective analysis and require further validation in prospective study. What is more, chemotherapy regimens received by patients were not consistent due to the retrospective data. Second, we did not include genetic indicators, which may act as prognostic implications. Moreover, the model was based on two institutions, hence, its validity in general populations remains to be further verification despite our internal and external validation.
Conclusion
In conclusion, we developed and validated nomograms to effectively predict 3-year OS and DFS rate. It is a useful tool that can divide patients into groups with different risks, which may help clinicians identify patients who need close follow-up.
Acknowledgments
The authors thank all patients involved in the study, as well as their caregivers, care team, investigators and research staff in participating institutions.
Funding
This research was funded by National Natural Science Foundation for Young Scholars of China, grant number 81703080.
Disclosure
The authors declare that the research was conducted in the absence of any commercial or financial relationships that could be construed as a potential conflict of interest.
References
1. Siegel RL, Miller KD, Jemal A. Cancer statistics, 2019. CA Cancer J Clin. 2019;69(1):7–34. doi:10.3322/caac.21551
2. Chen W, Zheng R, Baade PD, et al. Cancer statistics in China, 2015. CA Cancer J Clin. 2016;66(2):115–132. doi:10.3322/caac.21338
3. Liu Z, Zhang X, Shi Y, et al. Radiomics analysis for evaluation of pathological complete response to neoadjuvant chemoradiotherapy in locally advanced rectal cancer. Clin Cancer Res. 2017;23(23):7253–7262. doi:10.1158/1078-0432.CCR-17-1038
4. Nagtegaal ID, Gosens MJEM, Marijnen CAM, Rutten HJ, van de Velde CJH, van Krieken JHJM. Combinations of tumor and treatment parameters are more discriminative for prognosis than the present TNM system in rectal cancer. J Clin Oncol. 2007;25(13):1647–1650. doi:10.1200/JCO.2005.05.4825
5. Delitto D, George TJ, Loftus TJ, et al. Prognostic value of clinical vs pathologic stage in rectal cancer patients receiving neoadjuvant therapy. J Natl Cancer Inst. 2018;110(5):460–466. doi:10.1093/jnci/djx228
6. Valentini V, van Stiphout RGPM, Lammering G, et al. Nomograms for predicting local recurrence, distant metastases, and overall survival for patients with locally advanced rectal cancer on the basis of European randomized clinical trials. J Clin Oncol. 2011;29(23):3163–3172. doi:10.1200/jco.2010.33.1595
7. Li Z, Xie P, Zhang D, et al. Nomogram for predicting disease-free survival among a multicenter cohort of Chinese patients with locally advanced rectal cancer. Cancer Manag Res. 2019;11:2471–2483. doi:10.2147/CMAR.S196614
8. Van Calster B, Wynants L, Verbeek JFM, et al. Reporting and interpreting decision curve analysis: a guide for investigators. Eur Urol. 2018;74(6):796–804. doi:10.1016/j.eururo.2018.08.038
9. Meyer JE, Cohen SJ, Ruth KJ, Sigurdson ER, Hall MJ. Young age increases risk of lymph node positivity in early-stage rectal cancer. J Natl Cancer Inst. 2015;108(1):djv284. doi:10.1093/jnci/djv284
10. Ngeow J, Eng C. Rectal cancer: age matters in the affairs of stage. J Natl Cancer Inst. 2016;108(1):djv325. doi:10.1093/jnci/djv325
11. Hofheinz RD, Arnold D, Fokas E, et al. Impact of age on the efficacy of oxaliplatin in the preoperative chemoradiotherapy and adjuvant chemotherapy of rectal cancer: a post hoc analysis of the CAO/ARO/AIO-04 Phase III trial. Ann Oncol. 2018;29(8):1793–1799. doi:10.1093/annonc/mdy205
12. Sarasqueta C, Zunzunegui MV, Enríquez Navascues JM, et al. Gender differences in stage at diagnosis and preoperative radiotherapy in patients with rectal cancer. Bmc Cancer. 2020;20(1). doi:10.1186/s12885-020-07195-4
13. Diefenhardt M, Ludmir EB, Hofheinz RD, et al. Association of sex with toxic effects, treatment adherence, and oncologic outcomes in the CAO/ARO/AIO-94 and CAO/ARO/AIO-04 phase 3 randomized clinical trials of rectal cancer. JAMA Oncol. 2019. doi:10.1001/jamaoncol.2019.5102
14. Meyerhardt JA, Tepper JE, Niedzwiecki D, et al. Impact of body mass index on outcomes and treatment-related toxicity in patients with stage II and III rectal cancer: findings from intergroup trial 0114. J Clin Oncol. 2004;22(4):648–657. doi:10.1200/JCO.2004.07.121
15. Taylor FGM, Quirke P, Heald RJ, et al. Preoperative high-resolution magnetic resonance imaging can identify good prognosis stage I, II, and III rectal cancer best managed by surgery alone. Ann Surg. 2011;253(4):711–719. doi:10.1097/SLA.0b013e31820b8d52
16. Kennedy ED, Simunovic M, Jhaveri K, et al. Safety and feasibility of using magnetic resonance imaging criteria to identify patients with “good prognosis” rectal cancer eligible for primary surgery. JAMA Oncol. 2019;5(7):961. doi:10.1001/jamaoncol.2019.0186
17. Bozzetti F. The site of the tumor, not the type of operation, determines the worse prognosis of the low rectal cancer. Ann Surg. 2006;244(2):330–331. doi:10.1097/01.sla.0000230007.89561.91
18. Sunil PV, Roxburgh CS, Vakiani E, et al. Distance to the anal verge is associated with pathologic complete response to neoadjuvant therapy in locally advanced rectal cancer. J Surg Oncol. 2016;114(5):637–641. doi:10.1002/jso.24358
19. Restivo A, Zorcolo L, Cocco IMF, et al. Elevated CEA levels and low distance of the tumor from the anal verge are predictors of incomplete response to chemoradiation in patients with rectal cancer. Ann Surg Oncol. 2013;20(3):864–871. doi:10.1245/s10434-012-2669-8
20. Hu H, Huang J, Lan P, et al. CEA clearance pattern as a predictor of tumor response to neoadjuvant treatment in rectal cancer: a post-hoc analysis of FOWARC trial. Bmc Cancer. 2018;18(1). doi:10.1186/s12885-018-4997-y
21. Fokas E, Allgauer M, Polat B, et al. Randomized phase II trial of chemoradiotherapy plus induction or consolidation chemotherapy as total neoadjuvant therapy for locally advanced rectal cancer: CAO/ARO/AIO-12. J Clin Oncol. 2019;37(34):3212–3222. doi:10.1200/JCO.19.00308
22. Deng Y, Chi P, Lan P, et al. Neoadjuvant modified FOLFOX6 with or without radiation versus fluorouracil plus radiation for locally advanced rectal cancer: final results of the Chinese FOWARC trial. J Clin Oncol. 2019;37(34):3223–3233. doi:10.1200/JCO.18.02309
23. Cercek A, Goodman KA, Hajj C, et al. Neoadjuvant chemotherapy first, followed by chemoradiation and then surgery, in the management of locally advanced rectal cancer. J Natl Compr Canc Netw. 2014;12(4):513–519. doi:10.6004/jnccn.2014.0056
24. Abdalla A, Aref A. Upfront chemotherapy followed by chemoradiation remains the sequence of choice for total neoadjuvant chemotherapy for locally advanced rectal cancer. J Clin Oncol. 2019;37(36):3561–3562. doi:10.1200/JCO.19.01722
25. Lefevre JH, Mineur L, Kotti S, et al. Effect of interval (7 or 11 weeks) between neoadjuvant radiochemotherapy and surgery on complete pathologic response in rectal cancer: a multicenter, randomized, controlled trial (GRECCAR-6). J Clin Oncol. 2016;34(31):3773–3780. doi:10.1200/JCO.2016.67.6049
26. Li J, Li J. Can a longer waiting period after neoadjuvant chemoradiotherapy improve the pathologic complete response rate in patients with rectal cancer? J Clin Oncol. 2017;35(15):1747–1748. doi:10.1200/JCO.2016.69.7318
27. Jeong S, Park JW, Nam BH, et al. Open versus laparoscopic surgery for mid-rectal or low-rectal cancer after neoadjuvant chemoradiotherapy (COREAN trial): survival outcomes of an open-label, non-inferiority, randomised controlled trial. Lancet Oncol. 2014;15(7):767–774. doi:10.1016/S1470-2045(14)70205-0
28. Fleshman J, Branda ME, Sargent DJ, et al. Disease-free survival and local recurrence for laparoscopic resection compared with open resection of stage II to III rectal cancer. Ann Surg. 2019;269(4):589–595. doi:10.1097/SLA.0000000000003002
29. Swets M, Kuppen PJK, Blok EJ, Gelderblom H, van de Velde CJH, Nagtegaal ID. Are pathological high-risk features in locally advanced rectal cancer a useful selection tool for adjuvant chemotherapy? Eur J Cancer. 2018;89:1–8. doi:10.1016/j.ejca.2017.11.006
30. Karagkounis G, Thai L, Mace AG, et al. Prognostic implications of pathological response to neoadjuvant chemoradiation in pathologic stage III rectal cancer. Ann Surg. 2019;269(6):1117–1123. doi:10.1097/SLA.0000000000002719
31. Bregni G, Akin TT, Camera S, et al. Adjuvant chemotherapy for rectal cancer: current evidence and recommendations for clinical practice. Cancer Treat Rev. 2020;83:101948. doi:10.1016/j.ctrv.2019.101948
32. Spiegel DY, Boyer MJ, Hong JC, et al. Survival advantage with adjuvant chemotherapy for locoregionally advanced rectal cancer: a veterans health administration analysis. J Natl Compr Canc Netw. 2020;18(1):52–58. doi:10.6004/jnccn.2019.7329
33. Park IJ, You YN, Agarwal A, et al. Neoadjuvant treatment response as an early response indicator for patients with rectal cancer. J Clin Oncol. 2012;30(15):1770–1776. doi:10.1200/jco.2011.39.7901
34. Borschitz T, Wachtlin D, Mohler M, Schmidberger H, Junginger T. Neoadjuvant chemoradiation and local excision for T2-3 rectal cancer. Ann Surg Oncol. 2008;15(3):712–720. doi:10.1245/s10434-007-9732-x
35. Yang H, Yao Z, Cui M, et al. Influence of tumor location on short- and long-term outcomes after laparoscopic surgery for rectal cancer: a propensity score matched cohort study. Bmc Cancer. 2020;20(1):761. doi:10.1186/s12885-020-07255-9
36. Frambach P, Pucciarelli S, Perin A, et al. Metastatic pattern and new primary tumours after neoadjuvant therapy and surgery in rectal cancer. Colorectal Dis. 2018;20(12):O326–O334. doi:10.1111/codi.14427
37. Huang Q, Qin H, Xiao J, et al. Association of tumor differentiation and prognosis in patients with rectal cancer undergoing neoadjuvant chemoradiation therapy. Gastroenterol Rep. 2019;7(4):283–290. doi:10.1093/gastro/goy045
38. Jögi A, Vaapil M, Johansson M, Påhlman S. Cancer cell differentiation heterogeneity and aggressive behavior in solid tumors. Uppsala J Med Sci. 2012;117(2):217–224. doi:10.3109/03009734.2012.659294
39. Qiu HZ, Wu B, Xiao Y, Lin GL. Combination of differentiation and T stage can predict unresponsiveness to neoadjuvant therapy for rectal cancer. Colorectal Dis. 2011;13(12):1353–1360. doi:10.1111/j.1463-1318.2011.02570.x
40. Bosset JF, Calais G, Mineur L, et al. Fluorouracil-based adjuvant chemotherapy after preoperative chemoradiotherapy in rectal cancer: long-term results of the EORTC 22921 randomised study. Lancet Oncol. 2014;15(2):184–190. doi:10.1016/S1470-2045(13)70599-0
41. Breugom AJ, Swets M, Bosset JF, et al. Adjuvant chemotherapy after preoperative (chemo)radiotherapy and surgery for patients with rectal cancer: a systematic review and meta-analysis of individual patient data. Lancet Oncol. 2015;16(2):200–207. doi:10.1016/S1470-2045(14)71199-4
 © 2021 The Author(s). This work is published and licensed by Dove Medical Press Limited. The full terms of this license are available at https://www.dovepress.com/terms.php and incorporate the Creative Commons Attribution - Non Commercial (unported, v3.0) License.
By accessing the work you hereby accept the Terms. Non-commercial uses of the work are permitted without any further permission from Dove Medical Press Limited, provided the work is properly attributed. For permission for commercial use of this work, please see paragraphs 4.2 and 5 of our Terms.
© 2021 The Author(s). This work is published and licensed by Dove Medical Press Limited. The full terms of this license are available at https://www.dovepress.com/terms.php and incorporate the Creative Commons Attribution - Non Commercial (unported, v3.0) License.
By accessing the work you hereby accept the Terms. Non-commercial uses of the work are permitted without any further permission from Dove Medical Press Limited, provided the work is properly attributed. For permission for commercial use of this work, please see paragraphs 4.2 and 5 of our Terms.