")
Back to Journals » Neuropsychiatric Disease and Treatment » Volume 11
Paroxetine ameliorates changes in hippocampal energy metabolism in chronic mild stress-exposed rats
Authors Khedr L, Nassar N, El-Denshary EE, Abdel-tawab A
Received 21 April 2015
Accepted for publication 11 June 2015
Published 13 November 2015 Volume 2015:11 Pages 2887—2901
DOI https://doi.org/10.2147/NDT.S87089
Checked for plagiarism Yes
Review by Single anonymous peer review
Peer reviewer comments 4
Editor who approved publication: Dr Roger Pinder
Lobna H Khedr, Noha N Nassar, Ezzeldin S El-Denshary, Ahmed M Abdel-tawab
1Department of Pharmacology, Faculty of Pharmacy, Misr International University, 2Department of Pharmacology, Faculty of Pharmacy, Cairo University, 3Department of Pharmacology, Faculty of Medicine, Ain Shams University, Cairo, Egypt
Abstract: The molecular mechanisms underlying stress-induced depression have not been fully outlined. Hence, the current study aimed at testing the link between behavioral changes in chronic mild stress (CMS) model and changes in hippocampal energy metabolism and the role of paroxetine (PAROX) in ameliorating these changes. Male Wistar rats were divided into three groups: vehicle control, CMS-exposed rats, and CMS-exposed rats receiving PAROX (10 mg/kg/day intraperitoneally). Sucrose preference, open-field, and forced swimming tests were carried out. Corticosterone (CORT) was measured in serum, while adenosine triphosphate and its metabolites, cytosolic cytochrome-c (Cyt-c), caspase-3 (Casp-3), as well as nitric oxide metabolites (NOx) were measured in hippocampal tissue homogenates. CMS-exposed rats showed a decrease in sucrose preference as well as body weight compared to control, which was reversed by PAROX. The latter further ameliorated the CMS-induced elevation of CORT in serum (91.71±1.77 ng/mL vs 124.5±4.44 ng/mL, P<0.001) as well as the changes in adenosine triphosphate/adenosine diphosphate (3.76±0.02 nmol/mg protein vs 1.07±0.01 nmol/mg protein, P<0.001). Furthermore, PAROX reduced the expression of Cyt-c and Casp-3, as well as restoring NOx levels. This study highlights the role of PAROX in reversing depressive behavior associated with stress-induced apoptosis and changes in hippocampal energy metabolism in the CMS model of depression.
Keywords: rats, CMS, hippocampus, paroxetine, apoptosis, adenine nucleotides, cytochrome-c, caspase-3
Introduction
Depression is the leading cause of disability worldwide.1 Stressful life events are pivotal players in the incidence of depression, especially in individuals with a genetic predisposition.2,3 In support of the role of stress in the incidence of depression, it has been reported that, in 70%–80% of the cases, the onset of the first episode of depression is preceded by a severe life event.4 It is proposed that stress induces structural remodeling in the hippocampal formation, including atrophy, neuronal loss, and decreased neurogenesis as well as apoptosis,5–7 which constitutes a newly emerging concept perceiving major depressive disorder (MDD) as a complex illness, associated with progressive morphological brain changes rather than change in the neurotransmitter balance per se.8
In an elegant approach to simulate some of the environmental stressors culminating in the induction of MDD, Willner et al9,10 adopted a modification of the experimental stress models of depression, namely the chronic mild stress (CMS) battery. In this battery, rats were exposed to a variety of mild and unpredictable stressors for a period of weeks.11 A major token of this model is anhedonia, the decreased responsiveness to pleasurable stimuli, thus simulating that seen in MDD in humans.11
Notably, the hippocampus, a highly plastic stress-sensitive region, is not only a crucial player in learning and memory but also pivotal for the regulation of the hypothalamic–pituitary–adrenal (HPA) axis. Noteworthy, reduced volume of this brain region has been reported in numerous clinical and preclinical studies of hippocampal volume changes in depression,7,12 which lends further evidence of the central involvement of the hippocampus in regulating the central response to stress and eventually depression. In response to stress, the brain mounts a neuroendocrine stress response through the HPA axis, triggering behavioral, endocrine, and metabolic cascades.13,14 Noteworthy, elevated glucocorticoid (GC) has been reported to underlie such hippocampal changes. Indeed, impaired glucocorticoid receptors (GRs) function has been suggested to be associated with HPA axis hyperactivity in depression.15,16 Strenuous stress may induce apoptosis via genomic and non-genomic actions of the elevated GC17 as well as affecting mitochondrial functions.17,18 In addition to their critical role in energy production,19 mitochondria are pivotal in apoptosis signaling.20 Ample evidence associates neuroendocrine alterations and changes in mitochondrial signaling to the vicious cascades of immune cell activation and reactive oxygen species formation in depressive disorders.19 Certainly, increased cytokine levels have been linked to signs of marked depressive illness.21 Furthermore, increasing evidence suggests that GC-induced apoptosis plays a key role in the induction of hippocampal neuronal damage.22–24 In contrast to the effects of stress, chronic use of several classes of antidepressants including selective serotonin reuptake inhibitors had shown its ability to protect against stress-induced apoptosis25,26 and to increase neurogenesis.27–29
Although the pathophysiology of depression is still scantily understood, some studies have demonstrated that deficiencies in energy metabolism may be involved.30 Hence, the current investigation aimed at characterizing the mechanism(s) underpinning the relation between depression and changes in hippocampal energy metabolism and the utility of paroxetine (PAROX), a clinically effective antidepressant drug, in rectifying such changes.
Materials and methods
Animals
Twenty-nine male Wistar rats (National Research Center Laboratory, Cairo, Egypt), weighing 200±50 g, were used for the experimental procedures. Rats were allowed at least 2 weeks to acclimatize. Animals were housed individually and received standard pellet rat chow (Meladco Feed Company, El Obour, Egypt) and tap water ad libitum for the duration of the experiments, unless otherwise recommended by the study protocol. Temperature was maintained at 22°C±2°C, and the light/dark cycle was held at 12 hours:12 hours with lights on at 5 am. All handling procedures were performed by the same investigator throughout the study. Animal handling and experimental protocols were approved by the Research Ethical Committee of the Faculty of Pharmacy, Cairo University (Cairo, Egypt), and comply with the Guide for the Care and Use of Laboratory Animals.31
Experimental design
Training for sucrose solution intake and groups distribution
After 2 weeks of initial habituation to the laboratory conditions, animals were trained for 48 hours to drink 2% (w/v) sucrose (Fluka Chemical Co., Buchs, Switzerland) solution before introducing the CMS battery. Bottles were regularly checked to ensure non-leakage. Subsequently, animals received a series of four sucrose preference tests (SPTs). Following the last training session, three baseline SPTs were performed, separated by at least 3 days, and the results were averaged, to determine the basal sucrose intake before the start of the CMS battery.
Following initial measurement of sucrose preference, animals (n=30) were divided into two sets with similar average sucrose preference. The first set (n=20; during the course of the experiment, there was one incidence of mortality in the CMS group, which reduced the number of animals in this group to nine) was exposed to CMS battery (Table 1), while the second set (n=10) served as vehicle control. After 7 weeks of CMS exposure, the first set (CMS-exposed rats) was randomly allocated into another two subsets, namely (i) CMS group (n=9) receiving daily intraperitoneal (ip) vehicle injection (two saline:three dimethylsulfoxide) and (ii) PAROX group (n=10; Eva Pharmaceuticals, Cairo, Egypt) receiving ip 10 mg/kg PAROX daily (Figure 1).32–34
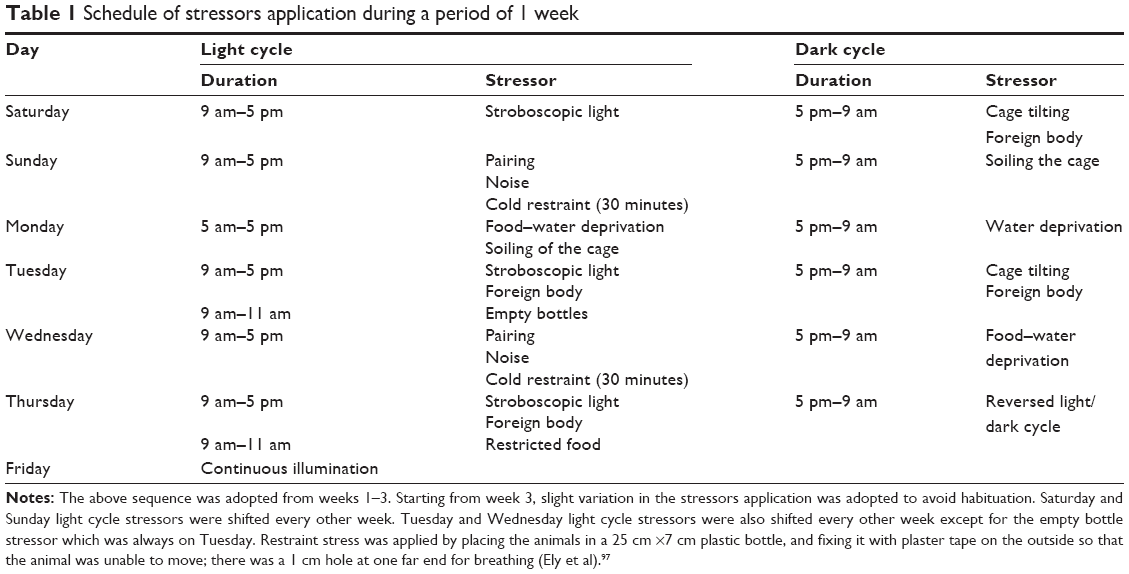 | Table 1 Schedule of stressors application during a period of 1 week |
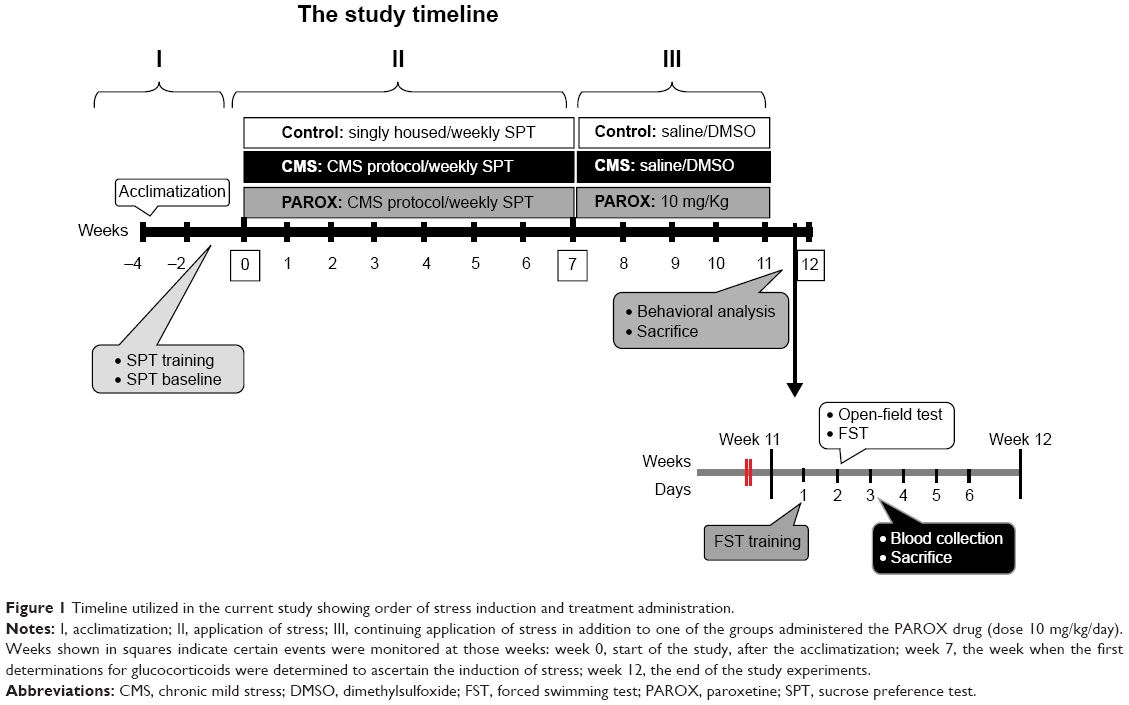 | Figure 1 Timeline utilized in the current study showing order of stress induction and treatment administration. |
Application of the CMS battery
Rats were exposed to two to five mild stressors per day for 11 weeks, given that no more than three mild stresses were applied at a time (Table 1). Stressors were presented in a semi-random sequence over the course of a week and repeated in successive weeks, with slight shifting between the days.
Measurements
All the 29 animals were used for both behavioral and biochemical testing.
Behavioral testing
All behavioral tests were done at least 24 hours after the last stressor at the end of experimental period. SPT was done weekly. The sequence of applying behavioral tests was open-field test (OFT), and then forced swimming test (FST) preceded by FST training on the previous day. Animals were sacrificed the next day in the morning, namely 48 hours after the application of the last stressor.
Sucrose preference test
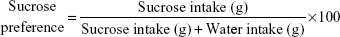
Sucrose preference was measured in all the 29 animals, by calculating the reduction in the consumption of sucrose solution or preference as an indicator of anhedonia. SPT was scheduled at the beginning of the dark cycle.35 After a 16-hour period of food and water deprivation, animals were presented simultaneously with two pre-weighed bottles, one bottle containing sucrose (2%) and the other containing water, for a period of 30 minutes. The position of the two bottles (right/left) was varied randomly from trial to trial, during the training period, and also on the weekly test. Bottles were weighed again after the test to calculate amount consumed from each solution. Sucrose preference was calculated from the following formula:36
|
|
Forced swimming test
After 11 weeks of stress, FST was measured in all the 29 animals according to Porsolt et al.37 Animal behavior was recorded by a video camera, and immobility time was measured with a stopwatch. The FST involves immersion of animals in a cylinder full of water (22.5 cm ×60 cm) containing 35 cm of water maintained at 25°C. On the first day, the rats were trained to swim for 15 minutes. Water was changed after testing of each animal. Twenty-four hours later, rats were reexposed to the forced swimming for 5 minutes. Animal behavior was recorded by a video camera, and immobility time was measured with a stopwatch. The duration of immobility was calculated by summing the total time spent immobile (ie, the time not spent actively exploring the cylinder or trying to escape from it). Included within the time spent immobile are the short periods of slight activity where the animals just make those movements necessary to maintain their heads above water.38 A stress-free period precedes the test with at least 12 hours, and the test was performed at least 3 days before decapitation.
Open-field test
The OFT was performed in all the 29 animals as described by Blokland et al39 with modifications, in order to assess the general locomotor activity.40 The apparatus consists of a large black arena (90 cm ×90 cm ×60 cm), divided by strips into 25 equal small squares illuminated by white light. The automated Open Control software41 was modified to detect the number and time spent in the central zones, with the aid of a USB camera used to record the whole sessions. Other parameters of OFT like rearing and grooming activity were recorded manually during each session.
Body weight gain
The percentage change in body weight gain in comparison to the baseline was calculated weekly as well as the final body weight gain, which was calculated as the difference between the final and baseline body weight.
Biochemical testing
Tissue and blood sampling
Rats were euthanized using ip urethane (1.2 g/kg). Hippocampi were dissected under strict cooling conditions. One side of hippocampus was used for the assessment of either adenine nucleotides or nitric oxide metabolites (NOx). The other side of hippocampus was divided into two halves for the assessment of cytochrome-c (Cyt-c) and caspase-3 (Casp-3). All hippocampi samples were stored at −70°C until assayed. The protein concentration was determined with the Bio-Rad protein assay reagent (BIO-RAD Laboratories, Richmond, CA, USA) according to the kit instruction manual using bovine serum albumin as a standard. Blood samples were taken from the animals between 3 pm and 5 pm, and sera were separated and stored at −20°C.
HPLC assay of serum steroids
Samples (20 μL) were submitted to isocratic high-performance liquid chromatography (HPLC) using a reversed-phase octadecyl silane (C18) partition column at a temperature of 40°C and flow rate of 1 mL/min. The internal standard utilized was 6-alpha methyl prednisolone. Mobile phase was prepared by adding distilled water to methanol and acetonitrile in a ratio of 54:43:3, and filtered by 0.45 μm membrane filters. The mobile phase was degassed by sonication for 20 minutes before mounting into the HPLC pump. The corticosterone (CORT) peaks were analyzed spectrophotometrically (λ=254 nm) and identified by the comparison with the retention time of the corresponding standard solutions.42,43 The concentration of CORT was expressed in ng/mL. Method validation (retention times, linearity, several samples in the same day or several samples in several days, and recoveries) was carried out.
HPLC assay of high-energy phosphates and their metabolites
Frozen samples were homogenized in 1,200 μL of ice-cold 0.76 M perchloric acid (to which was added another 800 μL of 0.5 M perchloric acid containing 160 μM inosine-3-monophosphate disodium salt as an internal standard) using an ice-chilled glass homogenizer; the homogenate was then allowed to extract for 30 minutes in ice-cold temperature, followed by centrifugation (6,000 rpm for 30 minutes at 4°C). The supernatant was removed and neutralized by the addition of approximately 200 μL of 6 N KOH, controlling the pH with pH indicator strip. Any further precipitate appearing after neutralization was removed by centrifugation (6,000 rpm for 30 minutes at 4°C). The collected supernatant was further filtrated using a 0.45 μm filter and used for direct analysis of energy metabolites. Samples (20 μL) after suitable pretreatment were submitted to isocratic HPLC using a reversed-phase octadecyl silane (C18) partition column (Alltech; 150 mm long ×4.6 mm internal diameter, 5.0 μm particle size, preceded by a short [40 mm ×4 mm] guard column of same material) at 37°C. Flow rate was adjusted at 1 mL/min. Inosine-3-monophosphate disodium salt served as an internal standard. Mobile phase comprised 20 mM potassium phosphate buffer (pH 6). The nucleotide (adenosine triphosphate [ATP], adenosine diphosphate (ADP), and adenosine monophosphate [AMP]) peaks were analyzed spectrophotometrically (λ=254 nm) and identified by the comparison with the retention time of the corresponding standard solutions.44,45 Method validation was carried out.
Estimation of NOx in hippocampal homogenate
The method described by Miranda et al46 was used for the determination of total nitrate/nitrite as an index of nitric oxide (NO) production in hippocampal homogenate, with a modification for protein precipitation using zinc sulfate.47 Briefly, hippocampal homogenates (20% homogenate in ice-cold saline) were deproteinated using zinc sulfate followed by centrifugation at 12,000 rpm for 15 minutes at 4°C. To an aliquot of the supernatant, vanadium trichloride (0.8% in 1 M HCl) was added for the reduction of nitrate to nitrite, followed by the rapid addition of Griess reagent consisting of N-(1-naphthyl)ethylenediamine dihydrochloride (0.1%) and sulfanilamide (2% in 5% HCl), and incubated for 30 minutes at 37°C. Mixtures were cooled, and the absorbance was measured spectrophotometrically at 540 nm.
Estimation of Casp-3 activity
The procedure of the supplied kit (Biovision, Milpitas, CA, USA) was performed according to the manufacturer’s instructions. Briefly, the levels of the chromophore p-nitroanilide released by Casp-3 activity in the tissue lysates were quantified spectrophotometrically at 405 nm.
Cyt-c release in the cytosolic fraction of the rat brain hippocampus
The procedure of the supplied kit (Biovision) was performed according to the manufacturer’s instructions, and then proceeded with standard Western blot procedure. Briefly, sample protein of the cytosolic fraction was quantified with the Bio-Rad protein assay reagent (Bio-Rad). Protein extracts (10 μg per lane) were run on a 12% sodium dodecyl sulfate–polyacrylamide gel electrophoresis (reagents for Laemmli sodium dodecyl sulfate–polyacrylamide gel electrophoresis Bio-Rad) and electroblotted to nitrocellulose membranes using Mini Trans-Blot Electrophoretic transfer cell (Bio-Rad). Blots were then incubated overnight at 4°C with primary antibody anti-Cyt-c mouse monoclonal antibody (supplied in the kit at a dilution of 1:1,500). After washing three times with tris buffered solution (TBS)/Tween (T) (1× TBS, 0.1% T-2), the blots were incubated for 60 minutes at room temperature with horse radish peroxidase-conjugated anti-mouse IgG (KPL, Gaithersburg, MD, USA) for 1 hour at room temperature, followed by washing three times with 15 mL of TBS/T. The blots were detected by the addition of the chromogenic substrate (4CN peroxidase substrate), which upon reacting with the peroxidase-labeled primary antibody developed a dark purple precipitate on the membrane.
Results
Behavior experiments
Effects of CMS and treatment with PAROX on sucrose preference as a measure of anhedonia
The CMS-exposed rats showed a decrease in sucrose preference over time. Moreover, the final sucrose preference was significantly less in stressed rats compared to the control and baseline values. Repeated one-way analysis of variance (ANOVA) revealed a significant difference in sucrose preference at week 5 compared to the baseline of both stressed groups prior to PAROX treatment (CMS group: F(2,8)=30.43, P<0.0001; PAROX group: F(2,9)=14.87, P=0.0002). At week 5, the CMS-exposed rats showed a significant reduction in sucrose preference in comparison to their baseline (71.14±1.95 vs 87.34±1.55, P<0.001). Additionally, PAROX group, prior to the initiation of PAROX treatment, had also showed a significant reduction in sucrose preference in comparison to their baseline (69.68±4.26 vs 89.11±2.09, P<0.001). At week 11, the PAROX-treated rats showed a significant increase in the sucrose preference in comparison to week 5 (87.01±2.27 vs 69.68±4.26, P<0.001), which was nonsignificant from the original baseline at week 0. At week 11, the CMS group showed a significant decrease in the sucrose preference in comparison to week 5 (79.98±1.72 vs 71.14±1.95, P<0.01), which was also significantly different from the baseline at week 0 (79.98±1.72 vs 87.34±1.55, P<0.01). Furthermore, a separate one-way ANOVA (F(2,26)=6.077, P=0.0068) revealed that the sucrose preference was significantly lower in both stressed groups prior to PAROX treatment in comparison to their control at week 5 (P<0.05). Following treatment with PAROX at week 11, the sucrose preference of the treated group was normalized to near control values (F(2,26)=3.395, P=0.049) (Figure 2).
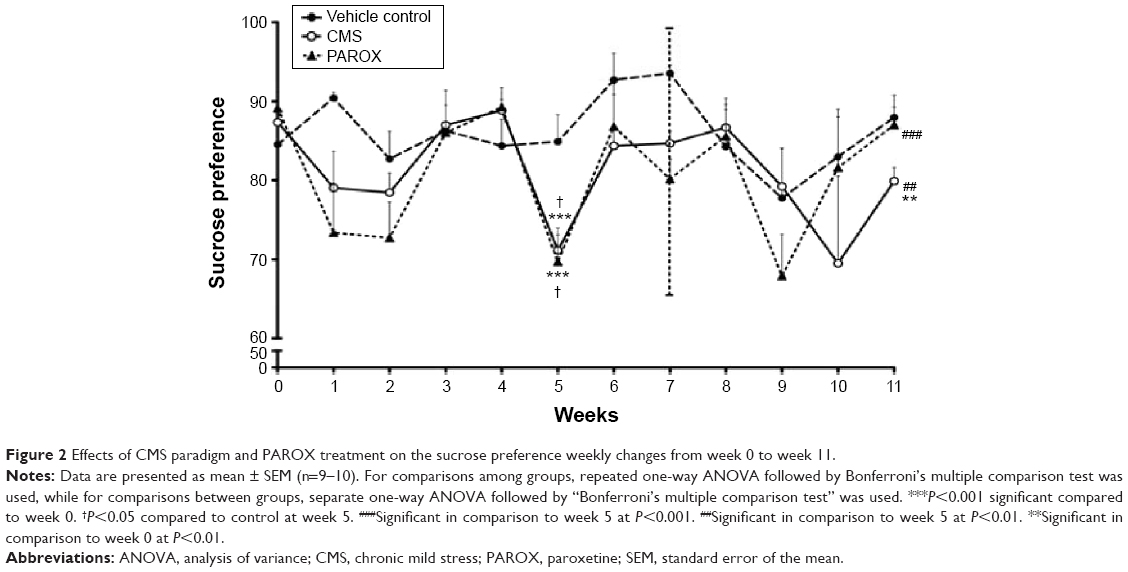 | Figure 2 Effects of CMS paradigm and PAROX treatment on the sucrose preference weekly changes from week 0 to week 11. |
Effects of CMS paradigm and PAROX treatment on FST
Exposure to CMS significantly increased the desperate behavior measured as the immobility time scored in the FST (F(2,22)=20.57, P<0.0001). This was demonstrated by the significant increase in the immobility time scored by CMS rats in comparison to control rats (121.4±9.33 seconds vs 57.43±7.27 seconds, P<0.001). This increase in the desperate behavior was corrected by PAROX treatment, which demonstrated a significant reduction in the immobility time scored by the treated rats in comparison to CMS-exposed rats (53.6±8.37 seconds vs 121.4±9.33 seconds, P<0.001) (Figure 3).
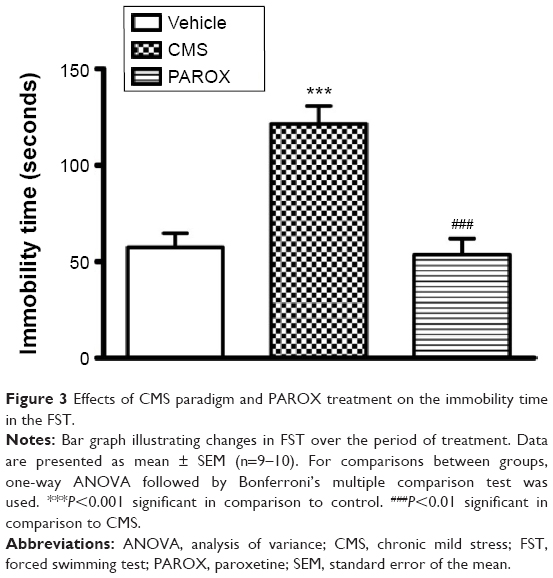 | Figure 3 Effects of CMS paradigm and PAROX treatment on the immobility time in the FST. |
Effects of CMS paradigm and PAROX treatment on OFT
Exposure to CMS increased the activity and exploration of the rats when tested in the open field. There was a significant increase in the mean counts of both the ambulation frequency (total zones count/horizontal activity) (F(2,26)=13.84, P<0.0001) and the central zones count (F(2,26)=5.375, P=0.0111) scored by the CMS group in comparison to the mean counts scored by the control group (99.8±17.25 vs 19.2±6.3, P<0.001 and 9±3.6 vs 1.3±0.75, P<0.05). Moreover, the CMS exposure had also caused a significant increase in the rearing frequency (vertical movement) (F(2,26)=14.75, P<0.0001) and the grooming frequency (F(2,26)=7.963, P=0.0020) in comparison to the mean counts scored by the control group (11±2.23 vs 1±0.3, P<0.001 and 6±1.18 vs 0.6±0.27, P<0.05).
This increase in the ambulation, central zones, and rearing frequency mean counts induced by the CMS was successfully ameliorated by PAROX treatment, which had shown a significant reduction in both mean counts in comparison to the CMS group (53.5±6.7 vs 99.8±17.25, P<0.05; 0.5±0.34 vs 9±3.6, P<0.05; and 4.1±0.86 vs 11±2.23, P<0.01). Yet the PAROX showed no effect on the grooming frequency, where the grooming frequency of the treated group showed a significant increase from the control group (7.8±1.97 vs 0.6±0.27, P<0.01) (Figure 4).
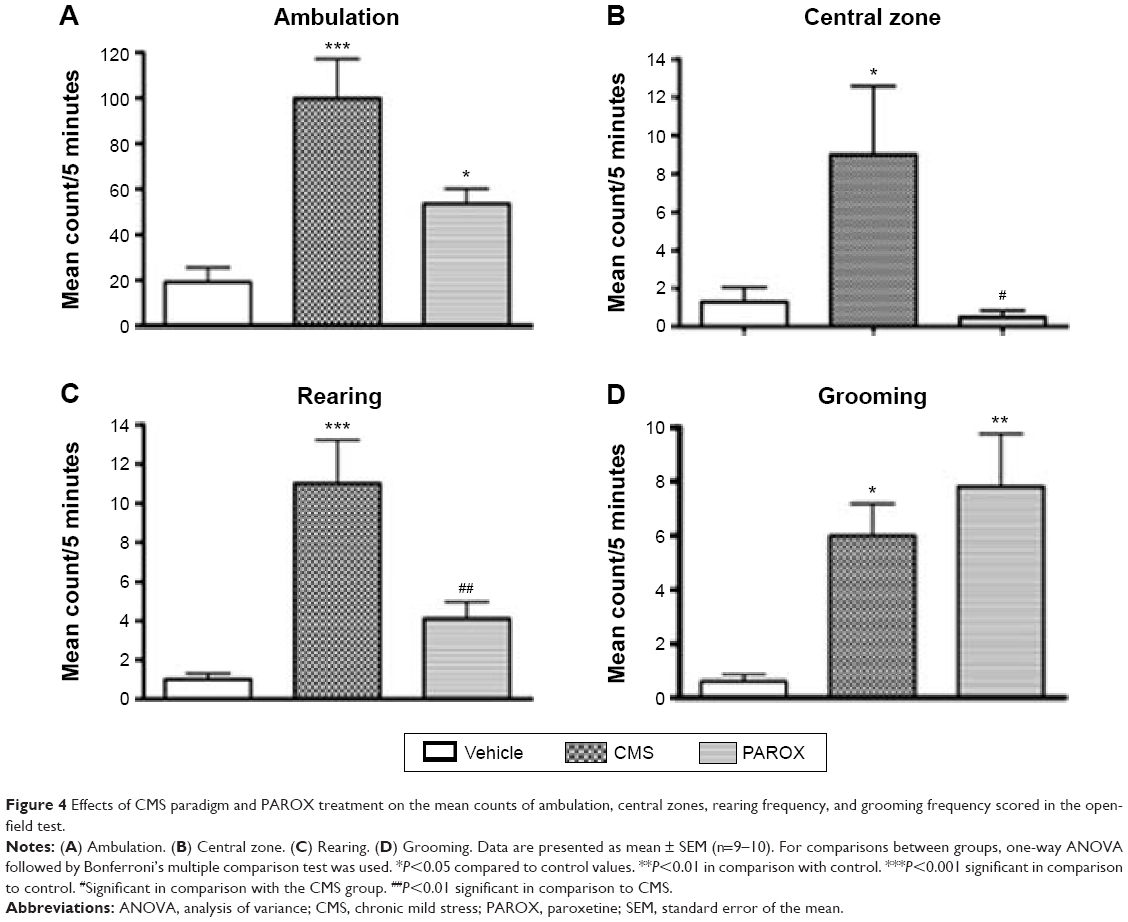 | Figure 4 Effects of CMS paradigm and PAROX treatment on the mean counts of ambulation, central zones, rearing frequency, and grooming frequency scored in the open-field test. |
Effects of CMS paradigm and PAROX treatment on the body weight gain
The body weight gain was significantly affected by CMS and PAROX treatment (F(2,26)=104.6, P<0.0001) which showed a significant difference between the means. Post hoc analysis revealed that CMS showed a decrease in the body weight gain in comparison to control (11.22±3.77 g vs 97.7±5.92 g, P<0.001). Paradoxically, PAROX induced greater reductions in body weight gain when compared to the control group (−18.9±7.37 vs 97.7±5.92, P<0.001) (Figure 5A).
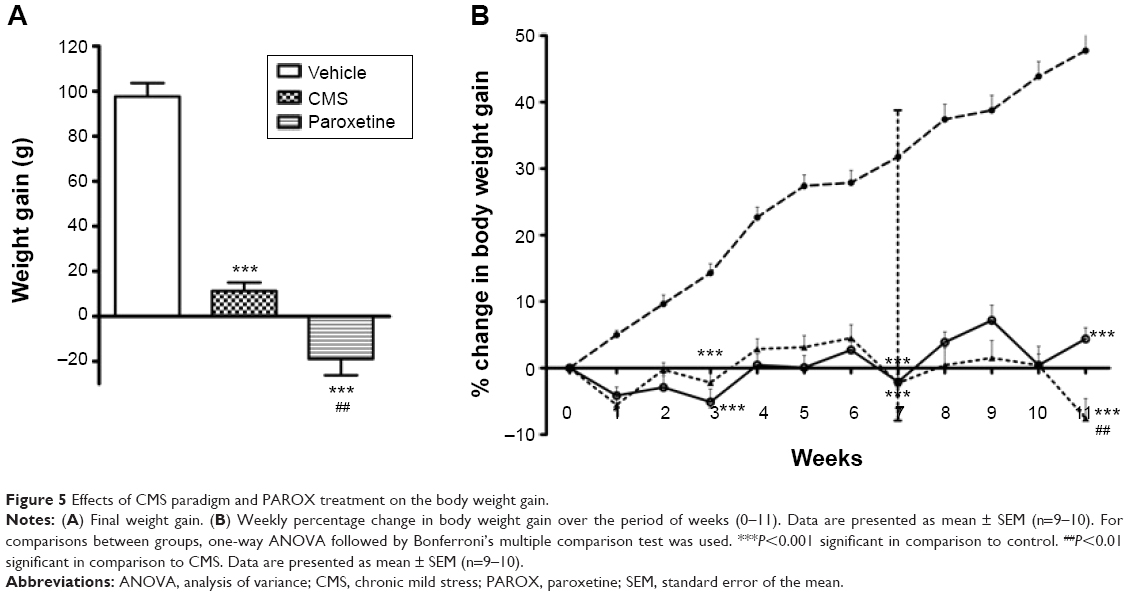 | Figure 5 Effects of CMS paradigm and PAROX treatment on the body weight gain. |
Regarding the weekly changes in body weight gain, CMS-exposed rats in comparison to control at the same week showed a significant reduction in body weight gain at two time intervals – week 3 (F(2,26)=44.79, P<0.0001) and week 7 (F(2,26)=117.9, P<0.0001) (Figure 5B): first at week 3 (−5.1±1.95 g vs 14.31±1.37 g, P<0.001), and the second time was at week 7 (−2.01±2.11 vs 31.75±1.99, P<0.001). However, PAROX treatment did not show any improvement in body weight gain by the end of this study; it had even caused a much more significant reduction in the CMS-exposed rats in comparison to control (F(2,26)=150.8, P<0.0001), as observed at week 11 (−7.54±2.96 g vs 47.75±2.26 g, P<0.001). This observed decrease was even significantly different from the decrease observed in the body weight gain of CMS group at the same week (−7.45±2.96 vs 4.4±1.68, P<0.01) (Figure 5B).
Biochemical analysis
Effect of 7 weeks of the CMS paradigm on serum steroids
Rats exposed to the CMS protocol for 7 weeks have demonstrated a dramatic change in the serum steroids level in comparison to the control. This finding further consolidated the validity of the method. The serum CORT level of the CMS group had shown a significant increase in concentration by 4.8-fold in comparison to the control group at (P≤0.001) (Table 2).
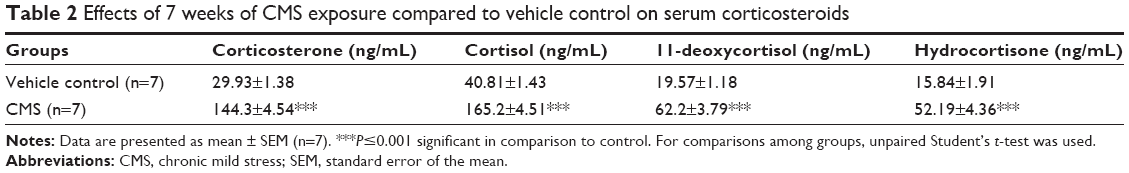 | Table 2 Effects of 7 weeks of CMS exposure compared to vehicle control on serum corticosteroids |
Effects of 11 weeks of the CMS paradigm and PAROX treatment on serum CORT
Rats exposed to the CMS protocol for 11 weeks continued to express a significant change in the serum CORT level in comparison to control (F(2,18)=39.16, P<0.0001). CORT concentration in the CMS group showed a significant increase by 37.72% in comparison to control. Treatment with PAROX significantly ameliorated the CMS-induced increase in serum CORT in comparison to the CMS group (91.71±1.77 ng/mL vs 124.5±4.44 ng/mL, P<0.001) (Table 3).
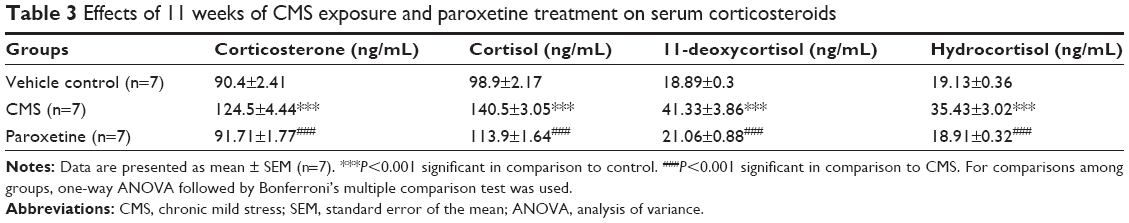 | Table 3 Effects of 11 weeks of CMS exposure and paroxetine treatment on serum corticosteroids |
Effects of CMS paradigm and PAROX treatment on the level of high-energy phosphates in the rat brain hippocampus
CMS-exposed rats showed a significant increase in the concentrations of ATP by 3.64-fold, ADP by 13.16-fold, AMP by 4.29-fold, and total adenine nucleotides (TAN) by 5.52-fold, as well as a significant decrease in the ATP/ADP ratio by 3.56-fold and the adenylate energy charge (AEC) by 1.18-fold in comparison to the control group (P<0.001) (Figure 6).
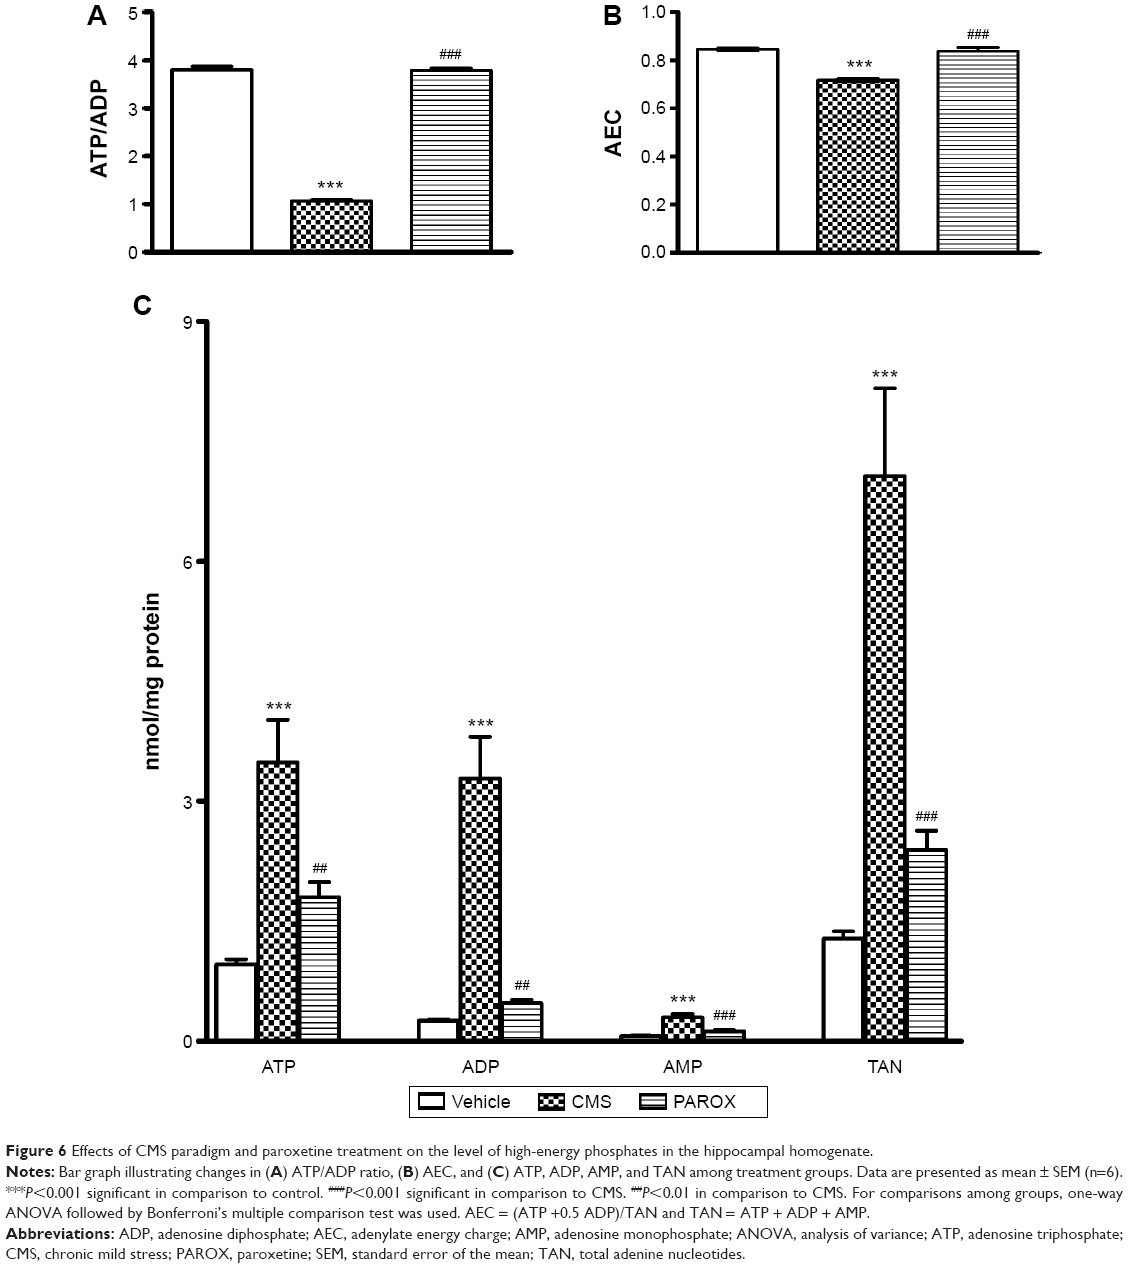 | Figure 6 Effects of CMS paradigm and paroxetine treatment on the level of high-energy phosphates in the hippocampal homogenate. |
Treatment with PAROX significantly ameliorated the CMS-induced increase in ATP, ADP, AMP, and TAN in comparison to the CMS group (1.8±0.19 nmol/mg protein vs 3.49±0.53 nmol/mg protein, P<0.01; 0.12±0.01 nmol/mg protein vs 0.3±0.04 nmol/mg protein, P<0.001; 0.47±0.05 nmol/mg protein vs 3.29±0.52 nmol/mg protein, P<0.01; 2.39±0.24 nmol/mg protein vs 7.07±1.1 nmol/mg protein, P<0.001, respectively). Moreover, it ameliorated the CMS-induced decrease in the ATP/ADP ratio and AEC (3.76±0.02 vs 1.07±0.01, P<0.001 and 0.84±0.007 vs 0.72±0.007, P<0.001, respectively) (Figure 6).
Effects of CMS paradigm and PAROX treatment on the level of NOx
CMS had induced a robust reduction in the NOx (F(2,14)=311.9, P<0.0001) by 42.42% in comparison to the control. PAROX treatment had significantly improved this reduction, showing 6.63-fold increase in their mean concentration in comparison to the CMS, as well as 3.82-fold increase in comparison to the control group (Figure 7).
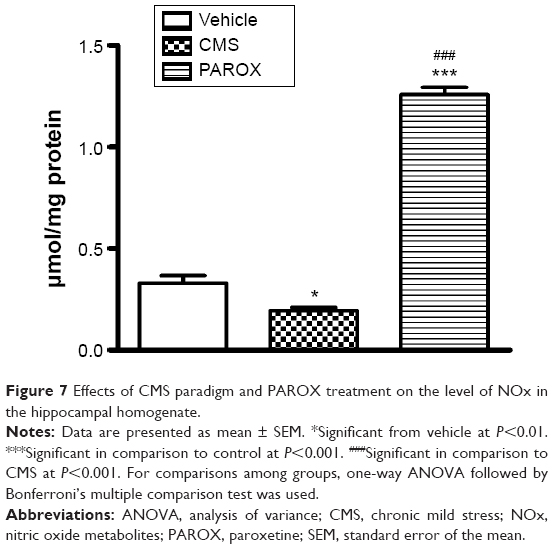 | Figure 7 Effects of CMS paradigm and PAROX treatment on the level of NOx in the hippocampal homogenate. |
Effects of CMS paradigm and PAROX treatment on the Casp-3 activity
CMS induced enhancement in the Casp-3 activity (F(2,21)=9.906, P=0.0009) which in comparison to the control group had shown a significant increase by 1.2-fold (P<0.05). This increase was successfully ameliorated by PAROX treatment that showed a 33.3% decrease in the Casp-3 activity in comparison to the CMS group (P<0.001) (Figure 8).
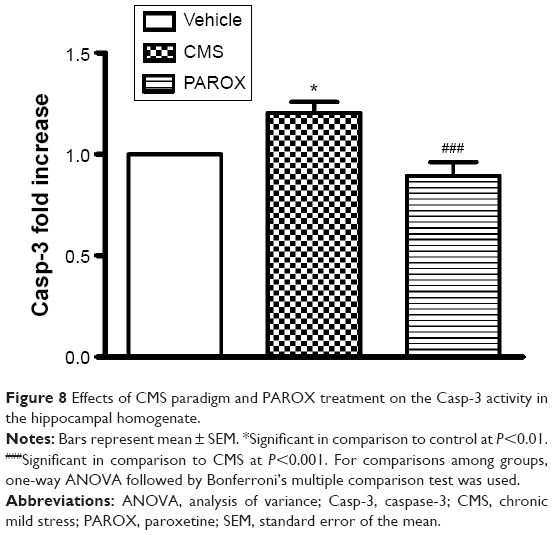 | Figure 8 Effects of CMS paradigm and PAROX treatment on the Casp-3 activity in the hippocampal homogenate. |
Effects of CMS paradigm and PAROX treatment on Cyt-c expression in the cytosolic fraction of the hippocampal homogenate
Cyt-c immunoreactivity was evident as a single band of molecular mass of 15 kDa (Figure 9) in the cytosolic fraction of the rat hippocampus. A significant band was detected in the CMS group after exposure to the CMS battery for 11 weeks. This expression was normalized near the normal by PAROX treatment.
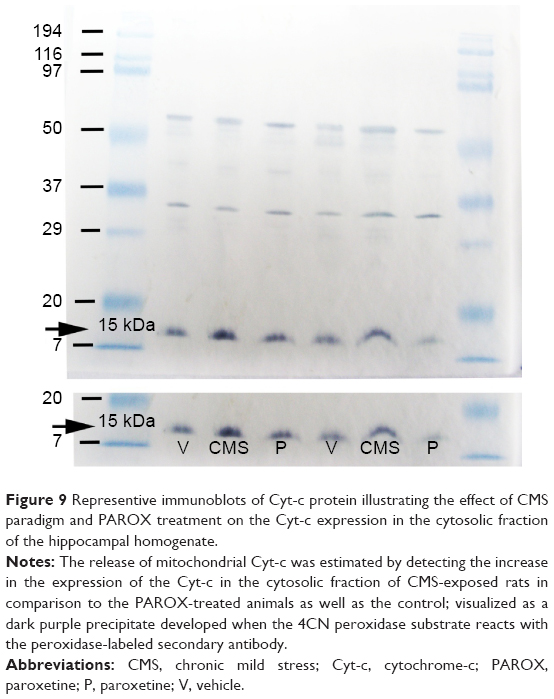 | Figure 9 Representive immunoblots of Cyt-c protein illustrating the effect of CMS paradigm and PAROX treatment on the Cyt-c expression in the cytosolic fraction of the hippocampal homogenate. |
Discussion
This study implicates the role of PAROX in reversing stress-induced depressive-like behaviors associated with alterations in hippocampal stress-induced hippocampal energy metabolism and apoptosis in a CMS model of depression.
In the current investigation, animals exposed to CMS showed anhedonia, indicated by reduced sucrose preference,11 as well as a significant decrease in body weight gain. This finding is in-line with other studies.9,32,35,48–51 Noteworthy, the reduction in body weight gain, a further indicator for the face validity of the adopted CMS paradigm, presents a supplementary physiological index of stress.49,52 Although PAROX induced further weight loss in comparison to CMS and control animals, a finding similar to that previously reported by other authors,32 it amended CMS-induced reduction in sucrose preference, hence conferring a selective protection against CMS-induced anhedonia. Casarotto and Andreatini32 suggested that this might indicate a dissociation between the mechanisms underlying body weight changes and those underlying anhedonia.
In the present study, CMS-exposed rats showed an increased immobility time in FST, suggestive of increased desperate behavior,53 a finding in-line with previous reports52,54,55 documenting increased immobility in the FST as a consequence of CMS anhedonia.11
Although Walsh and Cummins56 and Katz et al57 reported an association of low activity in the OFT with depressive behavior, paradoxically, in the current investigation, rats showed a higher locomotor activity both vertically and horizontally, compared to control. This paradoxic finding is consistent with some previous reports.58,59 This may indicate a possible non-concordance of SPT with some other behavioral responses, including an anomalous decreased anxiety.60 To further validate the induction of stress, the study showed a significant increase in serum CORT following 7 weeks of CMS exposure in comparison to control. Such a finding is in-line with previous reports.49,52 At the end of the 11-week period, CORT concentrations showed a robust upsurge in response to CMS, compared to control. This finding confirms previously reported results.15,61,62 This dysregulation may be attributed to the reduced GR expression and function.15,16,63–65 The deficit might be related to the hypoactivity of the serotoninergic system associated with depression, as the GR expression is dependent on the central 5-hydroxytryptamine tone.66,67 This explanation is further verified by the ability of PAROX to reverse the elevation of the CMS-induced CORT. This finding supports other researches implicating antidepressants in amelioration of HPA axis hyperactivity, probably by modulating GR, via restoring its regulation by the serotoninergic tone.
The increased CORT was associated with an elevation of apoptotic markers in CMS-exposed rats. Such an observation is in harmony with recent findings implicating a causal relationship between apoptosis and CMS-induced hippocampal neurodegenration.26,68 Indeed, PAROX ameliorated the CMS-enhanced expression of cytosolic Cyt-c as well as the increased Casp-3 activity. This finding points toward the value of PAROX in reversing stress-induced apoptosis. Noteworthy, the anti-apoptotic effects of various classes of antidepressants had favorably received considerable attention.25
Notably, postmortem brains of depressed patients showed DNA fragmentation and neuronal apoptosis, suggesting an enhanced neuronal vulnerability in MDD.5,6 Moreover, prolonged or excessive exposure to GCs is known to decrease neurogenesis and may promote apoptosis,22,69 particularly in the hippocampus,24 one of the most vulnerable brain regions to various neurobiological insults due to its high GRs content.70,71 Both genomic and non-genomic actions of CORT have been linked to stress-induced changes in mitochondrial membrane potential (MMP) leading to the release of Cyt-c from inner mitochondrial membrane to cytosol.17 In fact, the current study demonstrated enhanced expression of cytosolic Cyt-c, as well as its downstream player Casp-3 in CMS animals, suggestive of mitochondrial damage.
Several reports advocate an important role of changes in brain energy metabolism in predisposing to depression.30,72 Moreover, rats subjected to chronic stress models showed a decrease in mitochondrial functions.73–75 In the present study, CMS-exposed rats showed a significant increase in hippocampal ATP, ADP, AMP, and TAN associated with a decrease in AEC as well as ATP/ADP. Notably, AEC ratio represents the amount of the metabolically available energy which is stored in the TAN pool and provides a quantitative assessment of the cellular energy status.76 Hence, the observed reduction in AEC seen may indicate high metabolic stress. Noteworthy, an AEC <0.5 is indicative of cell death, while values ranging from 0.55 to 0.75 indicate consumption of energy for defense mechanisms, against stress.77 Consequently, it is expected that in the presence of any metabolic stress, cells will react with a depletion of ATP and a simultaneous increase in the AMP levels and a significant decrease in AEC.78 Notably, in the current investigation, hippocampal cells showed a decline in the energy status, manifested as a decrease in AEC and the ATP/ADP ratio, paralleled with an increase in the ADP and AMP level in the CMS rats.
Despite the decrease in the AEC observed in the CMS-exposed rats, paradoxically, the ATP level increased. A plausible explanation might reside in the low MMP gradient that hampers adequate mitochondrial energy production.19 Alternatively, the observed increase in ATP may be attributed to the increased glycolysis, compensating, at least in part, the disturbed mitochondrial oxidative phosphorylation ATP supply. Nonetheless, the ATP generated by glycolysis would not meet the high energy demand of such a metabolically active tissue like the brain,79 hence creating a mismatch between the rates of ATP consumption and production, lending a reasonable explanation for the observed decrease of AEC. However, another plausible explanation might be due to mitochondrial apoptosis-induced channel formation that enhances the release of Cyt-c, in the absence of mitochondrial depolarization and without loss of outer membrane integrity. These observations indicate that, instead of rupturing, a more selective mechanism of permeabilization is operating, like the formation of a pore in the outer membrane, a phenomenon unrelated to (1-methyl-4-phenyl-1,2,3,6-tetrahydropyridine)-induced changes in the membrane potential, which further implicates that the mitochondria may be still capable of creating some energy.80,81
Interestingly, the observed increase in ATP seen in this study offers verification for the incidence of CMS-induced apoptosis. Notably, ATP depletion is associated with necrosis, while its availability is required for the development of apoptosis.76,82–84
This study reported the successful amelioration of the CMS-induced increase in Casp-3 activity and Cyt-c expression in the cytosol by PAROX, hence implicating a suggested role of PAROX in alleviating the depressive symptoms through the modulation of the programmed cell death-mediated neuronal loss. A recent study reported a role of PAROX (10 mg/kg/day) in partially ameliorating some parameters related to mitochondrial dysfunction and apoptosis in rats exposed to modified stress–restress.85 Several reports have implicated the increase in glutamate and induction of excitotoxicity to the increased cytosolic calcium transients, and further activation of the calcium-dependent neuronal NO synthase (nNOS) inducing hippocampal neuronal degeneration. In fact, increased extracellular glutamate levels have been demonstrated in the rat hippocampus by several acute and chronic stress paradigms.86,87 This explanation was further supported by pervious findings from our laboratory88 reporting an increase in hippocampal glutamate level accompanied by a reduction in gamma amino butyric acid due to decrease in glutamic acid decarboxylase activity in CMS paradigm. Contrary to this view, the present study reported a decrease in NO concentrations suggesting a decrease in NO synthase (NOS) activity. The presented result supports previous findings by Palumbo et al89,90 where they observed a significant reduction in nNOS activity and NOx production in the hippocampus of CMS-exposed mice. The latter might be due to CORT inhibition of nNOS and mitochondrial NOS transcription in the rat brain.91 Moreover, it has been previously reported in clinical studies that depressed patients had shown a decreased activity in the calcium-dependent constitutive NOS in the prefrontal cortex of depressed patients92 as well as a reduction in NOS-containing neurons in the hypothalamus.92 The latter might be due to CORT-inhibiting nNOS and mitochondrial NOS transcription in the rat brain.91 Indeed, PAROX administration had successfully ameliorated this decrease in NO production as well as the dramatic increase in the serum CORT level suggestive of the protective role of NO in preventing apoptosis.93–96
Accordingly, the present investigation highlights a role of energy changes (suggestive of mitochondrial changes) in the etiology of depression, associated with a chronic stress paradigm. This is further confirmed by the ability of PAROX to reverse CMS-induced energy changes, as well as apoptosis, which associated with ameliorating the CMS-related behavior as seen in the OFT and FST, as well as reversal of anhedonic behavior.
Future indication
Findings from the present investigation prompt further studies to assess metabolic changes associated with depression in multiple organs. Notably, Harvey30 stated that mood disorders are often comorbid with cardiovascular, liver, kidney, and endocrine disorders, while increasing evidence concurs that depression involves inflammatory and neurodegenerative processes. This would suggest that metabolic disturbances resembling encephalopathy may underscore the basic neuropathology of depression at a far deeper level than currently realized. Viewing depression as a form of encephalopathy, and exploiting knowledge gleaned from our understanding of the neurochemistry and treatment of metabolic encephalopathy, may assist not only in our understanding of the neurobiology of depression but also in realizing new ideas in the pharmacotherapy of mood disorders.
Acknowledgments
The authors greatly appreciate the efforts of Dr Hanan El Mohammady, Section Head, Serology, Disease Surveillance and Research Lab, US Naval Medical Research Unit Number 3, for providing training and facilitating the use of gel electrophoresis and Western blot in her lab. The authors would also like to acknowledge engineer Ahmed Gala El-Din, Faulty of Engineering, Ain Shams University, and Mr Mohamed El Tabbal, sixth-year medical student, Faculty of Medicine, Ain Shams University, for developing the OFT analysis software and allowing the authors the opportunity for a free trial version.
Disclosure
The authors report no conflicts of interest in this work.
References
World Health Organization. Depression. Fact sheet N°369. October 2015. Available from: http://www.who.int/mediacentre/factsheets/fs369/en/. Accessed October 23, 2015. | ||
Fava M, Kendler KS. Major depressive disorder. Neuron. 2000;28(2):335–341. | ||
Hammen C. Stress and depression. Annu Rev Clin Psychol. 2005;1:293–319. | ||
Kendler KS, Karkowski LM, Prescott CA. Causal relationship between stressful life events and the onset of major depression. Am J Psychiatry. 1999;156(6):837–841. | ||
Czeh B, Lucassen PJ. What causes the hippocampal volume decrease in depression? Are neurogenesis, glial changes and apoptosis implicated? Eur Arch Psychiatry Clin Neurosci. 2007;257(5):250–260. | ||
Lucassen PJ, Heine VM, Muller MB, et al. Stress, depression and hippocampal apoptosis. CNS Neurol Disord Drug Targets. 2006;5(5): 531–546. | ||
Sheline YI, Wang PW, Gado MH, Csernansky JG, Vannier MW. Hippocampal atrophy in recurrent major depression. Proc Natl Acad Sci U S A. 1996;93(9):3908–3913. | ||
MacQueen G, Frodl T. The hippocampus in major depression: evidence for the convergence of the bench and bedside in psychiatric research? Mol Psychiatry. 2010;16(3):252–264. | ||
Willner P. Animal models as simulations of depression. Trends Pharmacol Sci. 1991;12(4):131–136. | ||
Willner P, Muscat R, Papp M. Chronic mild stress-induced anhedonia: a realistic animal model of depression. Neurosci Biobehav Rev. 1992; 16(4):525–534. | ||
Willner P. Chronic mild stress (CMS) revisited: consistency and behavioural-neurobiological concordance in the effects of CMS. Neuropsychobiology. 2005;52(2):90–110. | ||
Campbell S, Macqueen G. The role of the hippocampus in the pathophysiology of major depression. J Psychiatry Neurosci. 2004;29(6):417–426. | ||
McEwen BS. Physiology and neurobiology of stress and adaptation: central role of the brain. Physiol Rev. 2007;87(3):873–904. | ||
Fink G. Stress controversies: post-traumatic stress disorder, hippocampal volume, gastroduodenal ulceration*. J Neuroendocrinol. 2010; 23(2):107–117. | ||
Barden N. Implication of the hypothalamic-pituitary-adrenal axis in the physiopathology of depression. J Psychiatry Neurosci. 2004; 29(3):185–193. | ||
Anacker C, Zunszain PA, Carvalho LA, Pariante CM. The glucocorticoid receptor: pivot of depression and of antidepressant treatment? Psychoneuroendocrinology. 2010;36(3):415–425. | ||
Zhang L, Zhou R, Li X, Ursano RJ, Li H. Stress-induced change of mitochondria membrane potential regulated by genomic and non-genomic GR signaling: a possible mechanism for hippocampus atrophy in PTSD. Med Hypotheses. 2006;66(6):1205–1208. | ||
Kimberg DV, Loud AV, Wiener J. Cortisone-induced alterations in mitochondrial function and structure. J Cell Biol. 1968;37(1): 63–79. | ||
Huttemann M, Lee I, Samavati L, Yu H, Doan JW. Regulation of mitochondrial oxidative phosphorylation through cell signaling. Biochim Biophys Acta. 2007;1773(12):1701–1720. | ||
Desagher S, Martinou JC. Mitochondria as the central control point of apoptosis. Trends Cell Biol. 2000;10(9):369–377. | ||
Schaalan MF, Nassar NN. Effects of octreotide in chronically mild stressed rats: possible role of immune and oxidative stress pathways. Neurochem Res. 2011;36(10):1717–1723. | ||
Crochemore C, Lu J, Wu Y, et al. Direct targeting of hippocampal neurons for apoptosis by glucocorticoids is reversible by mineralocorticoid receptor activation. Mol Psychiatry. 2005;10(8):790–798. | ||
Reagan LP, McEwen BS. Controversies surrounding glucocorticoid-mediated cell death in the hippocampus. J Chem Neuroanat. 1997;13(3):149–167. | ||
Zhu MY, Wang WP, Bissette G. Neuroprotective effects of agmatine against cell damage caused by glucocorticoids in cultured rat hippocampal neurons. Neuroscience. 2006;141(4):2019–2027. | ||
Drzyzga LR, Marcinowska A, Obuchowicz E. Antiapoptotic and neurotrophic effects of antidepressants: a review of clinical and experimental studies. Brain Res Bull. 2009;79(5):248–257. | ||
Wang Y, Xiao Z, Liu X, Berk M. Venlafaxine modulates depression-induced behaviour and the expression of Bax mRNA and Bcl-xl mRNA in both hippocampus and myocardium. Hum Psychopharmacol. 2011;26(2):95–101. | ||
Czéh B, Michaelis T, Watanabe T, et al. Stress-induced changes in cerebral metabolites, hippocampal volume, and cell proliferation are prevented by antidepressant treatment with tianeptine. Proc Natl Acad Sci U S A. 2001;98(22):12796–12801. | ||
Duman RS. Depression: a case of neuronal life and death? Biol Psychiatry. 2004;56(3):140–145. | ||
Nibuya M, Takahashi M, Russell DS, Duman RS. Repeated stress increases catalytic TrkB mRNA in rat hippocampus. Neurosci Lett. 1999;267(2):81–84. | ||
Harvey BH. Is major depressive disorder a metabolic encephalopathy? Hum Psychopharmacol. 2008;23(5):371–384. | ||
Committee for the Update of the Guide for the Care and Use of Laboratory Animals. Guide for the Care and Use of Laboratory Animals. 8th Edition. Washington, DC: The National Academies Press. 2011. | ||
Casarotto PC, Andreatini R. Repeated paroxetine treatment reverses anhedonia induced in rats by chronic mild stress or dexamethasone. Eur Neuropsychopharmacol. 2007;17(11):735–742. | ||
Martínez-Esparza J, Oficialdegui AM, Pérez-Silanes S, et al. New 1-aryl-3-(4-arylpiperazin-1-yl)propane derivatives, with dual action at 5-HT1A serotonin receptors and serotonin transporter, as a new class of antidepressants. J Med Chem. 2001;44(3):418–428. | ||
David DJ, Bourin M, Jego G, Przybylski C, Jolliet P, Gardier AM. Effects of acute treatment with paroxetine, citalopram and venlafaxine in vivo on noradrenaline and serotonin outflow: a microdialysis study in Swiss mice. Br J Pharmacol. 2003;140(6):1128–1136. | ||
D’Aquila PS, Newton J, Willner P. Diurnal variation in the effect of chronic mild stress on sucrose intake and preference. Physiol Behav. 1997;62(2):421–426. | ||
Bekris S, Antoniou K, Daskas S, Papadopoulou-Daifoti Z. Behavioural and neurochemical effects induced by chronic mild stress applied to two different rat strains. Behav Brain Res. 2005;161(1):45–59. | ||
Porsolt RD, Le Pichon M, Jalfre M. Depression: a new animal model sensitive to antidepressant treatments. Nature. 1977;266(5604):730–732. | ||
Castagne V, Moser P, Porsolt RD. Behavioral assessment of antidepressant activity in rodents. In: Buccafusco JJ, editor. Methods of Behavior Analysis in Neuroscience. Boca Raton: CRC Press; 2009: 103–117. | ||
Blokland A, Raaijmakers W, van der Staay FJ, Jolles J. Differential effect of acetyl-l-carnitine on open field behavior in young and old rats. Physiol Behav. 1990;47(4):783–785. | ||
Prut L, Belzung C. The open field as a paradigm to measure the effects of drugs on anxiety-like behaviors: a review. Eur J Pharmacol. 2003;463(1–3):3–33. | ||
Aguiar P, Mendonca L, Galhardo V. OpenControl: a free opensource software for video tracking and automated control of behavioral mazes. J Neurosci Methods. 2007;166(1):66–72. | ||
Hariharan M, Naga S, VanNoord T, Kindt EK. Simultaneous assay of corticosterone and cortisol in plasma by reversed-phase liquid chromatography. Clin Chem. 1992;38(3):346–352. | ||
McWhinney BC, Ward G, Hickman PE. Improved HPLC method for simultaneous analysis of cortisol, 11-deoxycortisol, prednisolone, methylprednisolone, and dexamethasone in serum and urine. Clin Chem. 1996;42(6 pt 1):979–981. | ||
Sellevold OF, Jynge P, Aarstad K. High performance liquid chromatography: a rapid isocratic method for determination of creatine compounds and adenine nucleotides in myocardial tissue. J Mol Cell Cardiol. 1986;18(5):517–527. | ||
Gupta RC, Dettbarn WD. Prevention of kainic acid seizures-induced changes in levels of nitric oxide and high-energy phosphates by 7-nitroindazole in rat brain regions. Brain Res. 2003;981(1–2):184–192. | ||
Miranda KM, Espey MG, Wink DA. A rapid, simple spectrophotometric method for simultaneous detection of nitrate and nitrite. Nitric Oxide. 2001;5(1):62–71. | ||
Grandati M, Verrecchia C, Revaud ML, Allix M, Boulu RG, Plotkine M. Calcium-independent NO-synthase activity and nitrites/nitrates production in transient focal cerebral ischaemia in mice. Br J Pharmacol. 1997;122(4):625–630. | ||
Muscat R, Willner P. Suppression of sucrose drinking by chronic mild unpredictable stress: a methodological analysis. Neurosci Biobehav Rev. 1992;16(4):507–517. | ||
Konkle AT, Baker SL, Kentner AC, Barbagallo LS, Merali Z, Bielajew C. Evaluation of the effects of chronic mild stressors on hedonic and physiological responses: sex and strain compared. Brain Res. 2003;992(2):227–238. | ||
Lucca G, Comim CM, Valvassori SS, et al. Chronic mild stress paradigm reduces sweet food intake in rats without affecting brain derived neurotrophic factor protein levels. Curr Neurovasc Res. 2008;5(4):207–213. | ||
Lucca G, Comim CM, Valvassori SS, et al. Increased oxidative stress in submitochondrial particles into the brain of rats submitted to the chronic mild stress paradigm. J Psychiatr Res. 2009;43(9):864–869. | ||
Bielajew C, Konkle AT, Merali Z. The effects of chronic mild stress on male Sprague-Dawley and Long Evans rats: I. Biochemical and physiological analyses. Behav Brain Res. 2002;136(2):583–592. | ||
Castagne V, Moser P, Roux S, Porsolt RD. Rodent models of depression: forced swim and tail suspension behavioral despair tests in rats and mice. Curr Protoc Neurosci. 2011;Chapter 8:Unit 810A. | ||
Tannenbaum B, Tannenbaum GS, Sudom K, Anisman H. Neurochemical and behavioral alterations elicited by a chronic intermittent stressor regimen: implications for allostatic load. Brain Res. 2002;953(1–2):82–92. | ||
Vitale G, Ruggieri V, Filaferro M, et al. Chronic treatment with the selective NOP receptor antagonist [Nphe 1, Arg 14, Lys 15] N/OFQ-NH 2 (UFP-101) reverses the behavioural and biochemical effects of unpredictable chronic mild stress in rats. Psychopharmacology (Berl). 2009;207(2):173–189. | ||
Walsh RN, Cummins RA. The open-field test: a critical review. Psychol Bull. 1976;83(3):482–504. | ||
Katz RJ, Roth KA, Carroll BJ. Acute and chronic stress effects on open field activity in the rat: implications for a model of depression. Neurosci Biobehav Rev. 1981;5(2):247–251. | ||
Grønli J, Murison R, Fiske E, et al. Effects of chronic mild stress on sexual behavior, locomotor activity and consumption of sucrose and saccharine solutions. Physiol Behav. 2005;84(4):571–577. | ||
Harris RB, Zhou J, Youngblood BD, Smagin GN, Ryan DH. Failure to change exploration or saccharin preference in rats exposed to chronic mild stress. Physiol Behav. 1997;63(1):91–100. | ||
Schweizer MC, Henniger MSH, Sillaber I. Chronic mild stress (CMS) in mice: of anhedonia, ‘anomalous anxiolysis’ and activity. PLoS One. 2009;4(1):e4326. | ||
Ayensu WK, Pucilowski O, Mason GA, Overstreet DH, Rezvani AH, Janowsky DS. Effects of chronic mild stress on serum complement activity, saccharin preference, and corticosterone levels in Flinders lines of rats. Physiol Behav. 1995;57(1):165–169. | ||
Froger N, Palazzo E, Boni C, et al. Neurochemical and behavioral alterations in glucocorticoid receptor-impaired transgenic mice after chronic mild stress. J Neurosci. 2004;24(11):2787–2796. | ||
Holsboer F, Barden N. Antidepressants and hypothalamic-pituitary-adrenocortical regulation. Endocr Rev. 1996;17(2):187–205. | ||
Pariante CM, Miller AH. Glucocorticoid receptors in major depression: relevance to pathophysiology and treatment. Biol Psychiatry. 2001;49(5):391–404. | ||
Webster MJ, Knable MB, O’Grady J, Orthmann J, Weickert CS. Regional specificity of brain glucocorticoid receptor mRNA alterations in subjects with schizophrenia and mood disorders. Mol Psychiatry. 2002;7(9):985–994,924. | ||
Barden N. Regulation of corticosteroid receptor gene expression in depression and antidepressant action. J Psychiatry Neurosci. 1999;24(1):25–39. | ||
Hery M, Semont A, Fache MP, Faudon M, Hery F. The effects of serotonin on glucocorticoid receptor binding in rat raphe nuclei and hippocampal cells in culture. J Neurochem. 2000;74(1):406–413. | ||
Bachis A, Cruz MI, Nosheny RL, Mocchetti I. Chronic unpredictable stress promotes neuronal apoptosis in the cerebral cortex. Neurosci Lett. 2008;442(2):104–108. | ||
Gould E, Tanapat P. Stress and hippocampal neurogenesis. Biol Psychiatry. 1999;46(11):1472–1479. | ||
Murray F, Smith DW, Hutson PH. Chronic low dose corticosterone exposure decreased hippocampal cell proliferation, volume and induced anxiety and depression like behaviours in mice. Eur J Pharmacol. 2008;583(1):115–127. | ||
de Quervain DJ, Aerni A, Schelling G, Roozendaal B. Glucocorticoids and the regulation of memory in health and disease. Front Neuroendocrinol. 2009;30(3):358–370. | ||
Rezin G, Amboni G, Zugno A, Quevedo J, Streck E. Mitochondrial dysfunction and psychiatric disorders. Neurochem Res. 2009;34(6):1021–1029. | ||
Madrigal JL, Olivenza R, Moro MA, et al. Glutathione depletion, lipid peroxidation and mitochondrial dysfunction are induced by chronic stress in rat brain. Neuropsychopharmacology. 2001;24(4):420–429. | ||
Rezin GT, Cardoso MR, Gonçalves CL, et al. Inhibition of mitochondrial respiratory chain in brain of rats subjected to an experimental model of depression. Neurochem Int. 2008;53(6–8):395–400. | ||
Tagliari B, Noschang CG, Ferreira AG, et al. Chronic variable stress impairs energy metabolism in prefrontal cortex and hippocampus of rats: prevention by chronic antioxidant treatment. Metab Brain Dis. 2010;25(2):169–176. | ||
Baranowska-Bosiacka I, Gutowska I, Marchetti C, et al. Altered energy status of primary cerebellar granule neuronal cultures from rats exposed to lead in the pre- and neonatal period. Toxicology. 2011;280(1–2):24–32. | ||
Din ZB, Brooks JM. Use of adenylate energy charge as a physiological indicator in toxicity experiments. Bull Environ Contam Toxicol. 1986; 36(1):1–8. | ||
Atkinson DE. The energy charge of the adenylate pool as a regulatory parameter. Interaction with feedback modifiers. Biochemistry. 1968;7(11):4030–4034. | ||
Erecinska M, Silver IA. ATP and brain function. J Cereb Blood Flow Metab. 1989;9(1):2–19. | ||
Dejean LM, Martinez-Caballero S, Kinnally KW. Is MAC the knife that cuts cytochrome c from mitochondria during apoptosis? Cell Death Differ. 2006;13(8):1387–1395. | ||
Dejean LM, Martinez-Caballero S, Manon S, Kinnally KW. Regulation of the mitochondrial apoptosis-induced channel, MAC, by BCL-2 family proteins. Biochimica Et Biophysica Acta. 2006;1762(2):191–201. | ||
Eguchi Y, Shimizu S, Tsujimoto Y. Intracellular ATP levels determine cell death fate by apoptosis or necrosis. Cancer Res. 1997;57(10): 1835–1840. | ||
Leist M, Single B, Castoldi AF, Kuhnle S, Nicotera P. Intracellular adenosine triphosphate (ATP) concentration: a switch in the decision between apoptosis and necrosis. J Exp Med. 1997;185(8):1481–1486. | ||
Halestrap AP, Clarke SJ, Javadov SA. Mitochondrial permeability transition pore opening during myocardial reperfusion – a target for cardioprotection. Cardiovasc Res. 2004;61(3):372–385. | ||
Garabadu D, Ahmad A, Krishnamurthy S. Risperidone attenuates modified stress-re-STRESS paradigm-induced mitochondrial dysfunction and apoptosis in rats exhibiting post-traumatic stress disorder-like symptoms. J Mol Neurosci. 2015;56(2):299–312. | ||
Moghaddam B, Bolinao ML, Stein-Behrens B, Sapolsky R. Glucocorticoids mediate the stress-induced extracellular accumulation of glutamate. Brain Res. 1994;655(1–2):251–254. | ||
Bagley J, Moghaddam B. Temporal dynamics of glutamate efflux in the prefrontal cortex and in the hippocampus following repeated stress: effects of pretreatment with saline or diazepam. Neuroscience. 1997;77(1):65–73. | ||
El-faramawy YA, El-banouby MH, Sergeev P, Mortagy AK, Amer MS, Abdel-tawab AM. Changes in glutamate decarboxylase enzyme activity and tau-protein phosphorylation in the hippocampus of old rats exposed to chronic mild stress: reversal with the neuronal nitric oxide synthase inhibitor 7-nitroindazole. Pharmacol Biochem Behav. 2009;91(3):339–344. | ||
Palumbo ML, Fosser NS, Rios H, et al. Loss of hippocampal neuronal nitric oxide synthase contributes to the stress-related deficit in learning and memory. J Neurochem. 2007;102(1):261–274. | ||
Palumbo ML, Zorrilla Zubilete MA, Cremaschi GA, Genaro AM. Different effect of chronic stress on learning and memory in BALB/c and C57BL/6 inbred mice: involvement of hippocampal NO production and PKC activity. Stress. 2009;12(4):350–361. | ||
Weber CM, Eke BC, Maines MD. Corticosterone regulates heme oxygenase-2 and NO synthase transcription and protein expression in rat brain. J Neurochem. 1994;63(3):953–962. | ||
Xing G, Chavko M, Zhang LX, Yang S, Post RM. Decreased calcium-dependent constitutive nitric oxide synthase (cNOS) activity in prefrontal cortex in schizophrenia and depression. Schizophr Res. 2002;58(1):21–30. | ||
Mannick JB, Hausladen A, Liu L, et al. Fas-induced caspase denitrosylation. Science. 1999;284(5414):651–654. | ||
Thippeswamy T, McKay JS, Morris R. Bax and caspases are inhibited by endogenous nitric oxide in dorsal root ganglion neurons in vitro. Eur J Neurosci. 2001;14(8):1229–1236. | ||
Guix FX, Uribesalgo I, Coma M, Munoz FJ. The physiology and pathophysiology of nitric oxide in the brain. Prog Neurobiol. 2005;76(2):126–152. | ||
Park MY, Jeong YJ, Kang GC, et al. Nitric oxide-induced apoptosis of human dental pulp cells is mediated by the mitochondria-dependent pathway. Korean J Physiol Pharmacol. 2014;18(1):25–32. | ||
Ely DR, Dapper V, Marasca J, et al. Effect of restraint stress on feeding behavior of rats. Physiol Behav. 1997;61(3):395–398. |
 © 2015 The Author(s). This work is published and licensed by Dove Medical Press Limited. The full terms of this license are available at https://www.dovepress.com/terms.php and incorporate the Creative Commons Attribution - Non Commercial (unported, v3.0) License.
By accessing the work you hereby accept the Terms. Non-commercial uses of the work are permitted without any further permission from Dove Medical Press Limited, provided the work is properly attributed. For permission for commercial use of this work, please see paragraphs 4.2 and 5 of our Terms.
© 2015 The Author(s). This work is published and licensed by Dove Medical Press Limited. The full terms of this license are available at https://www.dovepress.com/terms.php and incorporate the Creative Commons Attribution - Non Commercial (unported, v3.0) License.
By accessing the work you hereby accept the Terms. Non-commercial uses of the work are permitted without any further permission from Dove Medical Press Limited, provided the work is properly attributed. For permission for commercial use of this work, please see paragraphs 4.2 and 5 of our Terms.