")
Back to Journals » Cancer Management and Research » Volume 11
Pancreatic neuroendocrine tumor: prediction of the tumor grade using magnetic resonance imaging findings and texture analysis with 3-T magnetic resonance
Authors Guo C, Ren S , Chen X, Wang Q, Xiao W, Zhang J, Duan S, Wang Z
Received 20 November 2018
Accepted for publication 28 January 2019
Published 4 March 2019 Volume 2019:11 Pages 1933—1944
DOI https://doi.org/10.2147/CMAR.S195376
Checked for plagiarism Yes
Review by Single anonymous peer review
Peer reviewer comments 2
Editor who approved publication: Dr Ahmet Emre Eşkazan
Chuan-gen Guo,1,* Shuai Ren,2,* Xiao Chen,2 Qi-dong Wang,1 Wen-bo Xiao,1 Jing-feng Zhang,1 Shao-feng Duan,3 Zhong-qiu Wang2
1Department of Radiology, The First Affiliated Hospital, College of Medicine Zhejiang University, Hangzhou 310003, China; 2Department of Radiology, The Affiliated Hospital of Nanjing University of Chinese Medicine, Nanjing 210029, China; 3GE Healthcare, Shanghai 201203, China
*These authors contributed equally to this work
Purpose: The purpose of this study was to evaluate the performance of magnetic resonance imaging (MRI) findings and texture parameters for prediction of the histopathologic grade of pancreatic neuroendocrine tumors (PNETs) with 3-T magnetic resonance.
Patients and methods: PNETs are classified into Grade 1 (G1), Grade 2 (G2), and Grade 3 (G3) tumors based on the Ki-67 proliferation index and the mitotic activity. A total of 77 patients with pathologically confirmed PNETs met the inclusion criteria. Texture analysis (TA) was applied to T2-weighted imaging (T2WI) and diffusion-weighted imaging (DWI) maps. Patient demographics, MRI findings, and texture parameters were compared among three different histopathologic subtypes by using Fisher’s exact tests or Kruskal–Wallis test. Then, logistic regression analysis was adopted to predict tumor grades. ROC curves and AUCs were calculated to assess the diagnostic performance of MRI findings and texture parameters in prediction of tumor grades.
Results: There were 31 G1, 29 G2, and 17 G3 patients. Compared with G1, G2/G3 tumors showed higher frequencies of an ill-defined margin, a predominantly solid tumor type, local invasion or metastases, hypo-enhancement at the arterial phase, and restriction diffusion. Four T2-based (inverse difference moment, energy, correlation, and differenceEntropy) and five DWI-based (correlation, contrast, inverse difference moment, maxintensity, and entropy) TA parameters exhibited statistical significance among PNETs (P<0.001). The AUCs of six predicting models on T2WI and DWI ranged from 0.703–0.989.
Conclusion: Our data indicate that MRI findings, including tumor margin, texture, local invasion or metastases, tumor enhancement, and diffusion restriction, as well as texture parameters can aid the prediction of PNETs grading.
Keywords: magnetic resonance imaging, neuroendocrine tumor, pancreas, texture analysis
Introduction
Pancreatic neuroendocrine tumors (PNETs) are rare neoplasms that arise from pluripotent stem cells in ductal epithelium, accounting for less than 3% of all pancreatic neoplasms.1 However, the incidence of PNETs has increased over the past decade, which may be due to the increased awareness, improved diagnostic imaging modalities, and the revision of its definition.2–4 In the WHO 2017 classification, PNETs are categorized based on the Ki-67 proliferation index and mitotic activity. They are divided into three tumor grades: Grade 1 (G1), Grade 2 (G2), and Grade 3 (G3) tumors.5 Notably, the choice of treatment of PNETs is related to tumor grades. Surgical resection should always be proposed for PNETs if technically feasible, even in some cases with limited metastases. In addition, therapies with somatostatin analogs or ablation are reserved for those with unresectable or residual disease.1,6
The typical imaging findings of PNETs describe them as well-defined solid masses with relatively intense enhancement at the arterial or portal venous phase, absence of ductal dilatation, and lack of vascular encasement.7,8 However, some recent studies demonstrated that up to 41.5% of PNETs may show arterial hypo-enhancement, especially for G2/G3 tumors.9,10 There are differences in tumor margin, enhancement pattern, portal enhancement ratio, and duct dilatation among PNETs.11–13 Diffusion-weighted imaging (DWI) or the apparent diffusion-coefficient (ADC) map obtained from DWI is an effective imaging method in assessment of tumors or pathological treatment response to chemoradiation.14,15 Lotfalizadeh et al16 found that mean ADC and diffusion coefficient (D) became significantly lower as tumor grade of PNETs increased. Although several studies showed that computed tomography (CT) or magnetic resonance imaging (MRI) characteristics can predict tumor grade of PNET, accurate prediction of the PNET grade by CT or MRI is still limited.
Texture analysis (TA) that can extract, analyze, and interpret quantitative imaging features has been widely used in imaging fields. It allows objective quantitative assessment of lesion or tissue heterogeneity. Early evidence suggests that TA has potential for diagnosis, characterization, tumor staging, and therapy response assessment in oncologic practice.17–22 Several reports have investigated the value of CT TA in predicting the histopathologic grade of PNETs.23,24 However, to the best of our knowledge, few studies have shown the potential value of MRI TA in predicting the histopathologic grade of PNETs. TA of T2-weighted imaging (T2WI) from MRI has been used in many cancers.25,26 Despite the potential variability in T2 signal intensity, a previous study reported highly reproducible results of texture features from three different MRI scanners.27,28
The purpose of our study was to investigate the utility of MRI findings and texture features in predicting the histopathologic grade of PNETs.
Patients and methods
Patients
This study was approved by the Ethical Committee of the Affiliated Hospital of Nanjing University of Chinese Medicine and informed patient consent requirement was waived due to its retrospective nature. Patient data confidentiality was protected in accordance with the Declaration of Helsinki principles. In our study, 101 consecutive patients with pathologically confirmed PNETs between December 2013 and May 2017 were identified. Inclusion criteria were as follows: 1) patients who underwent surgical excision with histopathologic examination; 2) patients who underwent MRI examinations including DWI performed within a period of 30 days before surgery; 3) patients did not receive local treatment or systemic chemotherapy before surgery. The exclusion criteria were as follows: 1) intraoperative biopsy-proven PNETs were excluded because they could not be correctly classified according to the WHO classification (n=6); 2) no MRI examination before surgery (n=8); 3) the quality of the MRI images was poor due to movement artifacts or susceptibility artifacts (n=4); 4) patients with multiple PNETs in which the pathology report was not clear regarding the tumor grade (n=2); 5) tumors did not restrict diffusion or were too small to be depicted on DWI images (n=4). Finally, a total of 77 patients (34 women and 43 men with a mean age of 53.32±11.75 years) were enrolled in our study (Figure 1).
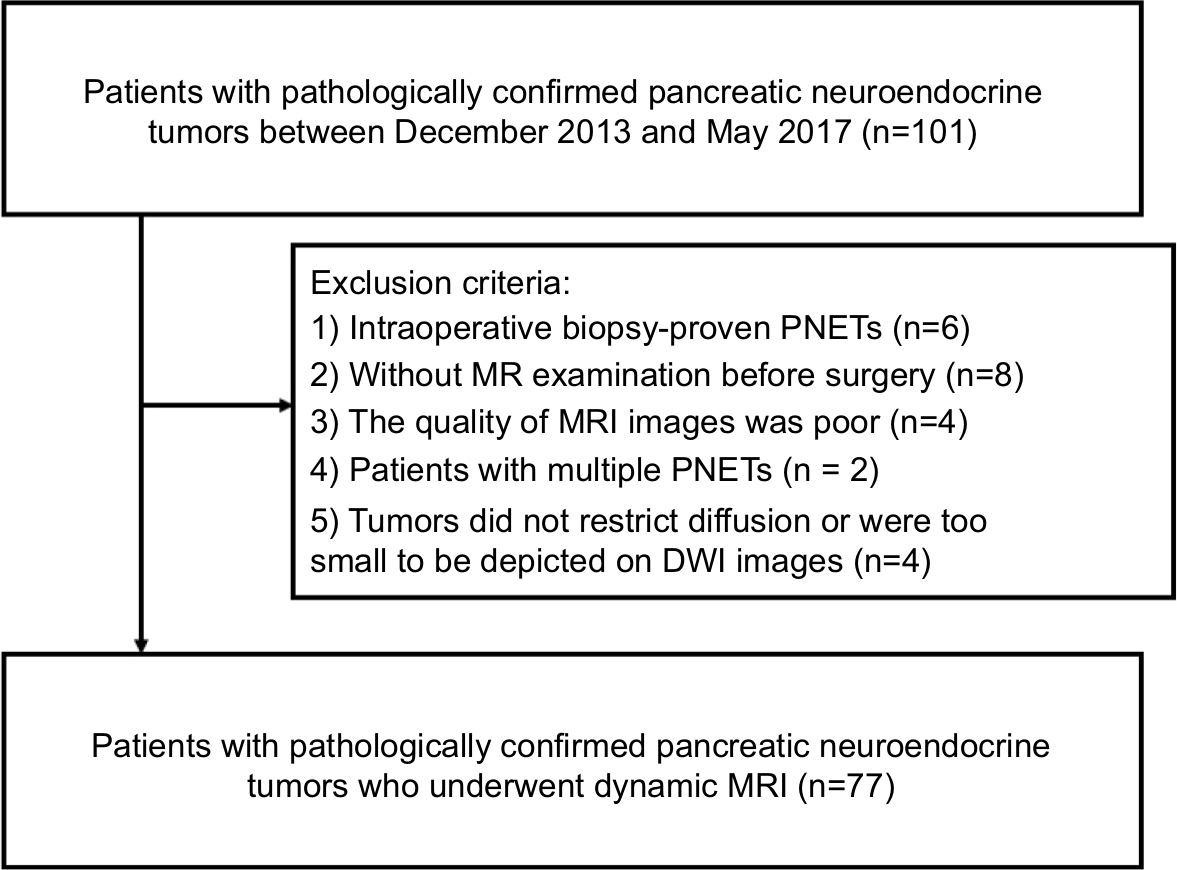 | Figure 1 Flowchart of study group inclusion process. Abbreviations: DWI, diffusion-weighted imaging; MR, magnetic resonance; MRI, magnetic resonance imaging; PNETs, pancreatic neuroendocrine tumors. |
MRI protocol
All preoperative MRI scanning was performed using a 3.0-T MRI (Sigma HDx; GE Medical Systems, Milwaukee, WI, USA) system with an eight-channel phased-array torso coil. All patients fasted for 8 hours prior to MRI examination. MRI sequences included T1-weighted fat-suppressed liver acquisition with volume acceleration (LAVA) sequence (repetition time 3,100 ms, echo time 15 ms, imaging duration 1–2 minutes; slice thickness 5 mm, interslice gap 2 mm; flip angle 12°, matrix 384×256, field of view 22 cm × 22 cm); fast spin-echo T2-weighted fat-suppressed sequence (repetition time 6,000 ms, echo time 80 ms, imaging duration 2–3 minutes; slice thickness 5 mm, interslice gap 2 mm; flip angle 90°, matrix 384×256, field of view 22 cm × 22 cm), and DWI using respiration-triggered single shot echo-planar sequence (repetition time 8,000 ms, echo time 60 ms; slice thickness 5 mm, interslice gap 2 mm; flip angle 90°, matrix 196×133, field of view 36 cm × 30 cm; b value of 0 and 1,000 s/mm2). T1-weighted contrast-enhanced sequences were performed at the pancreatic parenchyma (35 seconds scanning delay), portal venous (70 seconds scanning delay), and delayed (240 seconds scanning delay) phase with the contrast media of Gadopentetate dimeglumine (GE Healthcare; 0.2 mmol/kg) at a rate of 2.5 mL/s.
Image analysis
Two radiologists (with 8 and 9 years experience in abdominal imaging) with no prior knowledge of detailed clinical information and histopathological results, reviewed MR images independently. Consensus was reached through discussion or by referral to a third radiologist (with 13 years experience in abdominal imaging). The following imaging findings were analyzed: tumor size, location, margin (well-defined vs ill-defined), texture, local invasion or metastases, pancreatic atrophy, pancreatic duct dilatation, signal intensity of the tumor related to the adjacent parenchyma (hypo-, iso- or hyperintense), tumor enhancement (hyper- or hypo-enhancement), and presence of restricted diffusion.
A well-defined margin indicated a smooth and visible margin, while an ill-defined margin indicated spiculation or infiltration on >90° of the tumor parameter. Tumor texture was divided into solid (an enhancing solid component of more than 90%), predominantly solid (an enhancing solid component of 50%–90%), and predominantly cystic (an enhancing solid component of <50%).29 Local invasion or metastases referred to extrapancreatic localizations, including vascular or lymph node invasion, spleen invasion, or liver metastases, etc. Pancreatic atrophy was reported when more than the expected loss in pancreatic volume was noted. Pancreatic duct dilatation was defined as a main pancreatic duct of 4 mm or greater. Hyper- or hypo-enhancement was defined as solid components of the tumor showing greater or lower enhancement level compared to the adjacent pancreatic parenchyma at the arterial phase. Restricted diffusion within the tumor was defined as the lesion showing hyper-intensity on DWI (b=1,000 mm2/s) with corresponding hypo-intensity on the ADC maps.25
MRI TA
Preoperative axial T2WI and DWI (b value =1,000 mm2/s) maps were exported in DICOM format from the picture archiving and communication system to Omni-Kinetics software (Omni-Kinetics Version V2.0.10, GE Healthcare) to extract texture features. Prior to TA, image quality had been visually evaluated to avoid severe artifacts and mismatches between images. Two radiologists manually drew the regions of interest (ROIs) along the margin of the tumor avoiding peripheral fat, artifacts, and blood vessels in order to get rid of partial volume effect on both T2WI and DWI (Figure 2). For iso-dense tumors on T2WI maps, contrast-enhanced sequences and DWI were referred for tumor margin identification. For each lesion, we drew the ROIs by slice-by-slice segmentation of the whole tumor on each sequence. A total of 68 features were automatically extracted from T2WI or DWI maps. They were separated into five categories: 1) first-order statistics; 2) histogram; 3) gray-level co-occurrence matrix; 4) Haralick; and 5) run-length matrix.
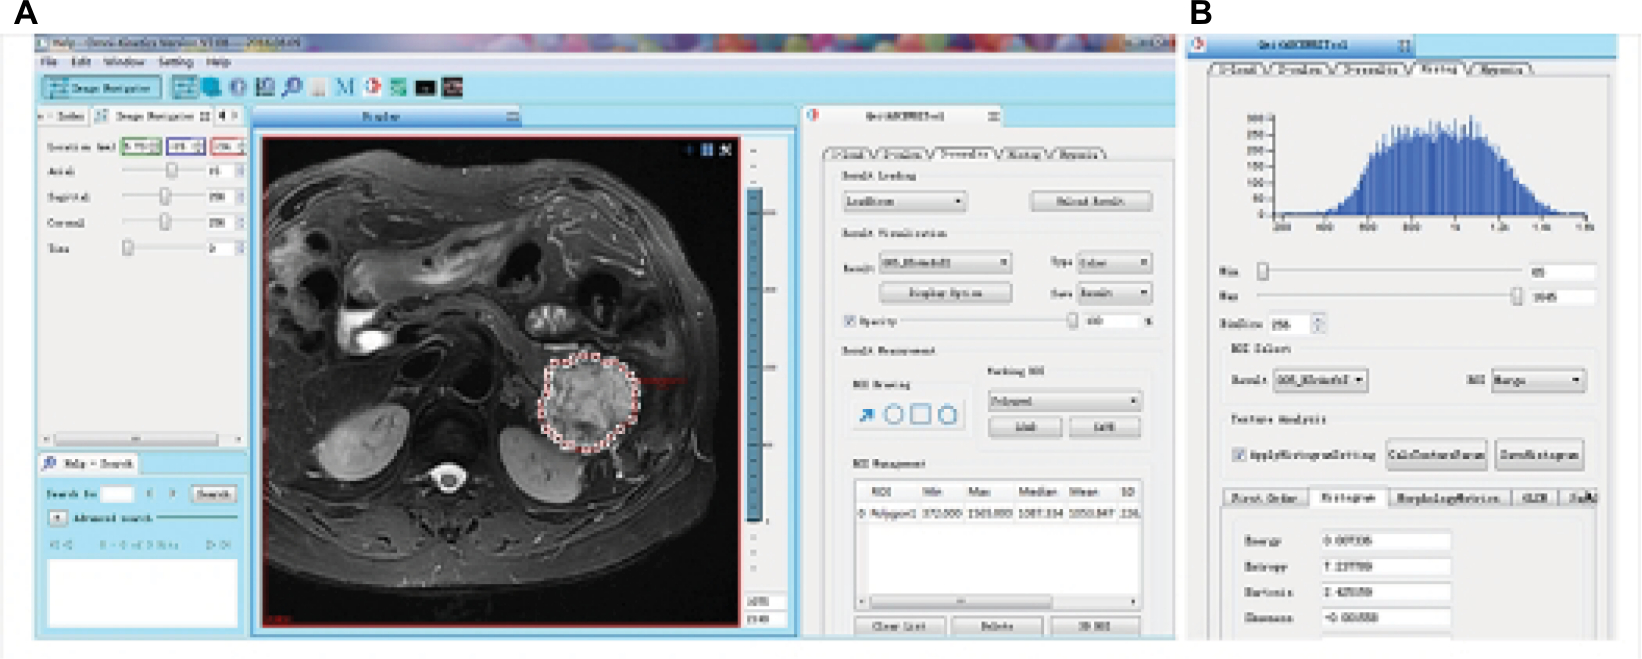 | Figure 2 Example of T2WI images showing segmentation of pancreatic neuroendocrine tumors. Notes: Manual segmentation of the tumor was delineated by stacking up regions of interest slice-by-slice on the axial T2WI images (A). Histogram of the tumor on T2WI images (B). Abbreviation: T2WI, T2-weighted imaging. |
Pathological analysis
The tumor specimens were fixed in 10% formalin for 24 hours. Then the specimens were embedded in paraffin and sectioned for H&E staining (each slice was 4 µm thick). Immunohistochemical analysis of CgA, NSE, and Syn was used to confirm the histological diagnosis by a pathologist (with 18 years experience in biliary and pancreatic pathology). Pathological tumor grades of PNETs were determined by counting the number of mitoses per 10 HPF and detecting the Ki-67 proliferation index according to the WHO 2017 classification.5 PNET G1: <2 mitoses per 10 HPF, Ki-67 index <2; PNET G2: 2–20 mitoses per 10 HPF, Ki-67 index 3%–20%; G3:>20 mitoses per 10 HPF, Ki-67 index >20%.
Statistical analysis
Quantitative data were shown as mean ± SD and qualitative data were expressed as numbers (percentage). Patient demographics and MRI findings were compared among three different histopathologic subtypes by using Fisher’s exact tests. Inter-observer agreement for texture features was calculated using interclass correlation coefficient (ICC). ICC values ≤40% indicated poor agreement; 41%–60%, moderate agreement; 61%–75%, substantial agreement; and >75%, perfect agreement. T2WI or DWI texture parameters were compared a cross all three histological grades of PNETs (eg, G1 vs G2, G1 vs G3, or G2 vs G3) by using Kruskal–Wallis test with Bonferroni correction (P=0.5/3=0.017). Parameters with a P-value <0.017 were used as the input variables for logistic regression analysis. In logistic regression analysis, a backward stepwise selection mode was adopted, with iterative entry of variables based on test results. Multi-collinearity features were eliminated when the variance inflation factor (VIF) was larger than ten.30 ROC curves were performed to investigate the diagnostic performance of logistic regression model in PNET grading. The AUC was calculated for each logistic regression model, and optimal threshold was obtained by maximizing the Youden index (add the sensitivity of a diagnostic test to the specificity of the same diagnostic test, then subtract 100 from that value). All statistical analyses were performed using SPSS software (version 20.0; IBM Corporation, Armonk, NY, USA). Unless otherwise specified, P<0.05 was considered to indicate a statistical significance.
Results
Seventy-seven patients with pathologically confirmed PNETs were analyzed (Table 1). The histopathologic results showed that, of the 77 PNETs, 31 tumors (40.3%) were classified as G1, 29 (37.7%) as G2, and 17 (22%) as G3. Among these 77 neoplasms, 44.2% (34/77) were found at the head or neck of the pancreas, 27.2% (21/77) at the body, and 28.6% (22/77) at the tail. The mean size of all tumors (mean ± SD) was 2.42±0.67 cm. There was a significant difference among G1, G2, and G3 PNETs with respect to the mean size of tumors (1.88±0.39 cm vs 2.52±0.47 cm vs 3.23±0.43 cm, P<0.001).
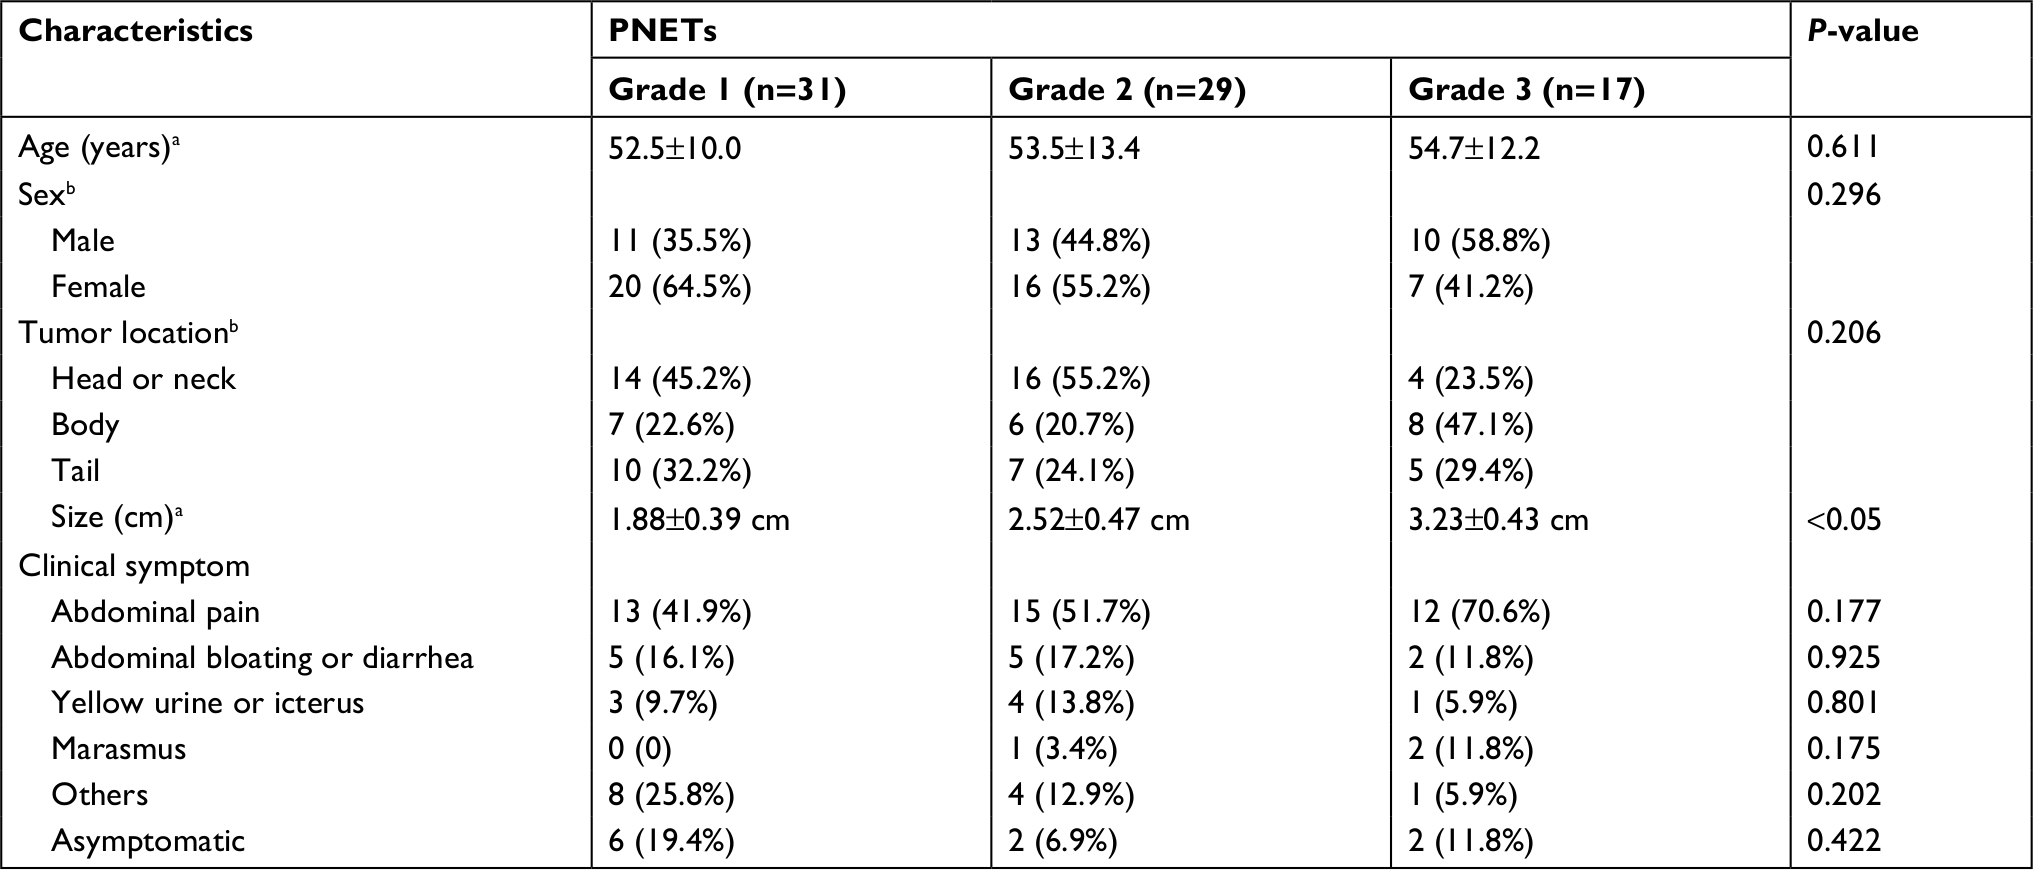 | Table 1 Demographic characteristics of patients with pancreatic neuroendocrine tumors (PNETs) Notes: aData are mean ± SD. P-value was calculated with one-way analysis of variance. bData are number of patients, with the percentage in parentheses. P-value was calculated with chi-squared or Fisher’s exact test. |
MRI findings
Table 2 summarizes the MRI findings of PNETs according to the tumor grade. There were significant differences among G1, G2, and G3 PNETs with respect to ill-defined margin (29% vs 58.6% vs 70.6%, P=0.01) and local invasion or metastases (0 vs 31% vs 41.2%, P<0.05). G3 demonstrated a higher frequency of a predominantly solid tumor type compared with G1/G2 tumors (64.7% vs 37.9% vs 22.6%, P=0.016). There was a significant difference of tumor enhancement at the arterial phase among G1, G2, and G3 PNETs (87.1% vs 41.4% vs 0, P<0.05). Figures 3 and 4 are typical cases of G1 and G3 PNETs.
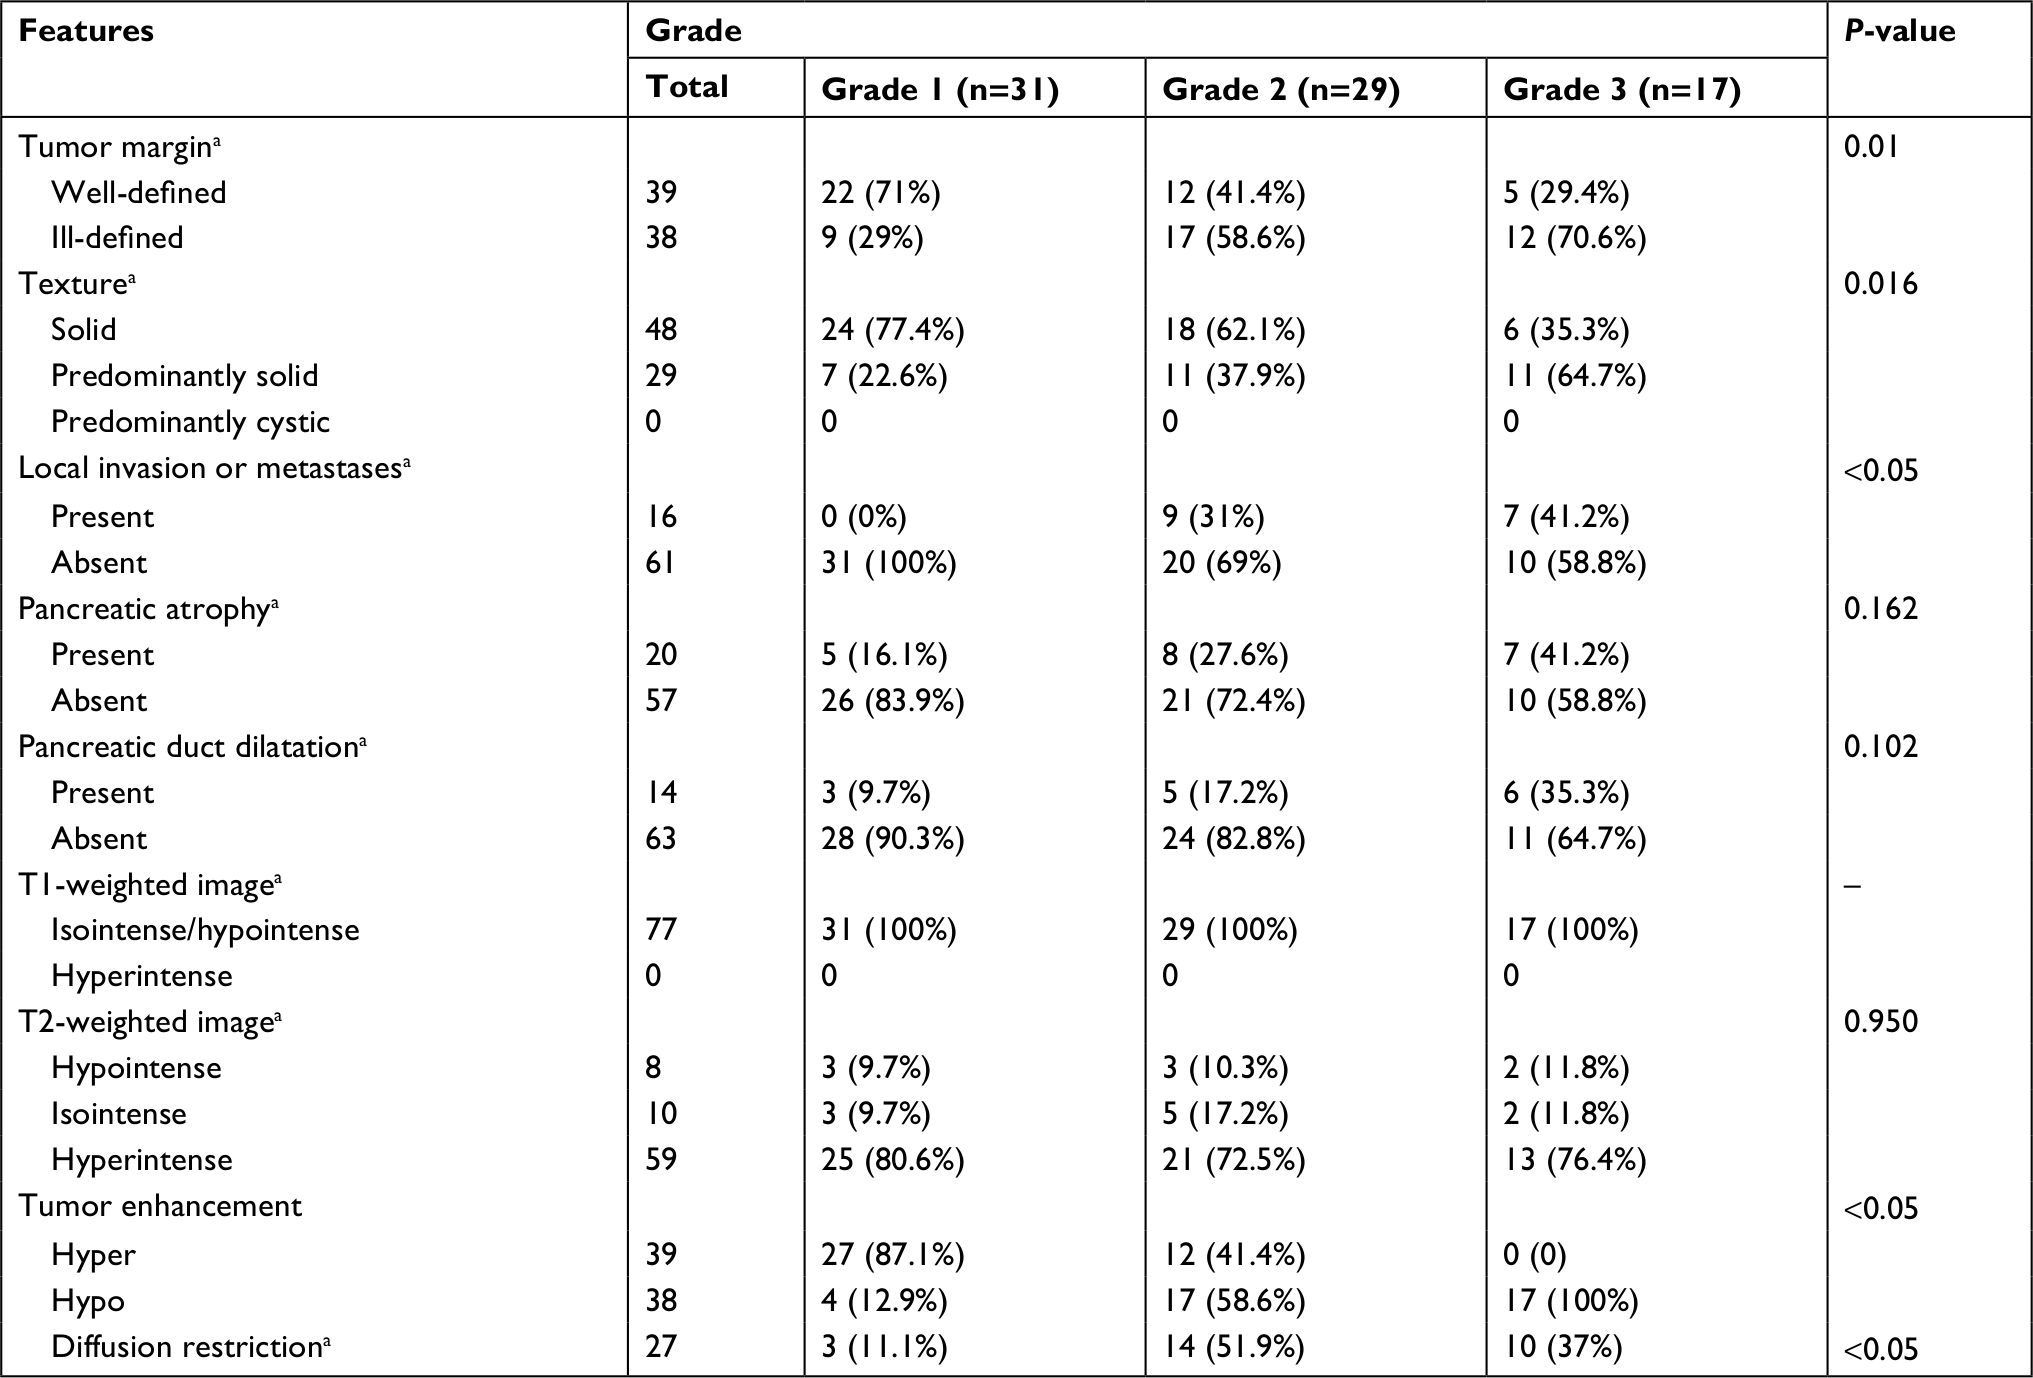 | Table 2 Magnetic resonance imaging findings and signal intensity of pancreatic neuroendocrine tumors based on tumor grade Notes: aData are number of patients, with the percentage in parentheses. P-value was calculated with chi-squared or Fisher’s exact test. |
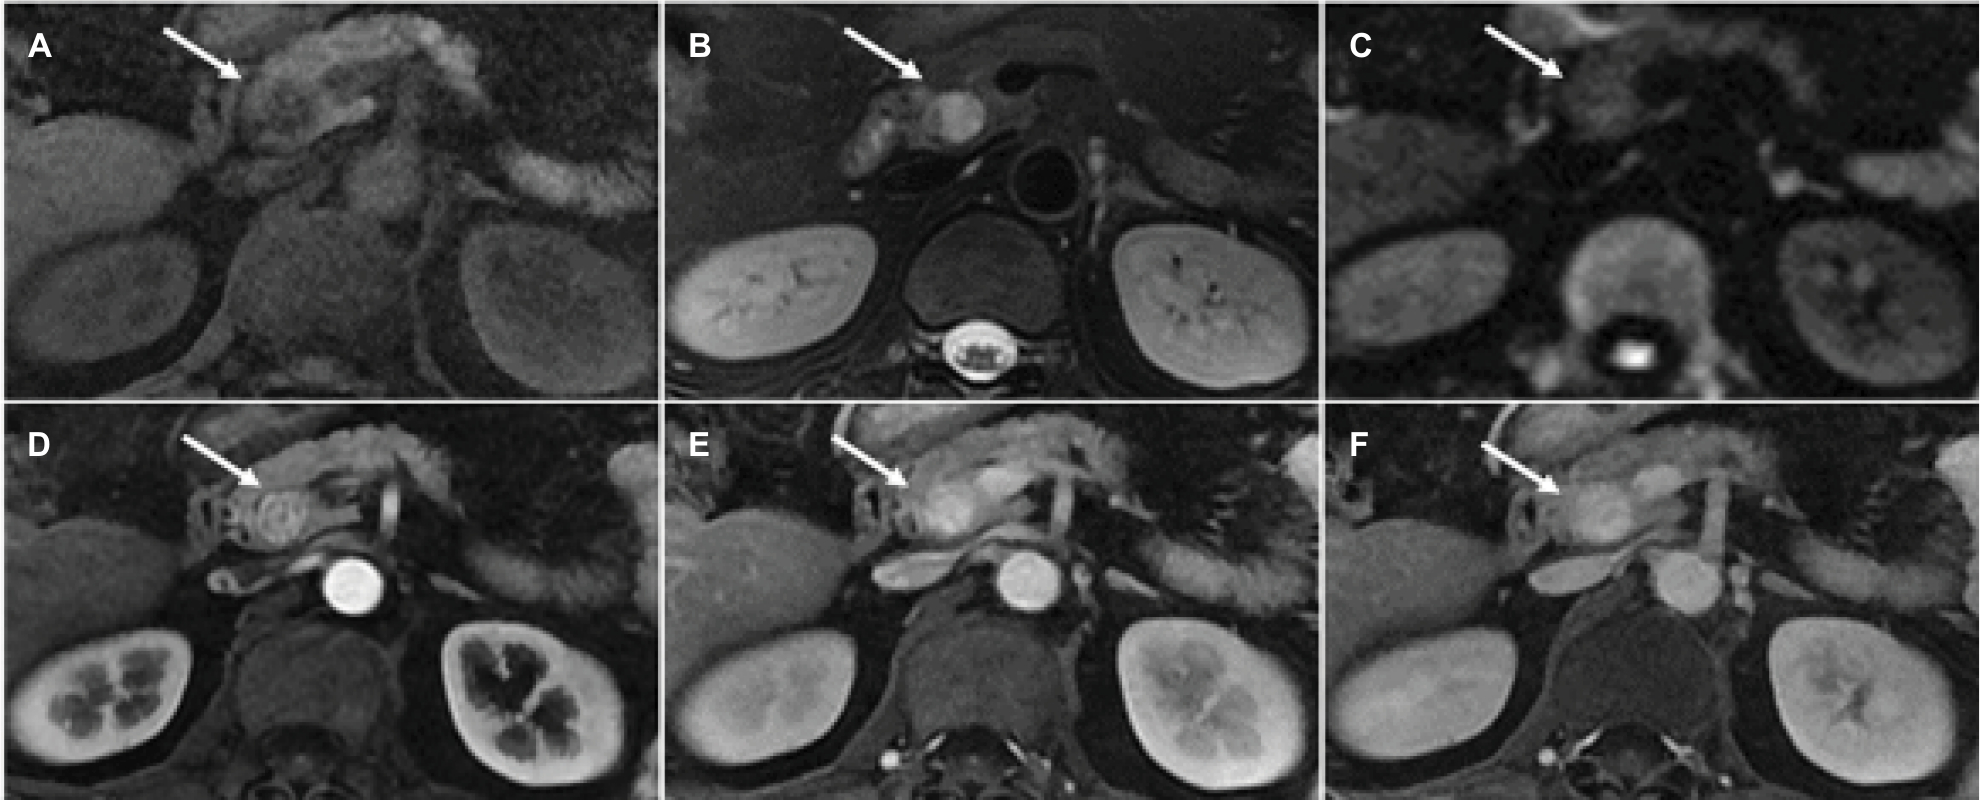 | Figure 3 Magnetic resonance images of a 58-year-old woman with pancreatic neuroendocrine tumor Grade 1. Notes: Fat-suppressed liver acquisition with volume acceleration sequence. T1- (A) and T2- (B) weighted imaging, a well-defined mass (arrows) located in the uncinate process of pancreas shows hypo-intensity and hyper-intensity, respectively. Diffusion-weighted images shows the tumor (arrow) was isointense (C). The tumor (arrows) shows persistent hyper-enhancement during the arterial (D), portal venous (E), and delayed (F) phase. |
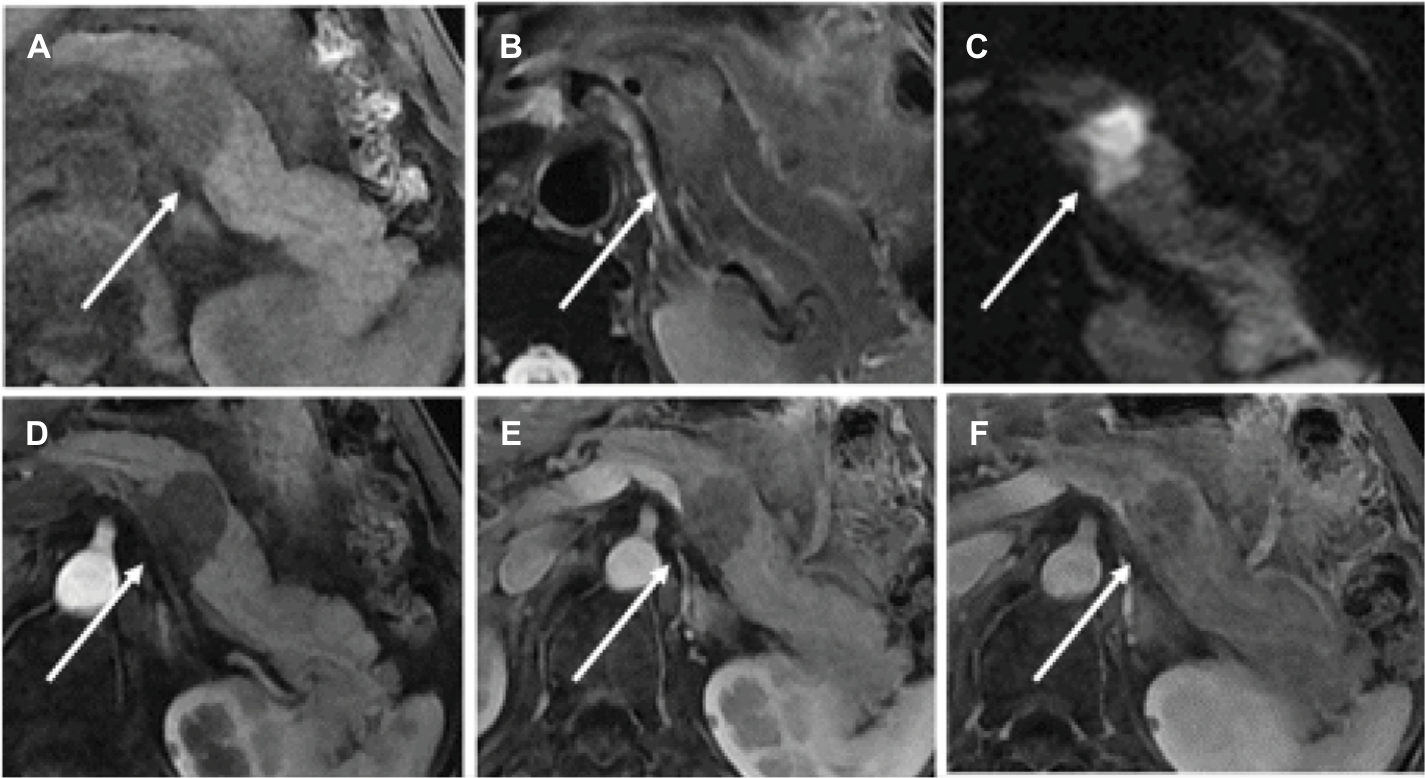 | Figure 4 Magnetic resonance images of a 64-year-old woman with pancreatic neuroendocrine tumor Grade 3. Notes: Fat-suppressed liver acquisition with volume acceleration sequence. T1- (A) and T2- (B) weighted imaging, a well-defined mass (arrows) located in the body of pancreas shows hypo-intensity and slight hyper-intensity, respectively. Diffusion-weighted images shows the tumor (arrow) was hyper-intense (C). The tumor (arrows) shows persistent hypo-enhancement during the arterial (D), portal venous (E), and delayed (F) phase. |
MRI TA
ICCs regarding texture features were calculated, and those features with ICCs larger than 0.75 were kept. T2WI and DWI texture features among different grades of PNETs were compared, and 22 T2WI and 37 DWI texture features showed significant differences among PNETs after Kruskal–Wallis test with Bonferroni correction (Tables S1 and S2). After assessment of VIF, there remained six (G1 vs G2), four (G1 vs G3), and four (G2 vs G3) T2WI texture features, and ten (G1 vs G2), six (G1 vs G3), and two (G2 vs G3) DWI texture features for multivariate logistic regression.
Multivariate logistic regression analyses for prediction of PNET grade based on T2WI and DWI texture features are shown in Tables 3 and 4, respectively. ROC curves and AUCs of predicting models in PNETs’ grading are demonstrated in Figure S1. On T2WI, inverse difference moment (OR =1.768; 95% CI, 1.322–2.364; P<0.001] was proven to be an independent predictor of pathologic grade between G1 and G2 tumors. The AUC was 0.833 (95% CI: 0.725–0.941) and the cut-off value was –0.2 with 87.1% sensitivity and 75.9% specificity. Energy (OR =3.546; 95% CI, 0.554–22.675; P=0.052), correlation (OR =2.563; 95% CI, 1.352–4.859; P=0.004), and differenceEntropy (OR =0.013; 95% CI, 0.001–0.184; P<0.001) were independent predictors of pathologic grade between G1 and G3 tumors. The AUC was 0.989 (95% CI: 0.970–1.0) and the cut-off value was –1.358 with 93.5% sensitivity and 100% specificity. DifferenceEntropy (OR =17.166; 95% CI, 2.42–121.764; P=0.004) was proven to be an independent predictor of pathologic grade between G2 and G3 tumors. The AUC was 0.813 (95% CI: 0.69–0.937) and the cut-off value was –0.711 with 69% sensitivity and 82.4% specificity.
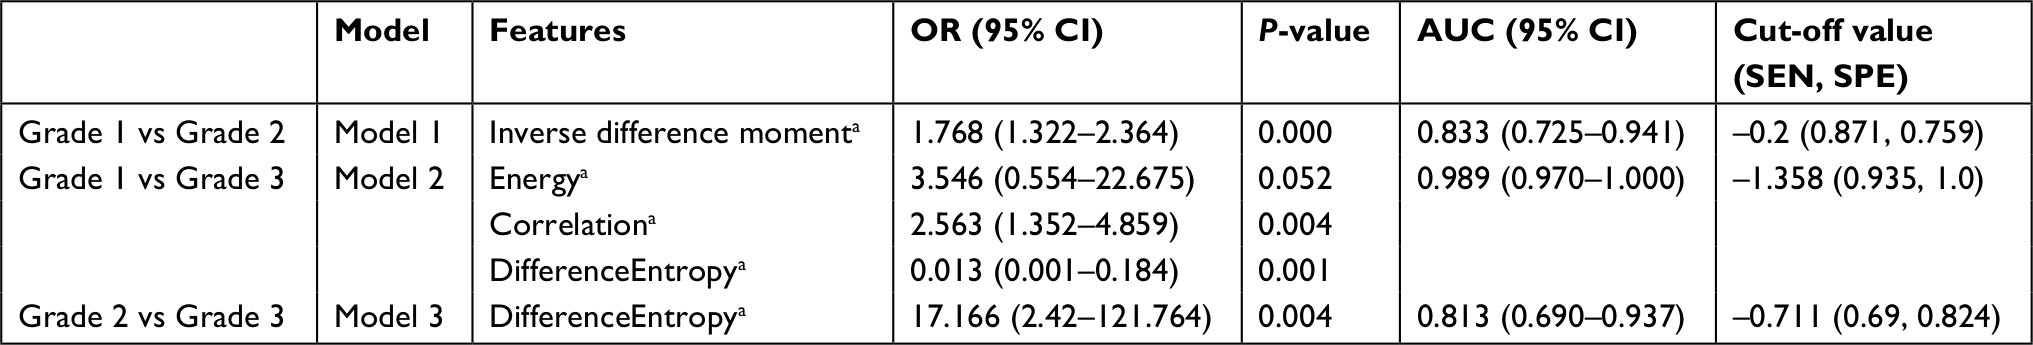 | Table 3 Multivariate logistic regression models for prediction of pancreatic neuroendocrine tumor grade with T2WI texture features Note: aData are adjusted ORs per one SD change. Abbreviations: SEN, sensitivity; SPE, specificity; T2WI, T2-weighted imaging. |
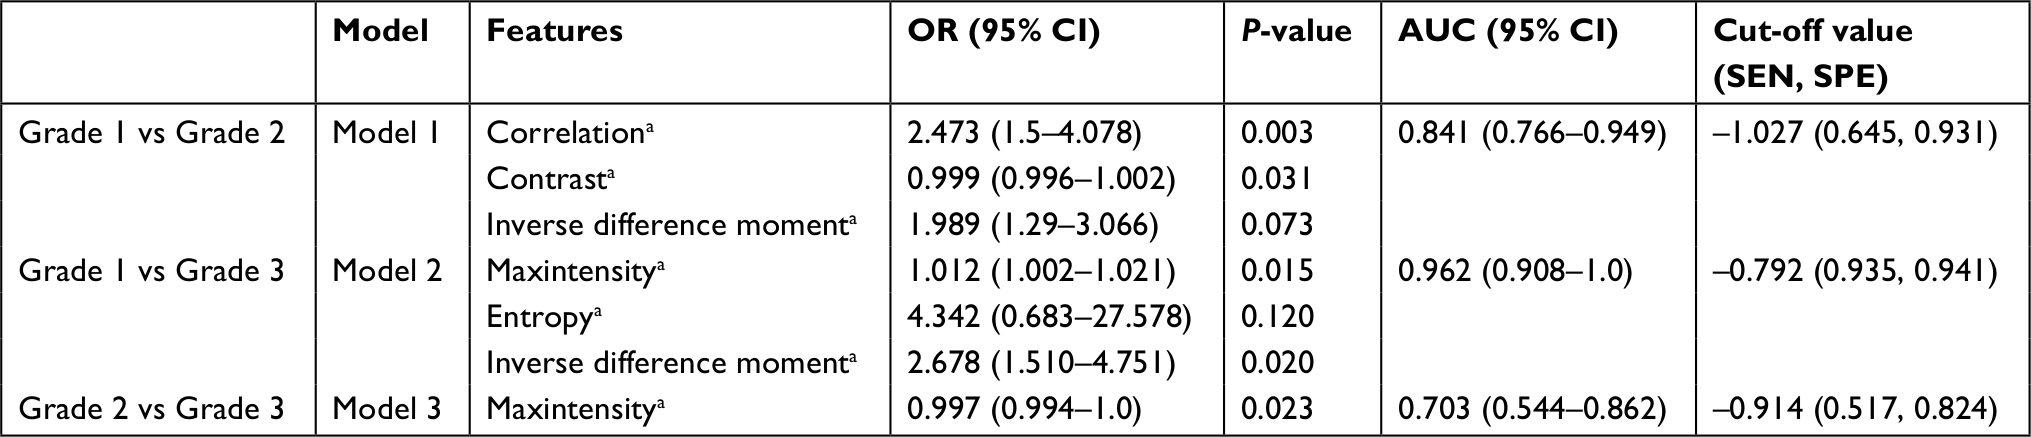 | Table 4 Multivariate logistic regression models for prediction of pancreatic neuroendocrine tumor grade with DWI texture features Note: aData are adjusted ORs per one SD change. Abbreviations: DWI, diffusion-weighted imaging; SEN, sensitivity; SPE, specificity. |
On DWI, correlation (OR =2.473; 95% CI, 1.5–4.078; P=0.003), contrast (OR =0.999; 95% CI, 0.996–1.002; P=0.031), and inverse difference moment (OR =1.989; 95% CI, 1.29–3.066; P=0.073) were independent predictors of pathologic grade between G1 and G2 tumors. The AUC was 0.841 (95% CI: 0.766–0.949) and the cut-off value was –1.027 with 64.5% sensitivity and 93.1% specificity. Maxintensity (OR =1.012; 95% CI, 1.002–1.021; P=0.015), entropy (OR =4.324; 95% CI, 0.683–27.578; P=0.12), and inverse difference moment (OR =2.678; 95% CI, 1.51–4.751; P=0.02) were independent predictors of pathologic grade between G1 and G3 tumors. The AUC was 0.962 (95% CI: 0.908–1.0) and the cut-off value was –0.792 with 93.5% sensitivity and 94.1% specificity. Maxintensity (OR =0.997; 95% CI, 0.994–1.0; P=0.023) was proven to be an independent predictor of pathologic grade between G2 and G3 tumors. The AUC was 0.703 (95% CI: 0.544–0.862) and the cut-off value was –0.914 with 51.7% sensitivity and 82.4% specificity.
Discussion
Tumor grade has been described as a useful predictor of clinical outcome after surgical resection for PNETs,31 which is associated with treatment strategy.13 Accurate pretreatment grading of the tumor is vital in determining an efficient treatment strategy for PNETs. Invasive methods, such as fine-needle aspiration, have a limited accuracy in accurately diagnosing G3 tumors, because a small tissue sample may not represent the tumor hotspot (regions which had the largest mitotic count or Ki-67 index).32 Radiologic imaging may have great potential not only in PNET grading, but also in estimating the tumor aggressiveness and deciding the treatment plan before surgery. In the present study, we showed that MRI findings, such as tumor margin or tumor enhancement, can aid in predicting the histopathologic grade of PNETs. In addition, our data indicate that four T2-based (inverse difference moment, energy, correlation, and differenceEntropy) and five DWI-based (correlation, contrast, inverse difference moment, maxintensity , and entropy) TA parameters can also assist in PNET grading. The AUCs of six predicting models on T2WI and DWI ranged from 0.703–0.989.
Previous studies have identified several MRI features that can predict the histopathologic grades of PNETs. Besides well-established criteria such as local invasion or metastases and infiltration of vessels, other features associated with high tumor grade are ill-defined margin, larger tumor size, and hypo-enhancement pattern at the arterial phase. De Robertis et al13 reported that an ill-defined margin and significantly lower mean ADC value were valuable predictors for G2/G3 tumors. Canellas et al33 found that G2/G3 tumors had larger tumor size (>2.0 cm), iso- or hypo- intensity on T2WI, presence of pancreatic ductal dilatation, and restricted diffusion within the tumor compared to G1 tumors. Similar results were observed in our study. Jang et al34 showed that hyper-enhancement at the arterial phase was more common in G1 compared with G2/G3 tumors. In our study, 87.1% of G1 tumors demonstrated a hyper-enhancement pattern compared with G2 (41.4%) or G3 tumors (0%), which is consistent with a previous study.34
TA provides an objective, quantitative assessment of tumor heterogeneity by analyzing the distribution and relationship of pixel or voxel gray levels in the image.35 Tumors with high intratumoral heterogeneity tend to show a poorer prognosis or higher histopathologic grade.36 Entropy is a measure of randomness of intensity images, which shows the degree of non-uniformity or complexity of the texture in the image. Canellas et al23 reported that the odds of a tumor with high entropy values being an intermediate- or high-grade PNET were 3.7 times as high as those in tumors with low entropy values in CT TA. Energy is a measure of the intensity level distribution, which reflects the evenness of the gray level distribution and the grainy thickness of the image. If the value is high, then the distribution will present a small number of intensity levels. Kurtosis is a measure of whether the data are peaked or flat relative to a normal distribution. A high kurtosis means a distinct peak near the mean, a rapid decline, and heavy tails.37 Pereira et al38 demonstrated that G3 tumors had higher skewness and higher kurtosis compared with G1 tumors in histogram analysis of ADC. In our study, G2/G3 tumors showed higher entropy, higher kurtosis, lower energy, and higher maxintensity, which, in general, represent increased heterogeneity, which was consistent with previous reports.23,38 In addition, Choi et al11 also investigated the value of CT TA in PNET grading, which also showed the potential of TA in differentiation of tumor grades. Liu et al36 investigated and compared CT texture parameters between intermediate and high-grade lung adenocarcinoma, and they found high-grade lung adenocarcinoma has lower correlation and higher contrast. However, in our study, G2/G3 tumors showed higher correlation and lower contrast compared with G1 tumors. Therefore, we speculate contrast and correlation may be predictors of histopathologic grade of tumors, but the relation between the two parameters and PNETs may require more validation studies.
To the best of our knowledge, other modalities, such as CT, single photon emission computed tomography-somatostatin receptor scintigraphy (SRS) (Octreoscan®), and 68Ga-DOTATOC positron emission tomography (PET)/CT, are also valuable in PNET grading.39 Dromain et al40 reported that Octreoscan is useful for PNET staging, detection of disease recurrence, or selecting patient candidates for peptide receptor radiometabolic treatment. In addition, Cloyd et al41 demonstrated that higher grade PNETs can be suspected preoperatively based on the presence of PET avidity and lack of Octreoscan uptake. Therefore, further studies addressing multimodal imaging or combination of MRI and PET/CT or SRS should be conducted.
Limitations
Our study has several limitations. First, there may have been selection bias due to the retrospective nature of the study. Second, only T2WI and DWI sequences were analyzed. Further studies about other sequences, such as contrast-enhanced images or ADC maps are needed. Third, we could not obtain inter-observer variability of the qualitative image analysis due to the consensus review by radiologists, despite the minor discrepancy during imaging analysis between two radiologists. Fourth, 3-T scanner from only one manufacturer was used in our study and it is unclear whether the results can be generalized to all manufacturers. Finally, although we built predicting models for PNET grading, we could not perform a validation test because we could not collect sufficient data on PNETs in a short term.
Conclusion
The current study indicated that MRI features, including tumor margin, texture, local invasion or metastases, tumor enhancement, and diffusion restriction, are useful for the prediction of histopathologic grade of PNETs. Notably, we also demonstrated that MRI texture parameters, such as inverse difference moment, differenceEntropy, maxintensity, entropy, and energy can aid in the prediction of PNET grading.
Ethics statement
This study was approved by the Ethical Committee of the Affiliated Hospital of Nanjing University of Chinese Medicine and patient informed consent requirement was waived due to its retrospective nature. Patient data confidentiality was protected in accordance with the Declaration of Helsinki principles.
Acknowledgments
We thank all authors for their continuous and excellent support with patient data collection, imaging analysis, statistical analysis, and valuable suggestions for the article. This work was supported by the National Natural Science Foundation of China (81771899) and the Key Program of Research and Development of Jiangsu Province (BE2017772).
Disclosure
The authors report no conflicts of interest in this work.
References
Ramage JK, Ahmed A, Ardill J, et al. Guidelines for the management of gastroenteropancreatic neuroendocrine (including carcinoid) tumours (NETs). Gut. 2012;61(1):6–32. | ||
Kang J, Ryu JK, Son JH, et al. Association between pathologic grade and multiphase computed tomography enhancement in pancreatic neuroendocrine neoplasm. J Gastroenterol Hepatol. Epub 2018 Mar 7. | ||
Turaga KK, Kvols LK. Recent progress in the understanding, diagnosis, and treatment of gastroenteropancreatic neuroendocrine tumors. CA Cancer J Clin. 2011;61(2):113–132. | ||
Zhou C, Zhang J, Zheng Y, Zhu Z. Pancreatic neuroendocrine tumors: a comprehensive review. Int J Cancer. 2012;131(5):1013–1022. | ||
Singhi AD, Klimstra DS. Well-differentiated pancreatic neuroendocrine tumours (PanNETs) and poorly differentiated pancreatic neuroendocrine carcinomas (PanNECs): concepts, issues and a practical diagnostic approach to high-grade (G3) cases. Histopathology. 2018;72(1):168–177. | ||
Belousova E, Karmazanovsky G, Kriger A, et al. Contrast-enhanced MDCT in patients with pancreatic neuroendocrine tumours: correlation with histological findings and diagnostic performance in differentiation between tumour grades. Clin Radiol. 2017;72(2):150–158. | ||
Poultsides GA, Huang LC, Chen Y, et al. Pancreatic neuroendocrine tumors: radiographic calcifications correlate with grade and metastasis. Ann Surg Oncol. 2012;19(7):2295–2303. | ||
Rha SE, Jung SE, Lee KH, Ku YM, Byun JY, Lee JM. CT and MR imaging findings of endocrine tumor of the pancreas according to WHO classification. Eur J Radiol. 2007;62(3):371–377. | ||
Manfredi R, Bonatti M, Mantovani W, et al. Non-hyperfunctioning neuroendocrine tumours of the pancreas: MR imaging appearance and correlation with their biological behaviour. Eur Radiol. 2013;23(11):3029–3039. | ||
Humphrey PE, Alessandrino F, Bellizzi AM, Mortele KJ. Non-hyperfunctioning pancreatic endocrine tumors: multimodality imaging features with histopathological correlation. Abdom Imaging. 2015;40(7):2398–2410. | ||
Kim JH, Eun HW, Kim YJ, Lee JM, Han JK, Choi BI. Pancreatic neuroendocrine tumour (PNET): staging accuracy of MDCT and its diagnostic performance for the differentiation of PNET with uncommon CT findings from pancreatic adenocarcinoma. Eur Radiol. 2016;26(5):1338–1347. | ||
Kim DW, Kim HJ, Kim KW, et al. Neuroendocrine neoplasms of the pancreas at dynamic enhanced CT: comparison between grade 3 neuroendocrine carcinoma and grade 1/2 neuroendocrine tumour. Eur Radiol. 2015;25(5):1375–1383. | ||
De Robertis R, Cingarlini S, Martini PT, et al. Pancreatic neuroendocrine neoplasms: Magnetic resonance imaging features according to grade and stage. World J Gastroenterol. 2017;23(2):275–285. | ||
Park HS, Kim SY, Hong SM, et al. Hypervascular solid-appearing serous cystic neoplasms of the pancreas: Differential diagnosis with neuroendocrine tumours. Eur Radiol. 2016;26(5):1348–1358. | ||
Dalah E, Erickson B, Oshima K, et al. Correlation of ADC with pathological treatment response for radiation therapy of pancreatic cancer. Transl Oncol. 2018;11(2):391–398. | ||
Lotfalizadeh E, Ronot M, Wagner M, et al. Prediction of pancreatic neuroendocrine tumour grade with MR imaging features: added value of diffusion-weighted imaging. Eur Radiol. 2017;27(4):1748–1759. | ||
Kim JH, Ko ES, Lim Y, et al. Breast cancer heterogeneity: MR imaging texture analysis and survival outcomes. Radiology. 2017;282(3):665–675. | ||
Hodgdon T, McInnes MD, Schieda N, Flood TA, Lamb L, Thornhill RE. Can quantitative CT texture analysis be used to differentiate Fat-poor renal angiomyolipoma from renal cell carcinoma on unenhanced CT images? Radiology. 2015;276(3):787–796. | ||
Raman SP, Chen Y, Schroeder JL, Huang P, Fishman EK. CT texture analysis of renal masses: pilot study using random forest classification for prediction of pathology. Acad Radiol. 2014;21(12):1587–1596. | ||
Juntu J, Sijbers J, De Backer S, Rajan J, van Dyck D. Machine learning study of several classifiers trained with texture analysis features to differentiate benign from malignant soft-tissue tumors in T1-MRI images. J Magn Reson Imaging. 2010;31(3):680–689. | ||
Bayanati H, Thornhill ER, Souza CA, et al. Quantitative CT texture and shape analysis: can it differentiate benign and malignant mediastinal lymph nodes in patients with primary lung cancer? Eur Radiol. 2015;25(2):480–487. | ||
Ahn SJ, Kim JH, Park SJ, Han JK. Prediction of the therapeutic response after FOLFOX and FOLFIRI treatment for patients with liver metastasis from colorectal cancer using computerized CT texture analysis. Eur J Radiol. 2016;85(10):1867–1874. | ||
Canellas R, Burk KS, Parakh A, Sahani DV. Prediction of pancreatic neuroendocrine tumor grade based on CT features and texture analysis. AJR Am J Roentgenol. 2018;210(2):341–346. | ||
Choi TW, Kim JH, Yu MH, Park SJ, Han JK. Pancreatic neuroendocrine tumor: prediction of the tumor grade using CT findings and computerized texture analysis. Acta Radiol. 2018;59(4):383–392. | ||
Niu XK, Chen ZF, Chen L, Li J, Peng T, Li X. Clinical application of biparametric MRI texture analysis for detection and evaluation of high-grade prostate cancer in zone-specific regions. AJR Am J Roentgenol. 2018;210(3):549–556. | ||
De Cecco CN, Ganeshan B, Ciolina M, et al. Texture analysis as imaging biomarker of tumoral response to neoadjuvant chemoradiotherapy in rectal cancer patients studied with 3-T magnetic resonance. Invest Radiol. 2015;50(4):239–245. | ||
Kassner A, Thornhill RE. Texture analysis: a review of neurologic MR imaging applications. AJNR Am J Neuroradiol. 2010;31(5):809–816. | ||
Herlidou-Même S, Constans JM, Carsin B, et al. MRI texture analysis on texture test objects, normal brain and intracranial tumors. Magn Reson Imaging. 2003;21(9):989–993. | ||
Ren S, Chen X, Wang J, et al. Differentiation of duodenal gastrointestinal stromal tumors from hypervascular pancreatic neuroendocrine tumors in the pancreatic head using contrast-enhanced computed tomography. Abdom Radiol. 2018. DOI: 10.1007/s00261-018-1803-x. | ||
Son JY, Lee HY, Lee KS, et al. Quantitative CT analysis of pulmonary ground-glass opacity nodules for the distinction of invasive adenocarcinoma from pre-invasive or minimally invasive adenocarcinoma. PLoS One. 2014;9(8):e104066–104068. | ||
Martin-Perez E, Capdevila J, Castellano D, et al. Prognostic factors and long-term outcome of pancreatic neuroendocrine neoplasms: Ki-67 index shows a greater impact on survival than disease stage. The large experience of the Spanish national tumor registry (RGETNE). Neuroendocrinology. 2013;98(2):156–168. | ||
Weiss VL, Kiernan C, Wright J, Merchant NB, Coogan AC, Shi C. Fine-needle Aspiration-Based grading of pancreatic neuroendocrine neoplasms using Ki-67: is accurate who grading possible on cytologic material? J Am Soc Cytopathol. 2018;7(3):154–159. | ||
Canellas R, Lo G, Bhowmik S, Ferrone C, Sahani D. Pancreatic neuroendocrine tumor: correlations between MRI features, tumor biology, and clinical outcome after surgery. J. Magn. Reson. Imaging. 2018;47(2):425–432. | ||
Jang KM, Kim SH, Lee SJ, Choi D. The value of gadoxetic acid-enhanced and diffusion-weighted MRI for prediction of grading of pancreatic neuroendocrine tumors. Acta Radiol. 2014;55(2):140–148. | ||
Lubner MG, Smith AD, Sandrasegaran K, Sahani DV, Pickhardt PJ. CT texture analysis: definitions, applications, biologic correlates, and challenges. Radiographics. 2017;37(5):1483–1503. | ||
Liu Y, Liu S, Qu F, Li Q, Cheng R, Ye Z. Tumor heterogeneity assessed by texture analysis on contrast-enhanced CT in lung adenocarcinoma: association with pathologic grade. Oncotarget. 2017;8(32):53664–53674. | ||
Ahn SJ, Choi SH, Kim YJ, et al. Histogram analysis of apparent diffusion coefficient map of standard and high B-value diffusion MR imaging in head and neck squamous cell carcinoma: a correlation study with histological grade. Acad Radiol. 2012;19(10):1233–1240. | ||
Pereira JA, Rosado E, Bali M, Metens T, Chao SL. Pancreatic neuroendocrine tumors: correlation between histogram analysis of apparent diffusion coefficient maps and tumor grade. Abdom Imaging. 2015;40(8):3122–3128. | ||
Lee DW, Kim MK, Kim HG. Diagnosis of pancreatic neuroendocrine tumors. Clin Endosc. 2017;50(6):537–545. | ||
Dromain C, Déandréis D, Scoazec JY, et al. Imaging of neuroendocrine tumors of the pancreas. Diagn Interv Imaging. 2016;97(12):1241–1257. | ||
Cloyd JM, Poultsides GA. Non-functional neuroendocrine tumors of the pancreas: advances in diagnosis and management. World J Gastroenterol. 2015;21(32):9512–9525. |
Supplementary materials
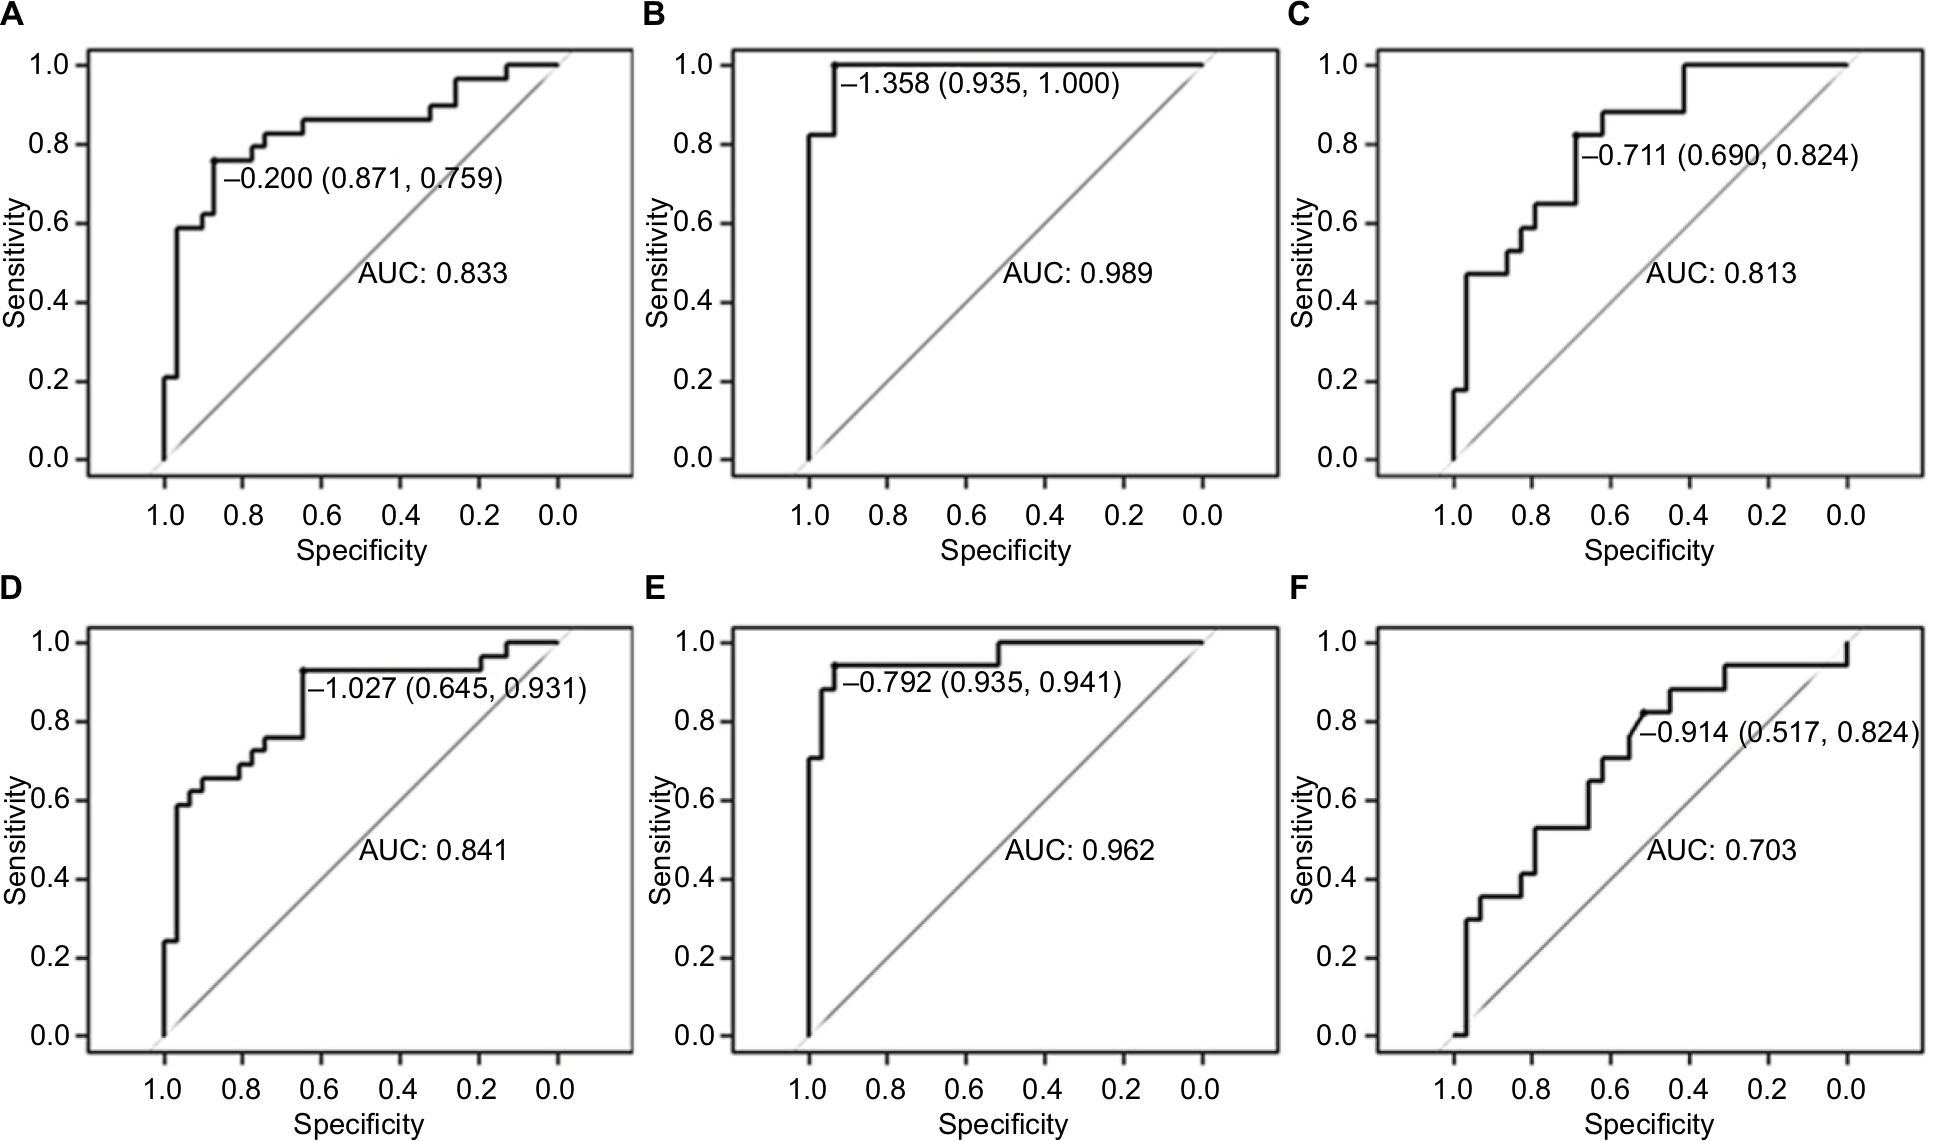 | Figure S1 ROC curves of the multivariate logistic regression models for prediction of PNET grade with T2WI (A, Grade 1 vs Grade 2; B, Grade 1 vs Grade 3; C, Grade 2 vs Grade 3) and DWI (D, Grade 1 vs Grade 2; E, Grade 1 vs Grade 3; F, Grade 2 vs Grade 3) texture features. The AUCs are 0.833, 0.989, 0.813, 0.841, 0.962, and 0.703, respectively. Abbreviations: PNET, pancreatic neuroendocrine tumors; T2WI, T2-weighted imaging; DWI, diffusion-weighted imaging. |
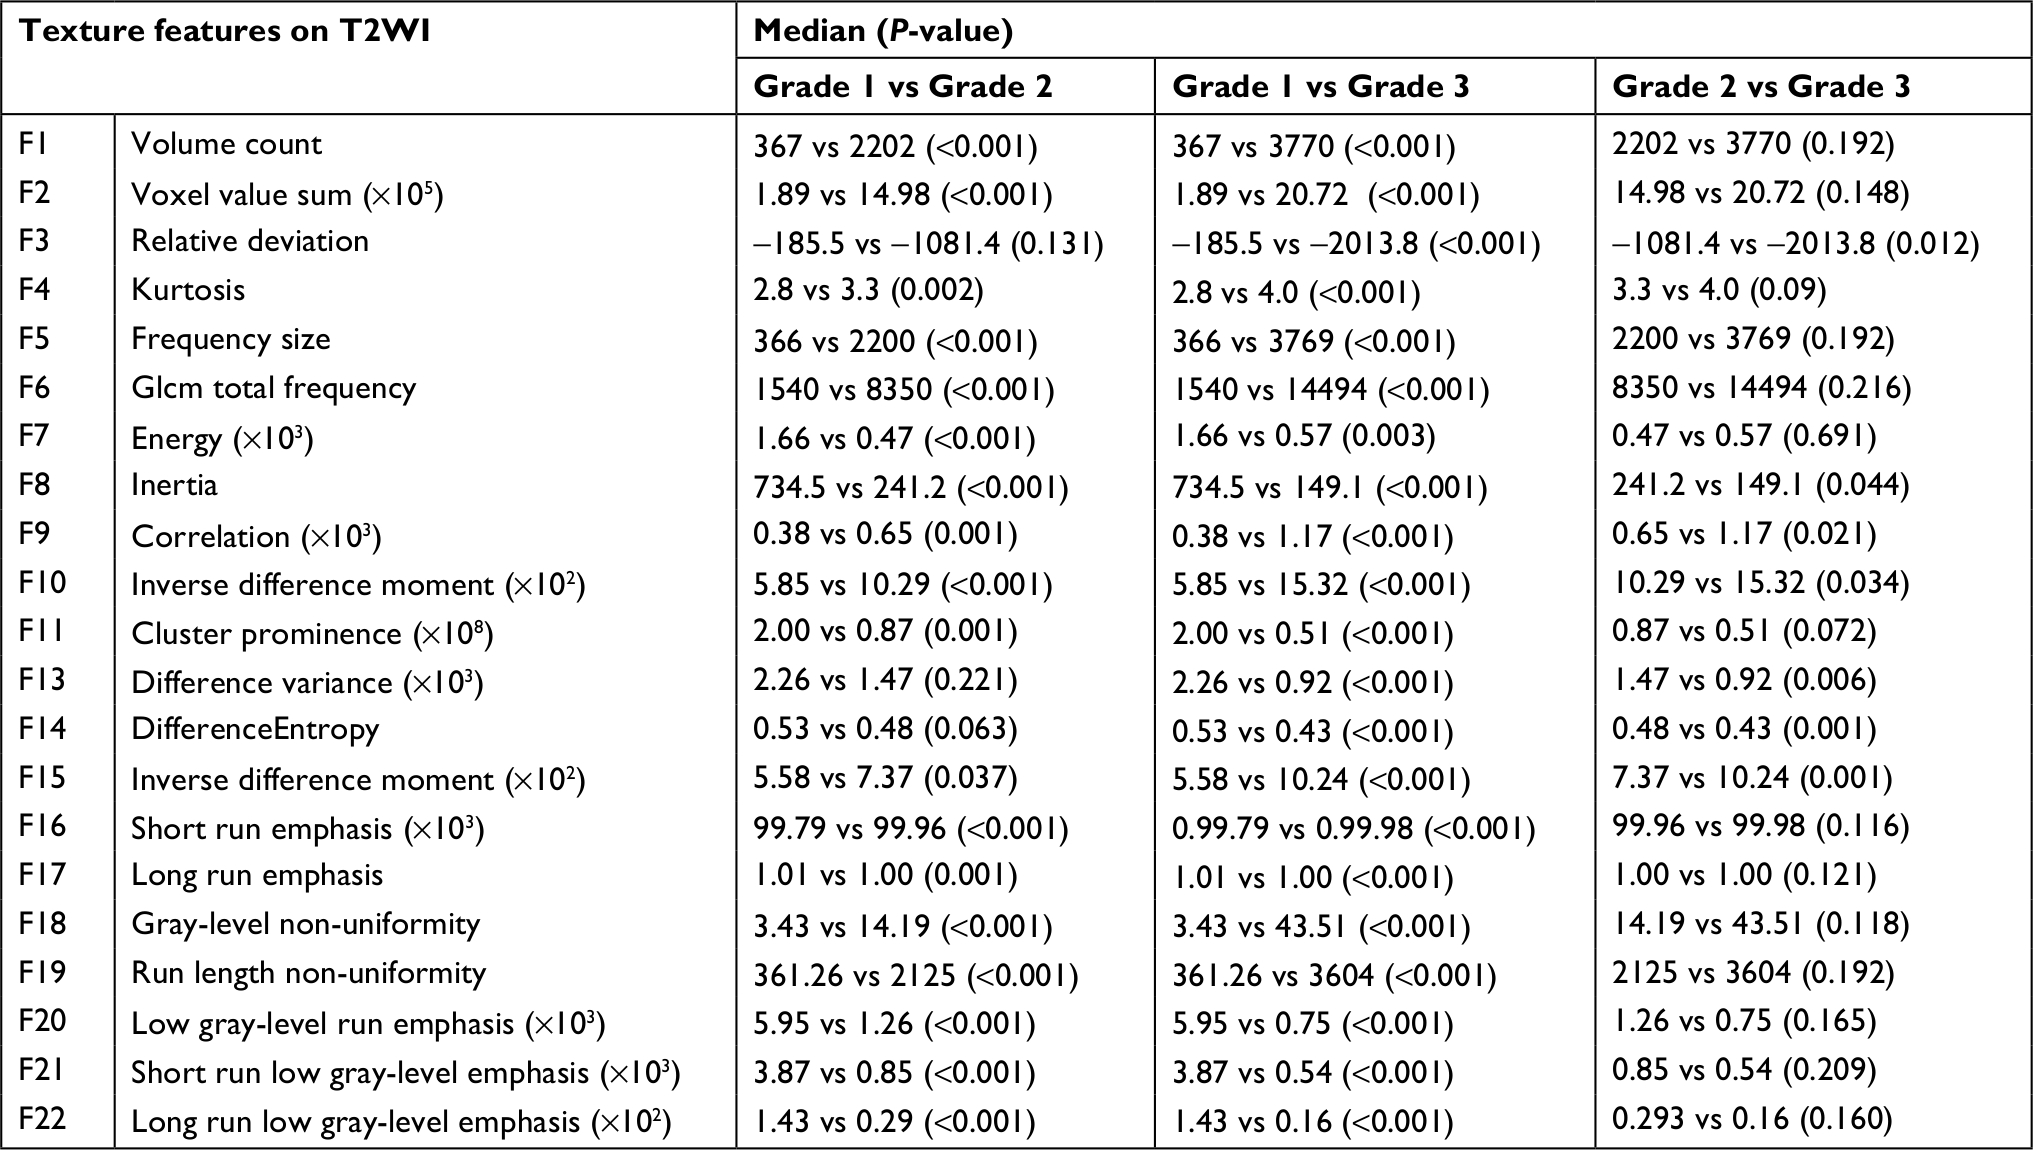 | Table S1 Comparisons of T2WI texture features among pancreatic neuroendocrine tumors (P-values, Kruskal–Wallis test with Bonferroni correction) Abbreviations: Glcm, Gray-Level Co-occurrence Matrix; T2WI, T2-weighted imaging. |
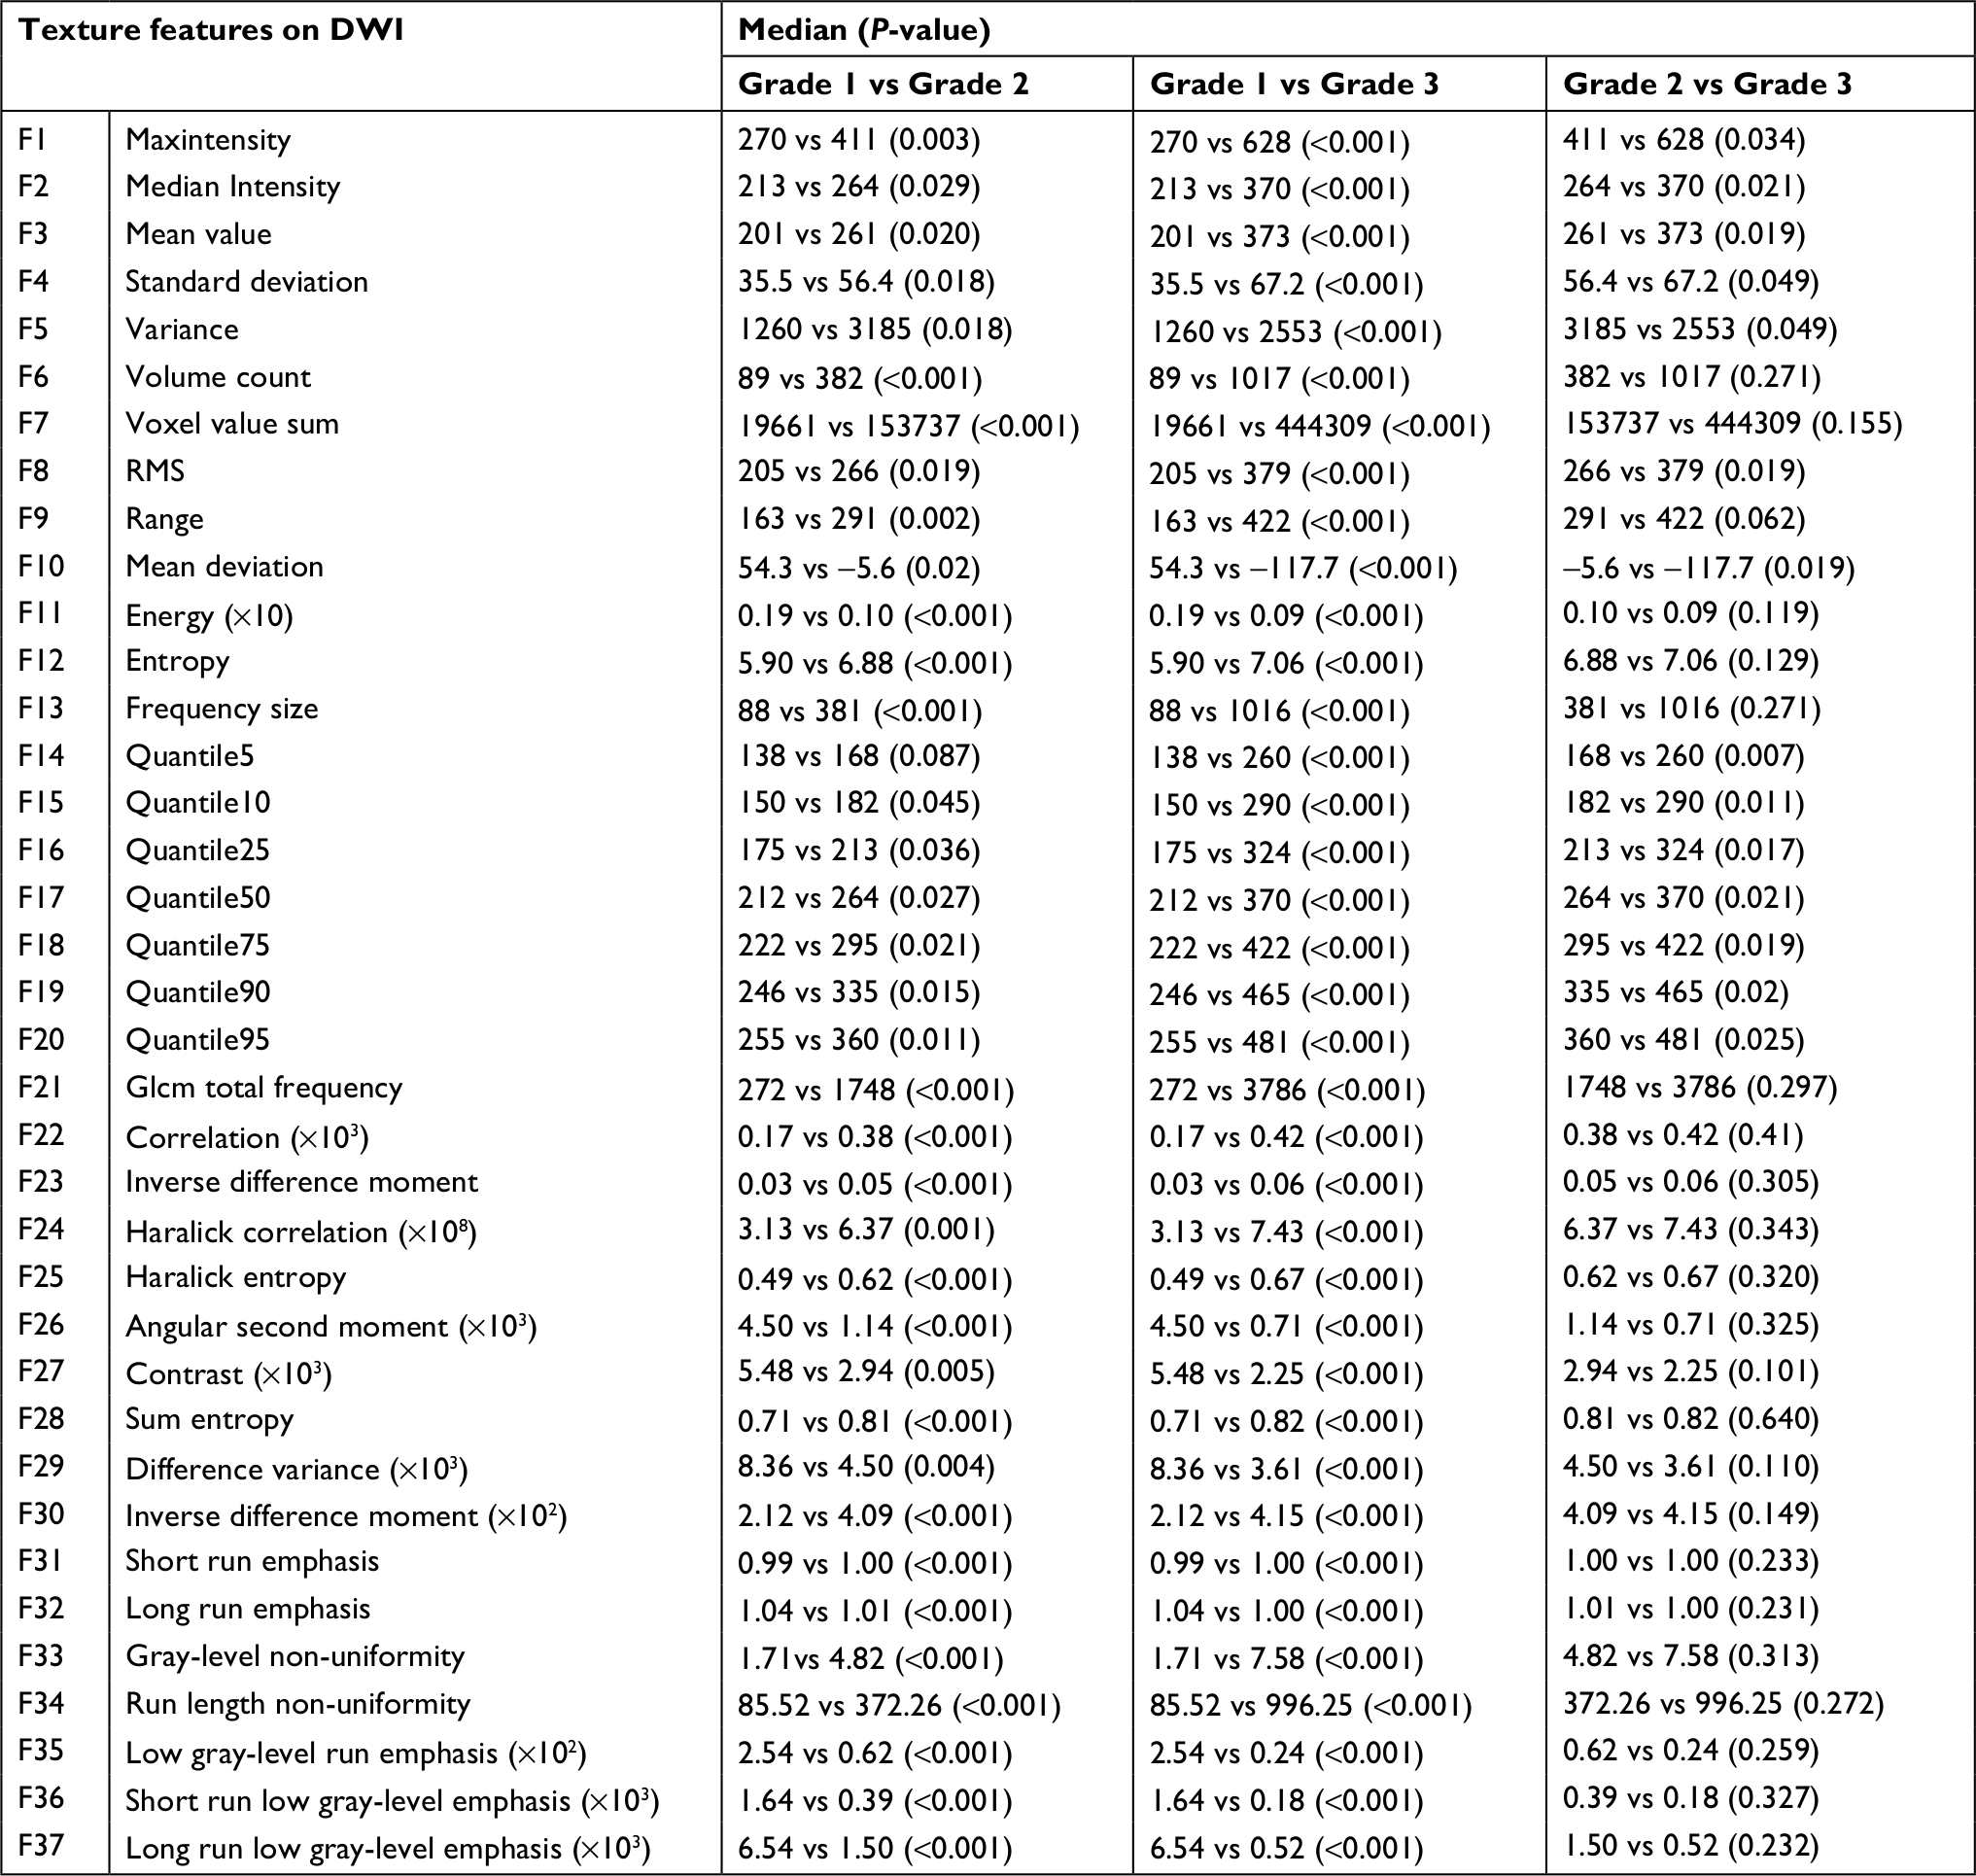 | Table S2 Comparisons of DWI texture features among pancreatic neuroendocrine tumors (P-values, Kruskal–Wallis test with Bonferroni correction) Abbreviations: DWI, diffusion-weighted imaging; Glcm, Gray-Level Co-occurrence Matrix; RMS, root mean square. |
 © 2019 The Author(s). This work is published and licensed by Dove Medical Press Limited. The full terms of this license are available at https://www.dovepress.com/terms.php and incorporate the Creative Commons Attribution - Non Commercial (unported, v3.0) License.
By accessing the work you hereby accept the Terms. Non-commercial uses of the work are permitted without any further permission from Dove Medical Press Limited, provided the work is properly attributed. For permission for commercial use of this work, please see paragraphs 4.2 and 5 of our Terms.
© 2019 The Author(s). This work is published and licensed by Dove Medical Press Limited. The full terms of this license are available at https://www.dovepress.com/terms.php and incorporate the Creative Commons Attribution - Non Commercial (unported, v3.0) License.
By accessing the work you hereby accept the Terms. Non-commercial uses of the work are permitted without any further permission from Dove Medical Press Limited, provided the work is properly attributed. For permission for commercial use of this work, please see paragraphs 4.2 and 5 of our Terms.