")
Back to Journals » Cancer Management and Research » Volume 11
Pancreatic Ductal Adenocarcinoma: Machine Learning–Based Quantitative Computed Tomography Texture Analysis For Prediction Of Histopathological Grade
Authors Qiu W, Duan N, Chen X, Ren S, Zhang Y, Wang Z, Chen R
Received 7 June 2019
Accepted for publication 15 October 2019
Published 30 October 2019 Volume 2019:11 Pages 9253—9264
DOI https://doi.org/10.2147/CMAR.S218414
Checked for plagiarism Yes
Review by Single anonymous peer review
Peer reviewer comments 2
Editor who approved publication: Professor Harikrishna Nakshatri
Wenli Qiu,1 Na Duan,1 Xiao Chen,1 Shuai Ren,1 Yifen Zhang,2 Zhongqiu Wang,1 Rong Chen3
1Department of Radiology, Affiliated Hospital of Nanjing University of Chinese Medicine, Nanjing, People’s Republic of China; 2Department of Pathology, Affiliated Hospital of Nanjing University of Chinese Medicine, Nanjing, People’s Republic of China; 3Department of Diagnostic Radiology and Nuclear Medicine, University of Maryland School of Medicine, Baltimore, MD, USA
Correspondence: Zhongqiu Wang
Department of Radiology, Affiliated Hospital of Nanjing University of Chinese Medicine, 155 Hanzhong Road, Nanjing 210029, Jiangsu Province, People’s Republic of China
Tel +86 25 8661 8472
Fax +86 25 8661 8139
Email [email protected]
Purpose: To assess the performance of combining computed tomography (CT) texture analysis with machine learning for discriminating different histopathological grades of pancreatic ductal adenocarcinoma (PDAC).
Methods: From July 2012 to August 2017, this retrospective study comprised 56 patients with confirmed histopathological PDAC (32 men, 24 women, mean age 64.04±7.82 years) who had undergone preoperative contrast-enhanced CT imaging within 1 month before surgery. Two radiologists blinded to the histopathological outcome independently segmented lesions for quantitative texture analysis. Histogram features, co-occurrence, and run-length texture were calculated. A support-vector machine was constructed to predict the pathological grade of PDAC based on preoperative texture features.
Results: Pathological analysis confirmed 37 low-grade PDAC (five well-differentiated/grade I and 32 moderately differentiated/grade II) and 19 high-grade PDAC (19 poorly differentiated/grade III) tumors. There were no significant differences in clinical or biological characteristics between patients with high-grade and low-grade tumors (P>0.05). There were significant differences between low-grade PDAC and high-grade PDAC on nine histogram features, seven run-length features, and two co-occurrence features. Cluster shade was the most important predictor (sensitivity 0.315). Using these texture features, the support-vector machine achieved 86% accuracy, 78% sensitivity, 95% and specificity.
Conclusion: Machine learning–based CT texture analysis accurately predicted histopathological differentiation grade of PDAC based on preoperative texture features, leading to maximization patient survival and achievement of personalized precision treatment.
Keywords: computed tomography, texture analysis, machine learning, pancreatic ductal adenocarcinoma, histopathological grade
Introduction
Pancreatic ductal adenocarcinoma (PDAC) is an aggressive disease with a 5-year survival rate of around 5%–7%.1,2 Despite advances in therapy, the 5-year survival rate of PDAC has not improved significantly. Given the poor prognosis of PDAC, further risk stratification is needed, which will help in developing more efficient treatment strategies.3 Histopathological subtype is considered a crucial factor in PDAC prognosis. Poor differentiation is an independent prognostic factor that affects overall survival.4 Poorly differentiated PDAC has higher aggression and shorter survival than well-differentiated PDAC.5,6 For short life–expectancy patients, the risks associated with surgical resection far outweigh the benefits, and may lead to a deterioration in quality of life.7,8 Nurmi et al found for poorly differentiated pancreatic cancer, neoadjuvant therapy could offer longer survival than upfront surgery.8 However, histopathological grade is usually determined after surgery and often unknown before treatment. To maximize patient survival and achieve personalized precision treatment, a noninvasive technique to differentiate histopathological subtypes of PDAC before treatment is urgently needed.
Contrast-enhanced computed tomography (CT) is the primary means of evaluating pancreatic diseases, due to its high temporal and spatial resolution.9,10 Although several studies have examined CT characteristics to predict the histopathological grade of cancer, accurate prediction of the histological grade of PDAC by CT examination alone is still limited. Choi et al showed that computerized texture analysis was useful for predicting the histopathological grade of pancreatic neuroendocrine tumors.11 Wang et al found that the histopathological differentiation grade of pancreatic tumors was negatively correlated with CT-enhancement degree at group level (rs=−0.784), but they could not predict the histopathological differentiation grade of pancreatic cancer at the individual level.12
Texture analysis is a mathematical method to quantify gray-level patterns and voxel interrelationships within a region of interest (ROI). It provides a means to measure intraregional heterogeneity, and may detect tissue changes imperceptible to the human eye, such as subtle differences in textural information.13 Texture analysis has the potential to provide more information about lesion characteristics,14 and is emerging as a potentially effective tool in accurately assessing histopathological grades of cancer.15,16 Furthermore, CT-based texture analysis combined with machine learning is a promising method in tumor grading and classification. Bektas et al found machine learning-based CT texture analysis was a promising method for prediction of Fuhrman nuclear grade in clear-cell renal-cell carcinomas.17 To the best of our knowledge, there has been no study to use CT texture analysis combined with machine learning to predict the histopathological grade of PDAC. The purpose of our study was to evaluate the performance of machine learning–based quantitative CT texture analysis for preoperatively predicting histopathological differentiation grades of PDAC.
Methods
In accordance with the Declaration of Helsinki, this study was approved by the Institutional Review Board for Health Sciences Research at the Affiliated Hospital of Nanjing University of Chinese Medicine. Informed consent was waived, due to the retrospective nature of this study, but all data were kept confidential.
Patients
We retrospectively examined 132 patients with PDAC from our picture-archiving and communication system (Milwaukee, WI, USA) between July 2012 and August 2017. Inclusion criteria were patients who had received preoperative contrast-enhanced CT examinations, including unenhanced, arterial, and portal phases, and who had pathologically confirmed PDAC. Exclusion criteria were lack of contrast-enhanced CT examination, including unenhanced, arterial, and portal phases (n=7, interval between preoperative CT scan and surgery >1 month (n=9), patients with incomplete histopathological evaluation and clinical data (n=21), patients with lesions <0.5 cm (n=2), patients with limited examinations due to poor image quality or technical issues (n=13), pathological diagnosis based on biopsy (n=15), and neoadjuvant chemotherapy or radiation therapy before CT examination (n=9). As a result, a total of 56 patients comprised our study population (32 men, 24 women, mean age 64.04±7.82 years). Pathological grades of all patients were classified according to Adsay et al:18 five cases of well-differentiated/grade I tumors, 32 of moderately differentiated/grade II tumors, and 19 of poorly differentiated/grade III tumors. For classification purposes, differentiated/grade I and moderately differentiated/grade II cases were grouped and classified as low-grade PDAC (n=37), whereas the poorly differentiated/grade III cases were classified as high-grade PDAC (n=19; Figure 1).
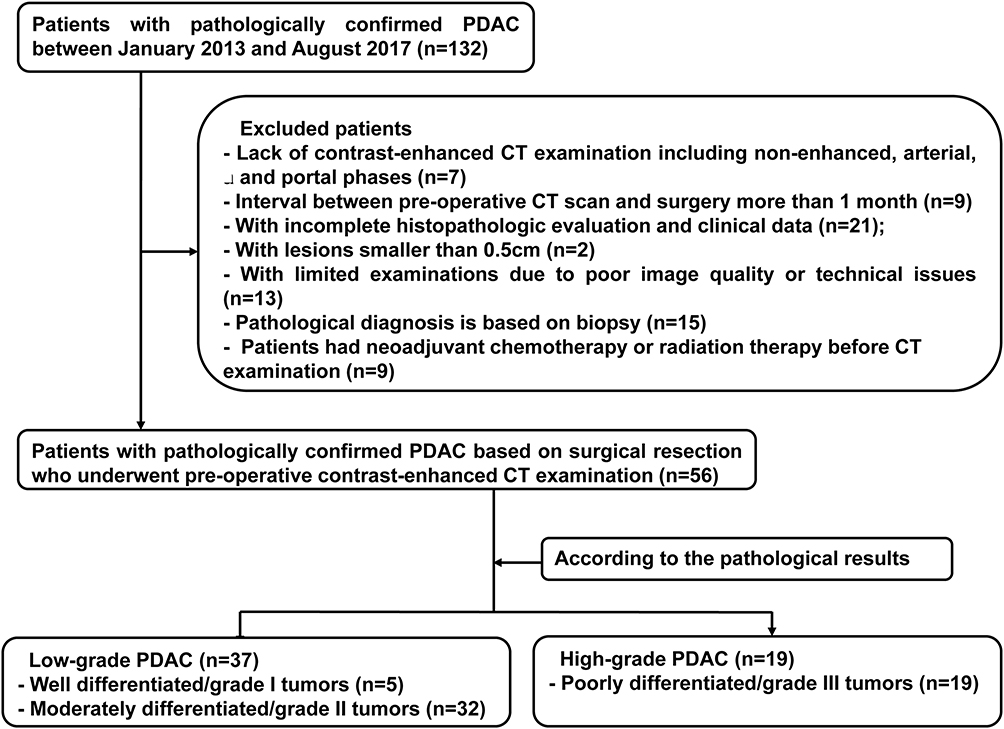 |
Figure 1 Flowchart of study patients and exclusion criteria. Abbreviations: PDAC, pancreatic ductal adenocarcinoma; CT, computed tomography. |
CT Examination
All patients underwent contrast-enhanced CT examinations using a Brilliance 64 (Phillips Healthcare, Best, Netherlands) or Lightspeed VCT (GE Healthcare, Milwaukee, USA). For contrast-enhanced images, 100 mL nonionic contrast material (Ultravist 370; Bayer Schering Pharma, Germany) were injected with 50 mL saline chaser at a rate of 3 mL/s using a pump injector. Scanning parameters were detector configuration 16×0.75mm, pitch 0.9, tube voltage 120 kV, tube current 214–356 mAs, gantry-rotation time, 0.28–0.5 seconds, section thickness 2–6 mm, and reconstruction interval 2 mm. Texture analysis provides many variables, and previous studies have shown significant results in texture analysis primarily at the portal phase, so we selected portal-phase acquisitions for ROI delineation in the following analysis.7,17 CT scans of the portal phase were performed at 60 seconds postinjection.
Texture Analysis
Lesion segmentation was performed by two independent radiologists (WQ and ND, 3 and 12 years of experience in abdominal imaging, respectively) using 3D Slicer software. They were blinded to clinical, laboratory, and histopathological outcomes, but knew that the patients had PDAC. On portal-phase CT images, the axial-image view was selected and an ROI drawn slice by slice around the tumor outline on every slice with a visible tumor to cover the whole tumor. A threshold procedure that included only pixels with attenuation values between −20 HU and 150 HU was used to make sure that only the tumor portion was included, and any air, adipose tissue, or dense calcification within the lesion was excluded for further analysis.19 Interobserver agreement indicating the reliability of segmentation was assessed by the Dice coefficient. A coefficient ≤0.4 indicated poor agreement, 0.4–≤0.6 moderate agreement; 0.6–≤0.8 substantial agreement, and >0.8 indicated almost-perfect agreement. To minimize scanner variabilities on texture analysis, gray-level normalization was done with MRIcron version 4.0 by rescaling the histogram data. CT-image attenuation values were normalized to fit within a µ-gray-level mean of ±3σ.17,20
After a lesion had been segmented, texture features were calculated, including histogram, co-occurrence,21 and run length.22 Histogram features included mean, SD, skewness, kurtosis, and percentiles (fifth, tenth, 25th, 50th, 75th, 90th, 95th). Run-length features included short-run emphasis, long-run emphasis, gray-level nonuniformity, run-length nonuniformity, low gray-level run emphasis, high gray-level run emphasis, short-run low gray–level emphasis, short-run high gray–level emphasis, long-run low gray–level emphasis, and long-run high gray–level emphasis. Co-occurrence features included energy, entropy, correlation, inverse difference moment, inertia, cluster shade, cluster prominence, and Haralick correlation.
Statistical Analysis
Continuous variables are reported as means ± SD. For quantitative variables, independent-sample t-tests were used to detect group differences. For categorical variables, χ2 tests were used to detect group differences. P<0.05 was considered statistically significant. Logistic regression was used for multivariate analysis. Variables with statistical significance in univariate analysis were entered into a stepwise logistic regression analysis.
Machine Learning
Machine learning was used to generate a score to predict histopathological grade. The input to the machine-learning algorithm was texture features. For predictive-model construction, we built a support-vector machine. Tenfold cross-validation was used to evaluate prediction performance. In K-fold cross-validation, the original data set was splitter into K subsamples. K1 subsamples were for model training and the remaining cases for testing. Model parameters were fine-tuned based on internal cross-validation. Parameter tuning was completed inside cross-validation, and test cases were never observable for training. Prediction performance was measured by accuracy, sensitivity, and specificity. Variable importance was evaluated based on sensitivity analysis.23 The relative importance of a predictor is the sensitive response of a predictor divided by the sum of all sensitivity responses. Predictors can be ranked based on relative importance. The flowchart of analysis steps is summarized in Figure 2.
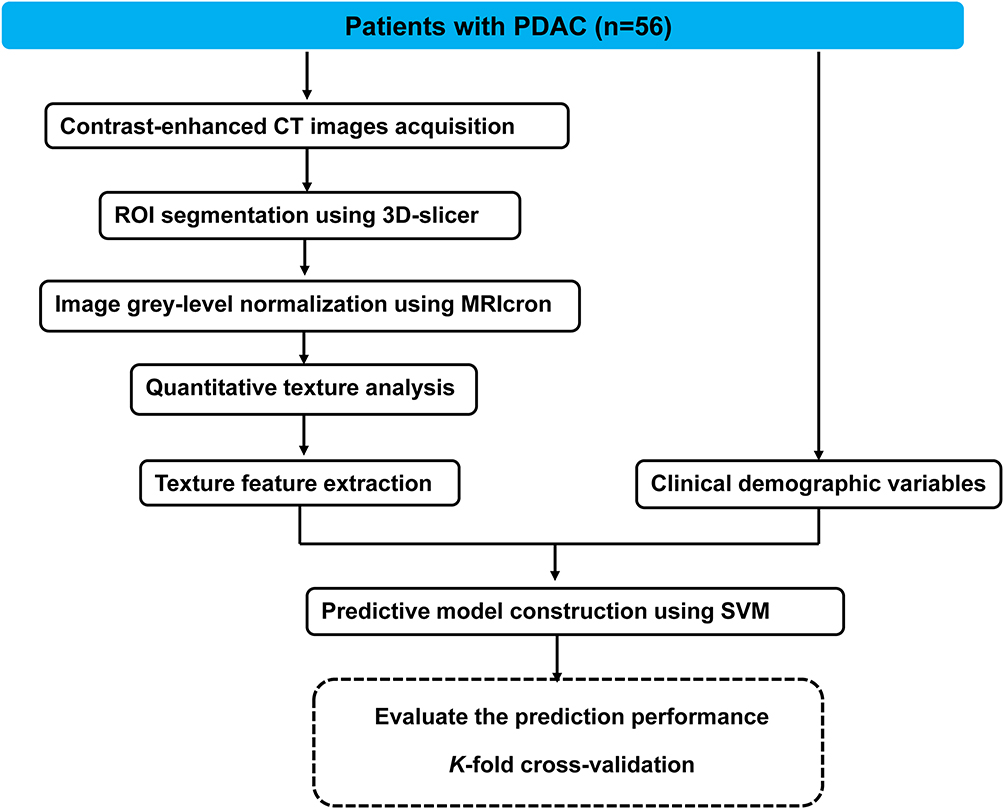 |
Figure 2 Analysis flowchart. Abbreviations: PDAC, pancreatic ductal adenocarcinoma; CT, computed tomography; ROI, region of interest; SVM, support-vector machine. |
Results
Clinical And Biological Characteristics Of Low- And High-Grade PDAC Patients
There were no significant differences between low- and high-grade PDAC patients regarding age, sex, localization of tumor, or degree of jaundice, pain, or cholecystitis and most CT findings (P>0.05, Table 1). This implied that low- and high-grade PDAC patients could not be differentiated simply by preoperative clinical and biological characteristics or general CT findings.
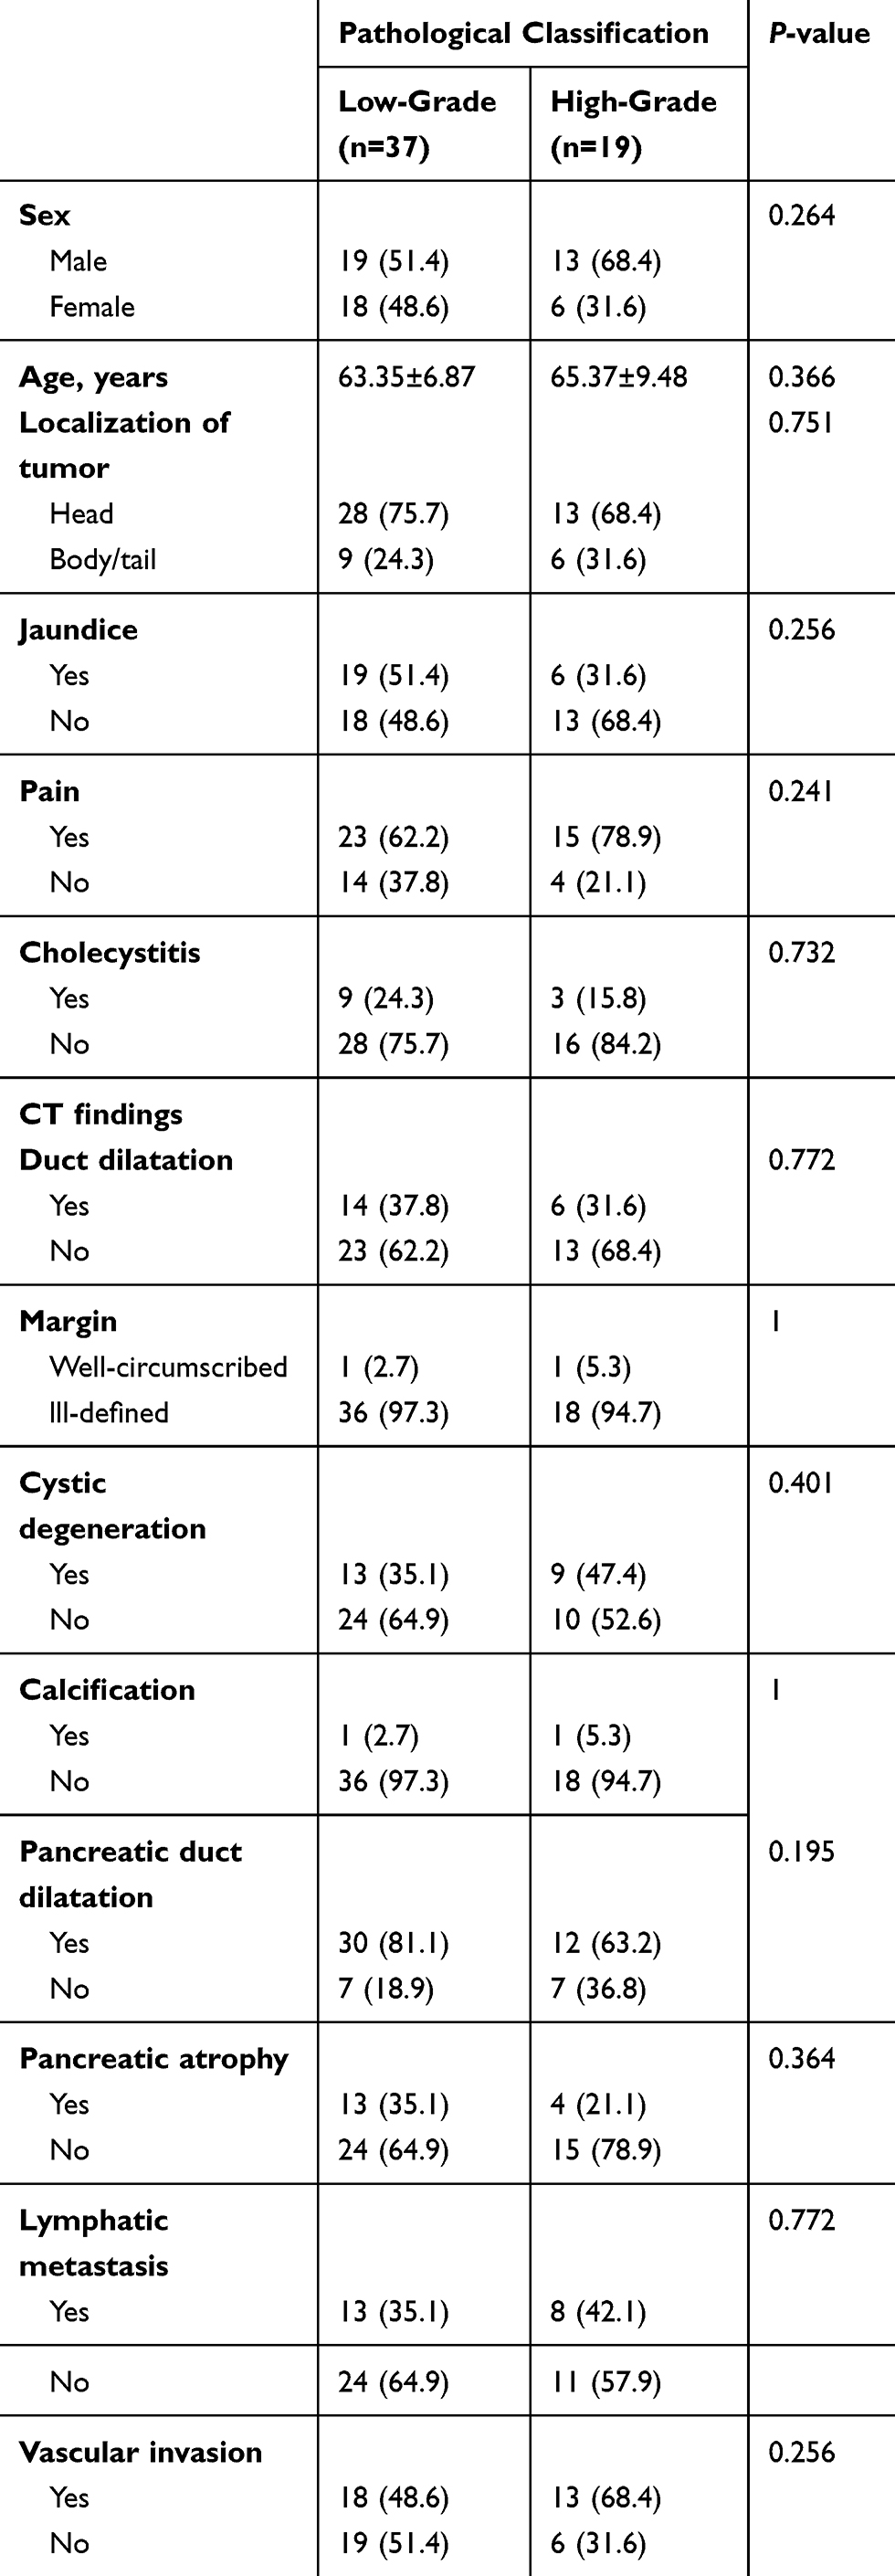 |
Table 1 Clinical And Biological Characteristics And CT Findings Of Low- And High-Grade PDAC Patients |
Lesion Segmentation
The mean Dice coefficient between the two lesion masks was 0.67 (0.48–0.88). This indicated substantial agreement. Examples of lesion segmentation by two radiologists are shown in Figure 3, A and B and Figure 4, A and B. Reconstructed images are shown in Figures 3C and 4C. Volumes drawn by the 3D Slicer were consistent with pathological measurements of the postoperative resection. Pathological analysis results are shown in Figures 3D and 4D. These results demonstrated that lesion segmentation was reliable.
 |
Figure 3 (A) Axial portal-phase contrast-enhanced CT of low-grade PDAC in a 63-year-old woman. Red arrows indicate the tumor. (B) Tumor segmentation. One observer segmented tumor in red and the other observer segmented tumor in green. The lime region indicates the overlapping region of two lesion masks. Segmentation indicated by the dashed red line. (C) Image reconstructed by AW VolumeShare 5. (D) H&E-stained specimen (200×) demonstrated disordered, well-differentiated duct-like structure, tumor cells were cubic and columnar with small nucleoli and uncommon nuclear division. |
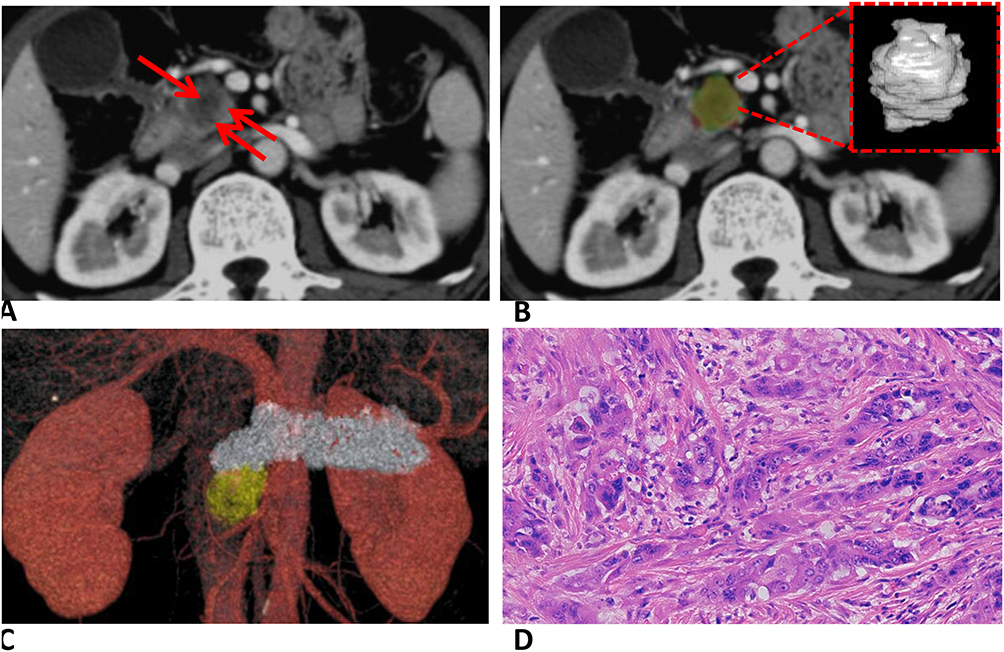 |
Figure 4 (A) Axial portal-phase contrast-enhanced CT image of high-grade PDAC in a 60-year-old man. Red arrows indicate the tumor. (B) Tumor segmentation. One observer segmented tumor in red and the other observer segmented tumor in green. The lime region indicates the overlapping region of two lesion masks. Segmentation shown by dashed red line. (C) Image reconstructed by AW VolumeShare 5. (D) HE-stained specimen (200×) demonstrated poor gland formation, tumor-cells nuclei were obviously pleomorphic with large nucleoli and common nuclear division. |
Texture Features Of PDAC
Among all texture features, eighteen showed significant differences between low- and high-grade PDAC (P<0.05, Table 2): mean (Figure 5A), skewness (Figure 5B), fifth percentile (Figure 5C), tenth percentile (Figure 5D), 25th percentile (Figure 5E), 50th percentile (Figure 5F), 75th percentile (Figure 5G), 90th percentile (Figure 5H), 95th percentile (Figure 5I), gray-level nonuniformity (Figure 6A), run-length nonuniformity (Figure 6B), low gray–level run emphasis (Figure 6C), high gray–level run emphasis (Figure 6D), short-run low gray–level emphasis (Figure 6E), short-run high gray–level emphasis (Figure 6F), long-run high gray–level emphasis (Figure 6G), cluster shade (Figure 7A), and Haralick correlation (Figure 7B)
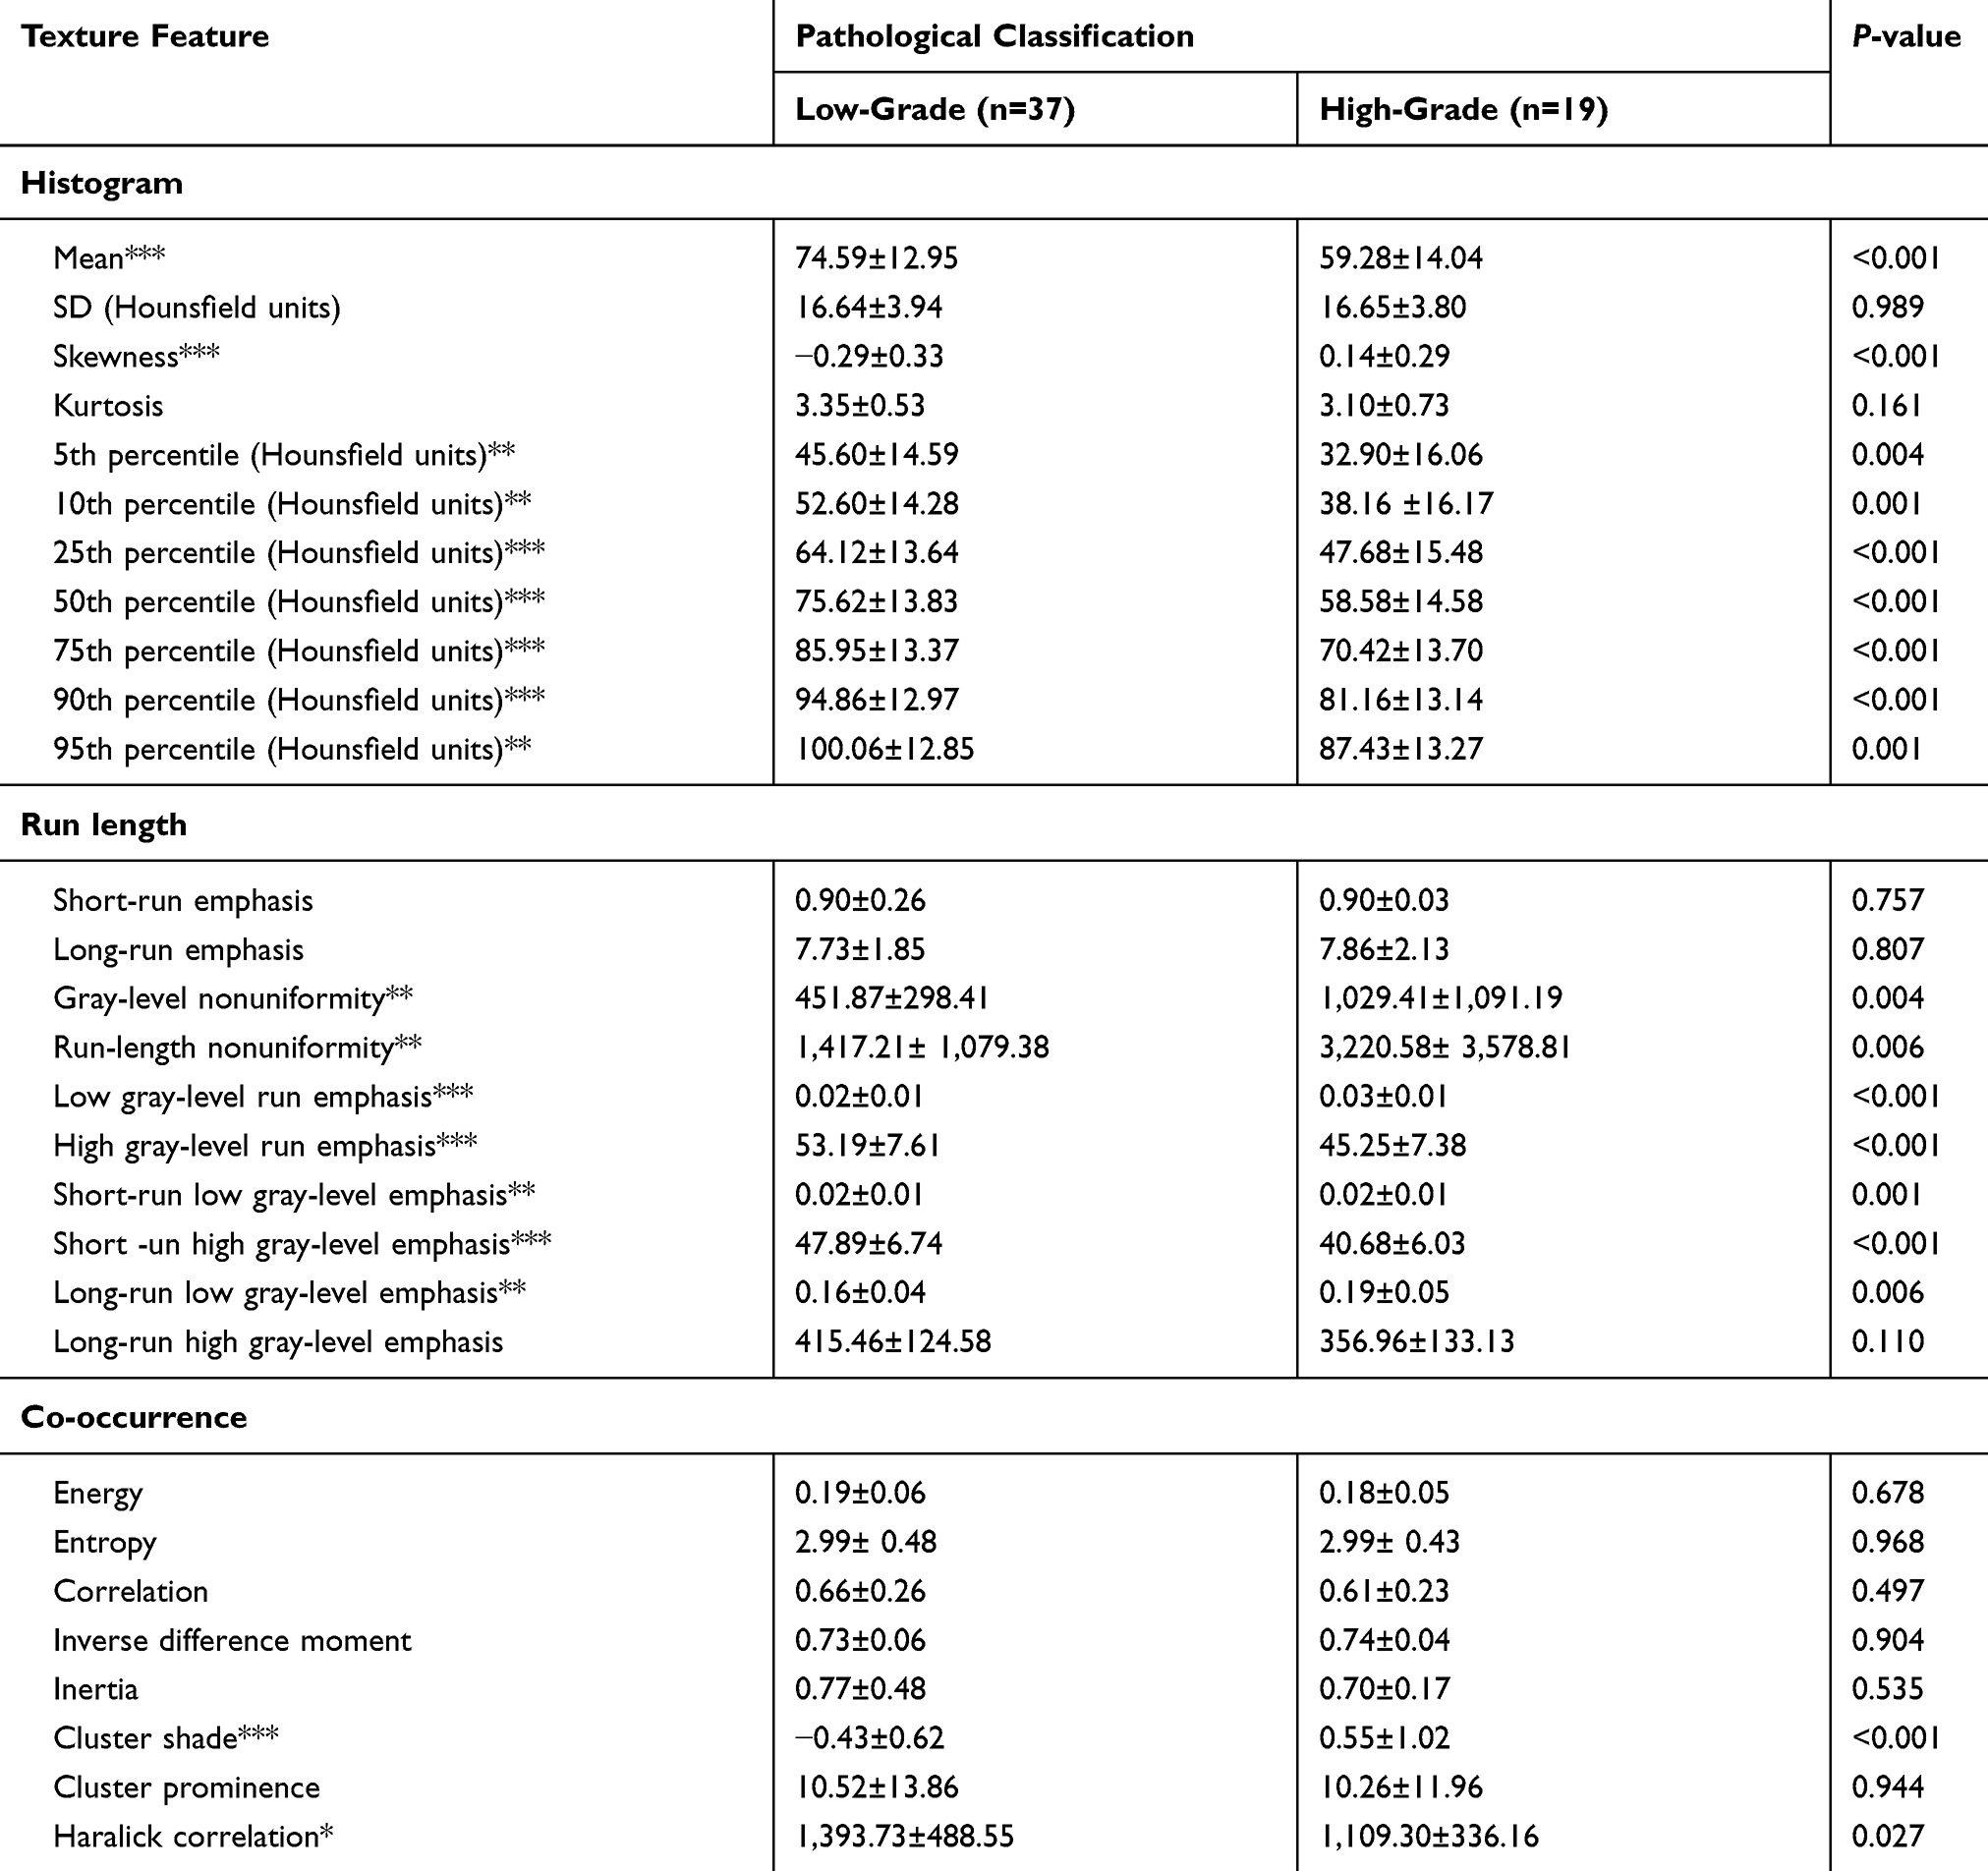 |
Table 2 Histogram Features, Run Length, And Co-Occurrence Features To Distinguish Low- And High-Grade PDAC |
 |
Figure 5 Box-and-whisker plots show the differences of nine histogram features between low-grade PDAC and high-grade PDAC. (A) Mean; (B) skewness; (C) fifth percentile; (D) tenth percentile; (E) 25th percentile; (F) 50th percentile; (G) 75th percentile; (H) 90th percentile; (I) 95th percentile. Notes: Center line represents median. Lower and upper limits represent 25th and 75th percentiles, respectively. Observed values outside whiskers shown as dots. |
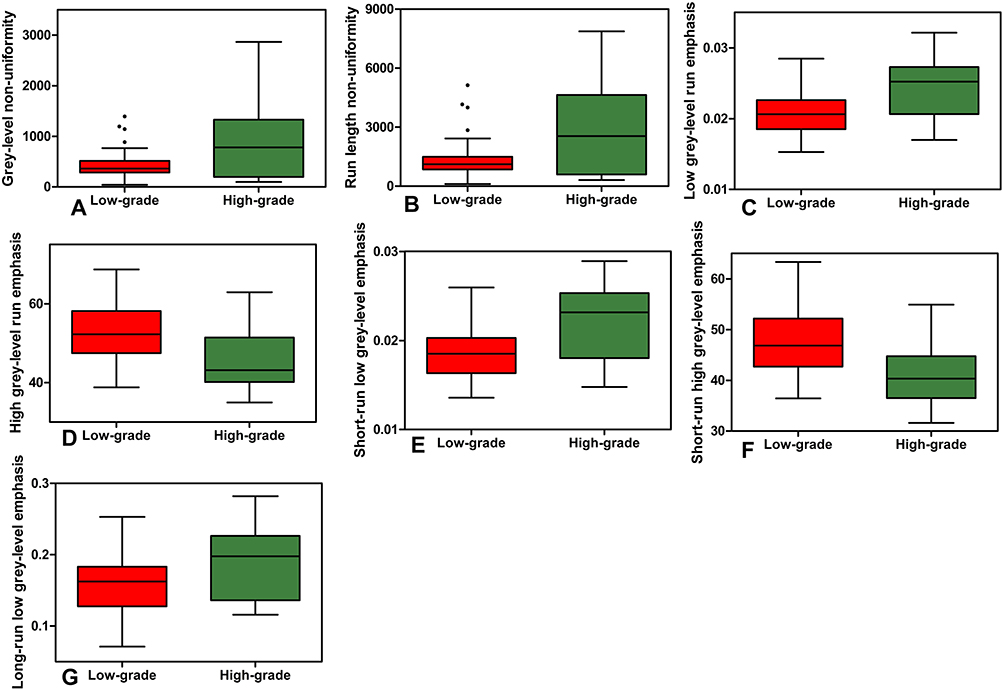 |
Figure 6 Box-and-whisker plots show the differences of seven run length features between low-grade PDAC and high-grade PDAC. (A) Gray-level nonuniformity; (B) run-length nonuniformity; (C) low gray-level run emphasis; (D) high gray-level run emphasis; (E) short-run low gray-level emphasis; (F) short-run high gray-level emphasis, (G) Long-run low gray-level emphasis. Notes: Center line represents median. Lower and upper limits represent 25th and 75th percentiles, respectively. Observed values outside whiskers shown as dots. |
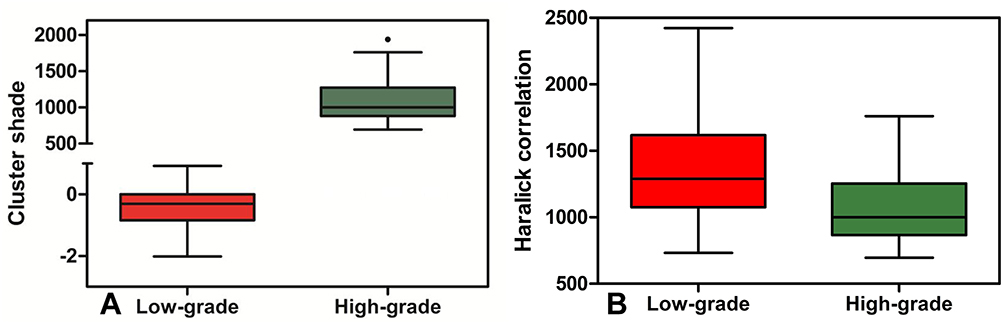 |
Figure 7 Box-and-whisker plots show differences in two co-occurrence features between low-grade PDAC and high-grade PDAC. (A) Cluster shade; (B) Haralick correlation.. Notes: Center line represents median. Lower and upper limits represent 25th and 75th percentiles, respectively. Observed value outside the whiskers are shown as dot. |
Logistic Regression Analysis
For multivariate analysis, we constructed a logistic regression model to distinguish low- and high-grade PDAC. The logistic regression model included predictors with P<0.05 on univariate analysis. We constructed four models and calculated pseudo-R2 to evaluate predictive power. Model A consisted of histogram features, model B consisted of run-length features, model C had co-occurrence features, and model D had histogram, run-length, and co-occurrence features. Pseudo-R2 was 0.43, 0.23, 0.32, and 0.54 for models A, B, C, and D, respectively. This result indicated histogram, run length, and co-occurrence features, and provided complementary information in assessing pathological grades of PDAC.
Score To Predict Histopathological Grade
We developed a score to predict preoperatively histopathological grade (low/high-grade PDAC) using the support-vector machine. We constructed four models: all texture features, histogram features, run-length features, and co-occurrence features. With all texture features, our model accurately predicted low-grade/high-grade PDAC with accuracy 86%, sensitivity 78%, and specificity 95% (Table 3). For feature importance, we ranked predictors based on their relative importance in sensitivity analysis. The variable of importance is presented in Figure 8. Cluster shade was the most important predictor (sensitivity 0.315).
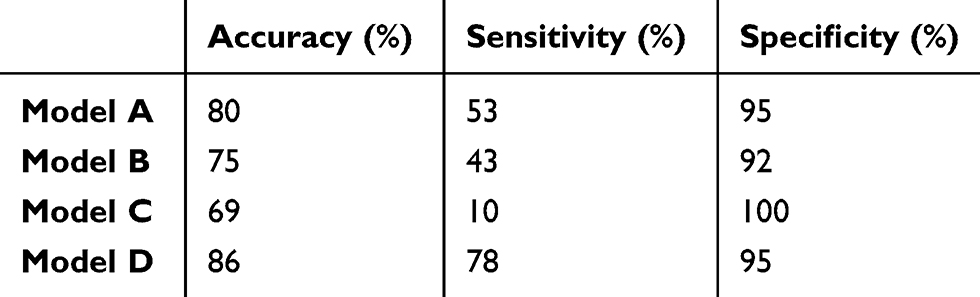 |
Table 3 SVM Models To Predict Postoperative Grade Of PDAC |
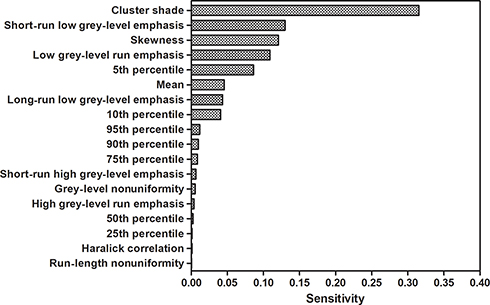 |
Figure 8 Ranking of features to predict low/high-grade PDAC according to importance in sensitivity analysis. |
Discussion And Conclusion
In this study, we developed a machine learning–based classification model based on logistic regression analysis to predict postoperative low- and high-grade PDAC based on preoperative texture features. The logistic regression model included predictors with P<0.05 in univariate analyses of histogram, run length, and co-occurrence features, and 86% of the PDAC patients were correctly classified in terms of histopathological grade. The results showed that CT texture analysis with machine learning may contribute to preoperative risk stratification and maximize patient survival of PDAC patients with short life expectancy.
The assessment of histopathological differentiation grades of PDAC solely using visual features of CT scans is not easy, due to substantial overlap of imaging features among them. Frozen sections at the time of pancreatectomy are commonly used for selection of patients for extensive surgery. However, intraoperative frozen sections of every patient with a diagnosis of pathological grade would prolong surgical time and is costly.24
Texture analysis examines the spatial distribution of voxel gray levels, thus offering an opportunity to overcome the limitations of visual image interpretation.25,26 Studies have shown that CT-based texture analysis can identify the heterogeneous distribution of tumor cells. Lower tumor heterogeneity is likely associated with lower histological grade.27,28 Over the past 10 years, some scientists have explored the value of CT-based texture analysis in tumor detection and classification.29,30 Bae et al showed that quantitative features extracted from dual-energy CT images help predict pathological aggression in lung adenocarcinoma.31 Zhang et al showed quantitative CT texture analysis was a feasible tool for differentiating low-grade from high-grade urothelial carcinoma.13
However, as far as we know, only one previous study has evaluated the potential value of CT texture analysis for predicting pathology of pancreatic adenocarcinoma.7 They reached the conclusion only that poorly differentiated histology was associated with low central attenuation value, but did not achieve accurate histopathological grading of PDAC by texture analysis. Our research is quite different from that in many methods. In addition to their histogram texture features, we included the run length and co-occurrence texture in the analysis. We focused on differences in texture parameters among patients with different histopathological grades, rather than disease-free survival. We measured whole-tumor volume, rather than largest diameter of the tumor slice. Furthermore, the machine learning was used to build a discriminatory model. Machine learning can generate a score to predict the histopathological grade of cancer based on imaging-derived features. As a comparison, statistical analysis methods usually provide inference at the group level instead of the individual subject level. Increased sophistication of machine-learning algorithms allows generation of scores in an automated, unbiased manner.32 Despite these differences, both studies support a similar conclusion that CT texture analysis is a promising and noninvasive method for predicting the prognosis of pancreatic cancer.
We acknowledge several limitations of our study. First, it was retrospective and may implicitly have had selection bias. Nonetheless, most research about texture analysis and machine learning is retrospective in nature.33 Second, due to our strict inclusion criteria, the number of enrolled patients was relatively small. This may have led to overfitting. We performed cross-validation to obtain reliable estimates of prediction performance.34 In future, we will validate the developed model in a prospective multicenter study with a large sample. Third, the technical parameters of the CT examinations were not uniform across all patients. This may have increased variability in lesion attenuation, resulting in bias in estimation of texture features. All images in our research underwent a normalization procedure to minimize scanner variabilities.35 Finally, we selected portal-phase acquisitions for ROI delineation. Before CT imaging, we did not know that the patients had PDAC. In order to collect comprehensive information on liver, gallbladder, pancreas, spleen, and other tissue, we performed contrast-enhanced CT examinations, including unenhanced, arterial, and portal phases, but without dividing the pancreatic parenchymal phase. However, previous studies have shown significant results in texture analysis primarily at the portal phase, and in our group of patients pancreatic tumors and surrounding normal tissue were significantly contrasted during the portal phase. As such, the choice of the portal phase can also be applied to the clinic. In future, we will choose the pancreatic parenchymal phase for further verification.
In conclusion, our study indicates that machine learning–based CT texture analysis has the potential to predict preoperatively histopathological subtypes of PDAC with high accuracy. Although this study appears promising, large and multicenter validated prospective studies are needed before this model can be used in clinical practice. With further improvement and standardization of this technology, it may serve as a noninvasive, preoperative, precise, simple assessment tool to assist clinicians in evaluating prognosis for individual patients with PDAC and thus achieving better clinical outcomes.
Acknowledgments
This work was supported by the National Natural Science Foundation of China (grant 81771899) and the Primary Research and Development Plan of Jiangsu Province (BE2017772).
Disclosure
The authors report no conflicts of interest in this work.
References
1. Whittle MC, Izeradjene K, Rani PG, et al. RUNX3 controls a metastatic switch in pancreatic ductal adenocarcinoma. Cell. 2015;161(6):1345–1360. doi:10.1016/j.cell.2015.04.048
2. Ying H, Dey P, Yao W, et al. Genetics and biology of pancreatic ductal adenocarcinoma. Genes Dev. 2016;30(4):355–385. doi:10.1101/gad.275776.115
3. Hidalgo M. Pancreatic cancer. N Engl J Med. 2010;362(17):1605–1617. doi:10.1056/NEJMra0901557
4. Han SH, Heo JS, Choi SH, et al. Actual long-term outcome of T1 and T2 pancreatic ductal adenocarcinoma after surgical resection. Int J Surg. 2017;40:68–72. doi:10.1016/j.ijsu.2017.02.007
5. Macias N, Sayagues JM, Esteban C, et al. Histologic tumor grade and preoperative bilary drainage are the unique independent prognostic factors of survival in pancreatic ductal adenocarcinoma patients after pancreaticoduodenectomy. J Clin Gastroenterol. 2018;52(2):e11–e17. doi:10.1097/MCG.0000000000000793
6. Kuhlmann KF, de Castro SM, Wesseling JG, et al. Surgical treatment of pancreatic adenocarcinoma; actual survival and prognostic factors in 343 patients. Eur J Cancer. 2004;40(4):549–558. doi:10.1016/j.ejca.2003.10.026
7. Cassinotto C, Chong J, Zogopoulos G, et al. Resectable pancreatic adenocarcinoma: role of CT quantitative imaging biomarkers for predicting pathology and patient outcomes. Eur J Radiol. 2017;90:152–158. doi:10.1016/j.ejrad.2017.02.033
8. Nurmi A, Mustonen H, Parviainen H, Peltola K, Haglund C, Seppanen H. Neoadjuvant therapy offers longer survival than upfront surgery for poorly differentiated and higher stage pancreatic cancer. Acta Oncol. 2018;57(6):799–806. doi:10.1080/0284186X.2017.1415458
9. Lv P, Mahyoub R, Lin X, Chen K, Chai W, Xie J. Differentiating pancreatic ductal adenocarcinoma from pancreatic serous cystadenoma, mucinous cystadenoma, and a pseudocyst with detailed analysis of cystic features on CT scans: a preliminary study. Korean J Radiol. 2011;12(2):187–195. doi:10.3348/kjr.2011.12.2.187
10. Yeh R, Dercle L, Garg I, Wang ZJ, Hough DM, Goenka AH. The role of 18F-FDG PET/CT and PET/MRI in pancreatic ductal adenocarcinoma. Abdom Radiol (NY). 2018;43(2):415–434. doi:10.1007/s00261-017-1374-2
11. Choi TW, Kim JH, Yu MH, Park SJ, Han JK. Pancreatic neuroendocrine tumor: prediction of the tumor grade using CT findings and computerized texture analysis. Acta Radiol. 2018;59(4):383–392. doi:10.1177/0284185117725367
12. Wang SH, Sun YF, Liu Y, Zhou Y. CT contrast enhancement correlates with pathological grade and microvessel density of pancreatic cancer tissues. Int J Clin Exp Pathol. 2015;8(5):5443–5449.
13. Zhang GM, Sun H, Shi B, Jin ZY, Xue HD. Quantitative CT texture analysis for evaluating histologic grade of urothelial carcinoma. Abdom Radiol (NY). 2017;42(2):561–568. doi:10.1007/s00261-016-0897-2
14. Miles KA, Ganeshan B, Hayball MP. CT texture analysis using the filtration-histogram method: what do the measurements mean? Cancer Imaging. 2013;13(3):400–406. doi:10.1102/1470-7330.2013.9045
15. Gu Y, She Y, Xie D, et al. A texture analysis-based prediction model for lymph node metastasis in stage IA lung adenocarcinoma. Ann Thorac Surg. 2018;106(1):214–220. doi:10.1016/j.athoracsur.2018.02.026
16. Ganeshan B, Skogen K, Pressney I, Coutroubis D, Miles K. Tumour heterogeneity in oesophageal cancer assessed by CT texture analysis: preliminary evidence of an association with tumour metabolism, stage, and survival. Clin Radiol. 2012;67(2):157–164. doi:10.1016/j.crad.2011.08.012
17. Bektas CT, Kocak B, Yardimci AH, et al. Clear cell renal cell carcinoma: machine learning-based quantitative computed tomography texture analysis for prediction of fuhrman nuclear grade. Eur Radiol. 2019;29(3):1153–1163. doi:10.1007/s00330-018-5698-2
18. Adsay NV, Basturk O, Bonnett M, et al. A proposal for a new and more practical grading scheme for pancreatic ductal adenocarcinoma. Am J Surg Pathol. 2005;29(6):724–733. doi:10.1097/01.pas.0000163360.40357.f1
19. Eilaghi A, Baig S, Zhang Y, et al. CT texture features are associated with overall survival in pancreatic ductal adenocarcinoma - a quantitative analysis. BMC Med Imaging. 2017;17(1):38. doi:10.1186/s12880-017-0209-5
20. Schieda N, Lim RS, Krishna S, MDF M, Flood TA, Thornhill RE. Diagnostic accuracy of unenhanced CT analysis to differentiate low-grade from high-grade chromophobe renal cell carcinoma. AJR Am J Roentgenol. 2018;210(5):1079–1087. doi:10.2214/AJR.17.18874
21. Scalco E, Rizzo G. Texture analysis of medical images for radiotherapy applications. Br J Radiol. 2017;90(1070):20160642. doi:10.1259/bjr.20160642
22. Abbasian Ardakani A, Rajaee J, Khoei S. Diagnosis of human prostate carcinoma cancer stem cells enriched from DU145 cell lines changes with microscopic texture analysis in radiation and hyperthermia treatment using run-length matrix. Int J Radiat Biol. 2017;93(11):1248–1256. doi:10.1080/09553002.2017.1359429
23. Cortez P, Embrechts MJ. Using sensitivity analysis and visualization techniques to open black box data mining models. Inf Sci (N Y). 2013;225:1–17. doi:10.1016/j.ins.2012.10.039
24. Ueno Y, Forghani B, Forghani R, et al. Endometrial carcinoma: MR imaging-based texture model for preoperative risk stratification-a preliminary analysis. Radiology. 2017;284(3):748–757. doi:10.1148/radiol.2017161950
25. Castellano G, Bonilha L, Li LM, Cendes F. Texture analysis of medical images. Clin Radiol. 2004;59(12):1061–1069. doi:10.1016/j.crad.2004.07.008
26. Baessler B, Mannil M, Oebel S, Maintz D, Alkadhi H, Manka R. Subacute and chronic left ventricular myocardial scar: accuracy of texture analysis on nonenhanced cine MR images. Radiology. 2018;286(1):103–112. doi:10.1148/radiol.2017170213
27. Zhang H, Graham CM, Elci O, et al. Locally advanced squamous cell carcinoma of the head and neck: CT texture and histogram analysis allow independent prediction of overall survival in patients treated with induction chemotherapy. Radiology. 2013;269(3):801–809. doi:10.1148/radiol.13130110
28. Ng F, Ganeshan B, Kozarski R, Miles KA, Goh V. Assessment of primary colorectal cancer heterogeneity by using whole-tumor texture analysis: contrast-enhanced CT texture as a biomarker of 5-year survival. Radiology. 2013;266(1):177–184. doi:10.1148/radiol.12120254
29. Bayanati H, E Thornhill R, Souza CA, et al. Quantitative CT texture and shape analysis: can it differentiate benign and malignant mediastinal lymph nodes in patients with primary lung cancer? Eur Radiol. 2015;25(2):480–487. doi:10.1007/s00330-014-3420-6
30. Hodgdon T, McInnes MD, Schieda N, Flood TA, Lamb L, Thornhill RE. Can quantitative CT texture analysis be used to differentiate fat-poor renal angiomyolipoma from renal cell carcinoma on unenhanced CT images? Radiology. 2015;276(3):787–796. doi:10.1148/radiol.2015142215
31. Bae JM, Jeong JY, Lee HY, et al. Pathologic stratification of operable lung adenocarcinoma using radiomics features extracted from dual energy CT images. Oncotarget. 2017;8(1):523–535. doi:10.18632/oncotarget.v8i1
32. Chen R, Herskovits EH. Machine-learning techniques for building a diagnostic model for very mild dementia. Neuroimage. 2010;52(1):234–244. doi:10.1016/j.neuroimage.2010.03.084
33. Bektas CT, Kocak B, Yardimci AH, et al. Clear cell renal cell carcinoma: machine learning-based quantitative computed tomography texture analysis for prediction of fuhrman nuclear grade. Eur Radiol. 2018.
34. Chae HD, Park CM, Park SJ, Lee SM, Kim KG, Goo JM. Computerized texture analysis of persistent part-solid ground-glass nodules: differentiation of preinvasive lesions from invasive pulmonary adenocarcinomas. Radiology. 2014;273(1):285–293. doi:10.1148/radiol.14132187
35. Baessler B, Luecke C, Lurz J, et al. Cardiac MRI texture analysis of T1 and T2 maps in patients with infarctlike acute myocarditis. Radiology. 2018;289(2):357–365. doi:10.1148/radiol.2018180411
 © 2019 The Author(s). This work is published and licensed by Dove Medical Press Limited. The full terms of this license are available at https://www.dovepress.com/terms.php and incorporate the Creative Commons Attribution - Non Commercial (unported, v3.0) License.
By accessing the work you hereby accept the Terms. Non-commercial uses of the work are permitted without any further permission from Dove Medical Press Limited, provided the work is properly attributed. For permission for commercial use of this work, please see paragraphs 4.2 and 5 of our Terms.
© 2019 The Author(s). This work is published and licensed by Dove Medical Press Limited. The full terms of this license are available at https://www.dovepress.com/terms.php and incorporate the Creative Commons Attribution - Non Commercial (unported, v3.0) License.
By accessing the work you hereby accept the Terms. Non-commercial uses of the work are permitted without any further permission from Dove Medical Press Limited, provided the work is properly attributed. For permission for commercial use of this work, please see paragraphs 4.2 and 5 of our Terms.