")
Back to Journals » International Journal of General Medicine » Volume 15
Pan-Cancer Analysis Predicts FOXS1 as a Key Target in Prognosis and Tumor Immunotherapy
Received 31 December 2021
Accepted for publication 18 February 2022
Published 25 February 2022 Volume 2022:15 Pages 2171—2185
DOI https://doi.org/10.2147/IJGM.S354195
Checked for plagiarism Yes
Review by Single anonymous peer review
Peer reviewer comments 2
Editor who approved publication: Dr Scott Fraser
Yunqiang Liu,1,* Mengjun Tu,2,3,* Lingling Wang4,5
1School of Medical College, Guangdong Medical University, Zhanjiang, Guang Dong Province, 524023, People’s Republic of China; 2Eye Hospital and School of Ophthalmology and Optometry, Wenzhou Medical University, Wenzhou, Zhejiang Province, 325027, People’s Republic of China; 3National Clinical Research Center for Ocular Diseases, Wenzhou, Zhejiang Province, 325027, People’s Republic of China; 4Department of Clinical Laboratory Center of the Second Affiliated Hospital & Yu Ying Children’s Hospital of Wenzhou Medical University, Wenzhou, Zhejiang Province, 325027, People’s Republic of China; 5School of Laboratory Medicine and Life Sciences, Wenzhou Medical University, Wenzhou, Zhejiang Province, 325035, People’s Republic of China
*These authors contributed equally to this work
Correspondence: Lingling Wang, Department of Clinical Laboratory Center of The Second Affiliated Hospital & Yu Ying Children’s Hospital of Wenzhou Medical University, Wenzhou, Zhejiang Province, 325027, People’s Republic of China, Tel +8618867786629, Email [email protected]
Purpose: Only a few studies have reported the role of FOXS1, a transcriptional factor, in the tumor development process. In this article, we investigate the function of FOXS1 in distinct neoplastic development and the tumor immune microenvironment (TIME).
Patients and Methods: The latent roles of FOXS1 in various tumors were prospected based on TCGA, GTEx, CCLE, GEPIA2, cBioPortal, TIMER, ImmuCellAI databases, GSVA datasets, GSEA datasets, and R packages. The expression difference, gene alteration, clinical characteristics, prognostic values, biological mechanism, potential pathways, tumor microenvironment, and immune cell infiltration related to FOXS1 were appraised.
Results: FOXS1 was strongly expressed in pan-cancer, and this gene was associated with low survival rates. FOXS1 was linked to many pathways that are cancer-promoting and immune-related. The expression of this transcriptional factor in cancers was positively related to immune cell infiltration, especially M2-like macrophages and Treg cells. In addition to that, FOXS1 demonstrated a positive relationship with many immune-suppression genes, such as TGFB1 and ARORA2A.
Conclusion: Our study identified an oncogenic effect of FOXS1, which may play a vital role as a prognosticative biological marker in pan-cancer. Exorbitant expression of FOXS1 is associated with high TAMs and Treg cells infiltration. These cells have an immunosuppressive function and promote the development of the immunosuppressive tumor microenvironment. The research of FOXS1 provided a potential drug target for tumor immunotherapy.
Keywords: FOXS1, pan-cancer, biological marker, M2-like macrophages, Treg cells, immunosuppressive microenvironment
Introduction
The latest report from International Agency for Research on Cancer in 2021 estimated that by 2020, there were nearly 19 million fresh cancer cases and 10 million cancer deaths worldwide.1 Cancer treatment imposes an enormous economic burden on the global healthcare system.2 Thus, the priority in the tumor research domain is to distinguish the cellular and molecular mechanisms of tumors, therefore encouraging the development of more helpful strategies for cancer diagnostics, treatment, and prognosis.3 The tumor microenvironment (TME) disorder, specifically tumor immune microenvironment (TIME), plays a crucial role in cancer malignant progression.4 Previous studies have displayed that oncogenes, alone or cooperatively, regulate the tumor microenvironment and host immune responses in multiple tumor types.5 Furthermore, The Clinical success of cancer immunotherapies has revolutionized traditional cancer treatment.6 Cancer immunotherapy with immune checkpoint inhibitors (ICIs) is progressively becoming a cornerstone in treating some cancer types.7 However, only a minority of patients respond to these agents.8 One significant stumbling block to forceful immunological therapy is the highly immunosuppressive tumor immune microenvironment (TIME).9 We attempted to recognize genes that play central roles in TIME due to this.
Forkhead box (FOX) families constitute a superfamily of evolutionarily conserved transcriptional factors, which play an essential role in a broad spectrum of cellular processes such as metabolism, development, differentiation, apoptosis, migration, and invasion.10,11 So far, only a few studies have investigated the role of forkhead box S1 (FOXS1), which is a member of this family, in tumor development. Some of the reported findings are contradictory. In human gastric cancer tissues, FOXS1 downregulates the wnt/β-catenin signaling pathway and hinders the epithelial-mesenchymal transition of tumor (EMT) and cell diffusion. However, other studies found that FOXS1 is guided by GLI1 and miR-125a-5p and stimulates epithelial-mesenchymal transition of tumor (EMT) and cell diffusion.12,13 Thus, more studies are required to explore the unknown molecular mechanisms involved in tumor progression and metastasis.
In this paper, we aim to provide a comprehensive, longitudinal view of FOXS1 using a multi-omics approach. Our work extracted datasets from several databases such as ImmuCellAI, GEPIA2, TIMER, cBioPortal Oncomine, and TGCA to investigate the relationship between FOXS1 expression levels and pan-cancer. Our findings suggested that FOXS1 has diagnosis and prognosis value in most cancer types. Notably, overexpression of FOXS1 is associated with poor survival rates in cancer patients, which may be attributed to the immunosuppressive tumor microenvironment. All in all, the achieved conclusions point out that FOXS1 may be an effective drug target for the future development of tumor immunotherapy.
Materials and Methods
Data Collection
We obtained the genome location information of the FOXS1 gene from the UCSC genome browser on human Dec.2013 (GRCh38/hg38) assembly (http://genome.ucsc.edu/). Based on the UCSC XENA website (https://xenabrowser.net/datapages/), the FOXS1 expression data and corresponding clinical characteristics in The Cancer Genome Atlas (TCGA), Genotype-Tissue Expression (GTEx), and Cancer Cell Line Encyclopedia (CCLE) were retrieved.14 Most data analyses were performed using R (V.4.0.2, https://www.r-project.org/), and graphs were created utilizing the R packages including the “ggradar”, “ggplot2”, “limma”, “survival”, “survminer”, “forestplot”, “ggpubr” and “cluster-Profiler” projects. Differences of expression between class members were detected by Student’s t-test, and all analyses were considered statistically significant as P < 0.05. The cBioPortal website (https://www.cbioportal.org/) was used to evaluate methylation modification and genetic alteration of tumor tissues.15
Prognostic Value of FOXS1
For the FOXS1 mRNA expression analysis, tumor patients were stratified according to the median expression value into the “low” group (expression levels < median) and “high” group (expression levels ≥ median). Kaplan–Meier curves were constructed using GEPIA2 (http://gepia2.cancer-pku.cn/#analysis; version 2) and the R packages “survival” and “survminer” were used to uncover the discrepancies in patient survival of different cancer.16 To perform survival analysis, we applied a univariate Cox proportional hazards model through the survival package of the R statistical suite.17 Four clinical survival outcome endpoints were chosen for this pan-cancer clinical endpoints analysis, which are the overall survival (OS), disease-specific survival (DSS), disease-free interval (DFI), and progression-free interval (PFI). P ≥ 0.05 was not considered significantly different, while P < 0.05 was considered statistically significant.
GSEA and GSVA
Gene set enrichment analyses were conducted using GSEA and GSVA.18,19 Using R packages “clusterProfiler”, GSEA was applied for appraising the potential biological process activity and variation in the pathway. We also utilized GSVA to measure enrichment scores in pan-cancer. A total of 50 hallmark pathways were applied in the GSVA R package (v1.32.0). Adjusted P-values ≤ 0.05 were considered statistically significant.
Correlation Analysis Between FOXS1 Expression and Tumor Microenvironment
Two different approaches were employed to assess FOXS1 level versus TEM in pan-cancer. In the first method, tumor purity in human cancers was calculated using the ESTIMATE R package. Stromal and Immune scores represented the plenitude of stromal and immune components. ESTIMATE score reflects tumor purity to some extent. In the Second method, a previous study was employed as a reference to investigate TME-related biological processes.13 Next, based on the TCGA database, we exploited the “Immune Gene” module of the TIMER2, ImmuCellAI platform, and referred to a previous study to estimate the relationship between FOXS1 expression and immune cell infiltration across different tumor types.20–22 The correlation of FOXS1 expression with immune-related genes, such as major histocompatibility complex (MHC), immunosuppressive genes, chemokine, and chemokine receptor, was also assessed using R packages.
Results
FOXS1 is Highly Expressed in Multiple Cancers
FOXS1 is an intron-less gene located in the chromosomal region of 20q11.1–q11.2 (Figure 1A). FOXS1 was transcribed in different normal human tissues, with the highest gene transcript level in the blood vessel sample, while the lowest level was found in the blood (GTEx database) (Figure 1B). As shown in Figure 1C, FOXS1 was expressed in all tumor tissues with the highest level in PAAD and the lowest level in LAML (33 cancer samples from the TGCA database). Our outcomes also suggested that the transcript level of FOXS1 was highest in CESC, and lower in some other tumor cells (CCLE database) (Figure 1D). Next, analysis of FOXS1 mRNA expression from TCGA databases (33 cancers) and GTEx data (corresponding normal tissues) showed an upregulation of FOXS1 gene in tumor types from ACC, BLCA, BRCA, CHOL, COAD, DLBC, ESCA, GBM, HNSC, KIRC, LAML, LGG, LIHC, LUSC, OV, PAAD, PCPG, PRAD, READ, SKCM, STAD, and THYM (Figure 1E). In contrast, it exhibited low expression in CESC, KICH, KIRP, LUAD, TGCT, UCEC (Figure 1E). There was no statistical significance in the expression level of FOXS1 in SARC, THCA, UCS (P > 0.05). Consistently, for paired cancer types in the TCGA profiles, FOXS1 was upregulated in BLCA, BRCA, CHOL, COAD, ESCA, HNSC, KIRC, LIHC, PRAD, SEAD, and THCA (Supplementary Figure S1). However, its expression was downregulated in KIRP (Supplementary Figure S1). In addition, we analyzed the FOXS1 transcript levels in different tumor stages. High expression of FOXS1 was correlated with advanced pathological stage in ACC, BLCA, BRCA, ESCA, KIRC, and KIRP (Figure 1F–K).
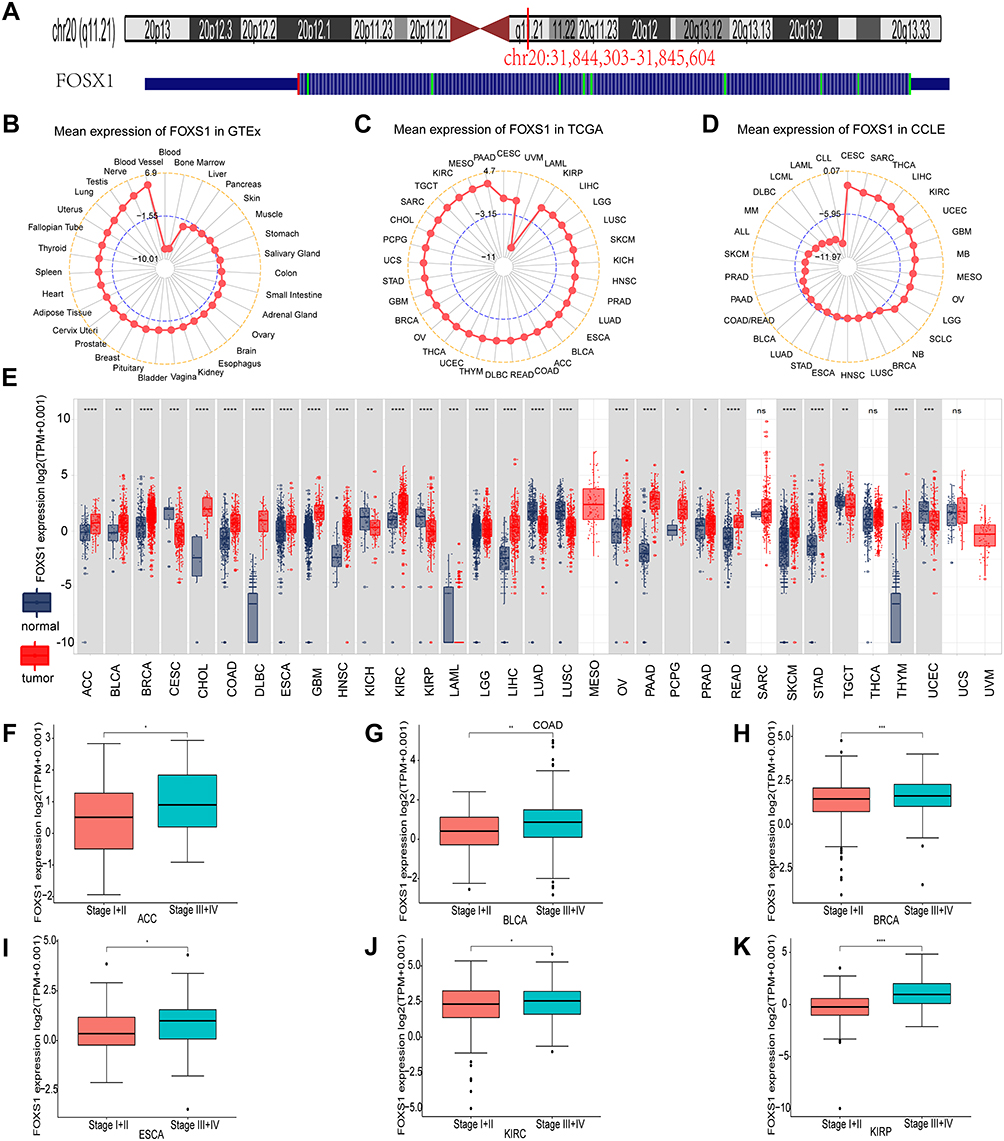 |
Figure 1 FOXS1 characteristics and its differential expression levels between cancer samples and normal body tissues. (A) Genomic location of the FOXS1 gene. (B–D) Mean transcriptional level of FOXS1 in normal tissues, TCGA, and tumor cell lines. (E) Expression levels of FOXS1 in cancer tissues and corresponding normal tissues. (F–K) FOXS1 transcript-level in different pathological stages in ACC, BLCA, BRCA, ESCA, KIRP, and KIRC. The data was log2 (transcripts per million [TPM] + 1) transformed, and only significant results were shown. (*p < 0.05, **p < 0.01, ***p < 0.001, and ****p < 0.0001). |
Genetic Alteration and Methylation Modification of FOXS1 in Pan-Cancer
We used cBioPortal (TCGA dataset) to analyze genetic alterations in FOXS1. Results showed that this gene was changed in 25 cancer types, with amplification being the most regular alteration (Figure 2A). Continually, we utilized Pearson’s correlation to investigate the relationship between the FOXS1 gene methylation levels and the transcript level. Results indicated that DNA methylation was significantly negatively correlated with FOXS1 expression in patients with PCPG, LGG, UVM, SARC, KIRC, KIRP, UCS, MESO (−1 < Pearson r < −0.3), and in PRAD, BRCA, COAD, PAAD, TCGT, UCEC, CESC, THCA (−0.3 < Pearson r < −0.1) (Figure 2B and Supplementary Figure S2). In addition, we generated Kaplan–Meier survival curves to determine the prognostic value of FOXS1 promoter methylation (Supplementary Figure S3). These curves manifested that the FOXS1 promoter methylation level has a positive relationship with the overall survival (OS) in KIRP, LGG, PRAD, STAD, and UVM. In contrast, a high degree of FOXS1 promoter methylation was associated with worse OS in HNSC. For progression-free interval (PFI), the level of FOXS1 methylation was a protective factor in LGG and OV. FOXS1 methylation was also linked to an increased disease-free interval (DFI) for patients with MESO. Furthermore, in KIRP, LGG, LUSC, OV, and UVM, disease-specific survival (DSS) was lower in patients with hypomethylated FOXS1 than the patients with hypermethylated FOXS1. However, the level of FOXS1 methylation was related to reduced DSS in patients with SKCM.
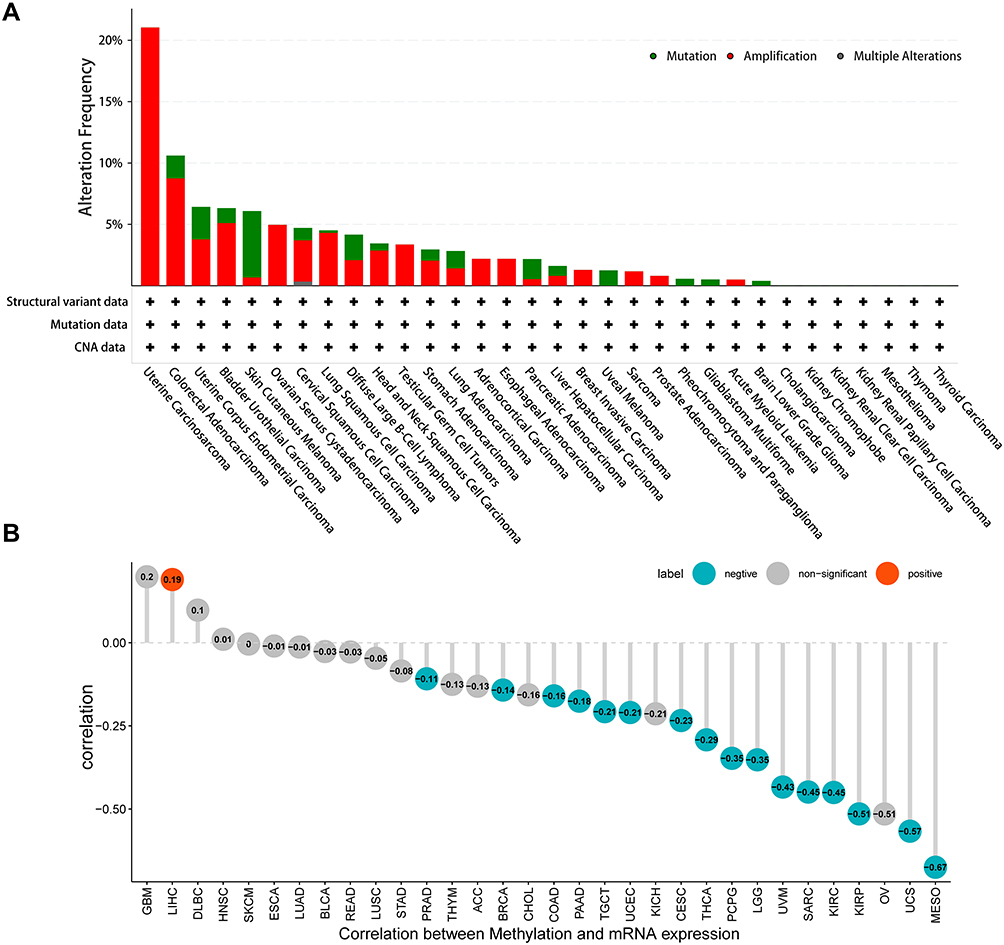 |
Figure 2 Genetic alternations of FOXS1 in different cancer types (cBioportal). (A) The alternation frequency of FOXS1 occurred in pan-cancer. (B) Correlations between DNA methylation and the mRNA level of FOXS1 (p < 0.05). |
Prognostic Value of FOXS1 in Various Cancers
Based on the transcriptional levels of FOXS1, we categorized the patients into high and low expression groups. As shown in the survival heat map, high FOXS1 level was significantly linked to poor overall survival (Figure 3A). Moreover, Kaplan-Meier curves uncovered that high expression of FOXS1 was associated with worse OS prognosis in ACC (p = 0.0011), CESC (p = 0.026), COAD (p = 0.00083), ESCA (p = 0.041), KICH (p = 0.024), KIRC (p = 0.029), KIRP (p < 0.00001), LAML (p = 0.018), LGG (p = 0.00029), LICH (p = 0.034), MESO (p = 0.0035), PAAD (p = 0.014), SKCM (p = 0.0057), STAD (p = 0.0003), TCGT (p = 0.0044), and UVM (p = 0.00026) (Figure 3B–Q). Next, we generated four forest plots for OS, PFI, DFI, DSS. For OS, high FOXS1 expression was associated with lower OS in patients with ACC (p = 0.018), LGG (p = 0.00029), LICH (p = 0.034), MESO (p = 0.0035), PAAD (p = 0.014), SKCM (p = 0.0057), STAD (p = 0.0003), TCGT (p = 0.0044), and UVM (p =0.00026) (Figure 4A). For PFI, better PFI rates were detected in patients with low FOXS1 in ACC (P = 0.0091), CESC (P = 0.027), COAD (P = 0.047), KIRP (P < 0.00001), MESO (P = 0.0039), PRAD (P < 0.00001), STAD (P = 0.011), and UVM (P = 0.0013). However, low FOXS1 expression was linked to worse PFI rates in THCA (p =0.0026) (Figure 4B). For DFI, high FOXS1 level correlated with lower DFI in patients with ACC (P = 0.0049), ESCA (P = 0.031), KIRP (P = 0.00036), PRAD (P = 0.0011), and STAD (P = 0.016) (Figure 4C). On the other hand, the results were clear that high expression of FOXS1 was related to bad clinical outcomes of ACC (P = 0.0014), COAD (P = 0.0023), ESCA (P = 0.02), KIRP (P < 0.00001), LGG (P = 0.003), MESO (P = 0.0043), STAD (P = 0.0093), THYM (P = 0.032), and UVM (P= 0.0079) for DSS (Figure 4D).
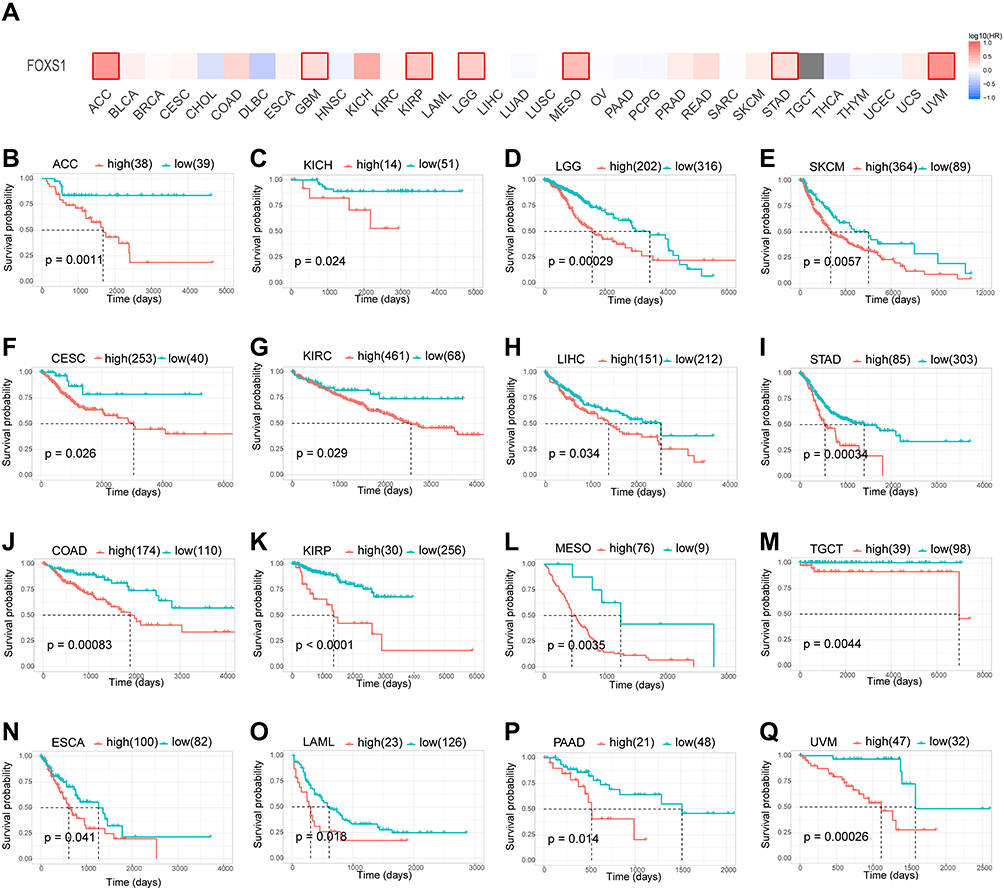 |
Figure 3 Relationship between FOXS1 level and OS. (A) The survival heat map from the GEPIA2 tool. (B–Q) Kaplan-Meier curves were used to characterize OS in pan-cancer. High expression of FOXS1 was associated with worse OS prognosis in ACC, CESC, COAD, ESCA, KICH, KIRC), KIRP, LAML, LGG, LICH, MESO, PAAD, SKCM, STAD, TCGT, and UVM. Only significant differences were indicated in the results. (R packages “survival” and “survminer”). |
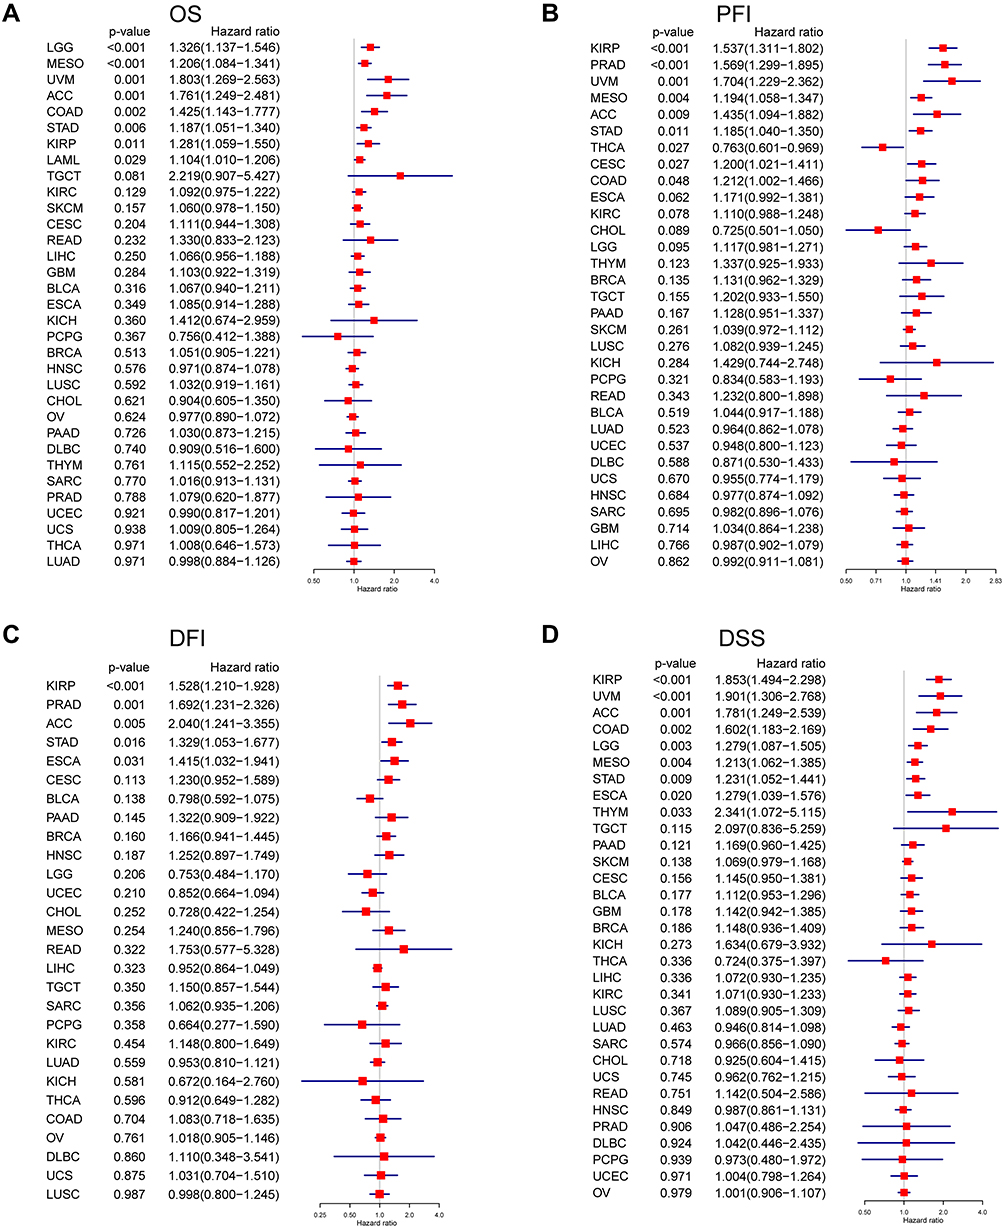 |
Figure 4 Prognostic value of FOXS1 based on TGCA dataset in various cancers. Univariate Cox regression analysis was used to analyze the correlation between FOXS1 mRNA expression and OS (A), PFI (B), DFI (C), DSS (D) across 33 tumors. |
GSVA and GSEA Analysis of FOXS1 in Cancers
To determine the potential pathways of FOXS1 in cancers, we utilized GSVA to evaluate which biological hallmark pathways were associated with this gene expression. For GSVA, we found that FOXS1 was linked to several proliferation-related and immune-related pathways, such as EMT, angiogenesis, Notch Signaling, TGF-beta signaling, KRAS signaling, Wnt/beta-catenin signaling, IL2 signaling pathway (Figure 5). We also found that the expression of FOXS1 was associated with tumor progression and immune regulation-related biological mechanisms in GSEA, including blood vessel development, vasculature development, cell adhesion, cell activation, immune system development as well as adaptive and innate immune response (Supplementary Figure S4). The data above demonstrated that FOXS1 may plays an essential role in cancer progression and tumor immune responses.
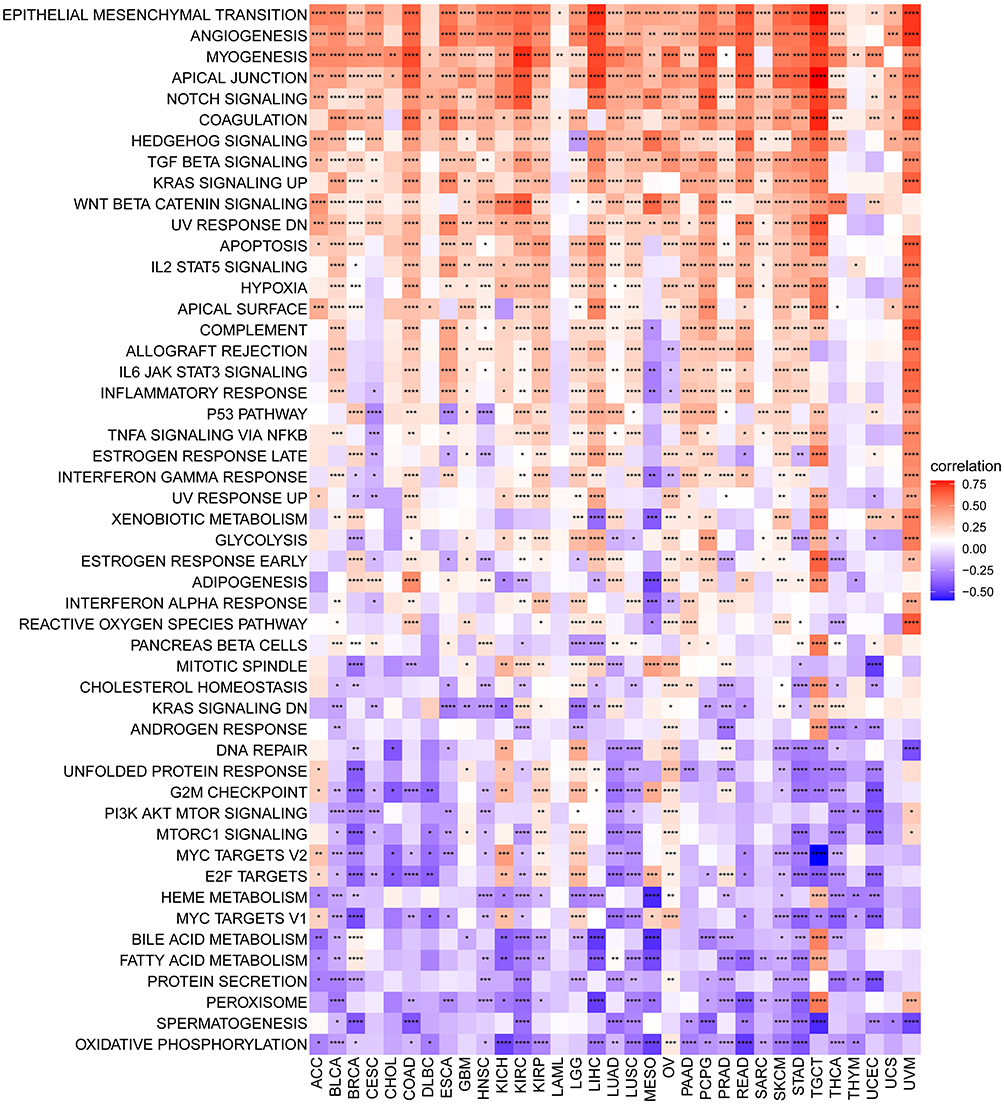 |
Figure 5 GSVA of FOXS1 in pan-cancer. The heatmap exhibits the relationship between FOXS1 expression and 50 Hallmark pathways. (*p < 0.05, **p < 0.01, ***p < 0.001, ****p < 0.0001). |
Correlations of FOXS1 Expression with TME
Cancer cell behavior is strongly influenced by the surrounding cells of the tumor microenvironment (TME). We used ESTIMATE to compute the TME-related scores and Tumor purity (Figure 6). We found FOXS1 expression was associated with Stromal Score (except DLBC and LAML) (Figure 6A and E). We also ascertained that FOXS1 expressions are positively related to ESTIMATE scores (except DLBC, ACC, SARC, MESO, OV, and LAML) (Figure 6B and E). Furthermore, low FOXS1 expression was linked to low immune scores in BLCA, COAD, READ, ESCA, LICH, PAAD, PCPG, PRAD (1 > r > 0.3) and BRCA, HNSC, KIRP, KIRC, LGG, LUAD, LUSC, SKCM, STAD, UCEC, UVM (0.3 > r > 0.1). However, FOXS1 expression was negatively related to immune scores in OV (Figure 6C and E). In addition, we found tumor purity had a negative correlation with FOXS1 expression in patients with BLCA, BRCA, CESC, COAD, READ, ESCA, GBM, HNSC, KIRC, KIRP, LGG, LIHC, LUAD, LUSC, PAAD, PCPG, PRAD, SKCM, STAD, TGCT, THCA, UCEC, UCS, and UVM (Figure 6D and E). Next, the association between the FOXS1 level and different signatures in pan-cancer was displayed in Figure 7. FOXS1 expression was positively linked with stromal and immune relevant signature (Figure 7). The data above proved that FOXS1 plays a key role in the tumor microenvironment (TME) disorder (Figures 6 and 7).
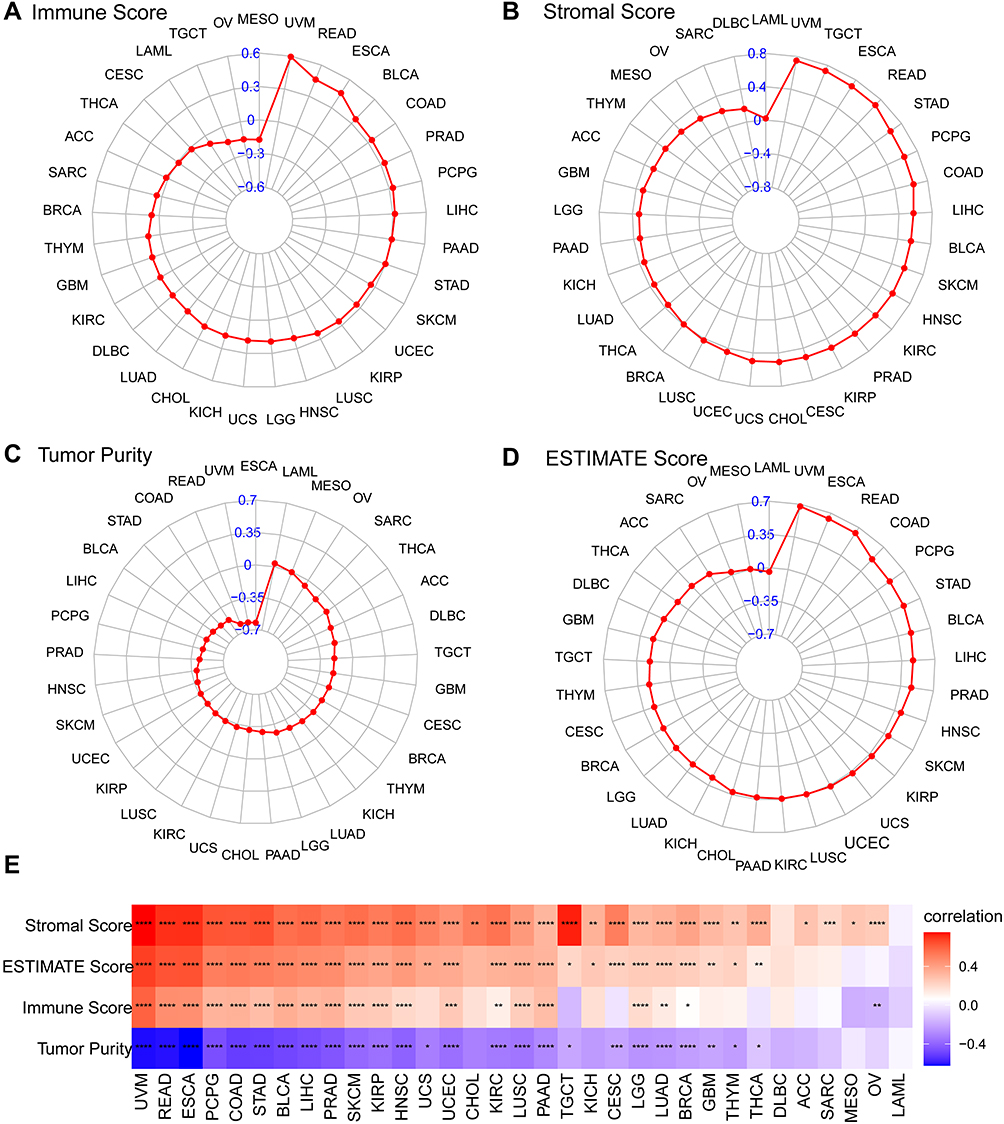 |
Figure 6 Correlation analysis between FOXS1 and TME. Four radar charts show the relationship between FOXS1 expression and stromal scores (A), ESTIMATE scores (B), immune scores (C), Tumor purity (D). The heatmap exhibits the relationship between FOXS1 expression and ESTIMATE analysis (E). (*p < 0.05, **p < 0.01, ***p < 0.001, ****p < 0.0001). |
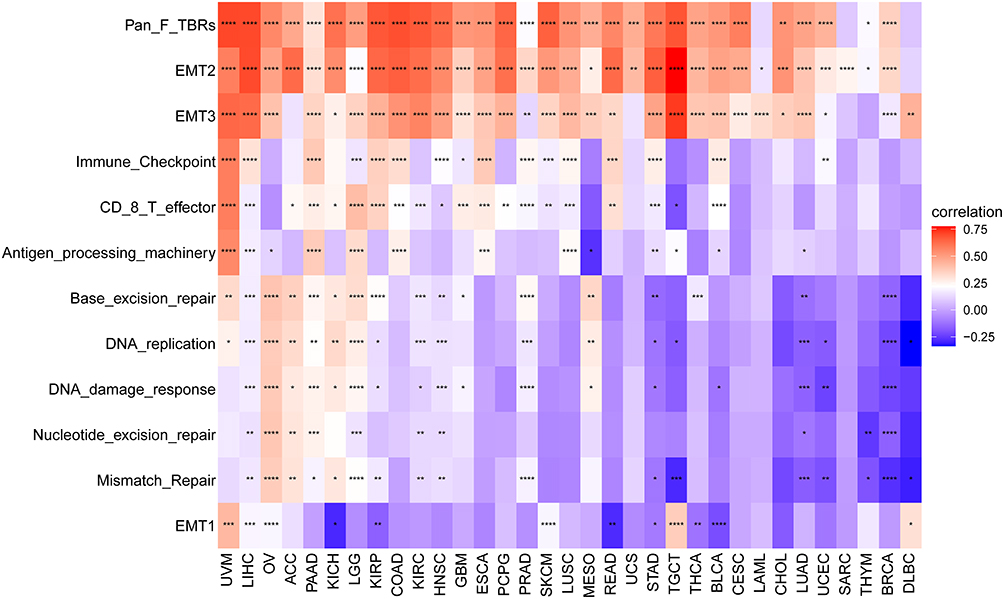 |
Figure 7 Correlation between FOXS1 expression and TME-related biological processes. (*p < 0.05, **p < 0.01, ***p < 0.001, ****p < 0.0001). |
Immune Cell Infiltration and Immune-Related Genes Analysis
Algorithms of TIMER2 were utilized to assess the possible relationship between FOXS1 gene expression and changes in the infiltration of diverse immune cell subtypes. A statistically positive correlation was observed between FOXS1 expression and immunoregulatory cell populations including Treg cells and the immune infiltration of tumor-associated macrophages (TAMs), especially M2-like TAMs (Figure 8A). Using the ImmuCellAI database and a recently published study, the character of FOXS1 in immune cell infiltration was also investigated. Outcomes displayed that the level of Treg cell and TAM infiltration was remarkably positively associated with FOXS1 expression in most cancer types, which is consistent with the TIMER2 results (Figure 8B and C). Cancer-associated fibroblasts (CAFs) and endothelial cells were also positively associated with FOXS1 gene levels in most cancers (Figure 8A). Next, we explored the correlation between FOXS1 expression and immune-related genes through co-expression analyses in different cancer types. Our studies showed that FOXS1 expression was positively correlated with part major histocompatibility complex (MHC) (Figure 9A), immunosuppressive marker genes (Figure 9B), chemokines (Figure 9C), and chemokine receptors (Figure 9D). In these immunosuppressive genes, TGFB1 and ARORA2A were noticeably correlated with FOXS1 expression in most cancer types.
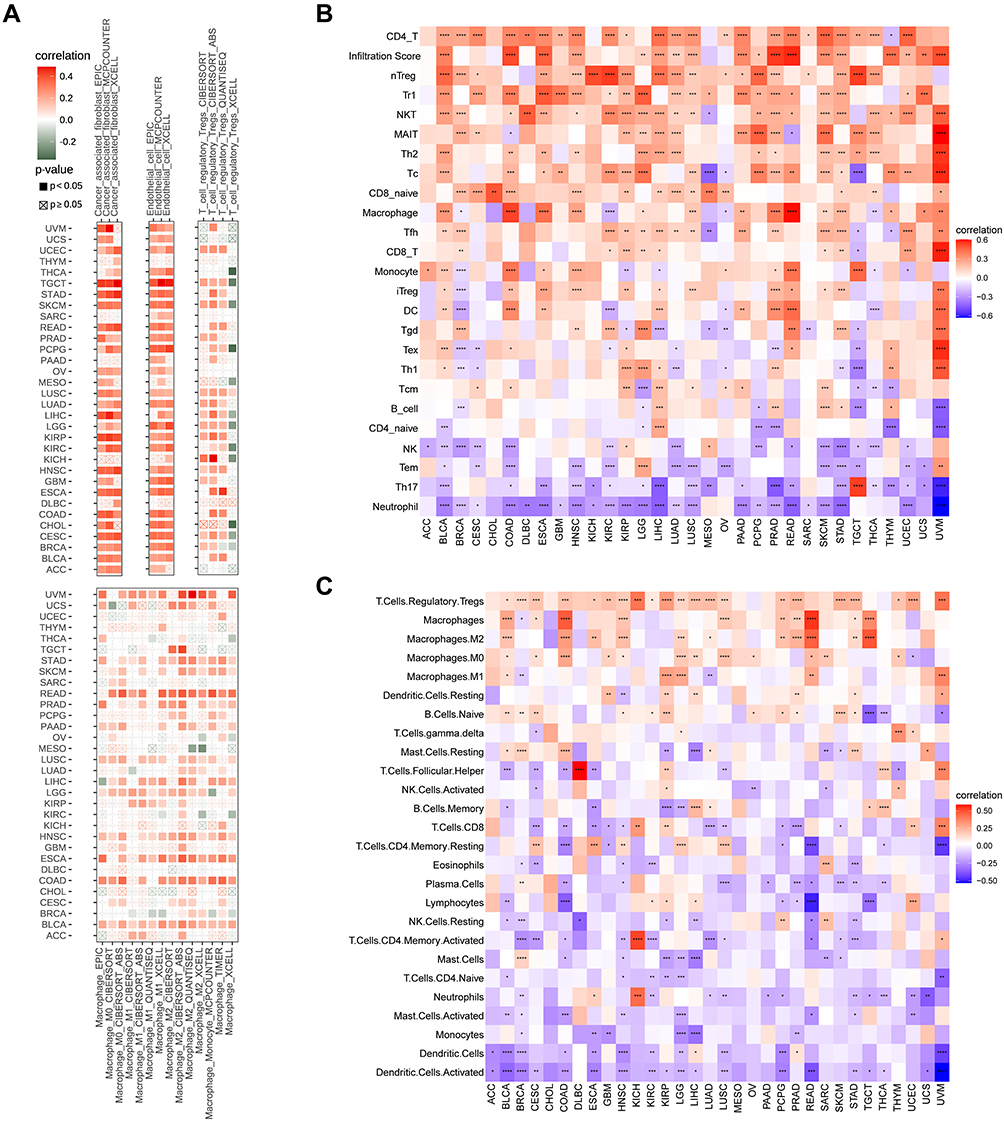 |
Figure 8 Relationship between FOXS1 expression and different immune cells infiltration levels. Correlation between FOXS1 expression and different immune-related cells from TIMER2 database (A), ImmuCellAI database (B) a recent study (C). (*P < 0.05, **P < 0.01, ***P < 0.001, ****P < 0.0001). |
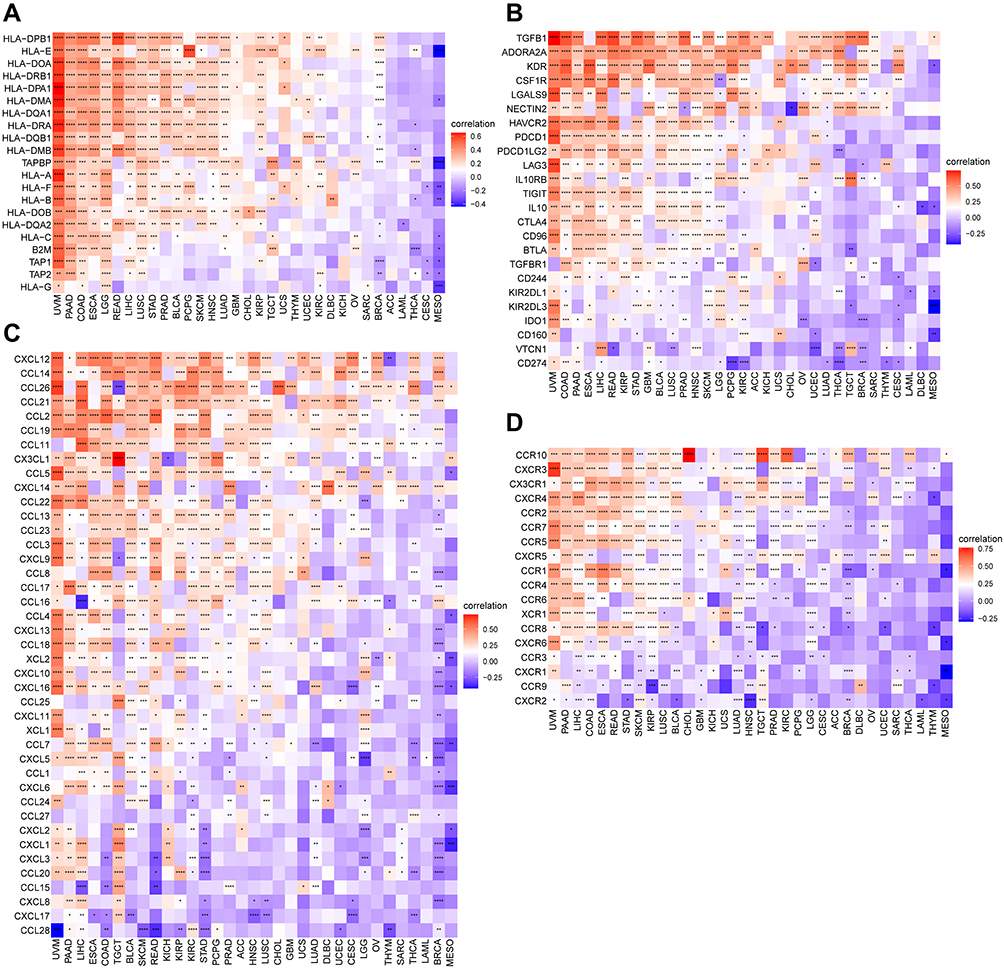 |
Figure 9 Correlation between FOXS1 transcript-level and immune-related genes including MHC genes (A), immunosuppressive genes (B), chemokines (C), and chemokine receptors (D) (*p < 0.05, **p < 0.01, ***p < 0.001, ****p < 0.0001). |
Discussion
The mammalian Forkhead family of transcription factors belongs to the “winged helix” class of DNA-binding proteins and encompasses 19 subfamilies, and the human genome contains over 40 FOX genes.23–25 They reveal a functional diversity in cell metabolism, apoptosis differentiation, migration, and proliferation.26 Previous studies showed FOXS1 plays a crucial role in embryogenesis, particularly for normal testes and brain tissues development, and FOXS1 is silenced in most nontumor tissues.23,27,28 To date, however, the role of FOXS1 in pan-cancer is far from conclusive. Only a few studies have been showing the role of FOXS1 S1 in tumor development, and even conflicting data have been reported. In gastric cancer, FOXS1 downregulates the wnt/β-catenin signaling pathway and inhibits proliferation, metastasis, and EMT in SNU-216 cells but promotes EMT and cell6 proliferation regulated by GLI1 and miR-125a-5p in SGC7901 and BGC823 cells.12,29 Similar contradictions have been published in liver cancer research.30,31
Our data suggest that FOXS1 is overexpressed in most tumor types, indicating that this gene is likely functioning as an oncogene in tumor progression. Like alpha-fetoprotein (AFP) in HCC, FOXS1 may have the oncofetal expression pattern: a peculiar gene highly expressed in embryonic tissues and silenced in normal adult cells but reactivated in tumors.31,32 This view has been confirmed in our study as the FOXS1 promoter methylation level was negatively correlated with its transcription in most cancer types. A high FOXS1 promoter methylation level can serve as a prognostic biomarker. Furthermore, we generated Kaplan–Meier survival curves and Cox proportional hazards model analysis to ascertain the prognostic value of FOXS1 in tumor types. These results highlighted FOXS1 as a significant prognostic biomarker in pan-cancer. Next, our GSVA and GSEA results suggested that FOXS1 is linked to several proliferation-related and immune-related pathways, such as EMT, angiogenesis, Notch Signaling, TGF-beta signaling, KRAS signaling, Wnt/beta-catenin signaling, IL2 signaling pathway.
The TME in cancer comprises epithelial cells, immune cells, cancer-associated fibroblasts (CAFs), stromal components, extracellular matrix, blood vessels, and signaling molecules.33 Interactions between cancer cells and nonmalignant cells construct a TME that influences cancer development and progression.34 The nonmalignant cells in the TME often play a pro-tumorigenic function in stimulating uncontrolled cell proliferation at all phases of carcinogenesis.35 These cells also provide an easy pathway for cancer cells to invade adjacent healthy tissues and spread to other parts of the body through blood vessels or lymphatics.35 The TME incorporates several cellular components, including endothelial cells, fibroblast, and immune cells. As we know, the most influential immune cells in the TME are the tumor associated-macrophages (TAMs) and Treg cells.34,36 These immune cells have diverse functions in cancer development and progression. They can suppress antitumor immune mechanisms responses and enhance the possibilities of tumors to evade an immune attack and then help cancer cells extravasate at distant sites.37 In the present study, FOXS1 is negatively correlated with Tumor Purity. Immediately after, we utilized three different approaches to estimate how FOXS1 levels correlate with immune-related cells. We obtained similar outcomes. The expression of transcriptional factors (FOXS1) in cancers was positively related to Treg cells and TAMs, especially M2-like macrophages. These results suggested that FOXS1 may be a feasible drug target to reduce the infiltration level of Treg cells and TAMs. Finally, our study further unraveled an intense link between FOXS1 expression level and immune-related genes. Significantly, in most tumor types, FOXS1 expression was correlated with TGFB1 and ARORA2A, which were verified to be the immune-suppressing genes in the tumor microenvironment.38,39 TGFB1 and ARORA2A can inhibit the generation, differentiation, and immune responses, as well as induce Treg cells infiltration into tumor microenvironment.38,39 Altogether, these results demonstrated that FOXS1 may affects the tumor microenvironment, and the upregulation of FOXS1 refers to the immunosuppression microenvironment. FOXS1 may be a feasible drug target to reduce the infiltration level of Treg cells and TAMs. So, our studies suggested downregulated FOXS1 gene will be the new strategy in tumor immunotherapy. However, our study had some limitations. First, it was mainly dependent on bioinformatics analysis and based on public patient data. Second, because of funding constraints, we could not include more wet-lab experimentalists in vivo and in vitro.
Conclusion
To the best of our knowledge, our research is the first study to explore the potential key role of FOXS1 as a biological predictive and prognostic marker in pan-cancer. Using bioinformatics analysis, we have identified FOXS1 over-expression to be predictive of a high level of Treg cells and TAMs infiltration, leading to a tumor immunosuppressive microenvironment. Future research should validate these results and explore the upstream and downstream signal pathways of FOXS1.
Abbreviations
TIME, tumor immune microenvironment; TME, tumor microenvironment; TCGA, The Cancer Genome Atlas; GTEx, genotype-tissue expression; CCLE, Cancer Cell Line Encyclopedia; ICIs, immune checkpoint inhibitors; EMT, epithelial–mesenchymal transition; OS, Overall survival; DSS, disease-specific survival; DFI, disease-free interval; PFI, progression-free interval; GSEA, Gene Set Enrichment Analysis; GSVA, Gene Set Variation Analysis; PAAD, pancreatic adenocarcinoma; LAML, acute myeloid leukemia; CESC, cervical squamous cell carcinoma and endocervical adenocarcinoma; ACC, Adrenocortical carcinoma; BLCA, bladder urothelial carcinoma; BRCA, breast invasive carcinoma; CHOL, cholangiocarcinoma; COAD, colon adenocarcinoma; DLBC, lymphoid neoplasm diffuse large B-cell lymphoma; ESCA, esophageal carcinoma; GBM, glioblastoma multiforme; HNSC, head and neck squamous cell carcinoma; KICH, kidney chromophobe; KIRC, kidney renal clear cell carcinoma; LGG, brain lower grade glioma; LIHC, liver hepatocellular carcinoma; LUSC, lung squamous cell carcinoma; OV, ovarian serous cystadenocarcinoma; PCPG, pheochromocytoma and paraganglioma; PRAD, prostate adenocarcinoma; READ, rectum adenocarcinoma; SKCM, skin cutaneous melanoma; STAD, stomach adenocarcinoma; THYM, thymoma; KIRP, kidney renal papillary cell carcinoma; LUAD, lung adenocarcinoma; TGCT, testicular germ cell tumors; UCEC, uterine corpus endometrial carcinoma; SARC, sarcoma; THCA, thyroid carcinoma; UVM, uveal melanoma; UCS, uterine carcinosarcoma; MESO, mesothelioma; TAMs, tumor-associated macrophages; CAFs, cancer-associated fibroblasts; AFP, alpha fetoprotein.
Ethics Approval and Informed Consent
This study was exempted from review by the Ethic Committee of Eye Hospital of Wenzhou Medical University.
Acknowledgments
We acknowledge the contributions from UALCAN databases, ImmuCellAI, GEPIA2, TIMER, and cBioPortal for Cancer Genomics. We also thank “Sheng Xin Xiao Ke Tang” for providing helpful insights and suggestions.
Disclosure
The authors do not have any conflicts of interest to report for this work.
References
1. Sung H, Ferlay J, Siegel RL, et al. Global cancer statistics 2020: GLOBOCAN estimates of incidence and mortality worldwide for 36 cancers in 185 countries. CA Cancer J Clin. 2021;71(3):209–249. doi:10.3322/caac.21660
2. Jemal A, Bray F, Center MM, Ferlay J, Ward E, Forman D. Global cancer statistics. CA Cancer J Clin. 2011;61(2):69–90. doi:10.3322/caac.20107
3. He X, Chang S, Zhang J, et al. MethyCancer: the database of human DNA methylation and cancer. Nucleic Acids Res. 2008;36(Databaseissue):D836–841. doi:10.1093/nar/gkm730
4. Shrihari TG. Innate and adaptive immune cells in tumor microenvironment. Gulf J Oncolog. 2021;1(35):77–81.
5. Gangoso E, Southgate B, Bradley L, et al. Glioblastomas acquire myeloid-affiliated transcriptional programs via epigenetic immunoediting to elicit immune evasion. Cell. 2021;184(9):2454–2470 e2426. doi:10.1016/j.cell.2021.03.023
6. Desbois M, Udyavar AR, Ryner L, et al. Integrated digital pathology and transcriptome analysis identifies molecular mediators of T-cell exclusion in ovarian cancer. Nat Commun. 2020;11(1):5583. doi:10.1038/s41467-020-19408-2
7. Noseda R, Bertoli R, Muller L, Ceschi A. Haemophagocytic lymphohistiocytosis in patients treated with immune checkpoint inhibitors: analysis of WHO global database of individual case safety reports. J Immunother Cancer. 2019;7(1):117. doi:10.1186/s40425-019-0598-9
8. Murciano-Goroff YR, Warner AB, Wolchok JD. The future of cancer immunotherapy: microenvironment-targeting combinations. Cell Res. 2020;30(6):507–519. doi:10.1038/s41422-020-0337-2
9. Jayaraman P, Parikh F, Newton JM, et al. TGF-beta1 programmed myeloid-derived suppressor cells (MDSC) acquire immune-stimulating and tumor killing activity capable of rejecting established tumors in combination with radiotherapy. Oncoimmunology. 2018;7(10):e1490853. doi:10.1080/2162402X.2018.1490853
10. Weng W, Okugawa Y, Toden S, Toiyama Y, Kusunoki M, Goel A. FOXM1 and FOXQ1 are promising prognostic biomarkers and novel targets of tumor-suppressive miR-342 in human colorectal cancer. Clin Cancer Res. 2016;22(19):4947–4957. doi:10.1158/1078-0432.CCR-16-0360
11. Liu H, Yin J, Wang H, et al. FOXO3a modulates WNT/beta-catenin signaling and suppresses epithelial-to-mesenchymal transition in prostate cancer cells. Cell Signal. 2015;27(3):510–518. doi:10.1016/j.cellsig.2015.01.001
12. Lu Q, Ma X, Li Y, et al. Overexpression of FOXS1 in gastric cancer cell lines inhibits proliferation, metastasis, and epithelial-mesenchymal transition of tumor through downregulating wnt/beta-catenin pathway. J Cell Biochem. 2019;120(3):2897–2907. doi:10.1002/jcb.26821
13. Zeng D, Li M, Zhou R, et al. Tumor microenvironment characterization in gastric cancer identifies prognostic and immunotherapeutically relevant gene signatures. Cancer Immunol Res. 2019;7(5):737–750. doi:10.1158/2326-6066.CIR-18-0436
14. Zweig AS, Karolchik D, Kuhn RM, Haussler D, Kent WJ. UCSC genome browser tutorial. Genomics. 2008;92(2):75–84. doi:10.1016/j.ygeno.2008.02.003
15. Cerami E, Gao J, Dogrusoz U, et al. The cBio cancer genomics portal: an open platform for exploring multidimensional cancer genomics data. Cancer Discov. 2012;2(5):401–404. doi:10.1158/2159-8290.CD-12-0095
16. Tang Z, Kang B, Li C, Chen T, Zhang Z. GEPIA2: an enhanced web server for large-scale expression profiling and interactive analysis. Nucleic Acids Res. 2019;47(W1):W556–W560. doi:10.1093/nar/gkz430
17. Nagy A, Munkacsy G, Gyorffy B. Pancancer survival analysis of cancer hallmark genes. Sci Rep. 2021;11(1):6047. doi:10.1038/s41598-021-84787-5
18. Yu G, He QY. ReactomePA: an R/Bioconductor package for reactome pathway analysis and visualization. Mol Biosyst. 2016;12(2):477–479. doi:10.1039/C5MB00663E
19. Hanzelmann S, Castelo R, Guinney J. GSVA: gene set variation analysis for microarray and RNA-seq data. BMC Bioinform. 2013;14:7. doi:10.1186/1471-2105-14-7
20. Li T, Fu J, Zeng Z, et al. TIMER2.0 for analysis of tumor-infiltrating immune cells. Nucleic Acids Res. 2020;48(W1):W509–W514. doi:10.1093/nar/gkaa407
21. Miao YR, Zhang Q, Lei Q, et al. ImmuCellAI: a unique method for comprehensive T-cell subsets abundance prediction and its application in cancer immunotherapy. Adv Sci (Weinh). 2020;7(7):1902880. doi:10.1002/advs.201902880
22. Thorsson V, Gibbs DL, Brown SD, et al. The immune landscape of cancer. Immunity. 2018;48(4):812–830 e814. doi:10.1016/j.immuni.2018.03.023
23. Cederberg A, Betz R, Lagercrantz S, et al. Chromosome localization, sequence analysis, and expression pattern identify FKHL 18 as a novel human forkhead gene. Genomics. 1997;44(3):344–346. doi:10.1006/geno.1997.4864
24. Gong Z, Yu J, Yang S, Lai PBS, Chen GG. FOX transcription factor family in hepatocellular carcinoma. Biochim Biophys Acta Rev Cancer. 2020;1874(1):188376. doi:10.1016/j.bbcan.2020.188376
25. Wang J, Li W, Zhao Y, et al. Members of FOX family could be drug targets of cancers. Pharmacol Ther. 2018;181:183–196. doi:10.1016/j.pharmthera.2017.08.003
26. Jin Y, Liang Z, Lou H. The emerging roles of fox family transcription factors in chromosome replication, organization, and genome stability. Cells. 2020;9(1):258. doi:10.3390/cells9010258
27. Heglind M, Cederberg A, Aquino J, Lucas G, Ernfors P, Enerback S. Lack of the central nervous system- and neural crest-expressed forkhead gene Foxs1 affects motor function and body weight. Mol Cell Biol. 2005;25(13):5616–5625. doi:10.1128/MCB.25.13.5616-5625.2005
28. Sato Y, Baba T, Zubair M, et al. Importance of forkhead transcription factor Fkhl18 for development of testicular vasculature. Mol Reprod Dev. 2008;75(9):1361–1371. doi:10.1002/mrd.20888
29. Wang S, Ran L, Zhang W, et al. FOXS1 is regulated by GLI1 and miR-125a-5p and promotes cell proliferation and EMT in gastric cancer. Sci Rep. 2019;9(1):5281. doi:10.1038/s41598-019-41717-w
30. Lei D, Hu G, Chen Y, Hao T, Gao Y, Luo F. Forkhead box S1 inhibits the progression of hepatocellular carcinoma. Onco Targets Ther. 2020;13:11839–11848. doi:10.2147/OTT.S272596
31. Bevant K, Desoteux M, Angenard G, et al. TGFbeta-induced FOXS1 controls epithelial-mesenchymal transition and predicts a poor prognosis in liver cancer. Hepatol Commun. 2021. doi:10.1002/hep4.1866
32. Schillebeeckx M, Pihlajoki M, Gretzinger E, et al. Novel markers of gonadectomy-induced adrenocortical neoplasia in the mouse and ferret. Mol Cell Endocrinol. 2015;399:122–130. doi:10.1016/j.mce.2014.09.029
33. Spill F, Reynolds DS, Kamm RD, Zaman MH. Impact of the physical microenvironment on tumor progression and metastasis. Curr Opin Biotechnol. 2016;40:41–48. doi:10.1016/j.copbio.2016.02.007
34. Arneth B. Tumor microenvironment. Medicina (Kaunas). 2019;56(1). doi:10.3390/medicina56010015
35. Hanahan D, Weinberg RA. Hallmarks of cancer: the next generation. Cell. 2011;144(5):646–674. doi:10.1016/j.cell.2011.02.013
36. Giganti G, Atif M, Mohseni Y, et al. Treg cell therapy: how cell heterogeneity can make the difference. Eur J Immunol. 2021;51(1):39–55. doi:10.1002/eji.201948131
37. Grivennikov SI, Greten FR, Karin M. Immunity, inflammation, and cancer. Cell. 2010;140(6):883–899. doi:10.1016/j.cell.2010.01.025
38. Woo SR, Corrales L, Gajewski TF. Innate immune recognition of cancer. Annu Rev Immunol. 2015;33:445–474. doi:10.1146/annurev-immunol-032414-112043
39. Sek K, Molck C, Stewart GD, Kats L, Darcy PK, Beavis PA. Targeting adenosine receptor signaling in cancer immunotherapy. Int J Mol Sci. 2018;19(12). doi:10.3390/ijms19123837
 © 2022 The Author(s). This work is published and licensed by Dove Medical Press Limited. The full terms of this license are available at https://www.dovepress.com/terms.php and incorporate the Creative Commons Attribution - Non Commercial (unported, v3.0) License.
By accessing the work you hereby accept the Terms. Non-commercial uses of the work are permitted without any further permission from Dove Medical Press Limited, provided the work is properly attributed. For permission for commercial use of this work, please see paragraphs 4.2 and 5 of our Terms.
© 2022 The Author(s). This work is published and licensed by Dove Medical Press Limited. The full terms of this license are available at https://www.dovepress.com/terms.php and incorporate the Creative Commons Attribution - Non Commercial (unported, v3.0) License.
By accessing the work you hereby accept the Terms. Non-commercial uses of the work are permitted without any further permission from Dove Medical Press Limited, provided the work is properly attributed. For permission for commercial use of this work, please see paragraphs 4.2 and 5 of our Terms.