")
Back to Journals » Diabetes, Metabolic Syndrome and Obesity » Volume 7
Palmitoleic acid reduces intramuscular lipid and restores insulin sensitivity in obese sheep
Authors Duckett S, Volpi-Lagreca G, Alende M, Long N
Received 14 August 2014
Accepted for publication 23 September 2014
Published 20 November 2014 Volume 2014:7 Pages 553—563
DOI https://doi.org/10.2147/DMSO.S72695
Checked for plagiarism Yes
Review by Single anonymous peer review
Peer reviewer comments 5
Editor who approved publication: Professor Ming-Hui Zou
Susan K Duckett, Gabriela Volpi-Lagreca, Mariano Alende, Nathan M Long
Animal and Veterinary Sciences Department, Clemson University, Clemson, SC, USA
Abstract: Obese sheep were used to assess the effects of palmitoleic (C16:1 cis-9) acid infusion on lipogenesis and circulating insulin levels. Infusion of 10 mg/kg body weight (BW)/day C16:1 intravenously in obese sheep reduced (P<0.01) weight gain by 77%. Serum palmitoleic levels increased (P<0.05) in a linear manner with increasing levels of C16:1 infusion. Cis-11 vaccenic (C18:1 cis-11) acid, a known elongation product of palmitoleic acid, was also elevated (P<0.05) in serum after 14 days and 21 days of infusion. Plasma insulin levels were lower (P<0.05) (10 mg/kg BW/day C16:1) than controls (0 mg/kg BW/day C16:1) at 14 days and 28 days of infusion. Infusion of C16:1 resulted in linear increases in tissue concentrations of palmitoleic, cis-11 vaccenic, eicosapentaenoic, and docosapentaenoic acids in a dose-dependent manner. Total lipid content of the semitendinosus (ST) muscle and mesenteric adipose tissue was reduced (P<0.01) in both 5 mg/kg and 10 mg/kg BW C16:1 dose levels. Total lipid content and mean adipocyte size in the longissimus muscle was reduced (P<0.05) in the 10 mg/kg BW C16:1 dose level only, whereas total lipid content and adipocyte size of the subcutaneous adipose tissue was not altered. Total lipid content of the liver was also unchanged with C16:1 infusion. Palmitoleic acid infusion upregulated (P<0.05) acetyl-CoA carboxylase (ACC), fatty acid elongase-6 (ELOVL6), and Protein kinase, AMP-activated, alpha 1 catalytic subunit, transcript variant 1 (AMPK) mRNA expressions in liver, subcutaneous adipose, and ST muscle compared to the controls. However, mRNA expression of glucose transporter type 4 (GLUT4) and carnitine palmitoyltransferase 1b (CPT1B) differed between tissues. In the subcutaneous adipose and liver, C16:1 infusion upregulated (P<0.05) GLUT4 and CPT1B, whereas these genes were downregulated (P<0.05) in ST muscle with C16:1 infusion. These results show that C16:1 infusion for 28 days reduced weight gain, intramuscular adipocyte size and total lipid content, and circulating insulin levels. These changes appear to be mediated through alterations in expression of genes regulating glucose uptake and fatty acid oxidation specifically in the muscles.
Keywords: adipocytes, longissimus muscle, lipogenesis, insulin level, serum, fatty acid
Introduction
Palmitoleic (C16:1 cis-9) acid is a unique monounsaturated fatty acid that is produced almost exclusively through desaturation of palmitic acid via stearoyl-CoA desaturase-1 (SCD1). Dietary sources of palmitoleic acid are very limited with natural sources being macadamia oil and sea buckthorn oil, which contain about 19%–28% of palmitoleic acid. Palmitoleic acid has recently been named a lipokine that regulates lipogenesis and coordinates systemic metabolism.1 These researchers found that infusing tripalmitolein versus tripalmitin for 6 hours into dietary-induced obese mice with homozygous mutations for fatty acid binding proteins (aP2, mal1) decreased SCD1, fatty acid synthase (FASN), and fatty acid elongase-6 (ELOVL6) expression in the liver compared to control. In addition, Cao et al1 suggest that palmitoleic acid acts as an insulin-sensitizing hormone that improves glucose metabolism. Knockout of SCD1 in mice reduces adipose tissue deposition, increases insulin sensitivity, and makes animals resistant to diet-induced weight gain.2 In our laboratory, exogenous administration of palmitoleic acid to bovine adipocytes in vitro downregulates de novo lipogenesis and upregulates fatty acid oxidation to direct fatty acids toward energy expenditure and away from storage.3,4 The objective of this experiment was to assess the effects of palmitoleic (C16:1) acid infusion at varying dose levels on lipogenesis and circulating insulin levels in obese sheep.
Materials and methods
Animals and sampling
Southdown sheep (n=15; 95 kg body weight [BW]) were used to assess the effects of palmitoleic (C16:1 cis-9) acid infusion on lipogenesis and circulating insulin levels in obese sheep. Omega-7 enriched oil (Provinal™; Tersus Pharmaceuticals) was infused, twice daily for 28 days via indwelling jugular catheter, at three levels of palmitoleic acid: 0 mg C16:1/kg BW/d, 5 mg C16:1/kg BW/d, or 10 mg C16:1/kg BW/d. Provinal™ is an omega-7 enhanced oil with 50% of total fatty acids as palmitoleic acid and less than 2.5% as palmitic acid. The oil was solubilized in 40% ethanol and immediately injected into the catheter at 8 am and 4 pm for each lamb. All lambs received the same amount of 40% ethanol per dose regardless of the oil level. A 16-gauge indwelling jugular catheter (Abbocath; Abbott Laboratories, Abbott Park, IL, USA) was inserted and sutured to the skin 1 day prior to initiation of experiment for substrate administration and blood sampling. Catheters were kept patent with 4% sodium citrate in sterile saline (Jorgensen Laboratories, Inc., Loveland, CO, USA). On days 0, 7, 14, and 21, blood samples were obtained from each lamb at 5 minutes postinfusion. Whole blood was placed into serum and heparinized vacuum tubes, and processed according to Long et al.5
Lambs were fed at National Research Council6 recommendations and divided into three pens with equal representation of treatments per pen. At 28 days, lambs were slaughtered. Live weight was also collected on a weekly basis, and average daily gain was calculated. At slaughter, weights of kidney, omental and mesenteric adipose tissues, as well as hot carcass weight were collected. Samples of subcutaneous adipose tissue at the 12th rib, semitendinosus (ST) muscle, and liver were collected at slaughter and immediately frozen in liquid nitrogen for storage at −80°C until subsequent RNA extraction. At 24 hours postmortem, carcass data were collected and samples obtained from subcutaneous and intramuscular adipose tissues of the longissimus muscle for cell size determination. Samples of subcutaneous adipose, mesenteric adipose, longissimus muscle, ST muscle, and liver were collected for total lipid and fatty acid composition. One side of each carcass from 0 mg C16:1/kg BW/d and 10 mg C16:1/kg BW/d treatments was used to assess body composition analyses by physical dissection and proximate analyses.
Glucose and insulin
Glucose and insulin levels were measured as described by Long and Schafer.7
Proximate analyses
Dissected muscle and adipose tissues for body composition analyses were ground and mixed, and samples were obtained for proximate analyses according to Duckett et al.8
Adipocyte size and distribution
Adipose tissue samples were collected from intramuscular (dissected from longissimus muscle at the 12th rib) and subcutaneous (at the 12th rib) depots for determination of adipocyte cell size according to Etherton et al.9 Adipocytes were counted and sized using a particle sizing and counting analyzer (Multisizer 4 Coulter Counter; Beckman Coulter Inc., Brea, CA, USA).
Lipids
Adipose, muscle samples, and liver were frozen, lyophilized, and ground in a food processor. Serum samples (1 mL) were also lyophilized. Total fat content and fatty acid composition were determined according to Duckett et al.8
For determination of lipid fractions, total lipids were extracted from ST muscle samples via Folch et al10 method. The neutral lipid, phospholipid (PhL), and free fatty acid (FFA) fractions were separated according to Ruiz et al.11 Each fraction was then dried under nitrogen, transmethylated, and analyzed by gas chromatography according to Duckett et al.8
RNA isolation
RNA was extracted from subcutaneous adipose tissues, ST muscles, and liver as described in Duckett et al.12
Quantitative PCR
Primers were designed using Primer3 software (http://primer3plus.com/) and are reported in Table 1. qPCR was conducted according to Duckett et al12 using glyceraldehyde-3-phosphate dehydrogenase (GAPDH) as the housekeeping gene. Normalized delta CT values were calculated for each sample and analyzed as described in the Statistical analyses section.
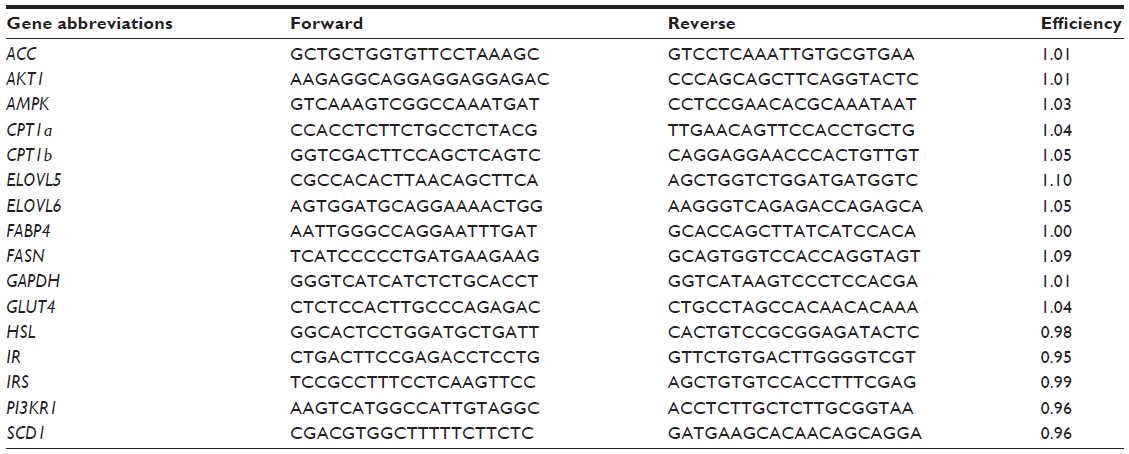 | Table 1 Primer sequences (5′–3′) for quantitative real-time PCR |
Western blots
Proteins were extracted from liver, ST, and subcutaneous adipose tissues of control (0 mg/kg BW C16:1) and high (10 mg/kg BW C16:1) levels using T-PER solution containing Halt Phosphatase Inhibitor according to the manufacturers’ recommendations. Protein concentrations were measured using Bradford method (Pierce Coomassie; Thermo Fisher Scientific, Waltham, MA, USA). Equal amounts of protein were diluted in sample reducing buffer containing 5% β-mercaptoethanol and heated at 95°C for 5 minutes. Proteins were separated using 12% polyacrylamide gels at 60 V for 30 minutes. Blotting of protein was performed on polyvinylidene difluoride membranes using a Trans-Blot (BioRad) apparatus at 350 mA for 1 hour at 4°C. Membranes were blocked with 5% fat-free milk in 0.1% Tween-20 phosphate buffered saline (PBS-Tween) at room temperature. Primary antibodies for AMPKα1 (PA1-2109, 1:5,000; Thermo Fisher Scientific) and p-AMPKα1 (PA5-17831, 1:1,000; Thermo Fisher Scientific) were incubated overnight at 4°C. Blots were washed with PBS several times and then incubated with secondary antibody (goat anti-rabbit IgG-HRP, 1:6,000 and 1:2,000; Thermo Fisher Scientific) for 1 hour at room temperature. Blots were washed with PBS several times and then SuperSignal West Femto substrate (34095; Thermo Fisher Scientific) was added for 5 minutes. Chemiluminescence was detected using an Alpha Innotech Imager (ProteinSimple, Santa Clara, CA, USA). Density of the bands was quantified using the Alpha Innotech software.
Statistical analyses
Data were analyzed in a completely randomized design using general linear models (GLM) procedures of SAS (SAS Institute Inc., Cary, NC, USA) with palmitoleic acid dose level, tissue, and two-way interaction in the model. For serum data, palmitoleic acid dose level, time for experiment, and the two-way interaction were included in the model. Orthogonal contrasts were used to assess linear or quadratic changes in variables because of dose level of palmitoleic acid infusion. For gene expression, delta CT values were analyzed using GLIMMIX procedure with treatment, tissue, and two-way interaction in the model. Gene expression levels were calculated using the ΔΔCT methods13 and are presented as fold-change in gene expression for experiment (10 mg/kg lipid weight (LW)/d C16:1) versus controls (0 mg C16:1/kg LW/d).
Results
Infusion of 10 mg/kg BW/d palmitoleic (C16:1 cis-9) acid intravenously in obese sheep reduced (P<0.01) weight gain by 77% (Table 2). Carcass traits, visceral adipose depots, and body composition were not altered (P>0.05) by palmitoleic acid infusion for 28 days. The lambs from this experiment averaged 1.95 cm of fat thickness with a body composition of 40% of total lipid, which would be considered obese. Sheep are more similar to humans in fat distribution patterns than other animal models. Sheep deposit more fat within the abdominal cavity (about 33% of total fat) than pigs or rodents.13
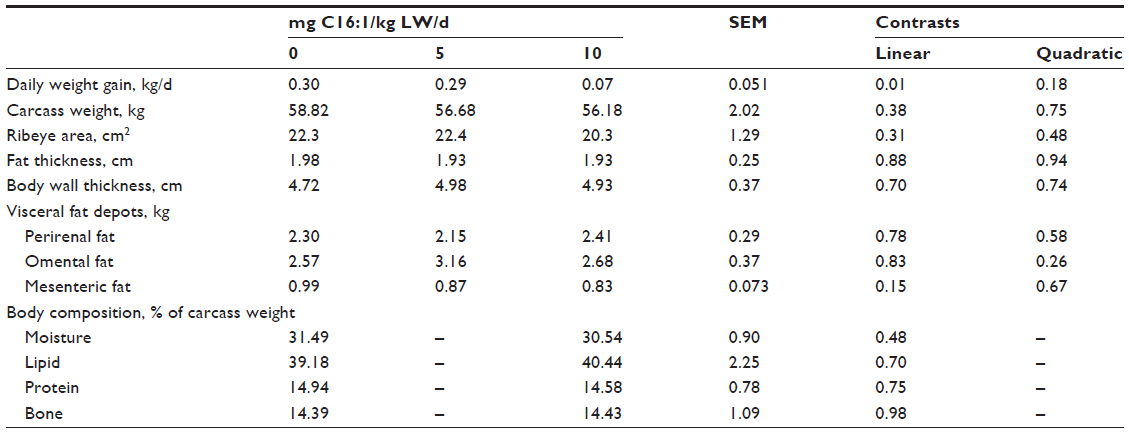 | Table 2 Gain, carcass traits, and body composition of lambs infused with varying levels of palmitoleic (C16:1) acid |
Serum palmitoleic (C16:1 cis-9) levels increased (P<0.05) in a linear manner with increasing levels of palmitoleic acid infusion when sampled at 5 minutes postinfusion (Table 3). In addition, palmitoleic acid infusion increased (P<0.001) arachidonic (C20:4) and eicosapentaenoic (C20:5) acid contents in the serum in a linear manner. Myristoleic (C14:1) and linoleic (C18:2) acid contents in the serum tended (P<0.10) to be increased in a linear manner with palmitoleic acid infusion. These changes in individual serum fatty acid content resulted in linear (P<0.05) increases in total monounsaturated and polyunsaturated n-6 content in the serum. The ratio of palmitoleic to palmitic acid in the serum was linearly (P<0.001) increased in the sheep infused with palmitoleic acid. The ratio of oleic (C18:1 cis-9) to stearic (C18:0) acid was increased (P<0.01) in a quadratic manner. All interactions between treatment and days of treatment were nonsignificant except for cis-11 vaccenic acid. Cis-11 vaccenic (C18:1 cis-11) acid, a known elongation product of palmitoleic acid,3,4 was also elevated (P<0.05) in serum after 14 days and 21 days of the experiment (Figure 1).
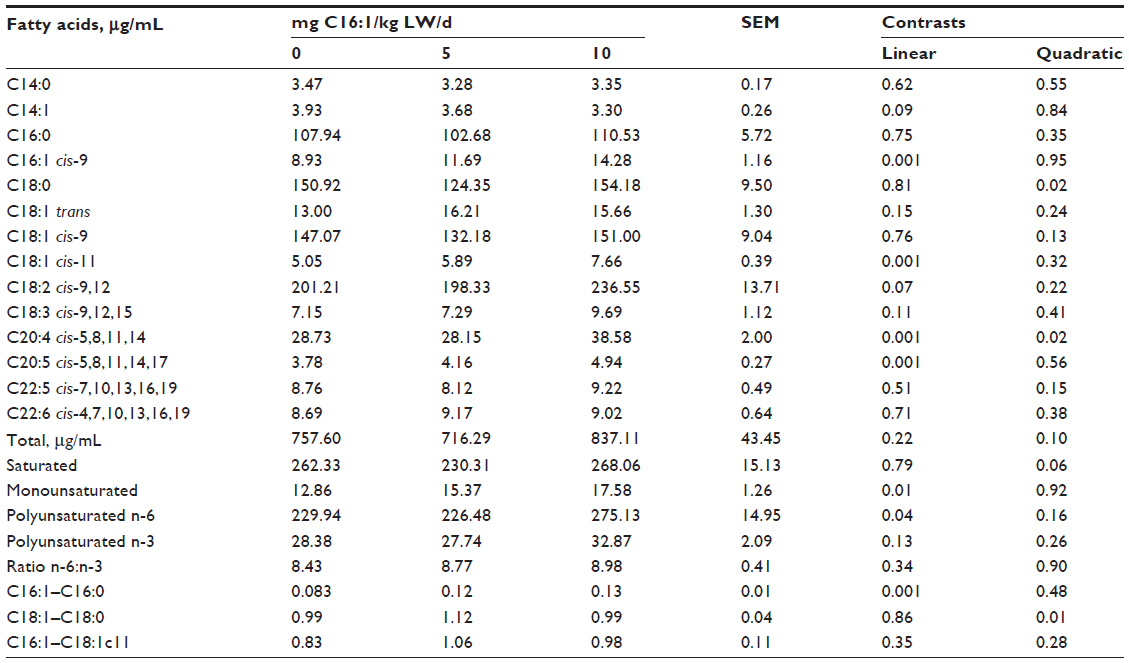 | Table 3 Serum fatty acid content from lambs infused with varying levels of palmitoleic (C16:1) acid |
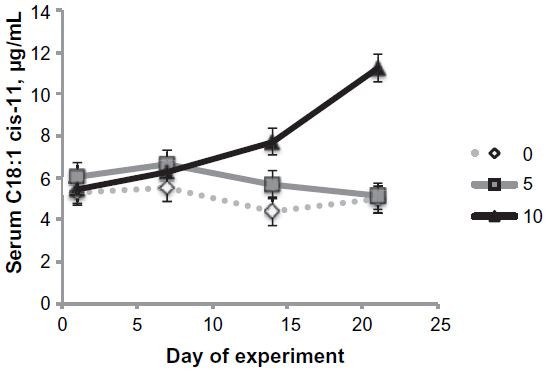 | Figure 1 Effects of palmitoleic acid infusion on serum cis-11 vaccenic acid levels. |
Plasma insulin levels were higher (P<0.05) in the 10 mg/kg BW/d C16:1 treatment than controls at the start of the experiment (Figure 2A). However, after 14 days and 28 days on treatment, insulin concentrations were lower (P<0.05) for 10 mg/kg BW/d C16:1 than controls (0 mg/kg BW). For the 5 mg/kg LW/d C16:1 dose level, circulating insulin levels were similar to controls at days 0 and 14 but were intermediate at day 28. Plasma glucose levels were unchanged with palmitoleic acid infusion and averaged 95±19.0 mg/dL. There was a treatment by time interaction (P<0.05) for Homeostatis Model Assessment-Insulin Resistance (HOMA-IR) level. HOMA-IR levels decreased (P<0.05) over time in 5 mg/kg LW/d and 10 mg/kg LW/d treatments compared to control, which did not change (P>0.05) over time (Figure 2B). Homeostatis Model Assessment-beta cell function (HOMA-B) and Homeostatis Model Assessment-insulin sensitivity (HOMA-S) values did not differ between palmitoleic acid treatment levels.
 | Figure 2 Changes in plasma insulin concentration and HOMA-IR values with palmitoleic acid infusion at three levels. |
The fatty acid concentration of longissimus muscle, ST muscle, subcutaneous adipose, mesenteric adipose, and liver tissues is shown in Table 4. There were no interactions (P>0.05) between treatment and tissue, and the data are presented as the average fatty acid concentration for that treatment across all tissues. Palmitoleic, cis-11 vaccenic, eicosapentaenoic, and docosapentaenoic acid concentrations increased in a linear manner (P<0.05) with increasing level of palmitoleic acid infusion. Myristic (C14:1), palmitoleic, trans-octadecenoic, and margaric acid concentrations increased (P<0.05) in a quadratic manner with palmitoleic acid infusion level. Stearic (C18:0) acid decreased (P<0.05) in a quadratic manner with palmitoleic acid infusion level. Concentrations of total polyunsaturated n-6 and n-3 fatty acids were increased in a linear manner (P<0.05) with palmitoleic acid infusion. Saturated and odd-chain fatty acid concentrations were increased in a quadratic manner (P<0.05) with palmitoleic acid infusion. Other fatty acid concentrations were not altered by palmitoleic acid infusion. The ratio of palmitoleic to palmitic acid was linearly increased, whereas the ratio of oleic to stearic acid was quadratically increased (P<0.01) with palmitoleic acid infusion. The ratio of palmitoleic acid to cis-11 vaccenic acid also increased in a linear and quadratic manner (P<0.001) with palmitoleic acid infusion.
 | Table 4 Fatty acid composition of tissues (subcutaneous adipose tissue, mesenteric adipose tissue, liver, longissimus muscle, ST muscle) from lambs infused with varying levels of palmitoleic (C16:1) acid |
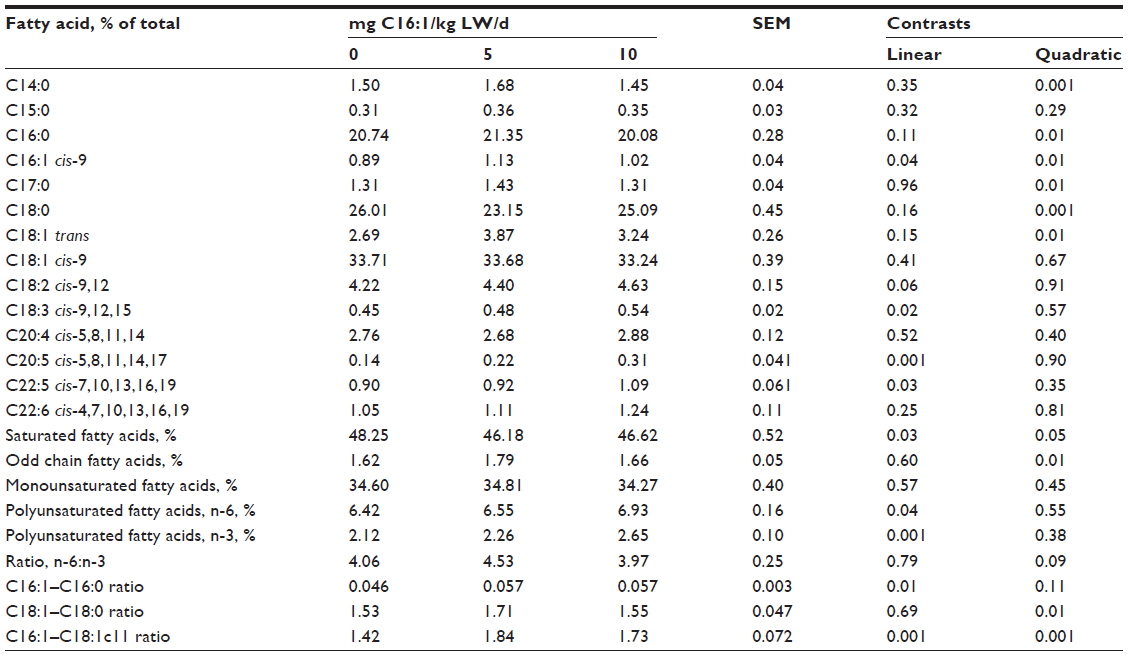
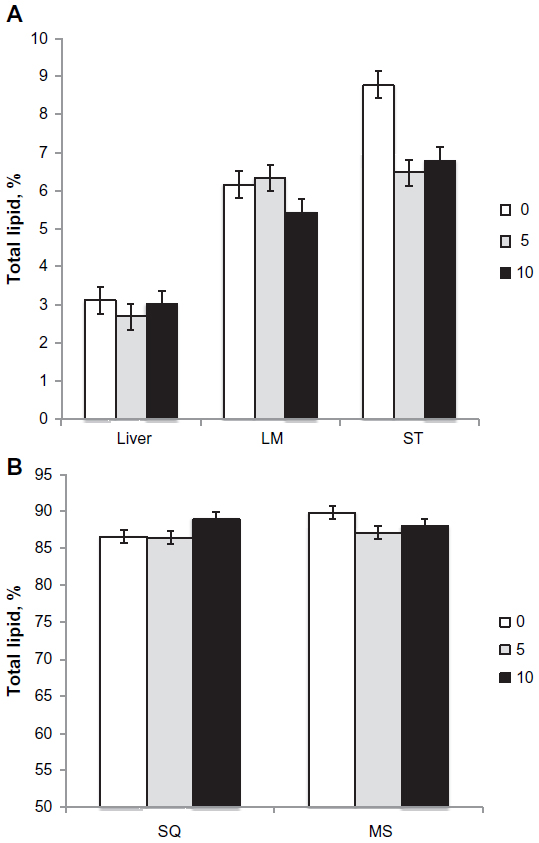
Total lipid content of the longissimus muscle, ST muscle, and liver is shown in Figure 3A, and subcutaneous and mesenteric adipose tissues is shown in Figure 3B. Total lipid content of the ST muscle and mesenteric adipose tissue was reduced (P<0.01) in both 5 mg/kg BW C16:1 and 10 mg/kg BW C16:1 dose levels. Total lipid content of the longissimus muscle was reduced (P<0.05) in the 10 mg/kg BW C16:1 dose level only. The total lipid content of the liver and subcutaneous adipose tissues was not altered (P>0.05) with C16:1 infusion. In order to determine if the palmitoleic acid and its elongation product, cis-11 vaccenic acid, were partitioned into PhL or triacylglyceride fraction, lipid separation was conducted on the ST muscle samples. Results showed that 94% of the total palmitoleic acid in the muscle was present in the neutral (triacylglyceride) fraction with only about 3% present as FFA or PhL, regardless of treatment. For cis-11 vaccenic acid, it was also predominately (90%) located in the neutral lipid fraction with only 2% and 7% as FFAs or PhL, respectively, regardless of treatment. Mean adipocyte size was reduced (P<0.05) in intramuscular adipocytes from the longissimus muscle for 10 mg/kg BW C16:1 group compared to controls (Figure 4A). Adipocyte distribution showed a reduction (P<0.05) in the amount of 90–140 μm-sized adipocytes and an increase (P<0.05) in the amount of 20–80 μm-sized intramuscular adipocytes for the 10 mg/kg LW/d palmitoleic acid-treated group compared to controls (Figure 4B). Mean adipocyte size was not altered (P>0.05) in subcutaneous adipose tissues. These results show that palmitoleic acid infusion for 28 days reduced intramuscular lipid content of the longissimus and ST muscle with increasing levels of palmitoleic acid infusion. These reductions appear to be because of reductions in intramuscular triglyceride content and adipocyte size.
 | Figure 3 Effects of palmitoleic acid infusion on intramuscular lipid content. |
 | Figure 4 Effects of palmitoleic acid infusion on mean adipocyte size and distribution. |
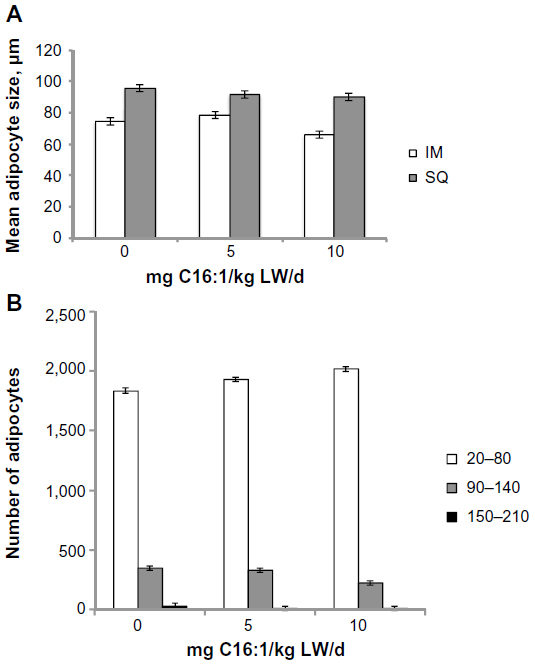
Changes in lipogenic gene expression for subcutaneous adipose, ST muscle, and liver with palmitoleic acid infusion are shown in Figure 5. Palmitoleic acid infusion upregulated (P<0.05) acetyl-CoA carboxylase (ACC) and ELOVL6 mRNA expression. Expression of other genes involved in lipogenesis (FASN, fatty acid elongase-5 [ELOVL5], and carnitine palmitoyltransferase 1a [CPT1A]) was unchanged (P>0.05) with palmitoleic acid infusion. Palmitoleic acid infusion upregulated (P<0.05) protein kinase, AMP-activated, alpha 1 catalytic subunit, transcript variant 1 (AMPK) mRNA expression in all three tissues (liver, subcutaneous adipose, and ST muscle) examined compared to the controls (Figure 6A). Protein levels of AMPKα1 did not differ (P>0.05) in the three tissues (liver, subcutaneous adipose, and ST muscle) of palmitoleic acid-treated group compared to controls (Figure 6B). Protein level of p-AMPKα1 and the ratio of p-AMPKα1 to AMPKα1 in all three tissues (liver, subcutaneous adipose, and ST muscle) were higher (P<0.05) for palmitoleic acid-treated group compared to controls (Figure 6C and D). Expression of other genes involved in glucose and insulin regulation (phosphoinositide-3-kinase, regulatory subunit 1 [alpha] [PI3KR1], insulin receptor [IR], v-akt murine thymoma viral oncogene homolog 1 [AKT1], and insulin receptor substrate 1 [IRS1]) was unchanged with palmitoleic acid infusion. The interaction between palmitoleic acid infusion level and tissue (subcutaneous [SQ], semitendinosus [ST], and liver) was significant (P<0.05) for glucose transporter type 4 (GLUT4) and carnitine palmitoyltransferase 1b (CPT1BI) (Figure 7). In the subcutaneous adipose and liver tissues, palmitoleic acid infusion upregulated (P<0.05) GLUT4, and CPT1B, whereas these genes were downregulated (P<0.05) with palmitoleic acid infusion in ST muscle.
 | Figure 5 Fold-change in lipogenic gene expression for 10 mg C16:1/kg LW/d versus control (0 mg/kg BW/d) averaged over the three tissues (subcutaneous adipose tissue, ST muscle, and liver). |
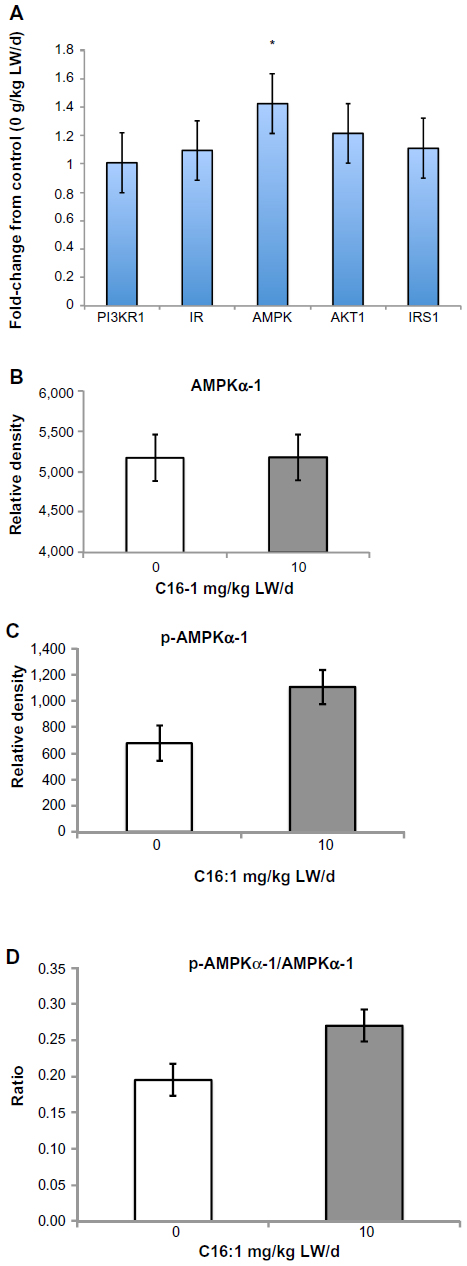 | Figure 6 Effects of palmitoleic acid infusion on gene expression and protein content of tissues. |
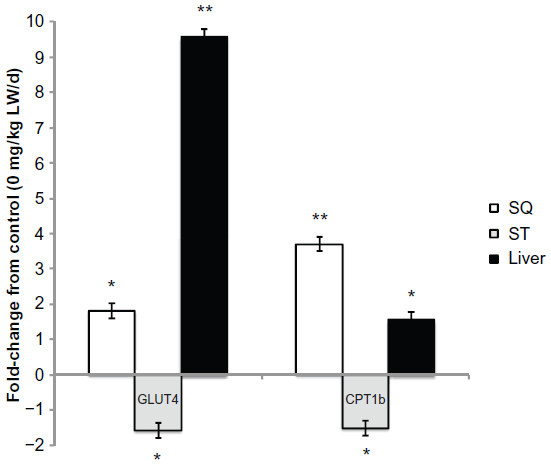 | Figure 7 Palmitoleic acid infusion alters gene expression differentially by tissue. |
Discussion
Infusion of palmitoleic acid increased serum palmitoleic acid levels in a dose-dependent manner. Previous research has shown that infusion of palmitoleic acid results in immediate uptake of the fatty acid into circulation.5 In addition, cis-11 vaccenic (C18:1 cis-11) acid also increased with palmitoleic acid infusion over time. Based on the results, it took about 14 days of continuous palmitoleic acid infusion for cis-11 vaccenic acid to increase in serum above controls in palmitoleic acid-infused lambs. Using stable isotopes in vitro, Burns et al3 confirmed that cis-11 vaccenic acid is an elongation product of palmitoleic acid. ELOVL6 is involved with elongation of saturated fatty acids of 12–18 carbon length but cannot elongate past C18.14 ELOVL5 appears to be involved in elongation of polyunsaturated fatty acids but cannot elongate past C22. Green et al15 reported that ELOVL6 elongates c16–c18, whereas ELOVL5 elongates C16:1 cis-9–C18:1 cis-11 in rat insulinoma cell line. In this study, relative mRNA expression level of ELOVL6 was upregulated because of palmitoleic acid treatment (10 mg/kg LW/d) in intramuscular adipose tissues. The relative mRNA expression level of ELOVL5 did not change with palmitoleic acid infusion. Results from our in vitro studies also showed that exogenous palmitoleic acid addition to bovine adipocytes increased cis-11 vaccenic acid to 50% or greater of total fatty acids and altered ELOVL6 mRNA expression with no change in ELOVL5.3,4 These results would suggest that in ruminant species (ovine and bovine), ELOVL6 may be responsible for the elongation of palmitoleic acid to cis-11 vaccenic acid, differing from Green et al’s15 findings in rat cell culture.
Daily weight gain was reduced by 77% in the high-dose level of palmitoleic acid. Yang et al16 found that palmitoleic acid administered orally to rats decreased food intake in a dose–response manner, which was accompanied by increased circulating and mRNA expression of cholecystokinin levels, a satiety-related hormone. Overall, body composition did not differ with palmitoleic acid treatment and averaged about 40% of total lipid. The sheep used in this study were obese and therefore, a short-term (28 days) treatment period would likely not be long enough to detect differences in overall body composition. Rates of lipolysis for sheep in a fed state are about 40% lower than rates of lipogenesis,17 and rates of subcutaneous fat accretion are estimated at 0.0085 cm/d;18 therefore, it would take approximately 114 days or more to reduce subcutaneous fat thickness by 20%. However, palmitoleic acid treatment did reduce intramuscular adipocyte size and total lipid content in the muscle tissues. Intramuscular fat is a late-developing fat depot,19 which may make it more susceptible to short-term treatments prior to slaughter. Infusion of palmitoleic acid increased concentrations of palmitoleic and cis-11 vaccenic acids in all tissues. Because the palmitoleic acid response on total lipid was observed in the muscle, we further examined which fraction (triacylglyceride, PhL, or FFA) these fatty acids were partitioned into. Palmitoleic and cis-11 vaccenic acids were predominately (90% or greater) located in the triacylglycerol fraction with only minor portions in FFA or PhL fractions. Thus, it appears that exogenous palmitoleic acid is deposited in the intramuscular triacylglycerol fraction in the muscle where it reduces adipocyte size through reductions in total lipid content. These reductions in intramuscular adipocyte size and lipid content are also accompanied by a reduction in circulating insulin levels and appear to restore insulin sensitivity.
Research has shown that high levels of intramuscular lipid are negatively correlated to insulin sensitivity.20,21 Perseghin et al22 found through the use of nuclear magnetic resonance (NMR) spectroscopy that intramuscular triglyceride content of the soleus and plasma FFAs predicted whole body insulin sensitivity. Although the exact mechanism is not understood, it appears that skeletal muscle oxidation rates and/or the release of biologically active lipids or fatty acids that signal downstream molecules such as IRS1, protein kinase B/Akt, or protein tyrosine phosphatase 1B (PTP1B) are involved in restoring insulin sensitivity.23–25 In this study, infusion of palmitoleic acid reduced circulating insulin levels without altering circulating glucose levels. Previous research has shown that plasma glucose and insulin levels were elevated immediately after a single pulse dose of palmitoleic acid infusion in a dose–response manner.5 Insulin resistance, as determined using the HOMA calculator, is defined by a value of 2.71 or greater.26 At the beginning of this study, the HOMA-IR levels for sheep used in this study were at or above this level indicating insulin resistance. By the end of the 28-day study, HOMA-IR levels declined (P<0.05) to 1.42 and 1.05 in the 5 mg/kg LW/d and 10 mg/kg LW/d palmitoleic acids, respectively. HOMA-IR levels in the controls (0 mg C16:1/kg LW/d) did not differ over the 28-day treatment period. These results indicate that palmitoleic acid treatment improved insulin resistance in obese sheep during a 28-day treatment period.
Relative mRNA expression of AMPKα1 was upregulated in subcutaneous adipose, ST muscle, and liver with palmitoleic acid infusion. Protein expression of p-AMPKα1 and the ratio of p-AMPKα1 to AMPKα1 were also higher in subcutaneous adipose, ST muscle, and liver with palmitoleic acid infusion compared to control. Expression of other genes involved in glucose/insulin regulation (IR, PI3KR1, AKT1, IRS) was unchanged with palmitoleic acid infusion in these tissues. Hoffman et al27 have shown that chromium supplementation activates AMPK in insulin-dependent skeletal muscle cells. These authors propose that AMPK activity in skeletal muscle is critical to determining fuel used for energy in cells and could prevent or delay the onset of insulin resistance. In a review by Coughlan et al,28 they suggest that activation of AMPK will improve insulin sensitivity. AMPK appears to play a role in regulating skeletal muscle glucose and fatty acid utilization.29,30 Locher et al31 reported higher levels of AMPK phosphorylation in dairy cows during early lactation when cows are typically in a negative energy balance. Lipolysis appears to induce AMPK phosphorylation in 3T3L1 adipocytes in vitro.32
Relative mRNA expression of GLUT4 and CPT1B showed a differential regulation depending on tissue. For the subcutaneous adipose and liver, palmitoleic acid upregulated GLUT4 and CPT1B mRNA levels. However, palmitoleic acid infusion downregulated GLUT4 and CPT1B mRNA levels in the ST muscle. The differential regulation of these genes suggests a possible mechanism by which palmitoleic acid may exert tissue-specific effects on intramuscular adipocytes to reduce triacylglyceride content and their size. The results in the subcutaneous adipose tissue gene expression are similar to what we observe in bovine adipocytes in culture with increases in CPT1B and reductions in SCD1.3,4 However, the downregulation of CPT1B in the ST muscle would seem contrary to the results observed for reduced intramuscular adipocyte size and triacylglycerol content. Others33 have also observed a reduced oxidative capacity in mice with improved whole body glucose utilization and insulin-stimulated glucose uptake. Other factors, like reactive oxygen species production in the mitochondria, may be more involved in insulin sensitivity.23,34,35 Knockout of the SCD1 gene in mice upregulated lipid oxidation and downregulated lipogenic genes to protect them from diet-induced obesity.2 Previous research evaluating a pulse dose infusion of palmitoleic acid resulted in immediate elevations in circulating glucose and insulin that appeared to be related to glucose uptake into the peripheral cells. This longer term infusion study with palmitoleic acid shows that GLUT4 mRNA expression is reduced in skeletal muscle, and indicates that this may be related to changes in insulin sensitivity when administered for 28 days. Additional research is needed to examine the mechanism of action as to how exogenous palmitoleic acid reduces intramuscular adipocyte size and triacylglyceride content to restore insulin sensitivity.
Acknowledgments
This research was supported in part by United States Department of Agriculture-National Institute of Food and Agriculture-2010-38942-20745. Appreciation is expressed to MC Miller and TA Burns for assistance with animal care and sample collection. This manuscript is the technical contribution number 6264 of the Clemson University Experiment Station. This material is based upon work supported by NIFA/USDA, under project number SC-1700439. Provinal™ was generously provided by Tersus Pharmaceuticals for this research project.
Disclosure
The authors report no conflicts of interest in this work.
References
Cao H, Gerhold K, Mayers JR, Wiest MM, Watkins SM, Hotamisligil GS. Identification of a lipokine, a lipid hormone linking adipose tissue to systemic metabolism. Cell. 2008;134(6):933–944. | |
Ntambi JM, Miyazaki M, Stoehr JP, et al. Loss of stearoyl-CoA desaturase-1 function protects mice against adiposity. Proc Natl Acad Sci U S A. 2002;99(17):11482–11486. | |
Burns TA, Kadegowda AKG, Duckett SK, Pratt SL, Jenkins TC. Palmitoleic (16:1 cis-9) and cis-vaccenic (18:1 cis-11) acid alter lipogenesis in bovine adipocyte cultures. Lipids. 2012;47:1143–1153. | |
Burns TA, Duckett SK, Pratt SL, Jenkins TC. Supplemental palmitoleic (C16:1 cis-9) acid reduces lipogenesis and desaturation in bovine adipocyte cultures. J Anim Sci. 2012;90:3433–3441. | |
Long NM, Burns TA, Volpi Lagreca G, Alende M, Duckett SK. Palmitoleic acid infusion alters circulating glucose and insulin levels. J Metab Syndr. 2014;3:148. | |
National Research Council. Nutrient Requirements of Small Ruminants: Sheep, Goats, Cervids, and New World Camelids. Washington, DC: The National Academies Press; 2007. | |
Long NM, Schafer DW. Sex effects on plasma leptin concentrations in newborn and postnatal beef calves. Prof Anim Sci. 2013;29:601–605. | |
Duckett SK, Neel JP, Lewis RM, Fontenot JP, Clapham WM. Effects of forage species or concentrate finishing on animal performance, carcass and meat quality. J Anim Sci. 2013;91(3):1454–1467. | |
Etherton TD, Thompson EH, Allen CE. Improved techniques for studies of adipocyte cellularity and metabolism. J Lipid Res. 1977;18(4):552–557. | |
Folch J, Lees M, Sloane Stanley GH. A simple method for the isolation and purification of total lipids from animal tissues. J Biol Chem. 1957;226:497–509. | |
Ruiz J, Antequera T, Andres AI, Petron MJ, Muriel E. Improvement of a solid phase extraction method for analysis of lipid fractions in muscle foods. Anal Chim Acta. 2004;520:201–205. | |
Duckett SK, Pavan E, Pratt SL. Corn oil or corn grain supplementation to steers grazing endophyte-free tall fescue. II. Effects on subcutaneous fatty acid content and lipogenic gene expression. J Anim Sci. 2009;87:1120–1128. | |
Pethick DW, D’Souza DN, Dunshea FR, Harper GS. Fat metabolism and regional differences in ruminants and pigs-influences of genetics and nutrition. Recent Adv Anim Nutr Aust. 2005;15:39–45. | |
Jakobsson A, Westerberg R, Jacobsson A. Fatty acid elongases in mammals: their regulation and roles in metabolism. Prog Lipid Res. 2006;45:237–249. | |
Green CD, Ozguden-Akkoc CG, Wang Y, Jump DB, Olson LK. Roles of fatty acid elongases in determination of de novo synthesized monounsaturated fatty acid species. J Lipid Res. 2010;51:1871–1877. | |
Yang ZH, Takeo J, Katayama M. Oral administration of omega-7 palmitoleic acid induces satiety and the release of appetite-related hormones in male rats. Appetite. 2013;65:1–7. | |
Yang YT, Baldwin RL, Garrett WN. Effects of dietary lipid supplementation on adipose tissue metabolism in lambs and steers. J Anim Sci. 1978;47:686–690. | |
Emenheiser JC, Greiner SP, Lewis RM, Notter DR. Longitudinal changes in ultrasonic measurements of body composition during growth in Suffolk ram lambs and evaluation of alternative adjustment strategies for ultrasonic scan data. J Anim Sci. 2010;88:1341–1348. | |
Cianzio DS, Topel DG, Whitehurst GB, Beitz DC, Self HL. Adipose tissue growth and cellularity: changes in bovine adipocyte size and number. J Anim Sci. 1985;64:970–976. | |
Goodpaster BH, Kelley DE. Skeletal muscle triglyceride: marker or mediator of obesity-induced insulin resistance in type 2 diabetes mellitus? Curr Diab Rep. 2002;2:216. | |
Muoio DM. Intramuscular triacylglycerol and insulin resistance: guilty as charge or wrongly accused? Biochim Biophys Acta. 2010;1801:281–288. | |
Perseghin G, Scifo P, de Cobelli F, et al. Intramyocellular triglyceride content is a determinant of in vivo insulin resistance in humans. Diabetes. 1999;48:1600–1606. | |
Holland WL, Brozinick JT, Wang LP, et al. Inhibition of ceramide synthesis ameliorates glucocorticoid-, saturated fat-, and obesity-induced insulin resistance. Cell Metab. 2007;5:167. | |
Muoio DM, Newgard CB. Mechanism of disease molecular and metabolic mechanisms of insulin resistance and beta-cell failure in type 2 diabetes. Nat Rev Mol Cell Biol. 2008;9:193. | |
Obanda DN, Cefalu WT. Modulation of cellular insulin signaling and PTP1B effects by lipid metabolites in skeletal muscle cells. J Nutr Biochem. 2013;24:1529–1537. | |
Geloneze B, Repetto EM, Geloneze SR, Tambascia MA, Ermetice MN. The threshold value for insulin resistance (HOMA-IR) in an admixture population. IR in the Brazilian Metabolic Syndrome Study. Diabetes Res Clin Pract. 2006;72:219–220. | |
Hoffman NJ, Oenque BA, Habegger KM, Sealls W, Tackett L, Elmendorf JS. Chromium enhances insulin responsiveness via AMPK. J Nutr Biochem. 2014;25:565–572. | |
Coughlan KA, Valentine RJ, Ruderman NB, Saha AK. AMPK activation: a therapeutic target for type 2 diabetes? Diabetes Metab Syndr Obes. 2014;7:241–253. | |
O’Neill HM, Holloway GP, Steinberg GR. AMPK regulation of fatty acid metabolism and mitochondrial biogenesis: implications for obesity. Mol Cell. Endocrinol. 2012;366:135–151. | |
Makenzie RWA, Elliot BT. AKT/PKB activation and insulin signaling: a novel insulin signaling pathway in the treatment of type 2 diabetes. Diabetes Metab Syndr Obes. 2014;7:55–64. | |
Locher LF, Rehage J, Khraim N, et al. Lipolysis in early lactation is associated with an increase in phosphorylation of adenosine monophosphate-activated protein kinase in cow adipose. J Dairy Sci. 2012;95(5):2497–2504. | |
Gauthier MS, O’Brien EL, Bigornia S, et al. AMP-activated protein kinase is activated as a consequence of lipolysis in the adipocyte: potential mechanism and physiological relevance. J Biol Chem. 2008;283:16514–16524. | |
Wredenberg A, Freyer C, Sandstrom ME, et al. Respiratory chain dysfunction in skeletal muscle does not cause insulin resistance. Biochem Biophys Res Commun. 2006;350:202–207. | |
Schrauwen P, Hesselink MKC. Oxidative capacity, lipotoxicity and mitochondrial damage in type 2 diabetes. Diabetes. 2004;53:1412–1417. | |
Bloch-Damti A, Bashan N. Proposed mechanism for the induction of insulin resistance by oxidative stress. Antioxid Redox Signal. 2005;7(11–12):1553–1567. |
 © 2014 The Author(s). This work is published and licensed by Dove Medical Press Limited. The full terms of this license are available at https://www.dovepress.com/terms.php and incorporate the Creative Commons Attribution - Non Commercial (unported, v3.0) License.
By accessing the work you hereby accept the Terms. Non-commercial uses of the work are permitted without any further permission from Dove Medical Press Limited, provided the work is properly attributed. For permission for commercial use of this work, please see paragraphs 4.2 and 5 of our Terms.
© 2014 The Author(s). This work is published and licensed by Dove Medical Press Limited. The full terms of this license are available at https://www.dovepress.com/terms.php and incorporate the Creative Commons Attribution - Non Commercial (unported, v3.0) License.
By accessing the work you hereby accept the Terms. Non-commercial uses of the work are permitted without any further permission from Dove Medical Press Limited, provided the work is properly attributed. For permission for commercial use of this work, please see paragraphs 4.2 and 5 of our Terms.