")
Back to Journals » ClinicoEconomics and Outcomes Research » Volume 6
Pain severity and the economic burden of neuropathic pain in the United States: BEAT Neuropathic Pain Observational Study
Authors Schaefer C, Sadosky A, Mann R, Daniel S , Parsons B , Tuchman M, Anschel A, Stacey BR, Nalamachu S, Nieshoff EC
Received 1 March 2014
Accepted for publication 29 April 2014
Published 29 October 2014 Volume 2014:6 Pages 483—496
DOI https://doi.org/10.2147/CEOR.S63323
Checked for plagiarism Yes
Review by Single anonymous peer review
Peer reviewer comments 2
Caroline Schaefer,1 Alesia Sadosky,2 Rachael Mann,3 Shoshana Daniel,4 Bruce Parsons,2 Michael Tuchman,5 Alan Anschel,6 Brett R Stacey,7 Srinivas Nalamachu,8 Edward Nieshoff9
1Covance Market Access Services Inc., Gaithersburg, MD, 2Pfizer, Inc., New York, NY, 3Covance Market Access Services Inc., San Diego, CA, 4Covance Market Access Services Inc., Conshohocken, PA, 5Palm Beach Neurological Center, Palm Beach Gardens, FL, 6Rehabilitation Institute of Chicago, Chicago, IL, 7Oregon Health and Science University, Portland, OR, 8International Clinical Research Institute, Overland Park, KS, 9Rehabilitation Institute of Michigan/Wayne State University, Detroit, MI, USA
Background: As with many chronic conditions, patients with neuropathic pain (NeP) are high consumers of health care resources. However, limited literature exists on the economic burden of NeP, including its impact on productivity. The aim of this study was to characterize health care resource utilization, productivity, and costs associated with NeP by pain severity level in US adults.
Methods: Subjects (n=624) with painful diabetic peripheral neuropathy, human immunodeficiency virus-related peripheral NeP, post-trauma/post-surgical NeP, spinal cord injury with NeP, chronic low back pain with NeP, and small fiber neuropathy were recruited during routine office visits to US community-based general practitioners and specialists. Clinicians captured clinical characteristics, NeP-related medications, and health care resource utilization based on 6-month retrospective medical chart review. Subjects completed questionnaires on demographics, pain/symptoms, costs, and productivity. Brief Pain Inventory pain severity scores were used to classify subjects by mild, moderate, or severe pain. Annualized NeP-related costs (adjusted for covariates) were estimated, and differences across pain severity groups were evaluated.
Results: In total, 624 subjects were recruited (mean age 55.5±13.7 years; 55.4% male), and 504/624 (80.8%) reported moderate or severe pain. Statistically significant differences were observed across pain severity levels for number of comorbidities, prescription medications, physician office visits, and lost productivity (all P≤0.0001). At all pain severity levels, indirect costs were the primary cost driver. After adjusting for demographic and clinical variables, total mean (95% confidence interval [CI]) annualized direct medical costs to payers, direct costs to subjects, and indirect costs per subject were US$6,016 (95% CI 5,316–6,716), US$2,219 (95% CI 1,919–2,519), and US$19,000 (95% CI 17,197–20,802), respectively, with significant differences across pain severity levels.
Conclusion: Subjects with NeP, mainly those showing moderate or severe pain, had significant associations between pain severity and NeP-related health care resource utilization, productivity, and costs. The economic burden, particularly indirect costs, was highest among those with severe pain and higher than previously reported in studies of specific NeP conditions.
Keywords: burden of illness, neuropathic pain management, health care costs, health care resource use, productivity
Introduction
Neuropathic pain (NeP) is a specific type of chronic pain “caused by a lesion or disease of the somatosensory nervous system”,1 and may result from a variety of disparate diseases and medical conditions. While NeP may originate from the peripheral or central nervous system,2 it is characterized by both spontaneous and provoked pain, as well as by paresthesias, dysesthesias, and deficits in normal sensation reflecting nerve damage. These cardinal symptoms can range from mild to incapacitating.3
As with many chronic pain conditions, patients with NeP are high consumers of health care resources, such as visits to medical professionals and use of prescription medications.4–9 Despite the substantial health care resource utilization (HRU) and the availability of treatment regimens and guidelines for pharmacologic management of NeP,10–12 many patients do not experience absolute pain relief.8,9,13 Findings from observational studies in the USA and Europe suggest that between 70.0% and 96.0% of NeP subjects seeking care experience moderate to severe pain.9,14,15
Previous studies assessing HRU and direct costs among NeP subjects in the USA have relied mainly on medical claims data, and nearly all studies were limited to specific NeP conditions, such as painful diabetic peripheral neuropathy or post-herpetic neuralgia.4–7 For example, one medical claims analysis conducted among a sample of subjects with post-herpetic neuralgia in 2005 reported annual direct costs of US$1,623; another study, based on a survey of subjects with painful diabetic peripheral neuropathy conducted in 2008 reported total per patient annual direct costs to be US$5,786, US$7,762, and US$12,856 for patients with mild, moderate, and severe pain, respectively.6,9 One of the only studies that investigated HRU among subjects with a broad range of nine NeP conditions was conducted over a decade ago; this medical claims analysis reported total annual direct health care charges to payers (US$17,355), which are generally considered to be substantially higher than health care costs.4
NeP has been found to have a profound impact on function and productivity, although most previous studies, including those relying on medical claims data, have not captured indirect costs related to lost productivity. A US survey by Gore et al in patients with painful diabetic peripheral neuropathy found that, among the approximately 30% of respondents who were employed for pay, nearly 65% reported missing work and/or decreased productivity at work due to their NeP.5 However, that study did not assign costs to this lost productivity. Another US survey that evaluated lost productivity and associated indirect costs in patients with painful diabetic peripheral neuropathy stratified by self-reported pain severity, reported significantly lower absenteeism and presenteeism in patients with mild and moderate pain relative to those with severe pain (P<0.005).9 Not surprisingly, those with severe pain had the highest total annual indirect costs (US$3,927).9 Previous studies did not examine the impact of NeP on lost productivity beyond absenteeism and presenteeism, such as the impact due to changes in employment status.
As suggested by the above studies, the existing literature on the economic burden of NeP is limited, and since most studies evaluate only painful diabetic peripheral neuropathy or post-herpetic neuralgia, findings from the available literature may not be generalizable to the broader population of patients with peripheral or central NeP in the USA. Additionally, few studies have evaluated the impact of pain severity on HRU and costs in NeP. Therefore, the objective of this study was to provide a broader characterization of adults with peripheral or central NeP in routine clinical practice with respect to sociodemographic and clinical characteristics, as well as to estimate HRU, productivity, and costs (direct and indirect) associated with NeP by pain severity level.
Materials and methods
Study design
This observational study collected patient-level data via a retrospective medical chart review and a cross-sectional survey among NeP subjects recruited between September 2011 and June 2012 at 33 community-based physician practices across the USA. Our objective of observing NeP subjects in routine clinical practice led us to target general practitioners and specialists who treat NeP patients.
A total of 711 general practitioners and specialists received a brief feasibility survey; 210 sites responded, 149 expressed interest, and 44 were selected for further evaluation based on the responses to the feasibility survey. Sites with the highest number of potential subjects were given priority. Sites selected included general practitioners (n=9), neurologists (n=7), pain specialists (n=6), endocrinologists (n=3), and other specialists (eg, orthopedist, infectious disease specialist, podiatrist, rheumatologist; n=8). Standardized sampling was utilized in this study; sites screened all patients with neuropathic pain who presented for office visits during the study period to assess eligibility. Sites documented patients screened and those enrolled in the study using enrollment logs. These logs were collected at the end of the study.
Potential subjects with one of the six NeP conditions of interest (Figure 1), related to human immunodeficiency virus, post-trauma/post-surgical NeP, spinal cord injury, chronic low back pain, painful diabetic peripheral neuropathy, and small fiber neuropathy, were identified by site staff when they presented for routine office visits.
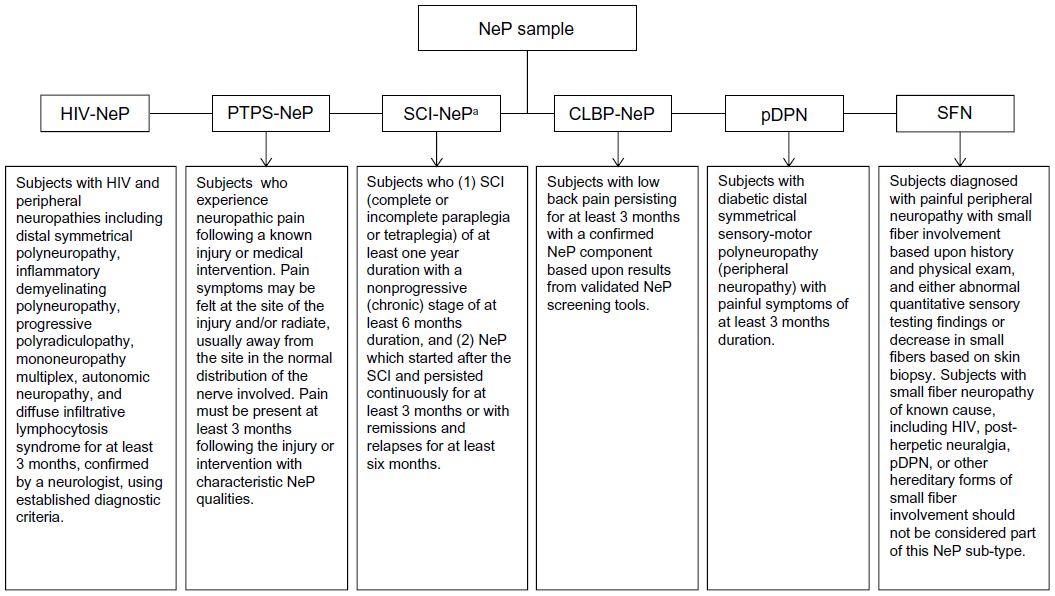 | Figure 1 Case definitions used to identify neuropathic pain conditions in the study sample. |
Adults (aged ≥18 years) were eligible to participate in the study if they had been diagnosed with one of the NeP conditions at least 6 months prior to enrollment, were managed by the physician’s practice for at least 6 months, and had experienced NeP symptoms for at least 3 months prior to enrollment. Subjects were also required to read and understand English and be willing and able to provide written informed consent. Subjects were not eligible if they had participated in an investigational drug study in the past 6 months, had a serious or unstable medical or psychological condition that, in the opinion of the physician, would compromise participation in the study, or had a concomitant illness unrelated to NeP that could have confounded the assessment of NeP. This study was approved by a central institutional review board, Concordia Clinical Research (Cedar Knolls, NJ, USA), in accordance with the ethical principles originating from the Declaration of Helsinki and in compliance with the International Conference on Harmonization guidance on Good Clinical Practice.16
Data collection
The participating physician or site coordinator conducted a 6-month retrospective chart review to record information on the specific NeP condition, time since NeP diagnosis, duration of underlying condition (if relevant), comorbid conditions, NeP-related prescription medications, and other NeP-related HRU. Participating physicians and site coordinators received training on the study protocol and instructions on case report form completion.
Subjects were asked to complete a self-administered, one-time questionnaire during the office visit. The subject questionnaire included questions to capture demographics, symptom duration, nonprescription treatments used for NeP, out-of-pocket costs (over the past 4 weeks) related to NeP, and changes in employment status (disability, unemployment, early retirement, reduced work schedule) due to NeP. Subjects also completed the short form of the Brief Pain Inventory (BPI-SF)17 to assess pain and stratify subjects by pain severity and the Work Productivity and Activity Impairment-Specific Health Problem questionnaire, customized to NeP (WPAI-NeP).18
The BPI-SF is an 11-item assessment that generates two subscales, ie, a Pain Severity Index based on worst, least, average, and current pain, and a Pain Interference Index based on pain interference with functional domains of general activity, mood, walking ability, normal work, relationships with other people, sleep, and enjoyment of life. Pain severity is assessed on 11-point numeric rating scales ranging from 0 (no pain) to 10 (pain as bad as you can imagine), and pain interference on a similar 11-point scale from 0 (does not interfere) to 10 (completely interferes).17 Scores on the BPI Pain Severity Index were used to classify average pain severity based on previously established cut points of 0–3 for mild pain, 4–6 for moderate pain, and 7–10 for severe pain.19,20
The WPAI-NeP is a six-item measure used to quantitatively assess the amount of overall work impairment (based on both absenteeism and presenteeism) among those employed and activity impairment (regular daily activities other than work at a job) attributable to NeP. This customized version of the WPAI allows for assessment of productivity loss and activity impairment specifically related to the subject’s NeP. Scores on the WPAI-NeP are multiplied by 100 and expressed as impairment percentages, with higher values indicating greater impairment and less productivity.18
The subject questionnaire also included validated measures of health status,21,22 sleep,23 anxiety and depression,24 and satisfaction with treatment for pain.25 A previously published article based on the same sample as the present study reported on the analyses of patient-reported outcomes measures.26 The current manuscript focuses on HRU, productivity, and costs related to the management of NeP.
Assigning costs
Standard costing algorithms were developed to assign costs (in 2012 US dollars) to HRU data and estimate direct costs to payers. HRU related to the management of NeP included the categories of physician visits, other health care provider visits, prescription medications, transcutaneous electrical nerve stimulation (TENS), outpatient tests and procedures, emergency room visits, hospital outpatient visits, and hospitalizations. Sources used to assign costs to these categories of HRU are shown in Table 1. In order to annualize direct costs to payers, the units of HRU observed over the 6-month retrospective chart review were multiplied by two (excluding TENS units) and then multiplied by the average cost per unit. Direct costs to subjects related to NeP over the past 4 weeks were self-reported on the subject questionnaire and included out-of-pocket costs for NeP treatment, child care, help with house and/or yard work, and help with activities of daily living. These costs did not need to be monetized; they were multiplied by 13 to calculate the annualized (52-week) direct costs to subjects of NeP.
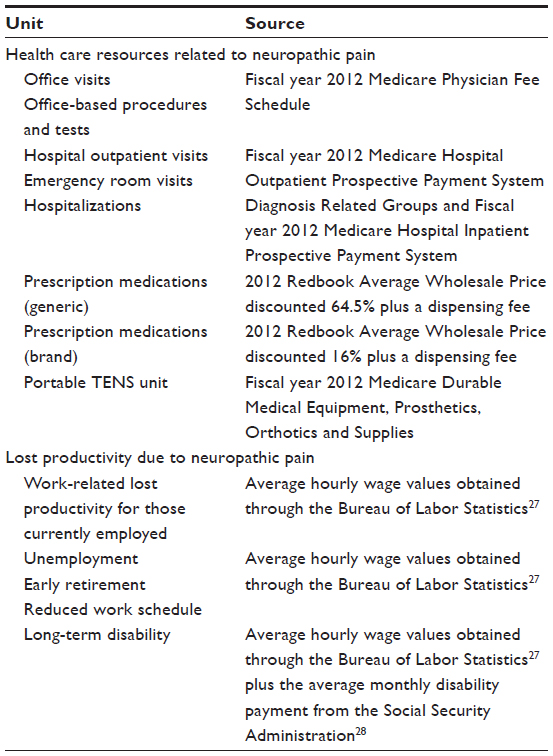 | Table 1 Sources used to assign costs to health care resources and lost productivity |
Indirect costs related to NeP included overall work impairment due to NeP among those employed as measured by the WPAI-NeP, as well as changes in employment status due to NeP for disability, unemployment, early retirement, and reduced work schedule. Among those employed, hours of lost productivity due to NeP were estimated from the WPAI-NeP and monetized according to the method of Lofland et al.29 Also shown in Table 1 are sources and methods used for assigning indirect costs to hours of lost productivity.
Statistical methods
Summary statistics (means, standard deviations [SDs], medians, and ranges for continuous variables and frequency distributions for categorical variables) were used to describe the sample. Summary statistics are presented for all available data, which were generally available for more than 98% of the sample. To evaluate the association between pain severity levels or NeP conditions and other outcomes, the Kruskal–Wallis test was used for continuous variables; as such, while the means and SDs are presented for continuous variables for each group, the P-value presented is based on the ranks. Chi-squared or Fisher’s Exact tests were used to examine the association with pain severity for categorical variables. Statistical significance was evaluated at the 0.05 level, without adjustment for multiple comparisons.
The association between pain severity (mild, moderate, severe) or NeP condition and costs of NeP was examined using multiple (adjusted) linear regression, with results presented as least squares means and their 95% confidence intervals (CIs). For the adjusted model, stepwise regression was used with the pool of covariates of age, sex, race, ethnicity, NeP condition, pain severity, employment status (employed for pay, disabled, retired, unemployed, other), ability to walk, insurance coverage (yes/no), NeP prescription coverage (yes/no), worker’s compensation (yes/no), time since diagnosis, and comorbid conditions. All analyses were performed using PC-SAS version 9.1.3 (SAS Institute, Cary, NC, USA).
Results
Based on enrollment logs, approximately 45% of the NeP patients who presented for office visits were formally screened for enrollment; patients known by the sites to be ineligible for study participation based on inclusion/exclusion criteria were not formally screened. In total, 637 patients were formally screened and 624 patients completed the study.
Demographic and clinical characteristics
Subjects were equally distributed across the six NeP conditions, with the majority of subjects in each condition characterized by moderate or severe pain (Table 2). Demographic and clinical characteristics of the overall sample (n=624) and their pain severity are presented in Table 3. While on average subjects reported moderate pain with a mean BPI-SF Pain Severity Index score of 5.5±2.2 for the overall sample (Table 3), 17.6%, 47.6%, and 33.2% reported mild, moderate, and severe pain, respectively. Ten subjects (1.6%) did not respond to all items needed to calculate a BPI-SF Pain Severity Index score.
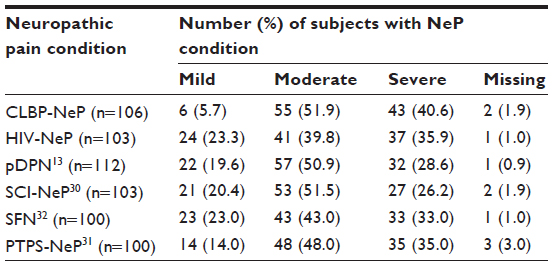 | Table 2 Neuropathic pain condition samples by pain severity level |
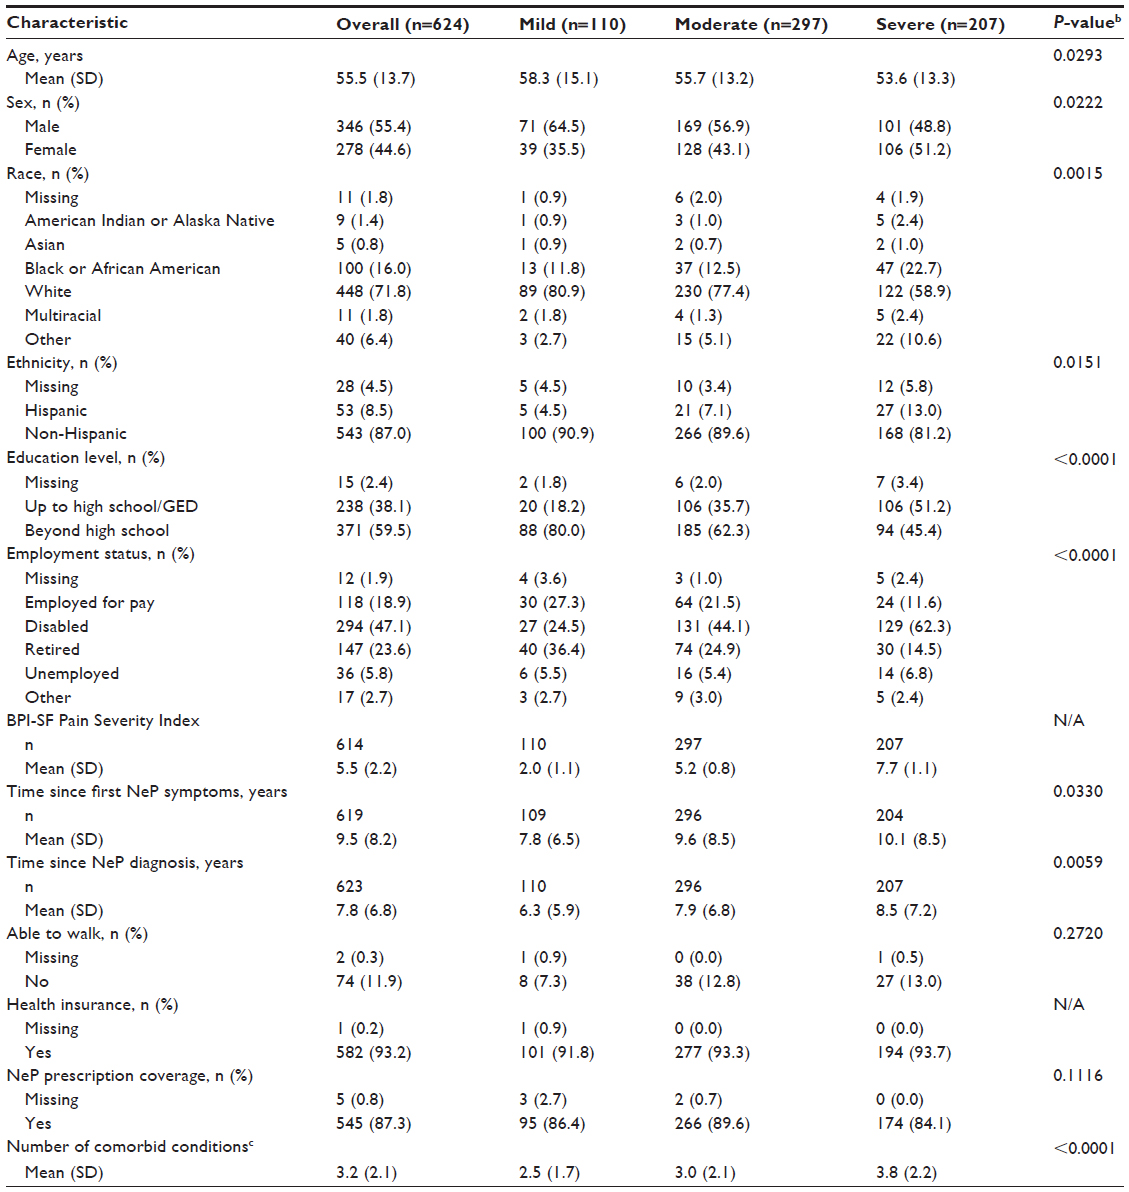 | Table 3 Demographic and clinical characteristics overall and by degree of severitya |
The population was predominantly white (71.8%), non-Hispanic (87.0%), male (55.4%), and had completed education beyond high school (59.5%). Race and ethnicity differed significantly by pain severity level (both P<0.02). Less than one-fifth (18.9%) of the sample was employed for pay. More subjects reported being disabled (47.1%) or retired (23.6%) than being currently employed (Table 3). The employment status of NeP subjects differed significantly according to pain severity (P<0.0001, Table 3); subjects with severe pain had the lowest proportion (11.6%) employed for pay and the highest proportion who reported being disabled (62.3%). The majority of subjects reported having some form of health insurance (93.2%) as well as NeP prescription coverage (87.3%).
The mean time from symptom onset was 9.5±8.2 years, and the mean time since diagnosis of NeP was 7.8±6.8 years (Table 3); duration of NeP, regardless of whether assessed from time of symptom onset or time since diagnosis, increased with higher pain severity (both P<0.04). Among the subjects, 74 (11.9%) were not able to walk on their own, and the majority of these (50/74 [67.7%]) had spinal cord injury-related NeP. Subjects (n=515) with a comorbid condition had an average of 3.2±2.1 such conditions, and there was an increasing number of comorbidities at higher levels of pain severity, which was significant across severity levels (P<0.0001, Table 3).
Use of health care resources
Overall, 90.2% of subjects were prescribed one or more medications for the management of their NeP in the previous 6 months, with a significant association for the proportion of subjects prescribed pain medications across pain severity categories: 78.2% mild, 91.9% moderate, and 95.2% severe (P<0.0001). The most frequently prescribed medication classes were opioids (53.0%), followed by antiepileptic drugs (49.0%, Figure 2). A significant association between the proportion of subjects prescribed NeP medications across increasing levels of pain severity was observed for subjects prescribed opioids (P<0.0001, Figure 2).
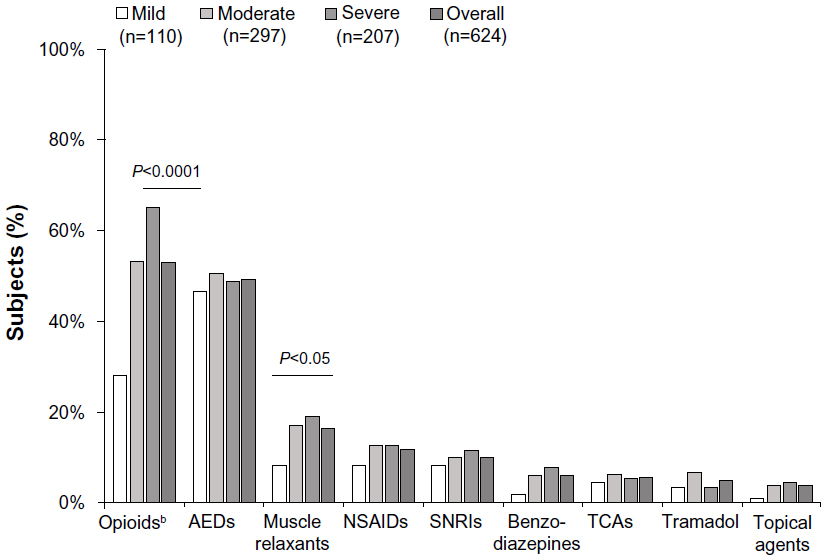 | Figure 2 Proportion of subjects prescribed medications to manage neuropathic pain by pain severity level.a |
Strong short-acting (33.7%) and long-acting (22.8%) opioids were the most common opioids prescribed, and use of both classes showed a significant difference across pain severity levels (P<0.0001 and P=0.0004, respectively), with greater use seen at higher pain severity levels (data not shown). The most commonly prescribed antiepileptic drugs were gabapentin (62.4%) and pregabalin (34.3%).
Additionally, almost half of the overall sample (47.8%) reported using nonprescription treatments for their NeP, with significant increases in the proportion of subjects using nonprescription treatments across pain severity categories (mild 32.7%, moderate 50.8%, and severe 52.2%; P=0.0016). Prescription of a portable TENS unit was more common in subjects with severe pain (31.4%) than in those with mild (12.7%) or moderate (29.3%) pain (P=0.0004).
There was a significant association between pain severity and average number of prescription medications used in the previous 6 months (P<0.0001), and there was an association between pain severity and the average number of nonprescription medications used in the past 4 weeks (P=0.0022, Table 4). Among other HRU categories, only total number of physician office visits in the previous 6 months for NeP and number of hospital outpatient visits in the previous 6 months for NeP showed a statistically significant association with pain severity levels (P=0.0001 and P=0.0071, respectively, Table 4); both categories showed the highest utilization in subjects with severe pain.
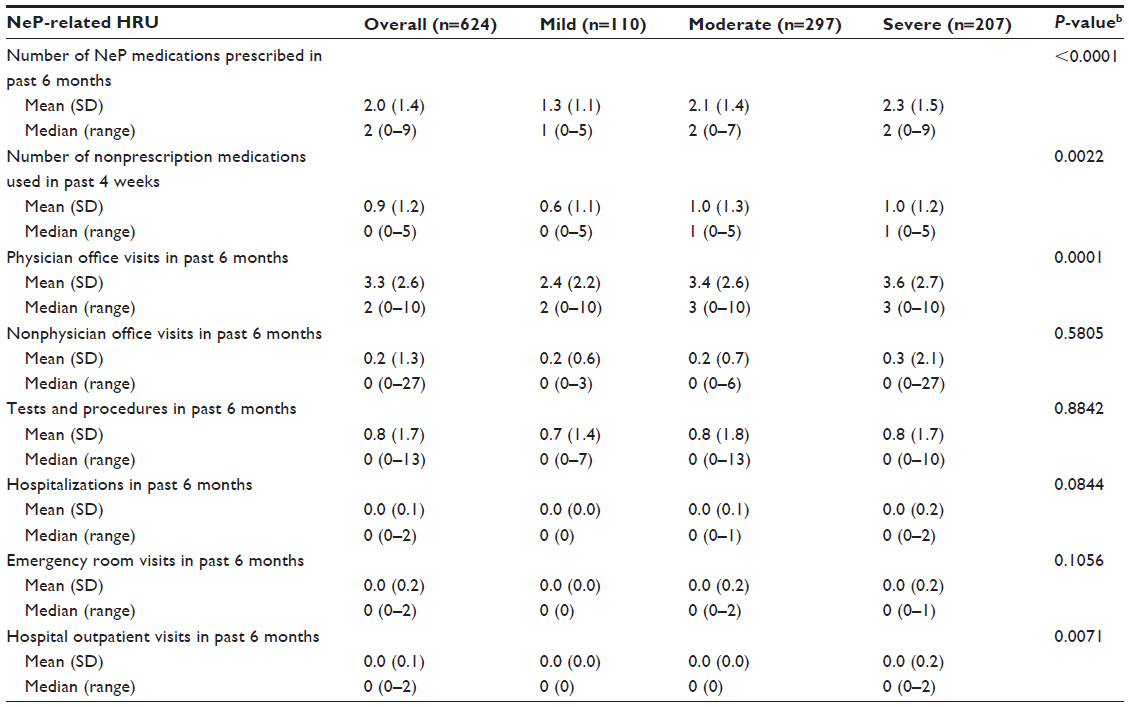 | Table 4 Health care resource utilization for neuropathic pain stratified by pain severitya |
Changes in employment and lost productivity
The impact of NeP on employment status is presented in Figure 3, and shows statistical significance across pain severity levels (P<0.0001). In particular, while NeP resulted in disability in almost one quarter (24.0%) of subjects overall, greater disability was observed with increasing levels of pain severity. Among those with severe pain, 36.7% were disabled due to their NeP.
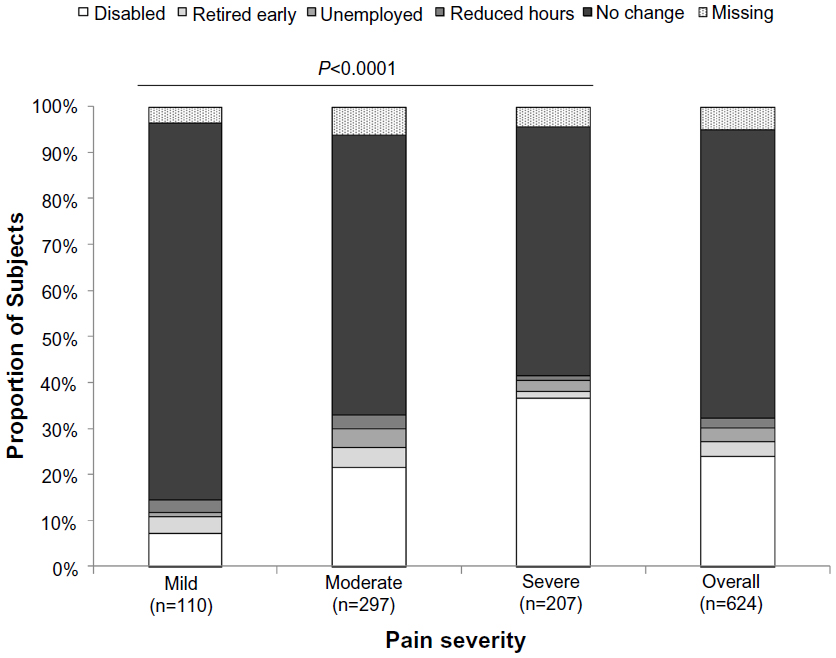 | Figure 3 Impact of neuropathic pain on employment status by pain severity level. |
Among employed subjects, both absenteeism and presenteeism showed a progressive increase across pain severity levels, significant for presenteeism which was assessed based on lost productivity during work (P<0.0001, Figure 4). Similarly, overall work impairment adjusted for time absent and present, significantly increased across pain severity levels (P<0.0001); subjects with severe pain reported mean overall work impairment of 66.4%±25.1% (Figure 4). For all subjects regardless of employment status, mean activity impairment, which represents impairment in performing regular daily activities outside of work, was 56.5%±28.1%, and was significantly associated with pain severity (P<0.0001, Figure 4); activity impairment was highest among subjects with severe pain.
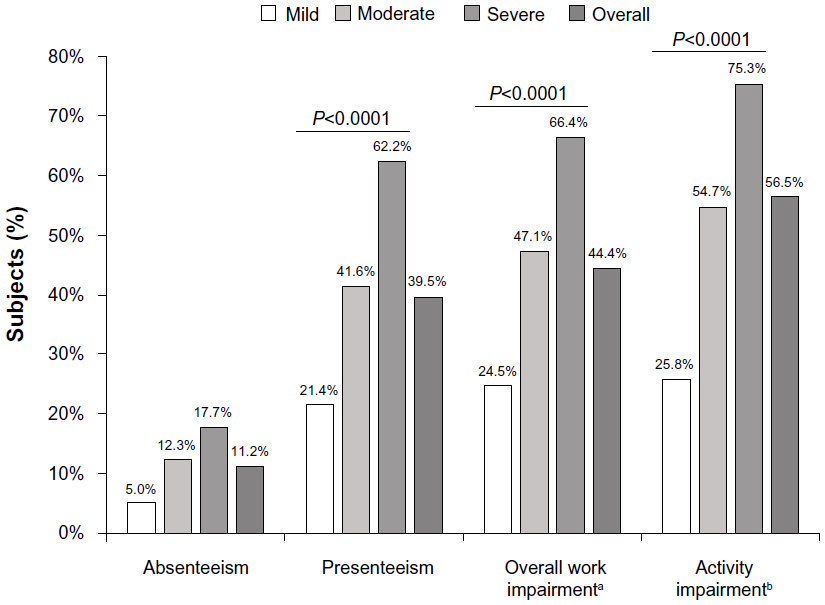 | Figure 4 Impact of neuropathic pain on productivity and daily activity evaluated using the WPAI questionnaire, by pain severity level. |
Costs
Unadjusted total mean annualized direct costs to payers were US$5,990 (95% CI 5,269–6,711) per subject in the overall NeP sample, and a significant difference was observed across pain severity levels (P<0.0001), increasing from US$3,053 (95% CI 1,354–4,752) for subjects with mild pain to US$5,696 (95% CI 4,662–6,730) and US$8,003 (95% CI 6,765–9,242) for subjects with moderate and severe pain, respectively. Prescription medication costs were the primary driver of direct costs to payers, comprising on average 78.4% of these costs. Unadjusted total mean direct costs to subjects were US$2,211 (95% CI 1,914–2,509) per year per subject overall, and a significant difference was observed across pain severity (P=0.0462); subjects with severe pain had the highest mean out-of-pocket costs (US$2,772 [95% CI 2,256–3,287]) per year. Unadjusted mean annualized indirect costs were US$18,546 (95% CI 16,641–20,450) per subject for the overall NeP sample, and the differences across pain severity levels were significant (P=0.0005), with the highest indirect costs seen among those with severe pain (US$23,821 [95% CI 20,586–27,057]). The primary driver of indirect costs was disability resulting from NeP, accounting for 67.0% of the unadjusted total annualized indirect costs, followed by lost productivity among those employed, accounting for 17.3%.
Total mean annualized costs after adjusting for relevant demographic and clinical covariates were US$27,259 (95% CI 25,199–29,319) overall, with the increase in costs from mild (US$17,244 [95% CI 12,206–22,283]) to moderate (US$26,810 [95% CI 23,841–29,779]) to severe (US$33,065 [95% CI 29,432–36,697]) showing significance for the model (P<0.0001) as well as for all pairwise comparisons (P<0.05, Figure 5). The component costs of direct costs to payers, direct costs to subjects, and indirect costs also demonstrated significance across pain severity levels adjusted for other covariates in the model (Figure 5), although for each of the categories only the pairwise comparisons between severe and mild pain severity were significant (P<0.05). Indirect costs were consistently the primary cost driver, accounting for greater than two thirds (66.3%–70.4%) of the total costs. The covariates remaining in the models for each category of costs are listed in the legends to Figures 5 and 6.
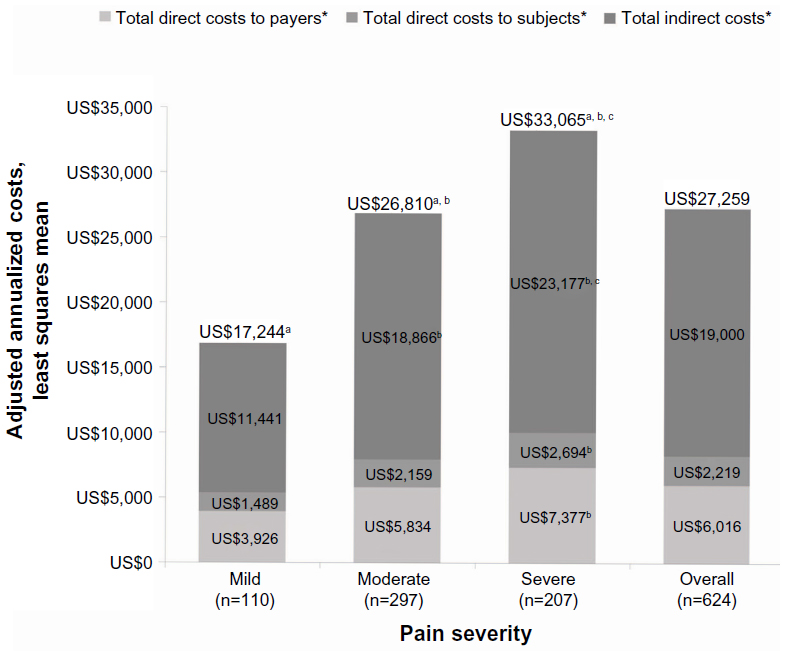 | Figure 5 Adjusted least squares mean estimates for annualized costs per subject from multiple linear regression adjusted for confounding demographic and clinical variables. |
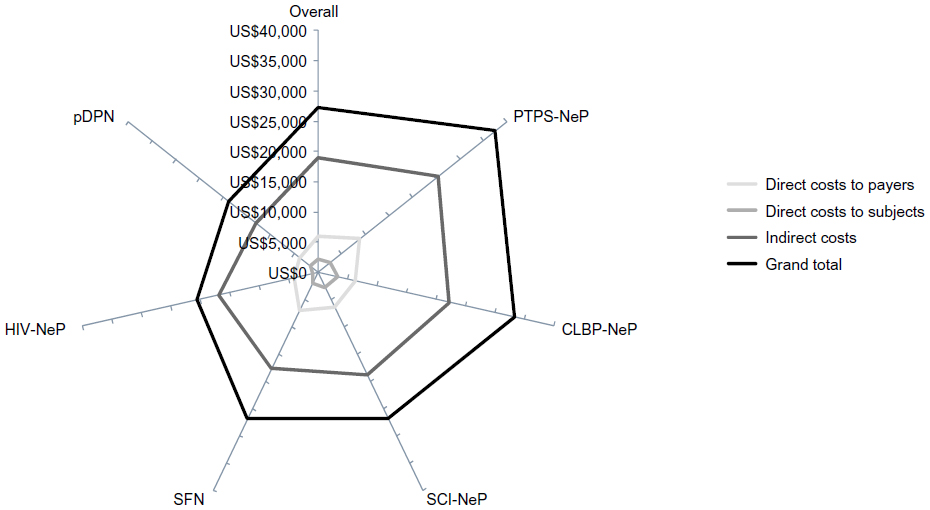 | Figure 6 Mean annualized adjusted cost per subject varied by neuropathic pain condition.a |
When analyzed by NeP type, mean total adjusted annualized costs were lowest among subjects with painful diabetic peripheral neuropathy and highest among subjects with post-trauma/post-surgical NeP, with significant differences observed across NeP pain conditions (P<0.0001, Figure 6). Across pain conditions, the major cost drivers were prescription medications, out-of-pocket costs to subjects, and lost productivity due to disability.
Discussion
This is the first study to provide a US patient-centric perspective of the economic burden in a broad sample of patients with different types of NeP. Direct and indirect costs related to NeP were estimated by pain severity (mild, moderate, severe), and we showed a significant association across strata, with the highest costs among those with severe pain. Since previous studies focused on specific NeP populations, this study adds to the current understanding of NeP by providing a “real-world” comparison of economic burden by pain severity levels among a broad spectrum of NeP subjects.
Subjects in our sample were predominantly white and non-Hispanic; however, significant differences were observed across pain severity levels for both race and ethnicity, with higher proportions of black/African Americans and Hispanics in the severe pain group. Significant differences across pain severity levels were also observed for mean age and education level; subjects in the severe pain group tended to be younger and were less likely to have completed education beyond high school. Analyses were not done to evaluate clinical characteristics, such as comorbidities, or prescription and other treatment patterns by sociodemographic characteristics; however, future analyses of these relationships would be useful.
Among the NeP-related health care resources that were evaluated, there was high use of prescription medications and frequent physician office visits, both of which showed a significant association with pain severity. Use of nonprescription medication for NeP, which was observed in nearly 50% of subjects, was significantly associated with pain severity, as were hospital outpatient visits. Our findings with regard to HRU are consistent with several previous studies within the population with painful diabetic peripheral neuropathy,5,8 including the significant association between higher pain severity, more pain medications, and more health care provider visits.9 While HRU per subject in the previous 6 months as reported by daCosta DiBonaventura et al9 was higher than in the current study, ranging from 9.87 to 14.23 for health care provider visits and from 0.32 to 0.77 for emergency room visits across pain severity levels, these higher means may reflect all-cause HRU rather than NeP-specific HRU, as well as differences in study design and sample.9
High HRU resulted in substantial total direct costs per subject, and calculation of average direct costs across pain severity levels demonstrated that costs were higher for NeP subjects with more severe pain. These findings are also consistent with those of daCosta DiBonaventura et al9 who reported significantly higher total all-cause annual direct costs among subjects with painful diabetic peripheral neuropathy with increasing pain severity (mild US$5,786; moderate US$7,762; severe US$12,856; P<0.05).9
This study sample was well insured and actively seeking care, with approximately 90% of the subjects taking prescription medications for their NeP, but nevertheless reported moderate or severe pain. Specifically, subjects with severe pain relative to mild pain used 1.8 times more prescription medications, had 1.5 times as many physician office visits, two-fold greater work impairment and disability, and costs that were approximately twice as high. Results of our study demonstrate the economic consequences of inadequate pain relief, with more than three quarters (80.8%) still reporting moderate or severe pain, suggesting a high unmet need for effective analgesia. In this regard, it should be noted that opioids were the most frequently prescribed medication class, and were used by substantial proportions of subjects across all pain severity levels, including 28% of subjects with mild pain. While high use of opioids has previously been reported in NeP,7,33 the substantial use of opioids (all) in subjects with mild NeP suggests that patterns of opioid use are not fully consistent with published guidelines, which generally recommend opioids as second-line or third-line agents for NeP.11 Similarly, less than 20% of subjects were taking tricyclic antidepressants and/or serotonin-norepinephrine reuptake inhibitors, which are considered first-line NeP medications. One hypothesis is that a proportion of our sample of established NeP subjects, diagnosed 7.8 years earlier, on average, may have failed first-line therapies and already moved on to second-line or third-line agents to manage their NeP.
Subjects in this study reported absenteeism and presenteeism, as well as changes in employment status, enabling more comprehensive estimation of indirect costs and resulting in higher annual unadjusted indirect costs per subject (US$18,546) than previously reported among subjects with painful diabetic peripheral neuropathy based on absenteeism and presenteeism alone (mild US$3,641; moderate US$3,413; severe US$3,927).9 In the current study, approximately two thirds of total costs across pain severity levels were attributable to indirect costs, with disability being the primary driver of indirect costs. Overall work impairment adjusted for the proportion of time absent and present; our data suggest that presenteeism likely accounted for a larger proportion of lost productive time than absenteeism among those who were employed, as has been previously reported for common pain conditions.34 Thus, the impact of NeP extended beyond work absence and resulted in a greater societal burden than previously suggested.
There is a paucity of literature that allows for direct comparison of economic outcomes across several peripheral and central NeP conditions. The data from our study, including data published previously,13,30–32 suggest that, in terms of direct and indirect costs, patients with post-trauma/post-surgical NeP and those suffering from chronic low back pain with NeP have the greatest burden. Of the six NeP conditions studied, post-trauma/post-surgical NeP and chronic low back pain with NeP accounted for the highest proportions of patients with moderate or severe pain, which may drive the HRU and total economic burden. Painful diabetic peripheral neuropathy may be the best understood and widely studied of NeP conditions; while it is a highly prevalent condition, our data suggest its economic burden may not be as substantial compared with other less frequently studied NeP types. These findings indicate that since all NeP conditions studied have substantial costs, and that cost drivers are consistent across them, the overall economic burden of broad NeP is higher than previously reported in samples limited to painful diabetic peripheral neuropathy.
A strength of our study is its focus on collecting patient-level data to evaluate HRU and costs, including patient out-of-pocket costs, related to a broad range of NeP, as well as its inclusion of the WPAI-NeP and other questions to directly address the impact of NeP on productivity. However, it is also important to acknowledge the study limitations, such as the potential for selection bias; all subjects in this study were recruited during routine office visits, and thus were actively seeking medical care. While selection of such a sample may have resulted in an overestimation of the proportion of subjects with NeP who experience moderate or severe pain, it may also suggest that many of the subjects seen in routine clinical practice are likely to have moderate to severe pain. Although few inclusion and exclusion criteria were applied, some may have influenced subject selection. For example, subjects had been managed at the site for at least 6 months (to allow for retrospective chart review). In applying these criteria, we may have missed newly diagnosed patients, who often experience higher HRU due to, eg, diagnostic testing and initial consultations. Individuals with NeP symptoms who have not been diagnosed or are not being treated may have different levels of pain, HRU, and costs.
As in all retrospective chart reviews, the data in our study were based on retrospective review of medical records, which could lead to under-reporting of HRU. The subjects’ medical records may not have included all visits to other physicians, health care providers, or facilities, all NeP-related tests and procedures conducted, or medications prescribed outside of the study site. Although physicians and site coordinators were asked to review HRU with subjects during their appointments to address this limitation, there is the potential for recall bias. Similarly, data captured in this study were based on the physicians’ assessment of HRU attributable to NeP. For many study subjects, NeP resulted from an underlying condition (eg, spinal cord injury, trauma/surgery, human immunodeficiency virus infection, diabetes), and in some instances physicians may not have accurately separated NeP-related HRU from that due to the underlying condition. Information on prescription medications was captured on the clinical case report form. However, actual medication utilization could not be confirmed with regard to whether all prescribed medications were filled and/or taken as prescribed. Future research assessing compliance and satisfaction with treatment is recommended.
Finally, costs were assigned to HRU and lost productivity using a standard algorithm, and actual costs may have been higher or lower. Further, since out-of-pocket costs were based on subjects’ 4-week recall, there was potential for recall bias. It is also important to note that these results were exploratory and no hypothesis was tested in this study. A control group without NeP was not included; however, unlike claims analyses, the current study design (patient/physician survey) focused on condition (NeP)-specific HRU and costs, avoiding the need for a control group.
Conclusion
In this study of subjects with a broad range of NeP conditions drawn from clinical practice, the economic burden was significantly associated with pain severity, with the highest costs observed among those with severe pain. Across the NeP conditions, subjects showed high pain levels which were associated with a higher comorbidity burden, increased HRU including medication use for NeP, greater loss of productivity due to NeP, and substantial direct and indirect costs. Across all pain severity levels, indirect costs were consistently the driver of total costs. The results observed in this broad NeP sample suggest that the overall economic burden of NeP may be higher than previously reported in studies limited to specific NeP conditions that only evaluated direct medical costs. These results support the need for better management strategies in order to reduce NeP and its associated economic burden.
Acknowledgment
We thank Gergana Zlateva, Felicia Bergstrom, and Rebecca Baik for their contributions to the study design and analysis.
Disclosure
This research was sponsored by Pfizer Inc. BP and AS are paid employees of Pfizer Inc. CS, RM, and SD are employees of Covance Market Access Services Inc., and were paid consultants to Pfizer Inc in connection with the development of this manuscript. AA and SN were paid investigators for the study, but were not financially compensated for their publication-related activities. BRS, EN, and MT were not financially compensated for their collaborative efforts on this project, including publication-related activities. Editorial support to prepare the manuscript for submission was provided by Karen Burrows, of Engage Scientific Solutions, and was funded by Pfizer Inc.
References
International Association for the Study of Pain. IASP taxonomy. Available from: http://www.iasp-pain.org/Content/NavigationMenu/GeneralResourceLinks/PainDefinitions/default.htm#Neuropathicpain. Accessed September 10, 2013. | |
Treede RD, Jensen T, Campbell JN, et al. Neuropathic pain: redefinition and a grading system for clinical and research purposes. Neurology. 2008;70(18):1630–1635. | |
International Association for the Study of Pain. Diagnosis and classification of neuropathic pain. Pain Clinical Updates. 2010;18(7):1–6. | |
Berger A, Dukes EM, Oster G. Clinical characteristics and economic costs of patients with painful neuropathic disorders. J Pain. 2004;5(3):143–149. | |
Gore M, Brandenburg N, Hoffman D, Tai KS, Stacey B. Burden of illness in painful diabetic peripheral neuropathy (DPN): the patients’ perspective. J Pain. 2006;7(12):892–900. | |
Dworkin RH, Malone DC, Panarites CJ, Armstrong EP, Pham SV. Impact of postherpetic neuralgia and painful diabetic peripheral neuropathy on health care costs. J Pain. 2010;11(4):360–368. | |
Dworkin RH, Panarites CJ, Armstrong EP, Malone DC, Pham SV. Health care utilization in people with postherpetic neuralgia and painful diabetic peripheral neuropathy. J Am Geriatr Soc. 2011;59(5):827–836. | |
daCosta DiBonaventura M, Cappelleri JC, Joshi AV. A longitudinal assessment of painful diabetic peripheral neuropathy on health status, productivity, and health care utilization and cost. Pain Med. 2011;12(1):118–126. | |
daCosta DiBonaventura M, Cappelleri JC, Joshi AV. Association between pain severity and health care resource use, health status, productivity and related costs in painful diabetic peripheral neuropathy patients. Pain Med. 2011;12(5):799–807. | |
Finnerup N, Otto M, McQuay HJ, Jensen TS, Sindrup SH. Algorithm for neuropathic pain treatment: an evidence based proposal. Pain. 2005;118(3):289–305. | |
Dworkin RH, O’Connor AB, Audette J, et al. Recommendations for the pharmacological management of neuropathic pain: an overview and literature update. Mayo Clin Proc. 2010;85 Suppl 3:S3–S14. | |
Attal N, Cruccu G, Baron R, et al. EFNS guidelines on the pharmacological treatment of neuropathic pain: 2010 revision. Eur J Neurol. 2010;17(9):1113–1123. | |
Sadosky A, Schaefer C, Mann R, et al. Burden of illness associated with painful diabetic peripheral neuropathy among adults seeking treatment in the US: results from a retrospective chart review and cross-sectional survey. Diabetes Metab Syndr Obes. 2013;6:79–92. | |
Gore M, Brandenburg NA, Dukes E, Hoffman DL, Tai KS, Stacey B. Pain severity in diabetic peripheral neuropathy is associated with patient functioning, symptom levels of anxiety and depression, and sleep. J Pain Symptom Manage. 2005;30(4):374–385. | |
Taylor-Stokes G, Pike J, Sadosky A, Chandran A, Toelle T. Association of patient-rated severity with other outcomes in patients with painful diabetic peripheral neuropathy. Diabetes Metab Syndr Obes. 2011;4:401–408. | |
World Medical Association. Declaration of Helsinki. Adopted by the 18th World Medical Assembly (WMA) General Assembly H, Finland, 1964; amended by the 29th WMA General Assembly in Tokyo, Japan in 1975, the 35th WMA General Assembly in Venice, Italy in 1983, the 41st WMA General Assembly in Hong Kong in 1989, the 48th WMA General Assembly in Somerset West, Republic of South Africa in 1996, and the 52nd WMA General Assembly in Edinburgh, Scotland, 2000. Available from: http://www.wma.net/en/30publications/10policies/b3/index.html. Accessed February 20, 2014. | |
Cleeland CS, Ryan KM. Pain assessment: global use of the Brief Pain Inventory. Ann Acad Med Singapore. 1994;23(2):129–138. | |
Reilly MC, Zbrozek AS, Dukes EM. The validity and reproducibility of a work productivity and activity impairment instrument. Pharmacoeconomics. 1993;4(5):353–365. | |
Zelman D, Dukes E, Brandenburg N, Bostrom A, Gore M. Classification of mild, moderate and severe pain due to diabetic peripheral neuropathy based on levels of functional disability [abstract]. J Pain. 2004; 5 Suppl 1:114. | |
Zelman D, Dukes E, Brandenburg N, Bostrom A, Gore M. Identification of cut-points for mild, moderate and severe pain due to diabetic peripheral neuropathy. Pain. 2005;115(2):29–36. | |
Ware JE Jr, Kosinski M, Turner-Bowker D, Sundaram M, Gandek B, Maruish ME. User’s Manual for the SF-12v2 Health Survey Second Edition. 2nd ed. Lincoln, RI, USA: QualityMetric Incorporated; 2009. | |
Rabin R, de Charro F. EQ-5D: a measure of health status from the EuroQol Group. Ann Med. 2001;33(5):337–343. | |
Hays RD, Martin SA, Sesti AM, Spritzer KL. Psychometric properties of the Medical Outcomes Study Sleep measure. Sleep Med. 2005;6(1):41–44. | |
Zigmond AS, Snaith RP. The Hospital Anxiety and Depression scale. Acta Psychiatr Scand Suppl. 1983;67(6):361–370. | |
Evans CJ, Trudeau E, Mertzanis P, et al. Development and validation of the Pain Treatment Satisfaction Scale (PTSS): a patient satisfaction questionnaire for use in patients with chronic or acute pain. Pain. 2004;112(3):254–266. | |
Schaefer C, Mann R, Sadosky A, et al. Burden of illness associated with peripheral and central neuropathic pain among adults seeking treatment in the United States: a patient-centered evaluation. Pain Medicine. In press 2014. | |
United States Department of Labor. United States Bureau of Labor Statistics. May 2011 National Occupational Employment and Wage Estimates United States, 2012. Available from: http://www.bls.gov/oes/2011/may/oes_nat.htm. Accessed July 26, 2012. | |
United States Social Security Administration Office of Retirement and Disability Policy. Annual Statistical Supplement, 2011. Old-Age, Survivors, and Disability Insurance. Table 5.D1. Available from: http://www.ssa.gov/policy/docs/statcomps/supplement/2011/5d.html. Accessed April 23, 2012. | |
Lofland JH, Pizzi L, Frick KD. A review of health-related workplace productivity loss instruments. Pharmacoeconomics. 2004;22(3):165–184. | |
Mann R, Schaefer C, Sadosky A, et al. Burden of spinal cord injury-related neuropathic pain in the United States: retrospective chart review and cross-sectional survey. Spinal Cord. 2013;51(7):564–570. | |
Parsons B, Schaefer C, Mann R, et al. Economic and humanistic burden of post-trauma and post-surgical neuropathic pain among adults in the United States. J Pain Res. 2013;6:459–469. | |
Schaefer C, Mann R, Sadosky A, et al. Health status, function, productivity, and costs among individuals with idiopathic painful peripheral neuropathy with small fiber involvement in the United States: results from a retrospective chart review and cross-sectional survey. J Med Econ. 2014:1–14. | |
Gore M, Tai KS, Zlateva G, Bala Chandran A, Leslie D. Clinical characteristics, pharmacotherapy, and health care resource use among patients with diabetic neuropathy newly prescribed pregabalin or gabapentin. Pain Pract. 2011;11(6):528–539. | |
Stewart WF, Ricci JA, Chee E, Morganstein D, Lipton R. Lost productive time and cost due to common pain conditions in the US workforce. JAMA. 2003;290(18):2443–2454. |
 © 2014 The Author(s). This work is published and licensed by Dove Medical Press Limited. The full terms of this license are available at https://www.dovepress.com/terms.php and incorporate the Creative Commons Attribution - Non Commercial (unported, v3.0) License.
By accessing the work you hereby accept the Terms. Non-commercial uses of the work are permitted without any further permission from Dove Medical Press Limited, provided the work is properly attributed. For permission for commercial use of this work, please see paragraphs 4.2 and 5 of our Terms.
© 2014 The Author(s). This work is published and licensed by Dove Medical Press Limited. The full terms of this license are available at https://www.dovepress.com/terms.php and incorporate the Creative Commons Attribution - Non Commercial (unported, v3.0) License.
By accessing the work you hereby accept the Terms. Non-commercial uses of the work are permitted without any further permission from Dove Medical Press Limited, provided the work is properly attributed. For permission for commercial use of this work, please see paragraphs 4.2 and 5 of our Terms.