")
Back to Journals » OncoTargets and Therapy » Volume 9
p53 inhibits the expression of p125 and the methylation of POLD1 gene promoter by downregulating the Sp1-induced DNMT1 activities in breast cancer
Authors Zhang L, Yang W, Zhu X, Wei C
Received 20 October 2015
Accepted for publication 19 January 2016
Published 10 March 2016 Volume 2016:9 Pages 1351—1360
DOI https://doi.org/10.2147/OTT.S98713
Checked for plagiarism Yes
Review by Single anonymous peer review
Peer reviewer comments 3
Editor who approved publication: Dr Faris Farassati
Liang Zhang,1 Weiping Yang,2 Xiao Zhu,1 Changyuan Wei1
1Department of Breast Surgery, 2Department of Ultrasound, Affiliated Tumor Hospital of Guangxi Medical University, Nanning, Guangxi, People’s Republic of China
Abstract: p125 is one of four subunits of human DNA polymerases – DNA Pol δ as well as one of p53 target protein encoded by POLD1. However, the function and significance of p125 and the role that p53 plays in regulating p125 expression are not fully understood in breast cancer. Tissue sections of human breast cancer obtained from 70 patients whose median age was 47.6 years (range: 38–69 years) with stage II–III breast cancer were studied with normal breast tissue from the same patients and two human breast cell lines (MCF-7 and MCF-10A). p53 expression levels were reduced, while p125 protein expression was increased in human breast cancer tissues and cell line detected by Western blot and quantitative reverse transcriptase-polymerase chain reaction. The methylation level of the POLD1 gene promoter was greater in breast cancer tissues and cells when compared with normal tissues and cells. In MCF-7 cell model, p53 overexpression caused a decrease in the level of p125 protein, while the methylation level of the p125 gene promoter was also inhibited by p53 overexpression. To further investigate the regulating mechanism of p53 on p125 expression, our study focused on DNA methyltransferase 1 (DNMT1) and transcription factor Sp1. Both DNMT1 and Sp1 protein expression were reduced when p53 was overexpressed in MCF-7 cells. The Sp1 binding site appears to be important for DNMT1 gene transcription; Sp1 and p53 can bind together, which means that DNMT1 gene expression may be downregulated by p53 through binding to Sp1. Because DNMT1 methylation level of the p125 gene promoter can affect p125 gene transcription, we propose that p53 may indirectly regulate p125 gene promoter expression through the control of DNMT1 gene transcription. In conclusion, the data from this preliminary study have shown that p53 inhibits the methylation of p125 gene promoter by downregulating the activities of Sp1 and DNMT1 in breast cancer.
Keywords: breast cancer, apoptosis, DNMT1, MCF-7, methylation, p125
Introduction
The American Cancer Society has estimated that 231,840 new cases of invasive breast cancer will be diagnosed and that 40,290 of these women will die from breast cancer in 2015 in the USA.1 Breast cancer is now the most common cancer in women in developed countries, and in the USA, up to 12% women will develop invasive breast cancer over the course of their lifetime.2 It is now known that “atypical” changes in the breast duct and lobular epithelium may be the basis for the development of carcinoma in situ and that it is a risk factor for invasive breast carcinoma, mainly adenocarcinoma of either ductal or lobular type.3
The p53 molecule can bind to DNA and regulate gene expression to prevent instability of the genome that may result in mutations.4 The growth of malignant tumor cells, cell invasion, cell senescence, and apoptosis (programmed cell death) can be regulated by p53.5–7 For human breast cancer, tumor development, growth, invasion, and metastasis is associated with p53 expression.8–10 Mutated p53 is found in nearly 30% of breast cancer cases and is usually diagnosed with some tumor subtypes, p53 has become recognized as a cancer biomarker in breast cancer and other forms of malignancy.11 However, its mechanisms in breast cancer are still not fully understood.
p125 is one of four subunits of human DNA polymerases, DNA Pol δ, as well as one of p53 target protein encoded by POLD1.12,13 p125 is reported to be one of the DNA polymerases that can help cancer cells tolerate DNA damage,14,15 and human p125 modulates cell cycle progression and therefore promotes the cancer proliferation.15 p125 is a transcription target of p53 which responds to DNA damage; it is able to repress the Sp1-stimulated POLD1 (p125 gene) gene promoter activities and therefore repress the expression of p125.9 However, the function and significance of p125 and the role that p53 plays in regulating p125 expression are not fully understood in breast cancer.
Here, in the present study, we noticed that increased methylation of p125 gene promoter, increased expression of p125 and decreased p53 expression are related with breast cancer tissue. We propose that p53 may indirectly regulate p125 expression through the control of DNA methyltransferase 1 (DNMT1) gene transcription since p53 is able to repress the Sp1 upregulated DNMT1 expression in lung cancer.7 We explored to understand if p53 inhibits the methylation of p125 gene promoter by downregulating the activities of Sp1 and DNMT1 in breast cancer, thus inhibiting breast cancer progression. However, the reason that increase of p125 expression is associated with the methylation of p125 gene promoter and if the methylation is aberrant will need to be further explored.
Materials and methods
Tissue samples and patients
This study included the participation of 70 women patients. The median age of the patients was 47.6 years (range: 38–69 years). All of the malignant tissues were from stage II to III tumors, according to the International Federation of Gynecology and Obstetrics classification. All patients provided consent for the use of their specimens for this study. This research study and patient participation were approved by the Institute Research Ethics Committee of the Affiliated Tumor Hospital of Guangxi Medical University.
Tumor samples were obtained during routine breast surgery, including mastectomy and wide excision specimens. Tumor tissue for diagnosis was selected by the breast pathologist, who also selected “normal” (without macroscopic breast abnormality) breast tissue, which was from the same breast quadrant. Routine diagnostic breast tissue was formalin-fixed and paraffin-embedded, sectioned, stained with hematoxylin and eosin, and examined microscopically by the pathologist to confirm the diagnosis of primary breast carcinoma (adenocarcinoma), ductal or lobular carcinoma, in situ or invasive carcinoma, and tumor grade. The pathologist also confirmed the presence of invasive breast carcinoma in the samples of breast tissue used in this research study and confirmed the absence of tumor in the “normal” breast tissue sampled. For comparison of gene and protein levels in the normal and tumor tissue sections, 70 tissue sections were examined for each patient studied.
Cell culture
MCF-7 (human breast adenocarcinoma cell line) and MCF-10A (normal human mammary epithelial cells) were purchased from American Type Culture Collection (ATCC, Manassas, VA, USA). The cells were cultured in Dulbecco’s Modified Eagle’s Medium supplemented with 10% fetal bovine serum at 37°C with antibiotics, and were maintained in a humidified environment containing 5% CO2.
Cell counting
MCF-7 cells were incubated in 10% Cell Counting Kit-8 (CCK-8) (Dojindo, Kumamoto, Japan) diluted in Dulbecco’s Modified Eagle’s Medium at 37°C until a visual color conversion occurred. Following transfection, cell proliferation rates were determined at 0, 24, 48, 72, 96 hours. A microplate reader (set at 450 nm) was used to measure the absorbance of each well. All experiments were performed in triplicate.
Western blot analysis
Cells were lysed in radioimmunoassay precipitation buffer (Boston Bioproducts, Ashland, MA, USA) containing a protease inhibitor cocktail (Hoffman-La Roche Ltd., Basel, Switzerland). Protein concentrations were determined using the bicinchoninic acid protein assay kit (Thermo Fisher Scientific, Waltham, MA, USA). Samples of cell lysate supernatant (20 μg protein) were separated by sodium dodecyl sulfate polyacrylamide gel electrophoresis and electrotransferred to nitrocellulose membranes. The membranes were then probed at 4°C overnight with a panel of antibodies with the following dilutions: p53 (Cell Signaling Technology, Danvers, MA, USA, 1:1,000), Sp1 (AbCam, Cambridge, MA, USA, 1:1,000), DNMT1 (AbCam, 1:1,000), and p125 (Proteintech, Rosemont, IL, USA, 1:1,000). Secondary antibodies were used at a 1:10,000 dilution. Immune complexes were detected by incubation with enhanced chemiluminescence Western blotting substrate (Thermo Fisher Scientific), followed by exposure to X-ray film. Anti-glyceraldehyde 3-phosphate dehydrogenase (GAPDH) polyclonal antibodies (Sigma, 1:2,000) were incubated with the same membrane following membrane stripping and re-staining.
Coimmunoprecipitation assay
Sp1 antibody (Abcam, 10 μg) was diluted in 400 μL lysate/washing buffer (25 mM Tris [pH 7.4], 150 mM NaCl, 1 mM ethylenediaminetetraacetic acid, 1% [v/v] Nonidet P-40, 5% [v/v] glycerol, and 0.25 mM phenylmethylsulfonyl fluoride). Then, 50 μL of 5% (w/v) bovine serum albumin-blocked Dynabeads (Beyotime, Shanghai, People’s Republic of China) were added, and the mixture was incubated with gentle rotation for 2 hours at room temperature. After the bead–antibody complexes had been centrifuged, they were collected and washed three times. Then, 200 μg of nucleoproteins were added, and the mixture was incubated with gentle rotation overnight at 4°C, followed by centrifugation. After the precipitates had been washed five times, they were suspended in 50 μL of sodium dodecyl sulfate loading buffer and denatured by heating. Finally, the samples were separated using sodium dodecyl sulfate polyacrylamide gel electrophoresis and analyzed using a p53 antibody (Cell Signaling Technology, 1:1,000) and Western blot assay.
Quantitative reverse transcription-polymerase chain reaction
Total RNA was prepared from cells and breast tissues using the RNeasy Mini Kit (Qiagen, Hilden, Germany) and reverse-transcribed using an iScript cDNA Synthesis Kit (Bio-Rad Laboratories Inc., Hercules, CA, USA). Quantitative reverse transcriptase-polymerase chain reaction (qRT-PCR) was performed using the SYBR Green qPCR Master Mixes (Qiagen). The primer sequences for the p53 were 5′-TGGAGAGGAGGTCGGCAAAATCAA-3′ (forward) and 5′-GACTGCGGGAACCTGAGCCTAAAT-3′ (reverse); for the p125 gene promoter:
5′-GCTCCGCTCCTACACGCTCAA-3′ (forward) and 5′-GGTCTGGTCGTTCCCATTCTGC-3′ (reverse); for the GAPDH: 5′-GACCCCTTCATTGACCTCAAC-3′ (forward) and 5′-CTTCTCCATGGTGGTGAAGA-3′ (reverse). Data were derived from triple reactions for each sample.
Luciferase reporter gene assays
MCF-7 cells (1.5×10⁵) were plated onto a six-well plate and grown overnight. The pGL-3 vector with DNMT1 promoter reporter plasmid was constructed. PSF-SV40 promoter plasmid was used as the control vector. The medium was changed 5 hours following transfection using FuGENE 6 Transfection Reagent (Promega Corporation, Fitchburg, WI, USA). Forty-eight hours after transfection, cells were collected in reporter lysis buffer (Promega).
Aliquots (10 μL) of cell extract were used for luciferase assays using 50 μL of substrate solution. Luciferase activity was measured by a luminometer with settings of 3 seconds delay time and 10 seconds integration time. Relative luciferase units were evaluated after normalization against protein concentration of each sample. Values were taken as the mean ± standard deviation of relative luciferase activity from triplicate samples in three separate experiments.
Electrophoretic mobility shift assays
To prepare the double-stranded DNA oligonucleotides for electrophoretic mobility shift assays, single-stranded forward and reverse oligonucleotides were annealed by heating to 95°C and cooled slowly to room temperature in annealing buffer (10 mM Tris–HCl, pH 7.5, 1 mM MgCl2, and 50 mM NaCl). Oligonucleotides (double-stranded oligonucleotides) were employed either as probes following the 5′-end labeling using [γ-32P]adenosine triphosphate and T4 polynucleotide kinase or as unlabeled competitors.
DNA binding reactions were performed by preincubating the nuclear extract (20 μg of protein) with 2 μg of poly(dI-dC)·poly(dI-dC) in binding buffer (10 mM Tris–HCl, pH 7.5, 50 mM NaCl, 1 mM MgCl2, 0.5 mM ethylenediaminetetraacetic acid, 0.5 mM dithiothreitol, and 4% glycerol) for 15 minutes on ice followed by the addition of ~50 fmol of 32P-labeled probe and an additional 30 minutes incubation at room temperature. In competition experiments, a 100-fold molar excess of an unlabeled competitor (wild-type or mutant ds-oligonucleotide) was preincubated with the extract before the addition of the labeled probe.
For supershift assays, nuclear extract in binding buffer (without dithiothreitol) was preincubated with a Sp1 antibody Sp1 (AbCam, Cambridge, MA, USA) or nonimmune rabbit immunoglobulin for 60 minutes on ice, and then with poly(dI-dC)·poly(dI-dC) for 15 minutes before incubation with the radiolabeled probe. Two micrograms of antibody were used in each supershift assay. Subsequently, the samples were resolved on 5% polyacrylamide gels in 0.5× TBE buffer (45 mM Tris-borate, 1 mM ethylenediaminetetraacetic acid, pH 8.3). Electrophoresis was performed at 180 V for 2 hours at room temperature. After electrophoresis, the gels were autoradiographed by exposure to storage phosphor screens for 24–72 hours at -20°C.
Apoptosis analysis
Harvested cells were suspended in 1X Annexin-V binding buffer and stained with Annexin-V-PE Apoptosis Detection Kit (eBioscience, San Diego, CA, USA) and 7-aminoactinomycin D (7-AAD) (Thermo Fisher Scientific) for 15 minutes at room temperature. A FACS-Calibur multivariable flow cytometer (BD Biosciences) was used with data analyzed using BD Cell Quest Pro Version 3.3 software (Becton, Dickinson and Company, Franklin Lakes, NJ, USA).
Cell cycle analysis
Cells were harvested, and single cell suspensions were prepared in wash buffer. Cells were washed twice and resuspended at 2×10⁶ cells/mL. An aliquot of 1 mL of cells were placed in a 15 mL polypropylene tube on ice and allowed to cool, followed by the addition of 3 mL cold (-20°C) absolute ethanol. The cells were fixed for at least 1 hour at 4°C.
Cells were washed twice with phosphate-buffered saline, and 1 mL of propidium iodide (40 μg/mL propidium iodide in phosphate-buffered saline) staining solution was added to the cell pellet and mixed well. Stained samples could be stored for up to a week at 4°C when protected from light. Cell cycle analysis of MCF-7 cells was performed by flow cytometry by a standard procedure.
Cell invasion assays
For the invasion assays, 1×10⁵ cells in serum-free medium were seeded onto the trans-well migration chambers with 8 μm pore size (EMD Millipore, Billerica, MA, USA), the upper chamber of which was coated with Matrigel (Sigma-Aldrich Co., St Louis, MO, USA). Media containing 20% fetal bovine serum were added to the lower chamber. After 24 hours, the noninvading cells were removed with cotton wool, and invasive cells located on the lower surface of the chamber were stained with May–Grünwald–Giemsa (MGG) stain (Sigma-Aldrich). Microscopic cell counts were performed. Experiments were performed in triplicate.
Pyrosequencing
A DNA methylation assay was performed using standard bisulfite pyrosequencing technology. Briefly, PCR was carried out in a 25 μL reaction mix containing 50 ng bisulfite-converted DNA mixture using the following PCR program: 95°C for 15 minutes, then 44 cycles of 95°C for 30 seconds followed by 56°C for 30 seconds, and 72°C for 30 seconds, with a final extension at 72°C for 10 minutes.
The biotinylated PCR products were purified and converted into single strands to act as a template for the pyrosequencing reaction as recommended by the manufacturers (Qiagen). Then, 0.3 nM of pyrosequencing primer was annealed to the purified single-stranded PCR product and pyrosequencing was conducted on a PyroMark Q96 MD sequencing and quantification platform (Qiagen). The intra- and interassay coefficients of variation were 0.7% and 1.4%, respectively. This assay amplifies a promoter region of the p125 gene promoter containing five CpG sites (regions of DNA containing a cytosine nucleotide next to a guanine nucleotide): (GGGYGAGGTTATTTYGGAAGTTGAGAGAGG GGGYGGGGTTTGTTTTGTAGTYGAATAAGYGGGG).
In each tumor sample, the overall p125 gene promoter methylation level was the average relative amount of cytosine in the five CpG sites.
Statistical analysis
Data from all experiments were presented as mean ± standard deviation of at least three independent experiments performed in duplicate for each construct. Statistical analysis of the results were carried out using two-way analysis of variance as well as Student’s t-test.
Results
p53 inhibits proliferation, cell invasion, and promotes apoptosis in MCF-7 cells
The expression levels of p53 in human breast cancer tissue and cells were analyzed using qRT-PCR and Western blotting. The result showed that p53 expression was reduced in tumor tissues compared with normal breast tissues (Figure 1A and B). In addition, we observed that the MCF-10A cells derived from the normal breast tissue showing higher p53 levels than MCF-7 cells (Figure 1C and D), which is consistent with previously published findings that functions of p53 work as an antioncogene in human breast cancer.16,17 The cell model (MCF-7/p53) showed MCF-7 cells with p53 overexpression (Figure 2A). Overexpression of p53 inhibited the growth of MCF-7 cell, which was assessed and analyzed by using the Cell Counting Kit-8 (CCK-8) assay (Figure 2B). The transwell assay results showed that the invasion ability of MCF-7 cells was reduced when p53 was overexpressed (Figure 2C and D). Figures 2C and D and 3 show that overexpression of p53 protein induced apoptosis in MCF-7 cells, which confirms previously published data.16,17 Overexpression of p53 in MCF-7 cells resulted in minimal effects on the cell cycle (Figure 3A and B). Flow cytometry showed that overexpression of p53 promoted MCF-7 cell apoptosis (Figure 3C and D).
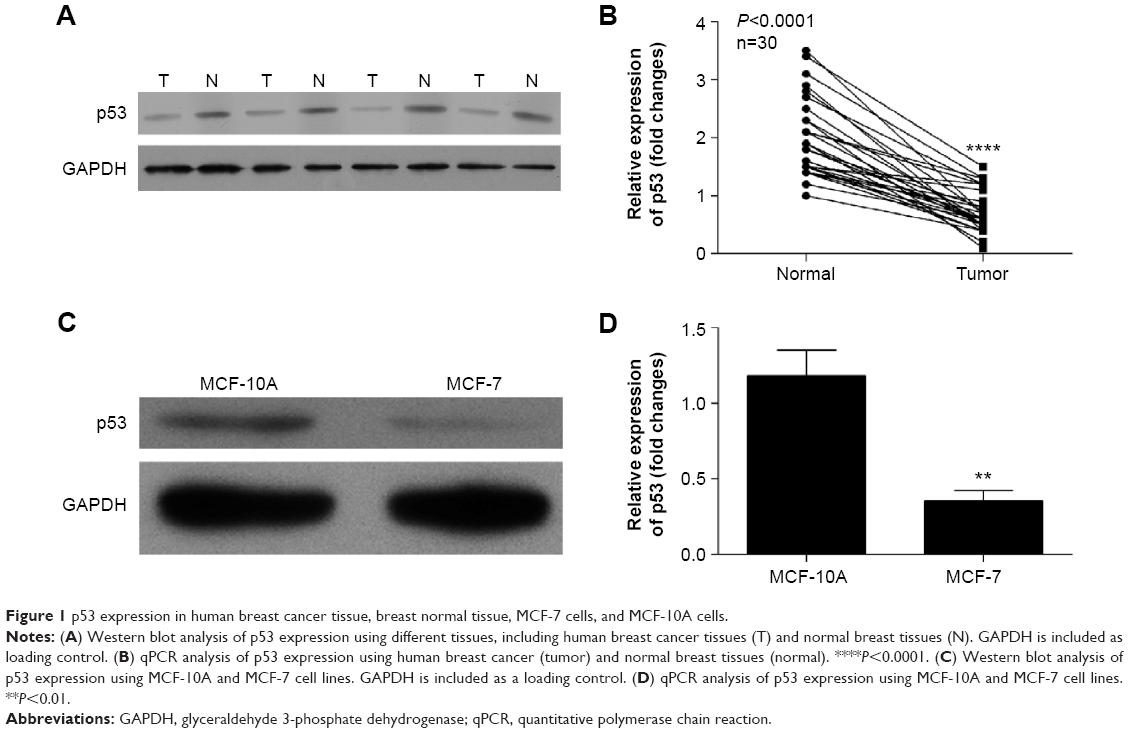 | Figure 1 p53 expression in human breast cancer tissue, breast normal tissue, MCF-7 cells, and MCF-10A cells. |
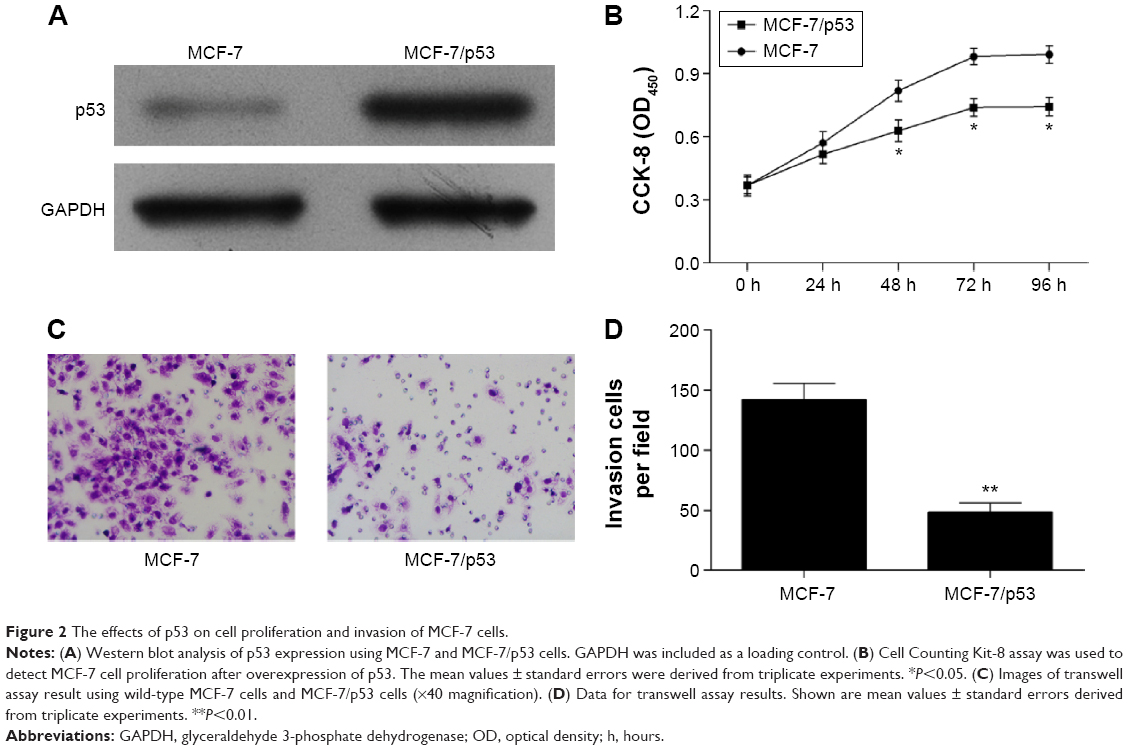 | Figure 2 The effects of p53 on cell proliferation and invasion of MCF-7 cells. |
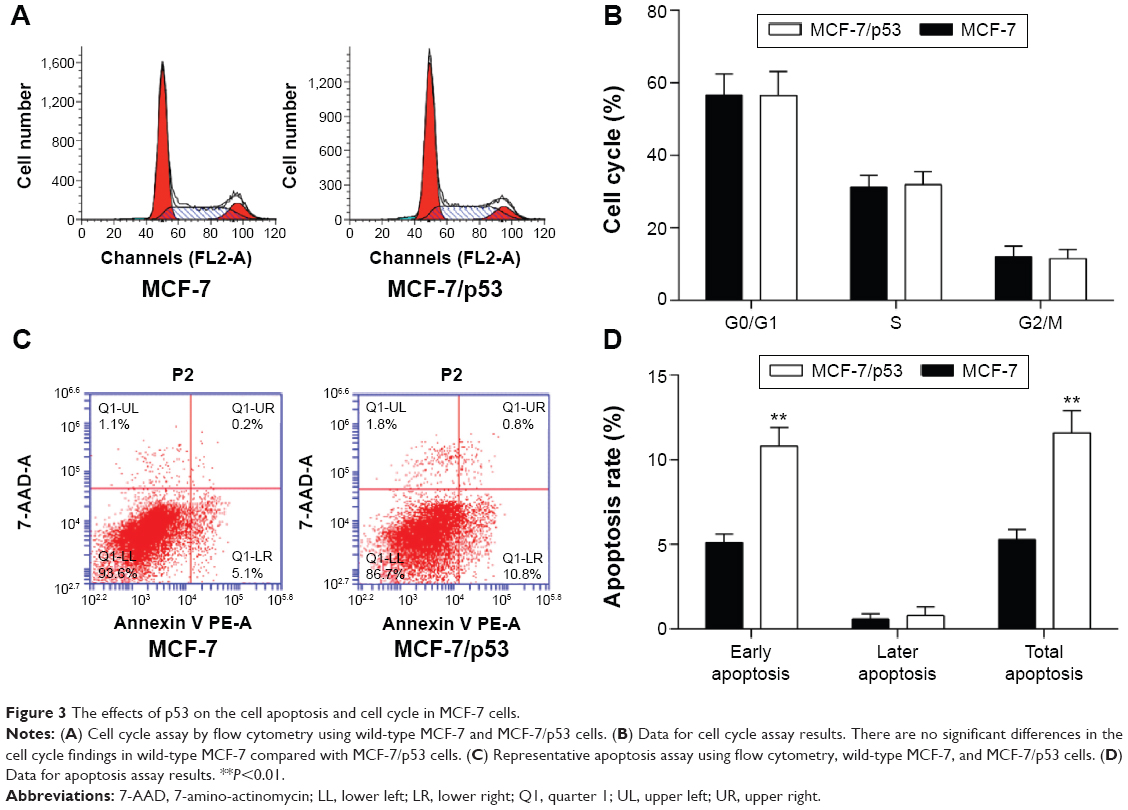 | Figure 3 The effects of p53 on the cell apoptosis and cell cycle in MCF-7 cells. |
The expression of p125 was increased in breast cancer tissue and inhibited by p53
The results of this study showed that the expression of p125 protein was increased in breast cancer tissue compared with normal breast tissues (Figure 4A and B). The expression levels of p125 were reduced in MCF-7/p53 cells when compared with the wild-type MCF-7 cells (Figure 4C and D).
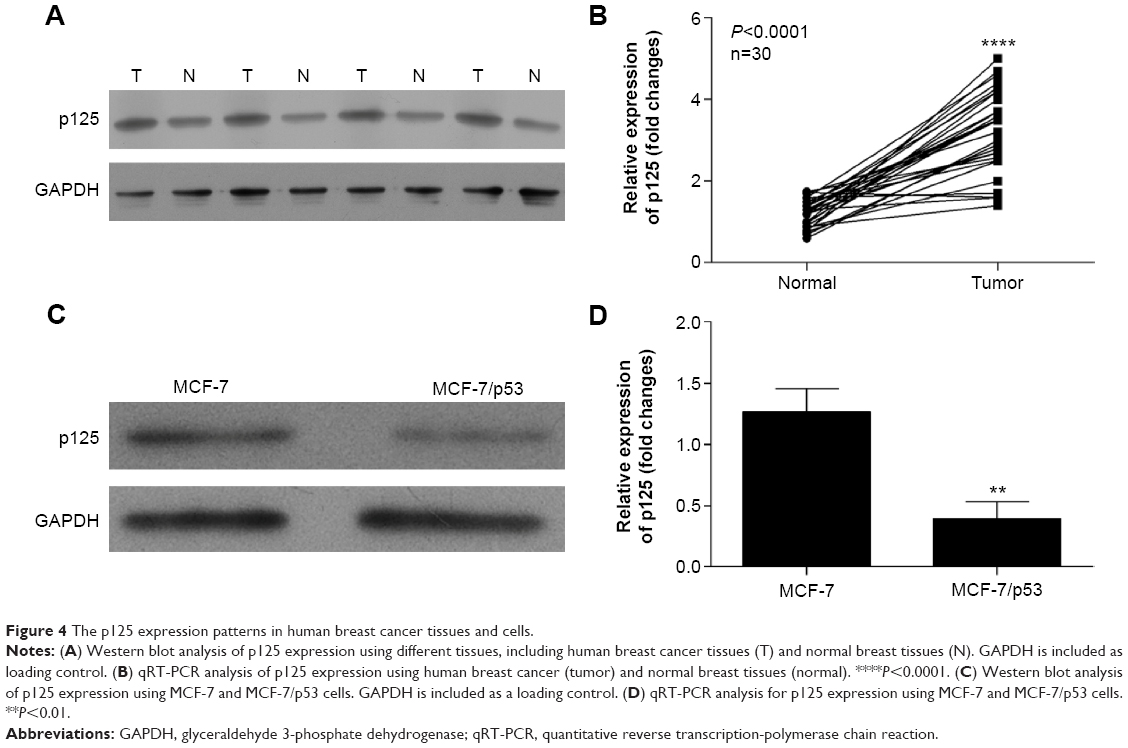 | Figure 4 The p125 expression patterns in human breast cancer tissues and cells. |
The methylation of p125 gene promoter was increased in human breast cancer tissue and cells
Figure 5A shows the p125 methylation levels, revealing a significant decrease in some “normal” and tumor tissue sections, however, increase in some others. Although there is an overall increase of methylation levels in tumor tissue, the presence of in situ carcinoma, nonmacroscopically visible or microscopic foci of tumor may explain the variations in these findings. The methylation levels of the p125 gene promoter were greater in the human breast cancer cell line (MCF-7) than in the normal breast cell line (MCF-10A) (Figure 5B). The methylation level of the p125 gene promoter was inhibited when p53 was overexpressed in MCF-7 cells (Figure 5C).
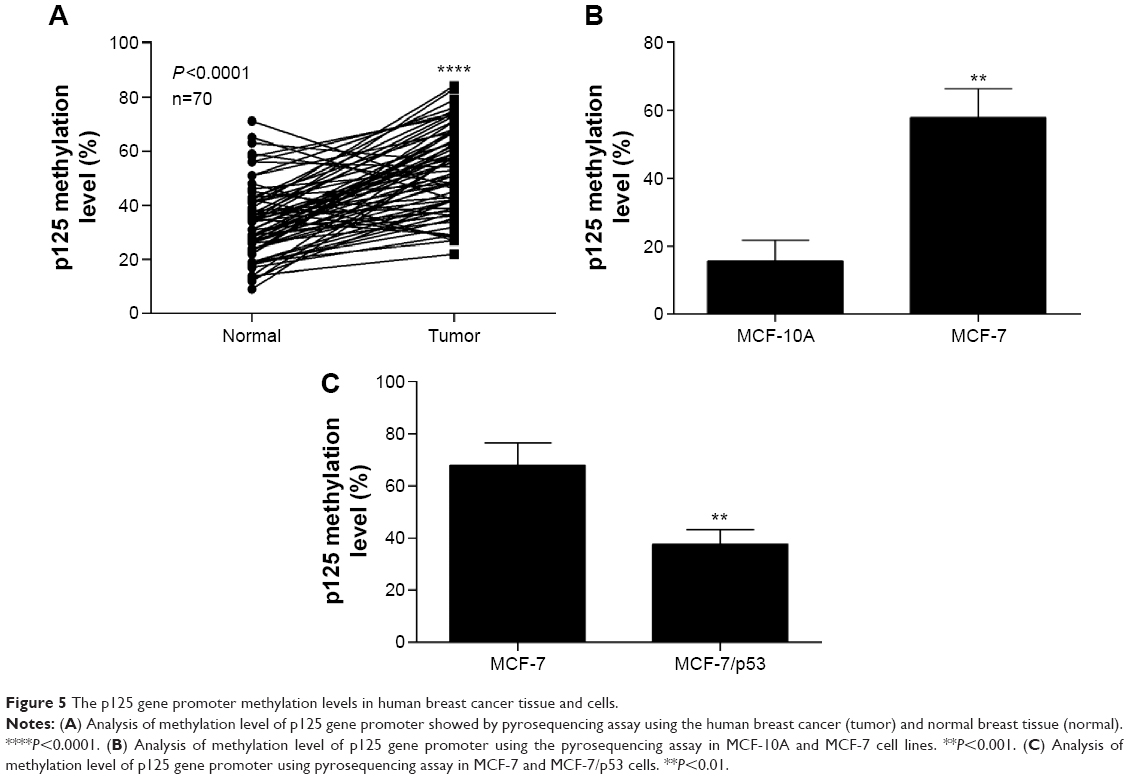 | Figure 5 The p125 gene promoter methylation levels in human breast cancer tissue and cells. |
p53 inhibits the Sp1 to suppress the activity of DNMT1
Both DNMT1 and Sp1 expressions were inhibited by p53 (Figure 6A and B). The coimmunoprecipitation assay showed that p53 could bind to Sp1 in MCF-7 and MCF-7/p53 cells with the overexpression of p53 (Figure 6C). The Sp1 binding site of the DNMT1 gene promoter appeared to be important for DNMT1 transcription. As we used the luciferase reporter gene assay to study gene expression at the transcriptional level, it was observed that the promoter activity was reduced with mutant Sp1 binding site (Figure 6D and E). The above results indicated that DNMT1 promoter activity was promoted by Sp1 binding to the Sp1 binding site on DNMT1 gene promoter. Figure 6F further confirmed that Sp1 binds to DNMT1 promoter, which indicates that DNMT1 is regulated by Sp1, which confirms the previous publications in lung cancer.18
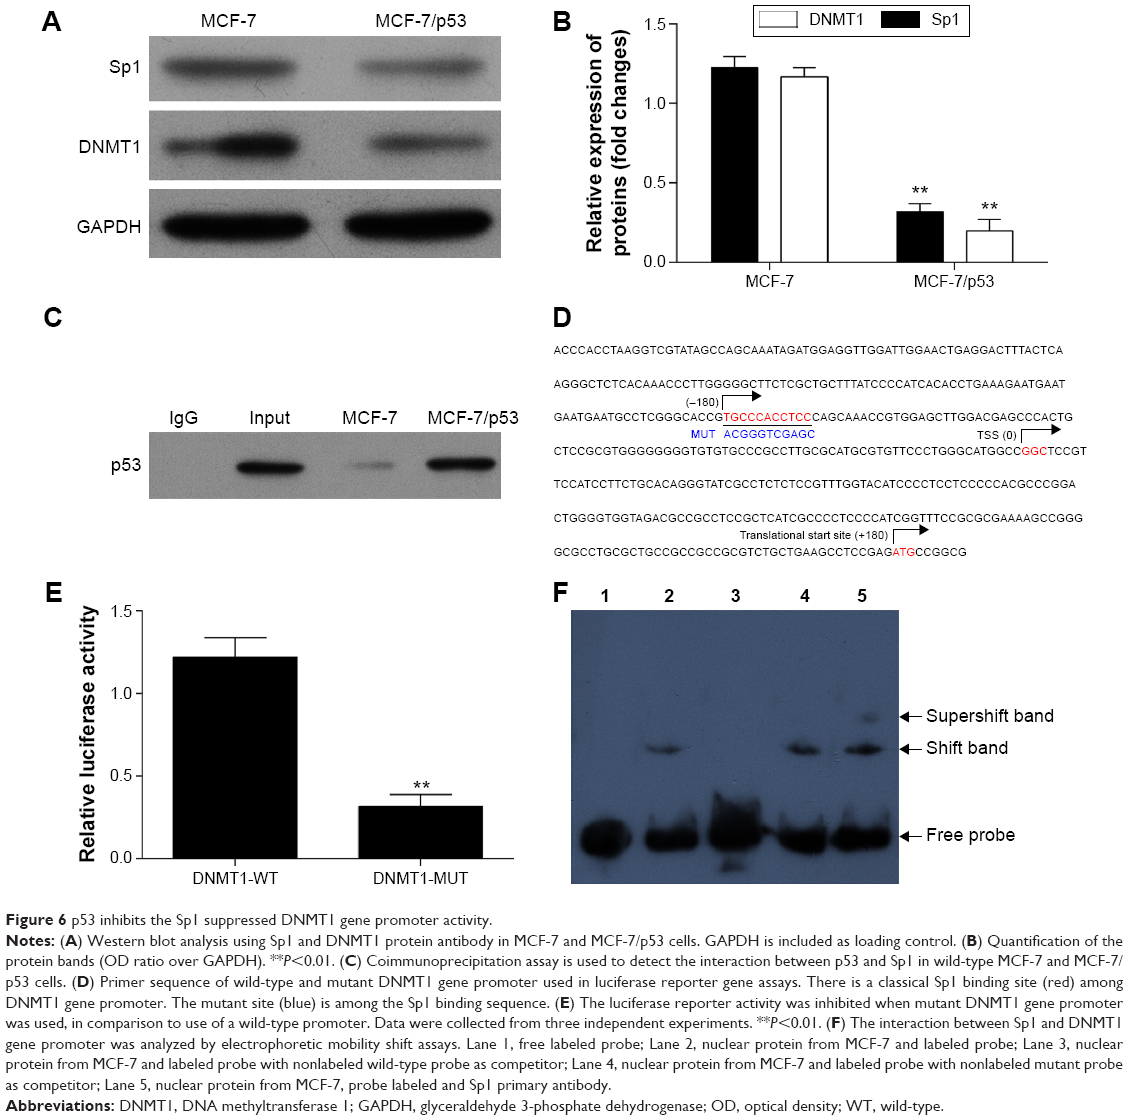 | Figure 6 p53 inhibits the Sp1 suppressed DNMT1 gene promoter activity. |
Discussion
The incidence and mortality of breast cancer have been increasing for last 50 years. The World Health Organization has reported that breast cancer is the leading cause of death in women, accounting for 23% of all cancer deaths in 2012.19,20 The p53 gene is reported to be the most frequently mutated gene in cancer, being altered in ~50% of human malignancy. The p125 catalytic subunit of DNA polymerase δ is associated with DNA replication and genomic stability; p125 expression has been shown to participate in the classical DNA repair pathway and also with tumor progression.21
The p53 protein is a breast cancer biomarker and is associated with breast cancer invasion and metastasis.20,22 The metastatic potential of human breast cancer could be reduced by the loss of p53.22 In this study, p53 is able to inhibit cell proliferation, cell invasion, and promotion apoptosis in breast cancer cell line MCF-7. p53 expressing levels were reduced, while p125 protein expression was increased in human breast cancer tissues and cell line detected by Western blot and qRT-PCR. To determine whether p53 could regulate p125 expression, the MCF-7 cell model was used. In this model, p53 overexpression caused p125 protein decrease, while the methylation level of the p125 gene promoter was also inhibited by p53 overexpression. The methylation level of the p125 gene promoter was greater in breast cancer tissues and cells when compared with normal tissues and cells. The results of this present study indicate that p53 plays a critical role that can regulate p125 protein expression as well as the methylation level of the promoter in human breast cancer.
To further investigate the mechanism of how p53 regulates p125 expression, our study focused on DNMT1, DNA methyltransferase, and transcription factor Sp1. Both DNMT1 and Sp1 protein expressions were reduced when p53 was overexpressed in MCF-7 cells. The Sp1 binding site appears to be important for DNMT1 gene transcription; Sp1 and p53 can bind together, which means that DNMT1 gene expression may be downregulated by p53 through binding to Sp1. Because DNMT1 methylation level of the p125 gene promoter can affect p125 gene transcription, we proposed that p53 may indirectly regulate p125 gene promoter expression through the control of DNMT1 gene transcription.
Usually, genes with high levels of methylation in their promoter region are transcriptionally silent.23 However, the data from this study have shown that both p125 protein expression level and methylation level of p125 gene promoter are increased in breast cancer tissues and cell lines. These findings reflect the different mechanisms of regulation of methylation, and expression of only five CpG sites interrogated in this pyrosequencing analysis may not reflect a direct effect on transcription.
Conclusion
The data from this study have shown that p53 inhibits the methylation of p125 gene promoter by downregulating the Sp1 and DNMT1 activities in breast cancer. However, the reasons to explain why increased expression of p125 is associated with the methylation of p125 gene promoter and if the methylation is aberrant in breast cancer will need to be further explored.
Acknowledgments
This research was supported by the National Natural Science Foundation of China (81360396) and the Innovation Project of Guangxi Graduate Education (YCBZ2015031). The funders had no role in study design, data collection and analysis, decision to publish, or preparation of the manuscript.
Disclosure
The authors report no conflicts of interest in this work.
References
Siegel RL, Miller KD, Jemal A. Cancer statistics, 2015. CA Cancer J Clin. 2015;65(1):5–29. | ||
Lo-Fo-Wong DN, Sitnikova K, Sprangers MA, de Haes HC. Predictors of health care use of women with breast cancer: a systematic review. Breast J. 2015;21(5):508–513. | ||
Malhotra GK, Zhao X, Band H, Band V. Histological, molecular and functional subtypes of breast cancers. Cancer Biol Ther. 2010;10(10):955–960. | ||
Bocangel D, Sengupta S, Mitra S, Bhakat KK. p53-Mediated down-regulation of the human DNA repair gene O6-methylguanine-DNA methyltransferase (MGMT) via interaction with Sp1 transcription factor. Anticancer Res. 2009;29(10):3741–3750. | ||
Chander H, Brien CD, Truesdell P, et al. Toca-1 is suppressed by p53 to limit breast cancer cell invasion and tumor metastasis. Breast Cancer Res. 2014;16(6):3413. | ||
Gogna R, Madan E, Keppler B, Pati U. Gallium compound GaQ(3)-induced Ca(2+) signalling triggers p53-dependent and -independent apoptosis in cancer cells. Br J Pharmacol. 2012;166(2):617–636. | ||
Li T, Kon N, Jiang L, et al. Tumor suppression in the absence of p53-mediated cell cycle arrest, apoptosis, and senescence. Cell. 2012;149(6):1269–1283. | ||
Grawenda AM, Moller EK, Lam S, et al. Interaction between p53 mutation and a somatic HDMX biomarker better defines metastatic potential in breast cancer. Cancer Res. 2015;75(4):698–708. | ||
Rieber M, Strasberg-Rieber M. p53 inactivation decreases dependence on estrogen/ERK signalling for proliferation but promotes EMT and susceptibility to 3-bromopyruvate in ERalpha+ breast cancer MCF-7 cells. Biochem Pharmacol. 2014;88(2):169–177. | ||
Balmer MT, Katz RD, Liao S, Goodwine JS, Gal S. Doxorubicin and 5-fluorouracil induced accumulation and transcriptional activity of p53 are independent of the phosphorylation at serine 15 in MCF-7 breast cancer cells. Cancer Biol Ther. 2014;15(8):1000–1012. | ||
Bousquet G, El Bouchtaoui M, Leboeuf C, et al. Tracking sub-clonal TP53 mutated tumor cells in human metastatic renal cell carcinoma. Oncotarget. 2015;6(22):19279–19289. | ||
Zhao L, Chang LS. The human POLD1 gene. Identification of an upstream activator sequence, activation by Sp1 and Sp3, and cell cycle regulation. J Biol Chem. 1997;272(8):4869–4882. | ||
Li B, Lee MY. Transcriptional regulation of the human DNA polymerase delta catalytic subunit gene POLD1 by p53 tumor suppressor and Sp1. J Biol Chem. 2001;276(32):29729–29739. | ||
Venkatesan RN, Treuting PM, Fuller ED, et al. Mutation at the polymerase active site of mouse DNA polymerase delta increases genomic instability and accelerates tumorigenesis. Mol Cell Biol. 2007;27(21):7669–7682. | ||
Song J, Hong P, Liu C, Zhang Y, Wang J, Wang P. Human POLD1 modulates cell cycle progression and DNA damage repair. BMC Biochem. 2015;16(1):1–8. | ||
Lim LY, Vidnovic N, Ellisen LW, Leong CO. Mutant p53 mediates survival of breast cancer cells. Br J Cancer. 2009;101(9):1606–1612. | ||
Alkhalaf M, El-Mowafy AM. Overexpression of wild-type p53 gene renders MCF-7 breast cancer cells more sensitive to the antiproliferative effect of progesterone. J Endocrinol. 2003;179(1):55–62. | ||
Lin RK, Wu CY, Chang JW, et al. Dysregulation of p53/Sp1 control leads to DNA methyltransferase-1 overexpression in lung cancer. Cancer Res. 2010;70(14):5807–5817. | ||
Donepudi MS, Kondapalli K, Amos SJ, Venkanteshan P. Breast cancer statistics and markers. J Cancer Res Ther. 2014;10(3):506–511. | ||
Duffy MJ, Synnott NC, McGowan PM, Crown J, O’Connor D, Gallagher WM. p53 as a target for the treatment of cancer. Cancer Treat Rev. 2014;40(10):1153–1160. | ||
Kim G, Ouzounova M, Quraishi AA, et al. SOCS3-mediated regulation of inflammatory cytokines in PTEN and p53 inactivated triple negative breast cancer model. Oncogene. 2015;34(6):671–680. | ||
Powell E, Piwnica-Worms D, Piwnica-Worms H. Contribution of p53 to metastasis. Cancer Discov. 2014;4(4):405–414. | ||
Maurano Matthew T, Wang H, John S, et al. Role of DNA methylation in modulating transcription factor occupancy. Cell Rep. 2015;12(7):1184–1195. |
 © 2016 The Author(s). This work is published and licensed by Dove Medical Press Limited. The full terms of this license are available at https://www.dovepress.com/terms.php and incorporate the Creative Commons Attribution - Non Commercial (unported, v3.0) License.
By accessing the work you hereby accept the Terms. Non-commercial uses of the work are permitted without any further permission from Dove Medical Press Limited, provided the work is properly attributed. For permission for commercial use of this work, please see paragraphs 4.2 and 5 of our Terms.
© 2016 The Author(s). This work is published and licensed by Dove Medical Press Limited. The full terms of this license are available at https://www.dovepress.com/terms.php and incorporate the Creative Commons Attribution - Non Commercial (unported, v3.0) License.
By accessing the work you hereby accept the Terms. Non-commercial uses of the work are permitted without any further permission from Dove Medical Press Limited, provided the work is properly attributed. For permission for commercial use of this work, please see paragraphs 4.2 and 5 of our Terms.