")
Back to Journals » Journal of Inflammation Research » Volume 15
Oxidation, Glycation, and Carbamylation of Salivary Biomolecules in Healthy Children, Adults, and the Elderly: Can Saliva Be Used in the Assessment of Aging?
Authors Maciejczyk M , Nesterowicz M , Szulimowska J, Zalewska A
Received 10 January 2022
Accepted for publication 11 March 2022
Published 28 March 2022 Volume 2022:15 Pages 2051—2073
DOI https://doi.org/10.2147/JIR.S356029
Checked for plagiarism Yes
Review by Single anonymous peer review
Peer reviewer comments 4
Editor who approved publication: Dr Monika Sharma
Mateusz Maciejczyk,1 Miłosz Nesterowicz,2 Julita Szulimowska,3 Anna Zalewska3
1Department of Hygiene, Epidemiology and Ergonomics, Medical University of Bialystok, Bialystok, Poland; 2Students Scientific Club “Biochemistry of Civilization Diseases” at the Department of Hygiene, Epidemiology, and Ergonomics, Medical University of Bialystok, Bialystok, Poland; 3Department of Conservative Dentistry, Medical University of Bialystok, Bialystok, Poland
Correspondence: Mateusz Maciejczyk, Department of Hygiene, Epidemiology and Ergonomics, Medical University of Bialystok, 2c Mickiewicza Street, Bialystok, 15-233, Poland, Email [email protected]
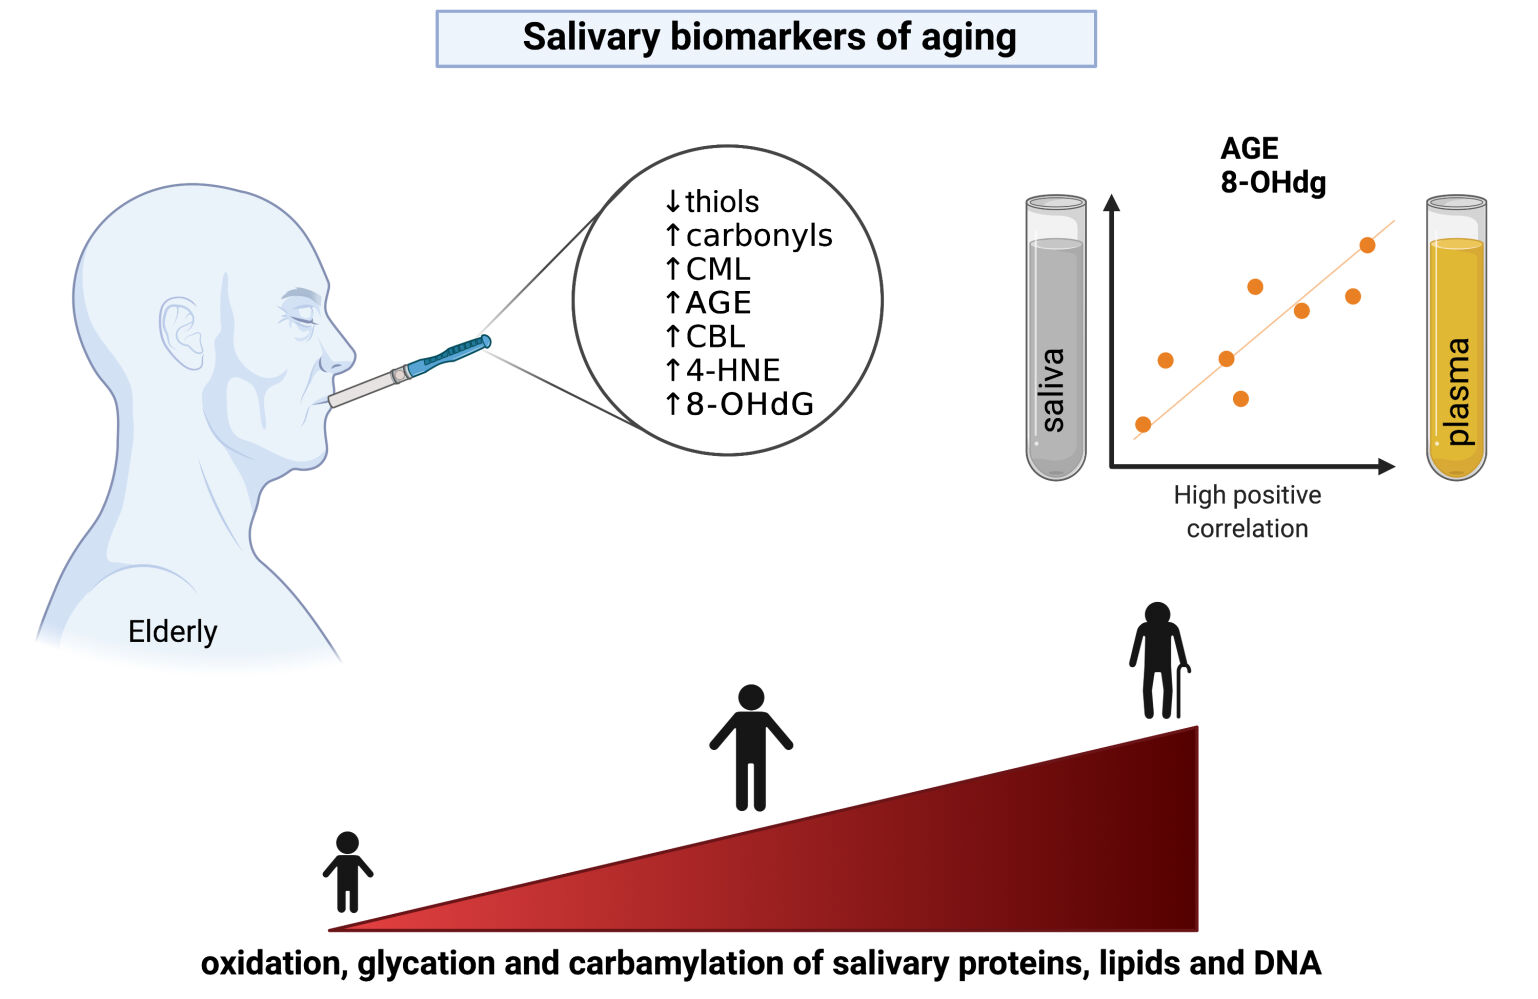
Background: Aging is inextricably linked to oxidative stress, inflammation, and posttranslational protein modifications. However, no studies evaluate oxidation, glycation, and carbamylation of salivary biomolecules as biomarkers of aging. Saliva collection is non-invasive, painless, and inexpensive, which are advantages over other biofluids.
Methods: The study enrolled 180 healthy subjects divided into six groups according to age: 6– 13, 14– 19, 20– 39, 40– 59, 60– 79, and 80– 100 years. The number of individuals was determined a priori based on our previous experiment (power of the test = 0.8; α = 0.05). Non-stimulated saliva and plasma were collected from participants, in which biomarkers of aging were determined by colorimetric, fluorometric, and ELISA methods.
Results: The study have demonstrated that modifications of salivary proteins increase with age, as manifested by decreased total thiol levels and increased carbonyl groups, glycation (Nϵ-(carboxymethyl) lysine, advanced glycation end products (AGE)) and carbamylation (carbamyl-lysine) protein products in the saliva of old individuals. Oxidative modifications of lipids (4-hydroxynonenal) and nucleic acids (8-hydroxy-2’-deoxyguanosine (8-OHdG)) also increase with age. Salivary redox biomarkers correlate poorly with their plasma levels; however, salivary AGE and 8-OHdG generally reflect their blood concentrations. In the multivariate regression model, they are a predictor of aging and, in the receiver operating characteristic (ROC) analysis, significantly differentiate children and adolescents (under 15 years old) from the working-age population (15– 64 years) and the older people (65 years and older).
Conclusion: Salivary AGE and 8-OHdG have the most excellent diagnostic utility in assessing the aging process. Saliva can be used to evaluate the aging of the body.
Keywords: saliva, aging, protein oxidation, protein glycation, protein carbamylation, DNA oxidation
Graphical Abstract:
Introduction
The aging of the human population has become a particular challenge as its intensity enhanced significantly in recent years. The latest epidemiological studies have indicated that stochastic damages to the genome, proteome, lipidome, and glycome caused by reactive oxygen species (ROS) are the most important causes of aging.1–7 The severe consequences of aging result from oxidative DNA modifications, leading to genetic mutations underlying carcinogenesis.4–7 Oxidized proteins, lipids, and DNA can accumulate in the cell, which reduces the body’s ability to environmental stress.8,9 Accumulation of advanced glycation end products (AGE) in tissues has been shown to induce ROS overproduction and enhance the secretion of several cytokines, chemokines, and growth factors such as interleukin 1 (IL-1), interleukin 6 (IL-6), and tumor necrosis factor α (TNF-α).10–12 The pro-oxidant and pro-inflammatory effects of AGE involve interaction with a specific receptor (receptor for advanced glycation end-products; RAGE) that activates NF-κB (nuclear factor kappa-light-chain-enhancer of activated B cells) and MAP-kinase as well as enhances NADPH oxidase (NOX) activity.11,13–15 Under these conditions, there is intensified protein carbonylation and more excellent permeability of cell membranes, increasing cell susceptibility to hypoxia-induced damage.13,16 Additionally, oxidation and glycation protein products cause disintegration between endothelium and extracellular matrix, promoting plaque formation or the development of diabetic microangiopathies.2,12,17–19 Therefore, it is postulated that oxidized and glycated biomolecules can be used to assess the intensity of aging processes or diseases with oxidative stress etiology.20–23
A healthy lifestyle is critical to healthy aging. Since modifiable risk factors significantly impact life expectancy more than genetic ones, timely lifestyle changes could improve general health.1–7 In addition, many diseases occur with premature aging, and biological age does not imply chronological age. Therefore, biomarkers of aging are continually being sought. Among the biological fluids used in laboratory practice, saliva exhibits unique characteristics.24,25 Saliva is the secretion of salivary glands that constitutes the oral cavity environment. Although it is 99% composed of water, the rest includes inorganic and organic substances that pass into saliva from the blood. The compounds enter the oral cavity by passive diffusion, active transport, ultrafiltration, or exudation, making saliva rich in many low and high molecular weight compounds.26 These include proteins, lipids, hormones, antioxidants, and products of oxidation (eg, protein carbonyls, 4-hydroxynonenal (4-HNE), 8-hydroxy-2’-deoxyguanosine (8-OHdG)), glycation (eg, Nε-(carboxymethyl) lysine (CML), AGE), and carbamylation (eg, carbamyl-lysine (CBL)) of biomolecules.27–31 Although many compounds can also be produced in the salivary glands, the concentration of several biomarkers in saliva highly correlates with their plasma content.43–46 Therefore, it is not surprising that this biofluid is commonly used in diagnostics. Moreover, saliva is collected non-invasive and stress-free without requiring specialized equipment or trained personnel. It is also characterized by high stability and durability compared to other biological fluids.24,32–35 Our previous studies have shown that the salivary antioxidant barrier is most prominent in middle-aged individuals and weakens with age, accompanied by a decrease in salivary flow rate.36–38 However, the studies were conducted on a small number of patients and did not include individuals in all age ranges. Furthermore, no studies evaluate salivary oxidation, glycation, and carbamylation products as biomarkers of aging. Modified proteins have relatively high molecular weight, and it is not known if they pass from plasma into saliva. Furthermore, it is not known whether their salivary content reflects the blood level. Since indicators of aging and premature aging are constantly being sought, the presented study is the first to evaluate oxidized, glycated and carbamylated proteins, lipids, and DNA in the saliva of subjects with different age groups.
Materials and Methods
The studies involving human participants were carried out according to the Declaration of Helsinki and approved by the Bioethics Committee of the Medical University of Bialystok (permission code R-I-002/62/2016 R-I-002/43/2018). The participants and/or their legal guardians provided written informed consent to participate in this study.
Subjects
The experiment included one hundred eighty patients of the Specialist Dental Clinic of the Medical University of Bialystok reporting for regular follow-up visits. The study enrolled generally healthy subjects having never suffered from oral diseases (hyposalivation, burning mouth syndrome, and oral cancer) as well as metabolic (obesity, insulin resistance, metabolic syndrome, and type 1 diabetes), cardiovascular (arrhythmias and conductivity disorders), neuropsychiatric (dementia, Parkinson’s disease, and Alzheimer’s disease), thyroid (hypothyroidism, hyperthyroidism, and Hashimoto’s disease), lung (asthma, chronic obstructive pulmonary disease), liver (hepatitis and non-alcoholic fatty liver), kidney (acute and chronic renal failure), and neoplastic diseases. Data were collected from Medical records and data provided by the patient. Moreover, the research excepted individuals with infectious (eg, infection with hepatitis C virus (HCV) and human immunodeficiency virus (HIV)), autoimmune (eg, rheumatoid arthritis, Sjögren’s syndrome, and scleroderma), and gastrointestinal disorders, as well as alcohol-dependent patients, smokers, and pregnant women. All subjects had not taken hormones, antibiotics, nonsteroidal anti-inflammatory drugs, vitamins, and dietary supplements for the last three months chronically. Additionally, none of the subjects changed their eating habits during this period. Patients with active caries, gingivitis, and periodontitis were also eliminated from the study.
All participants were split into six groups based on age: 6–13, 14–19, 20–39, 40–59, 60–79, and 80–100—every group comprised 30 individuals: 15 men and 15 women. The division into the above age ranges was elaborated using the WHO classification regarding the most common intervals in the standard population distribution. The number of subjects was settled according to our previous study, assuming that the power of the test = 0.8 (α = 0.05).
Clinical data of participants are shown in Tables 1 and 2. All subjects had body mass index (BMI) in the range of 18.5 to 24.5, normal blood count, and normal biochemical blood results (electrolytes, creatinine, and ALT).
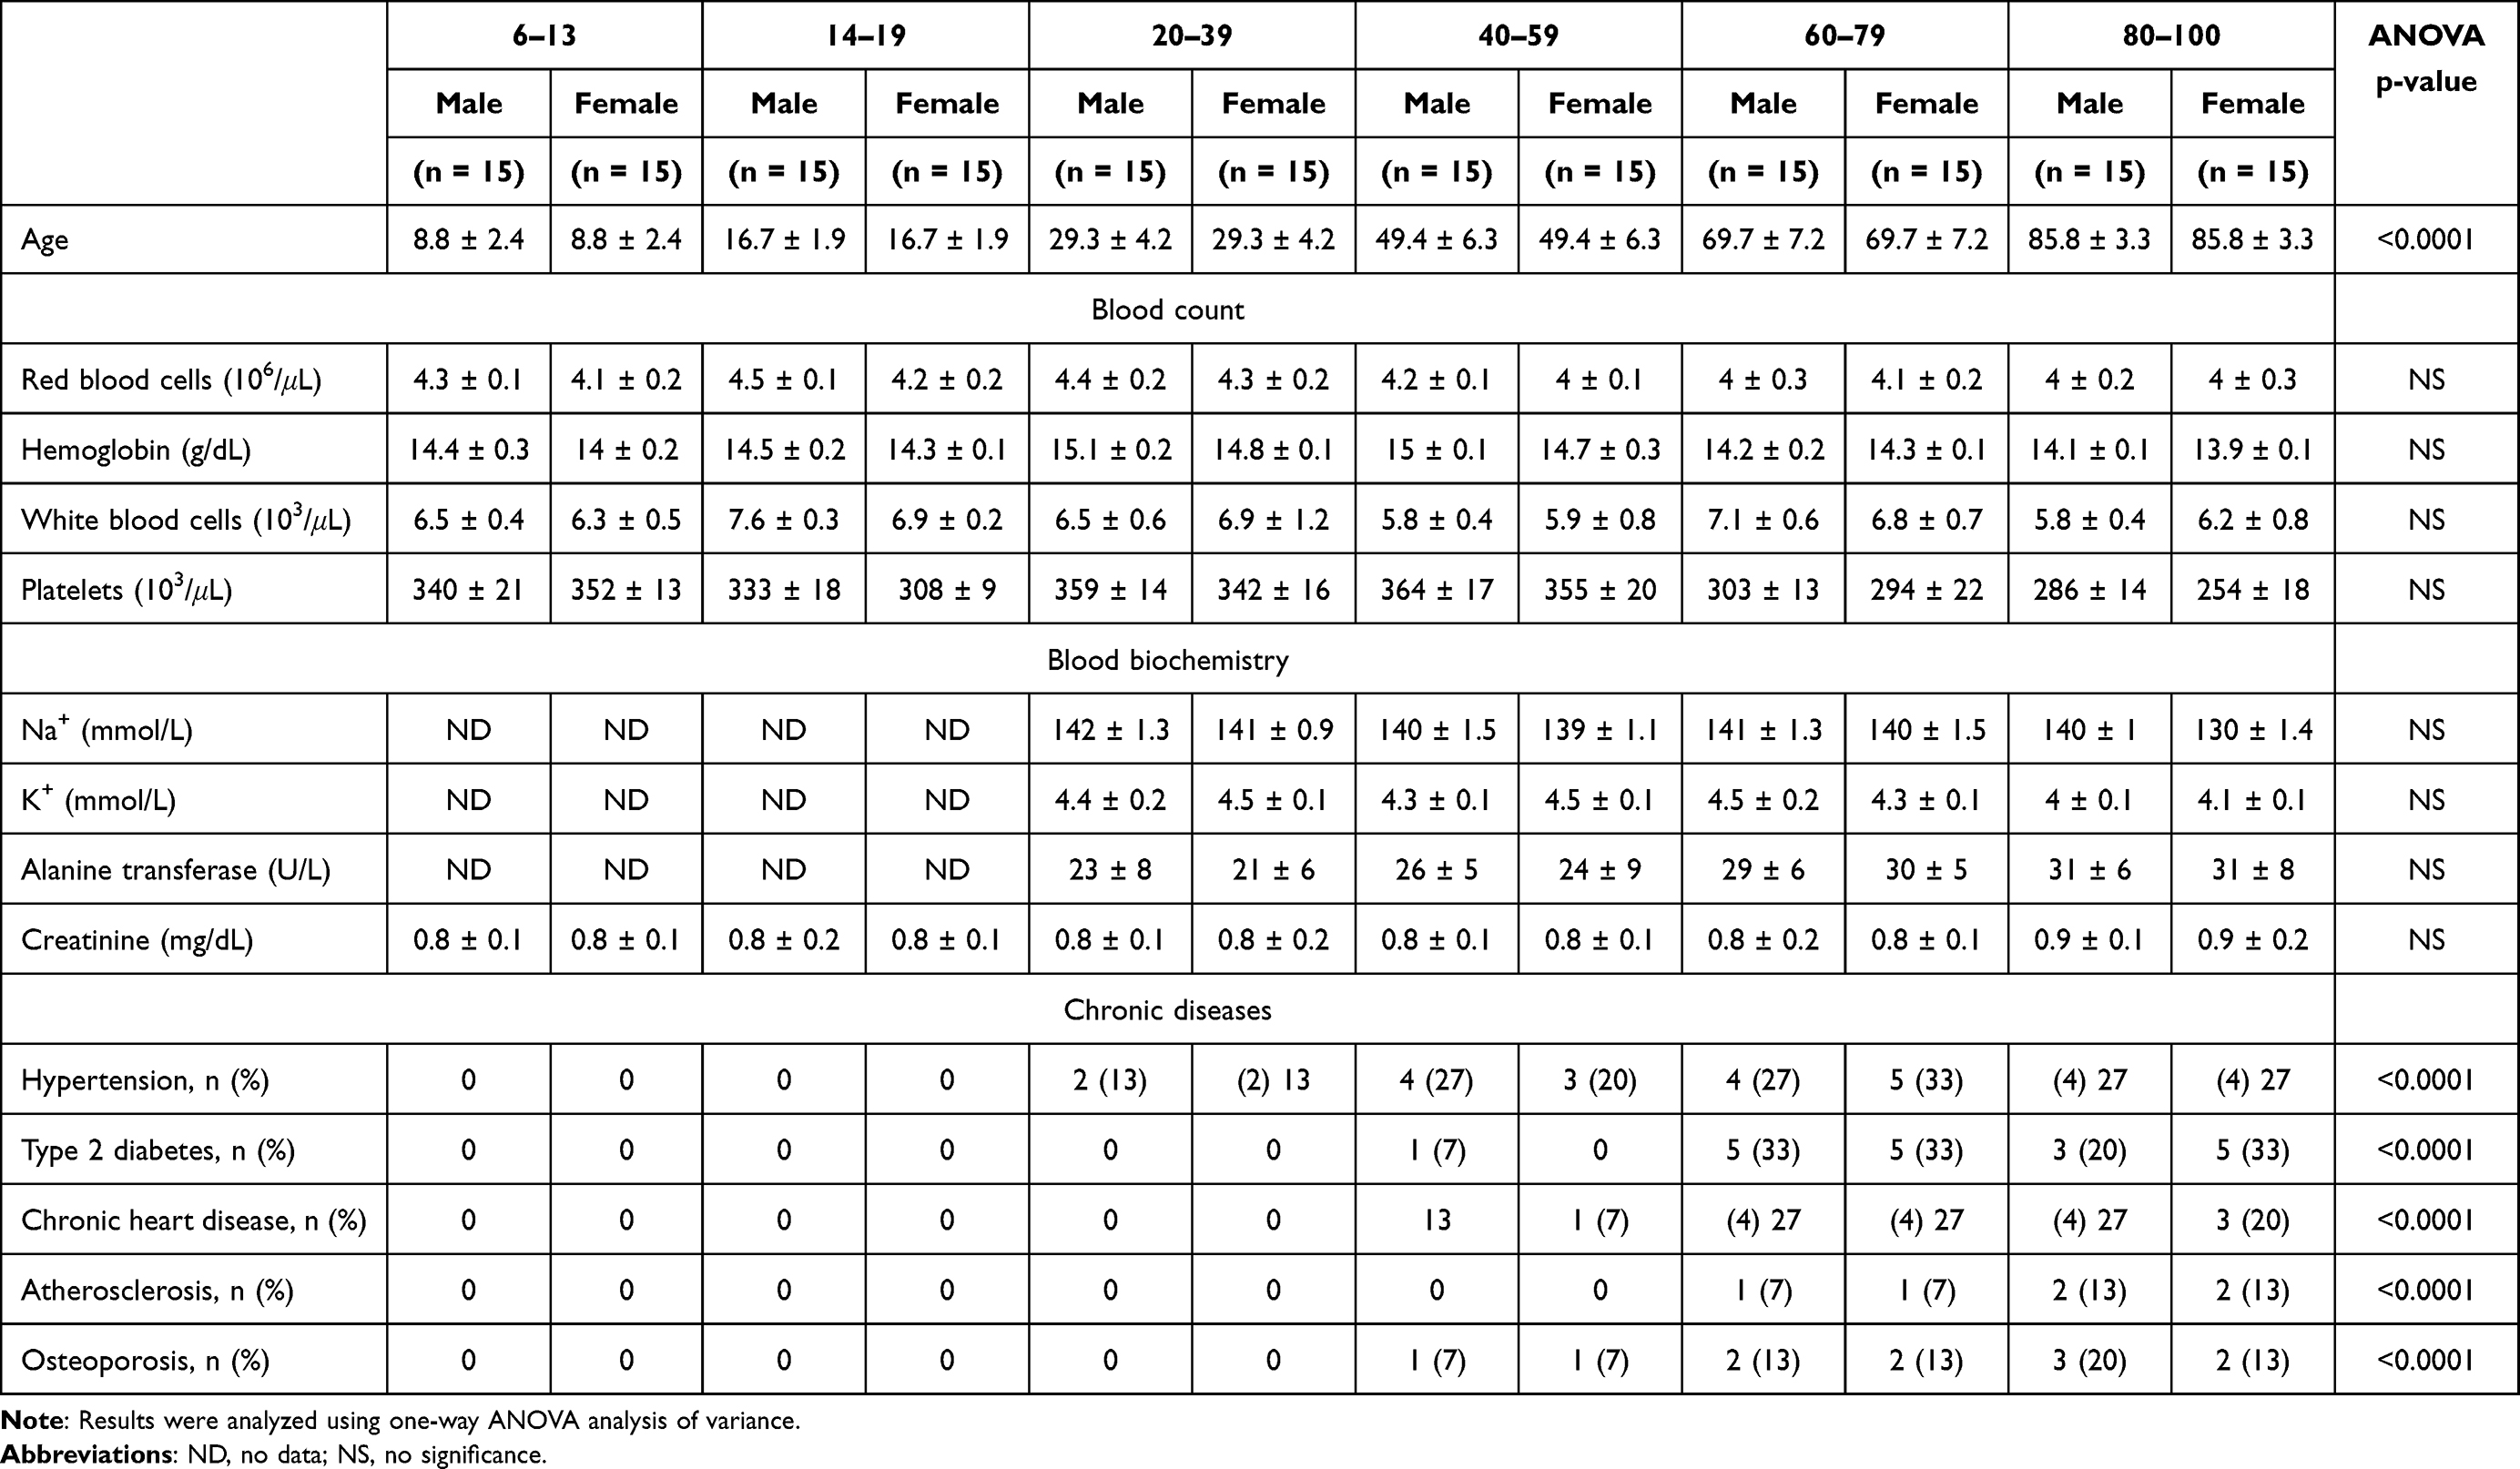 |
Table 1 Clinical Characteristics of Healthy Subjects Aged 6–13, 14–19, 20–39, 40–59, 60–79, and 80–100 |
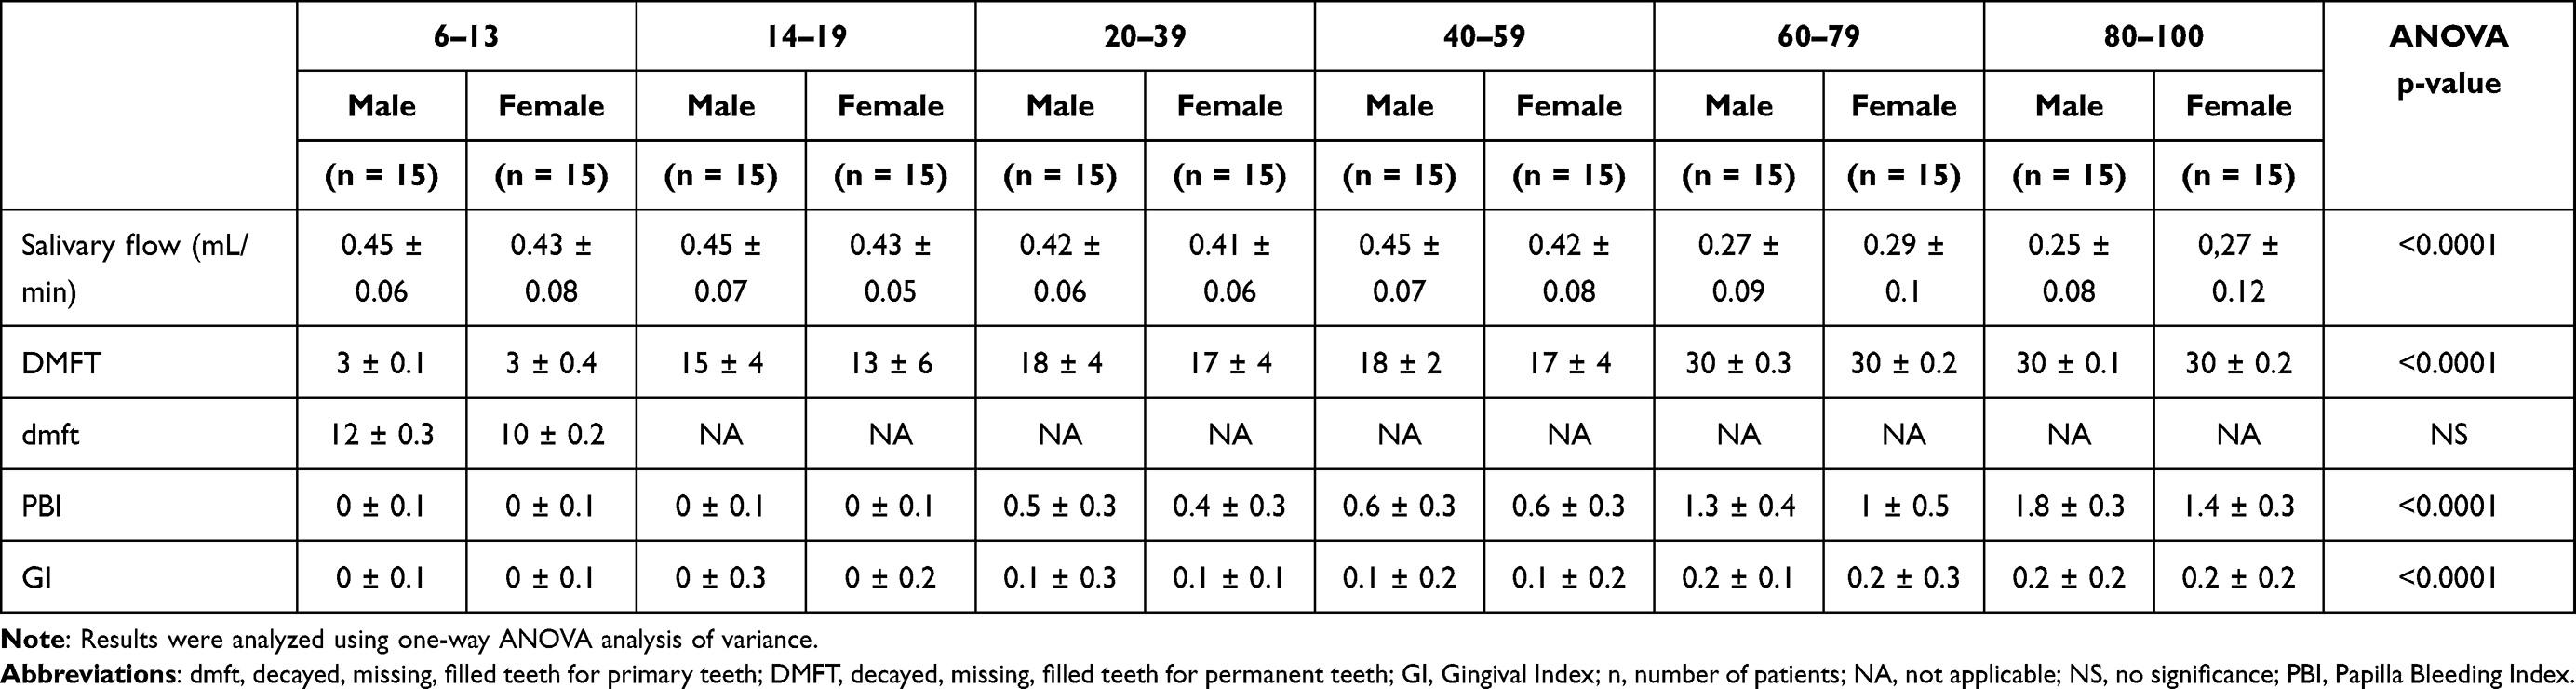 |
Table 2 Dental Examination of Healthy Subjects Aged 6–13, 14–19, 20–39, 40–59, 60–79, and 80–100 |
Saliva Collection
Mixed non-stimulated saliva was gathered by the spitting method after 2-hour abstinence from liquid and solid food (except for mineral water) as well as dental hygiene procedures. Saliva gathering took place in a separate and cozy room, sitting with the head slightly tilted down. Saliva was gathered between 7 am and 9 am after a 5-minute adaptation to the environment. All individuals had not taken any drugs for 8 hours before the samples collection. Every subject irrigated the oral cavity three times with deionized water, and saliva was collected into a 15 mL Falcon tube set in an ice container. The material gathered during the first minute was expelled.39 Saliva was collected in the amount of up to 5 mL for no more than 15 minutes.40 The volume of samples was measured using an automatic pipette calibrated to 0.1 mL. The salivary flow rate was estimated by dividing the saliva volume by the time of gathering it (mL/min). Instantly after collection, saliva was centrifuged (4°C, 5000 × g, 20 min) and frozen at −80°C until assessment. The supernatant was preserved for subsequent study. An antioxidant (butylated hydroxytoluene, BHT) was added to protect the material against oxidation.41
Dental Examination
Examination of the oral cavity was conducted in artificial light (10,000 lx) based on the World Health Organization criteria.42 To assess oral Hygiene and periodontal status, decayed, missing, filled teeth (DMFT), Gingival Index (GI), and also Papilla Bleeding Index (PBI) were evaluated. The DMFT is the sum of teeth with caries (D), teeth extracted because of caries (M), and teeth filled due to the occurrence of caries (F). The GI indicates qualitative changes in the gingivae, while PBI expresses the intensity of bleeding from the gingival papilla after probing. The dmft index was also assayed for primary teeth in children and adolescents.42 A clinical examination was performed by one experienced dentist (J.S.). Moreover, the interrater reliability, ie, agreements among the examiner and two other experienced dentists (A.Z. and S.Z.), was assessed in 45 individuals. The reliability for dmft/DMFT was r = 0:96; for GI: r = 0:95; and for PBI: r = 0:94.
Blood Collection
10 mL of venous blood was gathered with the S-Monovette® K3 EDTA blood collection system (Sarstedt, Nümbrecht, Germany). Each sample was taken on an empty stomach after an overnight rest. Blood was centrifuged (4°C, 1500 × g, 10 min), and plasma (upper layer after centrifugation) was collected instantaneously.43 BHT was added, similarly to saliva samples. The material was frozen at −80° C until assessment.
Salivary and Blood Assays
All reagents (unless otherwise specified) were purchased from Sigma-Aldrich (Nümbrecht, Germany/Saint Louis, MO, USA). To measure absorbance and fluorescence, BioTek Synergy H1 (Winooski, VT, USA) was used. All determinations were conducted in duplicate samples, and results were standardized to 1 mg of total protein. Total protein content was measured based on the bicinchoninic acid (BCA) method44 using the commercial Pierce BCA Protein Assay Kit (Thermo Fisher Scientific, Rockford, IL, USA).
Protein Oxidation Products
Total thiols concentration was assessed colorimetrically at a wavelength of 412 nm with Ellman’s reagent. The quantity of thiol groups was determined based on a standard curve for reduced glutathione.45
The level of protein carbonyls was measured with a colorimetric method at 355 nm wavelength. The method is based on the reaction of carbonyl groups with 2,4-dinitrophenylhydrazine (2,4-DNPH).46
Protein Glycation Products
According to the manufacturer, the methylglyoxal (MGO) concentration was measured immunoenzymatically using the OxiSelect™ Methylglyoxal ELISA Kit (Cell Biolabs, San Diego, CA, USA). MGO content was calculated using MG-BSA standard curve.
The level of Nε-(carboxymethyl) lysine (CML) was estimated immunoenzymatically using OxiSelect™ Nε-(carboxymethyl) lysine (CML) Competitive ELISA Kit (Cell Biolabs, San Diego, CA, USA). The quantity of CML was assessed based on a standard curve for CML-BSA.
The content of advanced glycation end products (AGE) was assayed spectrofluorimetrically at 350 and 440 nm wavelengths.
Protein Carbamylation Product
To assess the level of carbamylated proteins, carbamyl-lysine (CBL) was evaluated using the OxiSelect™ Protein Carbamylation Sandwich ELISA Kit (Cell Biolabs, San Diego, CA, USA). CBL content was calculated from a CBL-BSA standard curve.
Lipid Oxidation Product
4-hydroxynonenal protein adducts (4-HNE) were assayed with an enzyme immunoassay using the OxiSelect™ HNE Adduct Competitive ELISA Kit (Cell Biolabs, San Diego, CA, USA). The level of 4-HNE was estimated based on a standard curve of HNE-BSA.
DNA Oxidation Product
The 8-hydroxy-2’-deoxyguanosine (8-OHdG) level was measured immunoenzymatically with the OxiSelect™ Oxidative DNA Damage ELISA Kit (Cell Biolabs, San Diego, CA, USA) according to the manufacturer’s instructions. 8-OHdG quantity was calculated using the 8-OHdG standard curve.
Statistical Analyses
GraphPad Prism 9 (GraphPad Software, La Jolla, CA, USA) for MacOS was used to perform the statistical analysis. The normality of the distribution was assessed using the Shapiro–Wilk test, while homogeneity of variance used the Levene test. Two-way analysis of variance ANOVA, post hoc Tukey’s HSD (honestly significant difference) test, and Student’s t-test were involved in specific analyses. The relationships between the variables were assayed with Pearson’s correlation coefficient. The multivariate linear regression model was applied to examine the associations among aging, sex, and biomarkers levels. Sex and age were included as independent variables. A 95% confidence interval (CI) was reported along with regression parameters. Moreover, receiver operating characteristic (ROC) analysis was used to determine the diagnostic value of salivary and plasma biomarkers. Their concentrations were compared in three age groups: children and adolescents (under 15 years of age), the working-age population (15–64 years of age), and the elderly (65 years of age and older). Cut-off value, the area under the curve (AUC), sensitivity, and specificity with 95% CI were evaluated to assess the discrimination power of the assessed biomarkers. As the statistical significance p < 0.05 was assumed.
Results
Protein Oxidation
Two-way analysis of variance (ANOVA) showed that salivary total thiols concentration was age dependent (p < 0.0001; percentage of total variation – 23.12%), but not sex (p = 0.7259; percentage of total variation – 0.055%) or interaction between age and gender dependent (p = 0.5469; percentage of total variation – 1.8%). The concentration of total thiols was significantly lower in men aged 80–100 compared to men aged 14–19 (p = 0.0127; ↓38%) and 20–39 (p = 0.0498; ↓35%). Furthermore, this parameter was significantly reduced in men aged 60–79 than in those aged 14–19 (p = 0.0081; ↓39%) and 20–39 (p = 0.0338; ↓36%). The concentration of total thiols was significantly lower also in women aged 80–100 and 60–79 compared to those aged 14–19 (p = 0.0006; ↓46% and p = 0.0122; ↓33%, respectively) (Figure 1A).
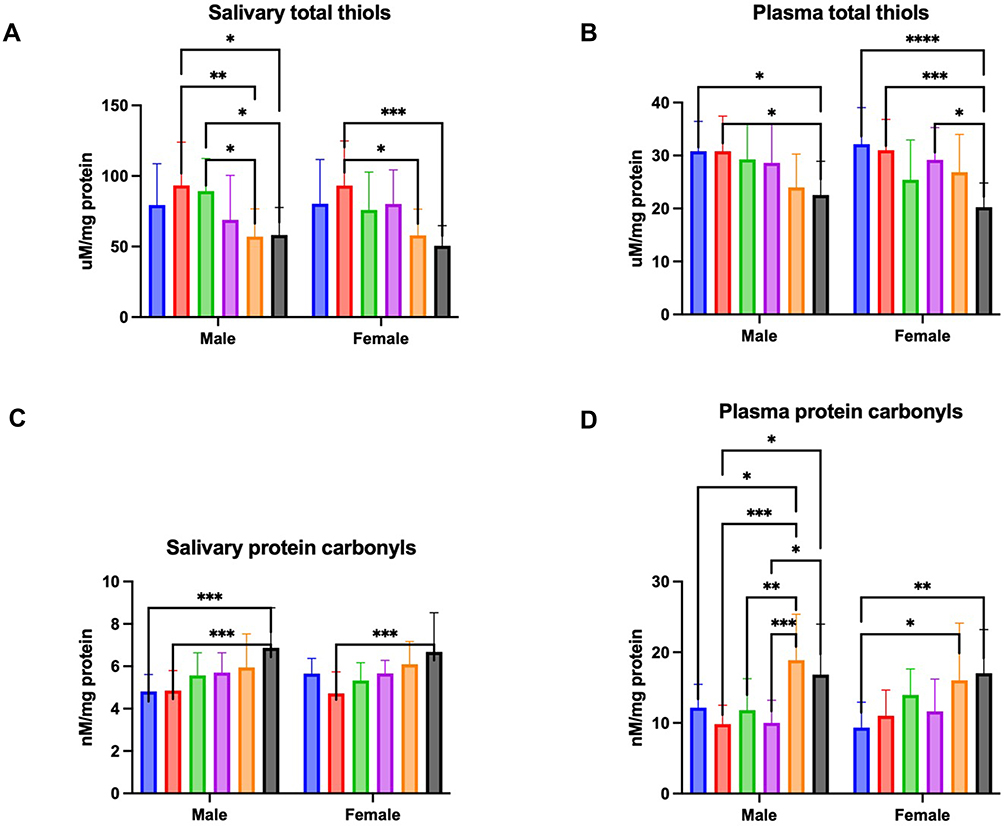 |
Figure 1 Concentration of total thiols in saliva (A) and plasma (B), and protein carbonyls in saliva (C) and plasma (D) of males and females aged 6–13 (blue bars), 14–19 (red bars), 20–39 (green bar), 40–59 (purple bars), 60–79 (Orange bars), and 80–100 (black bars). Notes: Data are shown as mean ± SD. Differences statistically significant at: *p < 0.05; **p < 0.005; ***p < 0.0005; ****p < 0.0001. |
The results of a two-way ANOVA indicated plasma total thiols concentration was only age dependent (p < 0.0001; percentage of total variation – 22.79%), but not sex (p = 0.8317; percentage of total variation – 0.02%) or age-gender dependent (p = 0.3665; percentage of total variation – 2.43%). The concentration of total thiols was significantly lower in men aged 80–100 in comparison to men aged 6–13 (p = 0.0281; ↓27%) and 14–19 (p = 0.0289; ↓27%). Moreover, this parameter was significantly reduced between women aged 80–100 and those aged 6–13 (p < 0.0001; ↓37%), 14–19 (p = 0.0005; ↓35%), and 40–59 (p = 0.0109; ↓31%) (Figure 1B).
Two-way analysis of variance showed salivary protein carbonyls was age dependent (p < 0.0001; percentage of total variation – 22.65%), but not sex (p = 0.7226; percentage of total variation – 0.057%) or interaction between age and gender dependent (p = 0.4994; percentage of total variation – 1.96%). The concentration of protein carbonyls was significantly higher in men aged 80–100 compared to men aged 6–13 (p = 0.0003; ↑43%) and 14–19 (p = 0.0004; ↑41%), and in women aged 80–100 in comparison to those aged 14–19 (p = 0.0007; ↑42%) (Figure 1C).
Two-way ANOVA indicated plasma protein carbonyls concentration was only age dependent (p < 0.0001; percentage of total variation – 25.7%), but not sex (p = 0.9058; percentage of total variation – 0.006%) or age-gender dependent (p = 0.2119; percentage of total variation – 3.06%). The concentration of protein carbonyls was significantly increased in men aged 80–100 in comparison to men aged 14–19 (p = 0.0107; ↑71%) and 40–59 (p = 0.0148; ↑68%). Furthermore, this parameter was significantly higher in men aged 80–100 compared to those aged 6–13 (p = 0.0181; ↑55%), 14–19 (p = 0.0001; ↑92%), 20–39 (p = 0.0098; ↑60%), and 40–59 (p = 0.0002; ↑88%). The concentration of protein carbonyls was significantly higher also in women aged 80–100 and 60–79 in comparison to women aged 6–13 (p = 0.0028; ↑82% and p = 0.0183; ↑72%, respectively) (Figure 1D).
Protein Glycation
Two-way analysis of variance showed that salivary MGO concentration was age dependent (p = 0.018; percentage of total variation – 7.56%), but not sex (p = 0.8318; percentage of total variation – 0.024%) or interaction between age and gender dependent (p = 0.5132; percentage of total variation – 2.29%). There were not any significant differences in concentration of salivary MGO (Figure 2A).
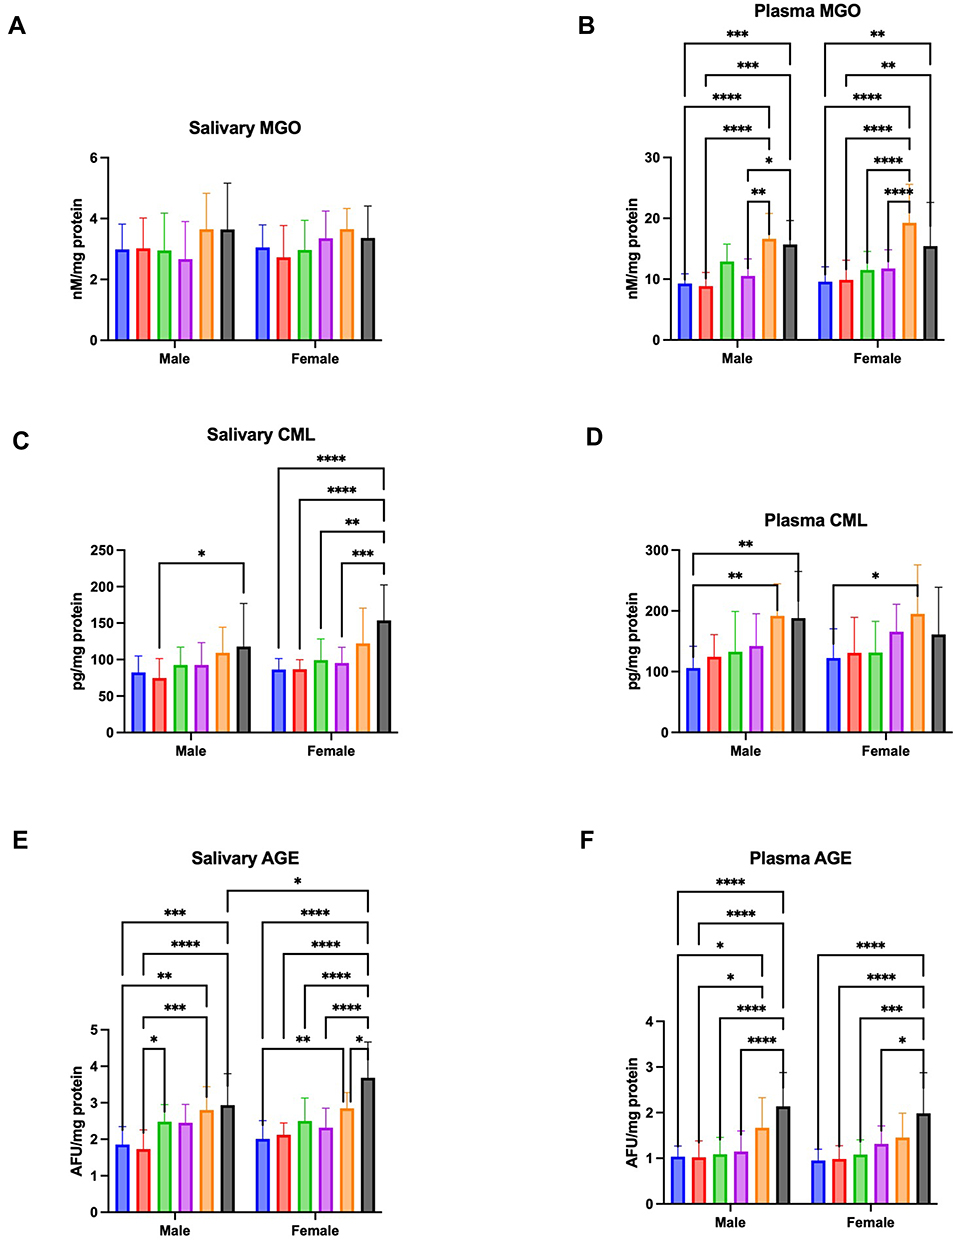 |
Figure 2 Concentration of MGO in saliva (A) and plasma (B), CML in saliva (C) and plasma (D), and AGE in saliva (E) and plasma (F) of males and females aged 6–13 (blue bars), 14–19 (red bars), 20–39 (green bar), 40–59 (purple bars), 60–79 (Orange bars), and 80–100 (black bars). Notes: Data are shown as mean ± SD. Differences statistically significant at: *p < 0.05; **p < 0.005; ***p < 0.0005; ****p < 0.0001. |
The results of a two-way ANOVA indicated plasma MGO concentration was only age dependent (p < 0.0001; percentage of total variation – 40.42%), but not sex (p = 0.3198; percentage of total variation – 0.34%) or age-gender dependent (p = 0.4583; percentage of total variation – 1.61%). The concentration of MGO was significantly higher in men aged 80–100 in comparison to men aged 6–13 (p = 0.0007; ↑69%), 14–19 (p < 0.0001; ↑78%), and 40–59 (p = 0.0188; ↑49%). Moreover, this parameter was significantly increased between men aged 60–79 and those aged 6–13 (p < 0.0001; ↑79%), 14–19 (p = 0.0002; ↑88%), and 40–59 (p = 0.0019; ↑58%). MGO concentration was significantly higher also in women aged 80–100 than in those aged 6–13 (p = 0.0038; ↑61%) and aged 14–19 (p = 0.0081; ↑56%). Furthermore, the parameter was significantly increased in women aged 60–79 compared to those aged 6–13 (p < 0.0001; ↑101%), 14–19 (p < 0.0001; ↑95%), 20–39 (p < 0.0001; ↑67%), and 40–59 (p < 0.0001; ↑64%) (Figure 2B).
Two-way analysis of variance showed salivary CML concentration was age (p < 0.0001; percentage of total variation – 24.01%) and sex (p = 0.0161; percentage of total variation – 2.51%), but not interaction between age and gender dependent (p = 0.4432; percentage of total variation – 2.04%). The concentration of CML was significantly higher in men aged 80–100 compared to men aged 14–19 (p = 0.0318; ↑58%). The CML concentration was significantly increased also in women aged 80–100 than in those aged 6–13 (p < 0.0001; ↑78%), 14–19 (p < 0.0001; ↑77%), 20–39 (p = 0.0013; ↑55%), and 40–59 (p = 0.0004; ↑61%) (Figure 2C).
A two-way ANOVA indicated plasma CML concentration was only age dependent (p < 0.0001; percentage of total variation – 18.97%), but not sex (p = 0.6824; percentage of total variation – 0.079%) or age-gender dependent (p = 0.649; percentage of total variation – 1.58%). The concentration of CML was significantly higher in men aged 80–100 and aged 60–79 compared to men aged 6–13 (p = 0.0095; ↑78% and p = 0.005; ↑81%, respectively). Moreover, this parameter was significantly increased in women aged 60–79 than those aged 6–13 (p = 0.0394; ↑60%) (Figure 2D).
Two-way analysis of variance showed salivary AGE was age (p = 0.0243; percentage of total variation – 39.12%) and sex dependent (p = 0.0243; percentage of total variation – 1.71%), but not interaction between age and gender dependent (p = 0.0652; percentage of total variation – 3.52%). The concentration of AGE was significantly higher in men aged 80–100 compared to men aged 6–13 (p = 0.0001; ↑58%) and 14–19 (p = 0.0015; ↑70%). Furthermore, this parameter was significantly increased in men aged 60–79 in comparison to those aged 6–13 (p < 0.0001; ↑51%) and 14–19 (p = 0.0001; ↑62%). The concentration of AGE was significantly higher in men aged 20–39 than in men aged 14–19 (p = 0.0277; ↑44%). The AGE concentration was significantly increased in women aged 80–100 compared to those aged 6–13 (p < 0.0001; ↑83%), 14–19 (p < 0.0001; ↑74%), 20–39 (p < 0.0001; ↑47%), 40–59 (p < 0.0001; ↑59%), and 60–79 (p = 0.0103; ↑29%). The concentration of AGE was significantly higher between women aged 60–79 and those aged 6–13 (p = 0.0099; ↑42%). In addition, this parameter was significantly increased in women aged 80–100 in comparison to men aged 80–100 (p = 0.037; ↑26%) (Figure 2E).
The results a two-way ANOVA indicated plasma AGE concentration was only age dependent (p < 0.0001; percentage of total variation – 38.26%), but not sex (p = 0.4603; percentage of total variation – 0.2%) or age-gender dependent (p = 0.7569; percentage of total variation – 0.95%). The concentration of AGE was significantly increased in men aged 80–100 in comparison to men aged 6–13 (p < 0.0001; ↑107%), 14–19 (p < 0.0001; ↑110%), 20–39 (p < 0.0001; ↑96%), and 40–59 (p < 0.0001; ↑86%). Furthermore, this parameter was significantly higher in men aged 60–79 compared to those aged 6–13 (p = 0.0305; ↑61%) and 14–19 (p = 0.024; ↑63%). The concentration of AGE was significantly higher also in women aged 60–79 and those aged 6–13 (p < 0.0001; ↑108%), 14–19 (p < 0.0001; ↑102%), 20–39 (p = 0.0001; ↑84%), 40–59 (p = 0.0164; ↑51%) (Figure 2F).
Protein Carbamylation
Two-way analysis of variance showed salivary CBL concentration was age dependent (p < 0.0001; percentage of total variation – 26.94%), but not sex (p = 0.2761; percentage of total variation – 0.51%) or interaction between age and gender dependent (p = 0.6776; percentage of total variation – 1.33%). The concentration of CBL was significantly higher in men aged 80–100 and those aged 60–79 in comparison to men aged 14–19 (p = 0.0129; ↑43% and p = 0.0004; ↑53%, respectively). The CBL concentration was significantly increased between women aged 80–100 and 14–19 (p = 0.0145; ↑42%). Moreover, the parameter was significantly higher also in women aged 60–79 compared to women aged 6–13 (p = 0.0012; ↑46%), 14–19 (p < 0.0001; ↑58%), 20–39 (p = 0.0101; ↑38%), and 40–59 (p = 0.0013; ↑45%) (Figure 3A).
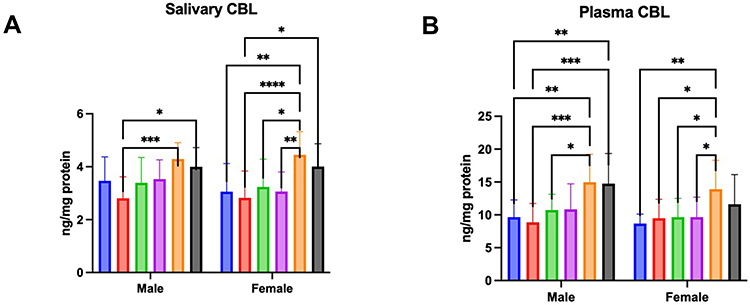 |
Figure 3 Concentration of CBL in saliva (A) and plasma (B) of males and females aged 6–13 (blue bars), 14–19 (red bars), 20–39 (green bar), 40–59 (purple bars), 60–79 (Orange bars), and 80–100 (black bars). Notes: Data are shown as mean ± SD. Differences statistically significant at: *p < 0.05; **p < 0.005; ***p < 0.0005; ****p < 0.0001. |
Two-way analysis of variance showed that salivary CML concentration was age (p < 0.0001; percentage of total variation – 25.83%) and sex dependent (p = 0.0279; percentage of total variation – 2.06%), but not interaction between age and gender dependent (p = 0.4731; percentage of total variation – 1.91%). The concentration of CBL was significantly higher in men aged 80–100 in comparison to men aged 6–13 (p = 0.0043; ↑53%) and 14–19 (p = 0.0003; ↑67%), and also between men aged 60–79 and those 6–13 (p = 0.0023; ↑55%), 14–19 (p = 0.0002; ↑69%), and 20–39 (p = 0.0433; ↑39%). Moreover, this parameter was significantly increased in women aged 60–79 compared women aged 6–13 (p = 0.0029; ↑60%), 14–19 (p = 0.0284; ↑46%), 40–59 (p = 0.0412; ↑44%), and (p = 0.0423; ↑44%) (Figure 3B).
Lipid Oxidation
Two-way analysis of variance showed that salivary 4-HNE adducts concentration was age dependent (p < 0.0001; percentage of total variation – 30.21%), but not sex (p = 0.6745; percentage of total variation – 0.072%) or interaction between age and gender dependent (p = 0.674; percentage of total variation – 1.29%). The concentration of 4-HNE was significantly higher in men aged 80–100 compared to men aged 6–13 (p = 0.0375; ↑42%), 14–19 (p < 0.0001; ↑86%), 20–39 (p = 0.0043; ↑54%), and 40–59 (p = 0.0003; ↑69%), and also between men aged 60–79 and those 14–19 (p = 0.0142; ↑23%). The parameter was significantly increased in women aged 80–100 than in those aged 6–13 (p = 0.002; ↑60%), 14–19 (p = 0.0025; ↑59%), 20–39 (p = 0.0001; ↑76%), and 40–59 (p = 0.0052; ↑55%) (Figure 4A).
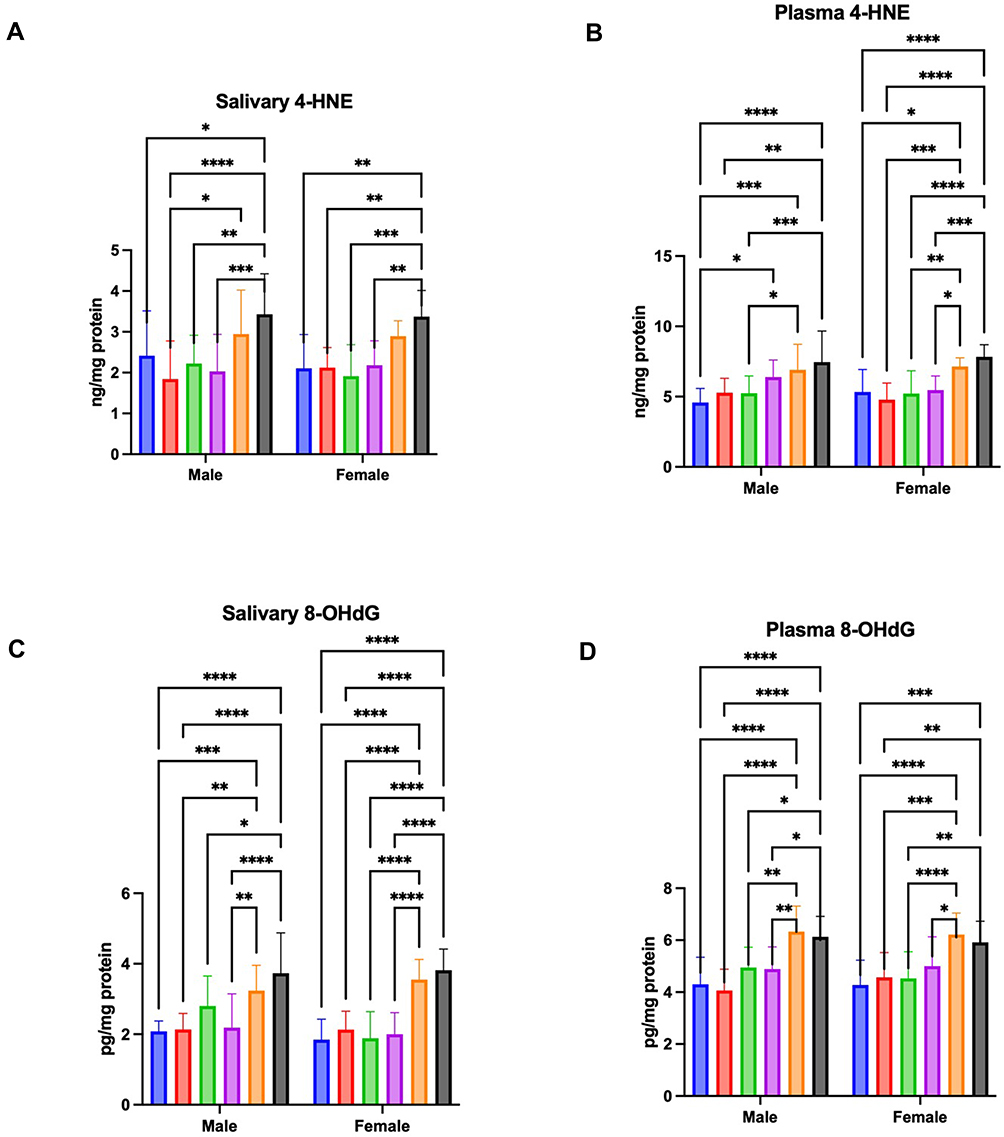 |
Figure 4 Concentration of 4-HNE in saliva (A) and plasma (B), and 8-OHdG in saliva (C) and plasma (D) of male and female aged 6–13 (blue bars), 14–19 (red bars), 20–39 (green bar), 40–59 (purple bars), 60–79 (Orange bars), and 80–100 (black bars). Notes: Data are shown as mean ± SD. Differences statistically significant at: *p < 0.05; **p < 0.005; ***p < 0.0005; ****p < 0.0001. |
The results of a two-way ANOVA indicated plasma 4-HNE adducts concentration was only age dependent (p < 0.0001; percentage of total variation – 37.41%), but not sex (p = 0.9474; percentage of total variation – 0.0016%) or age-gender dependent (p = 0.1783; percentage of total variation – 2.75%). The concentration of 4-HNE was significantly higher in men aged 80–100 in comparison to men aged 6–13 (p < 0.0001; ↑63%), 14–19 (p = 0.001; ↑41%), and 20–39 (p = 0.0008; ↑42%). Moreover, this parameter was significantly increased between men aged 60–79 and those aged 6–13 (p = 0.0003; ↑51%) and aged 20–39 (p = 0.0413; ↑32%). 4-HNE adducts concentration was significantly higher in men aged 40–59 than in those aged 6–13 (p = 0.0152; ↑19%). Furthermore, the parameter was significantly increased in women aged 80–100 compared to those aged 6–13 (p < 0.0001; ↑47%), 14–19 (p < 0.0001; ↑64%), 20–39 (p < 0.0001; ↑50%), and 40–59 (p = 0.0002; ↑43%). The concentration of 4-HNE was significantly higher also in women aged 60–100 in comparison to those aged 6–13 (p = 0.0164; ↑34%), 14–19 (p = 0.0002; ↑49%), 20–39 (p = 0.0077; ↑37%), and 40–59 (p = 0.0386; ↑31%). (Figure 4B).
DNA Oxidation
Two-way ANOWA showed salivary 8-OHdG concentration was age (p < 0.0001; percentage of total variation – 49.16%) and interaction between age and gender dependent (p = 0.0234; percentage of total variation – 3.71%), but not sex dependent (p = 0.1456; percentage of total variation – 0.59%). The concentration of 8-OHdG was significantly higher in men aged 80–100 compared to men aged 6–13 (p < 0.0001; ↑79%), 14–19 (p < 0.0001; ↑75%), 20–39 (p = 0.0194; ↑33%), and 40–59 (p < 0.0001; ↑71%). The parameter was significantly increased in men aged 60–79 than in those aged 6–13 (p = 0.0009; ↑55%), 14–19 (p = 0.0019; ↑52%), and 40–59 (p = 0.004; ↑48%). Moreover, the 8-OHdG concentration was significantly higher in women aged 80–100 compared to those aged 6–13 (p < 0.0001; ↑107%), 14–19 (p < 0.0001; ↑79%), 20–39 (p < 0.0001; ↑103%), and 40–59 (p < 0.0001; ↑91%). This parameter was significantly increased also in women aged 60–100 in comparison to those aged 6–13 (p < 0.0001; ↑92%), 14–19 (p < 0.0001; ↑67%), 20–39 (p < 0.0001; ↑89%), and 40–59 (p < 0.0001; ↑77%) (Figure 4C).
The results of a two-way ANOVA indicated plasma 8-OHdG concentration was only age dependent (p < 0.0001; percentage of total variation – 42.91%), but not sex (p = 0.8567; percentage of total variation – 0.011%) or age-gender dependent (p = 0.4903; percentage of total variation – 1.47%). The concentration of 8-OHdG was significantly higher in men aged 80–100 compared to men aged 6–13 (p < 0.0001; ↑42%), 14–19 (p < 0.0001; ↑51%), 20–39 (p = 0.027; ↑24%), and 40–59 (p = 0.0151; ↑25%). This parameter was significantly increased in men aged 60–79 than in those aged 6–13 (p < 0.0001; ↑47%), 14–19 (p < 0.0001; ↑56%), 20–39 (p = 0.0036; ↑28%), and 40–59 (p = 0.0018; ↑29%). Furthermore, the 8-OHdG concentration was significantly higher in women aged 80–100 compared to those aged 6–13 (p = 0.0001; ↑38%), 14–19 (p = 0.0048; ↑30%), and 20–39 (p = 0.0032; ↑31%). The parameter was significantly increased also in women aged 60–100 in comparison to those aged 6–13 (p < 0.0001; ↑45%), 14–19 (p = 0.0001; ↑36%), 20–39 (p < 0.0001; ↑37%), and 40–59 (p = 0.0203; ↑24%) (Figure 4D).
Correlations
Salivary protein carbonyls (r = 0.44, p < 0.0001), CML (r = 0.45, p < 0.0001), AGE (r = 0.6, p < 0.0001), CBL (r = 0.43, p < 0.0001), 4-HNE (r = 0.47, p < 0.0001), and 8-OHdG concentration (r = 0.62, p < 0.0001) was positively correlated with age. Plasma protein carbonyls (r = 0.44, p < 0.0001), MGO (r = 0.54, p < 0.0001), CML (r = 0.41, p < 0.0001), AGE (r = 0.56, p < 0.0001), CBL (r = 0.46, p < 0.0001), 4-HNE (r = 0.6, p < 0.0001), and 8-OHdG level (r = 0.62, p < 0.0001) was also positively correlated with age. However, a negative relationship between salivary (r = −0.44, p < 0.0001) and plasma (r = −0.45, p < 0.0001) total thiols concentration and age were showed.
There were positive correlations between plasma and salivary concentrations of AGE (r = 0.53, p < 0.0001), 4-HNE (r = 0.59, p < 0.0001), and 8-OHdG (r = 0.44, p < 0.0001).
Salivary CML and protein carbonyls concentrations were positively correlated (r = 0.32, p < 0.0001). Salivary 4-HNE level had positive relationship with AGE (r = 0.31, p < 0.0001) and CBL level (r = 0.34, p < 0.0001). Furthermore, a positive correlation between concentration of 8-OHdG in saliva and protein carbonyls (r = 0.34, p < 0.0001), CML (r = 0.4, p < 0.0001), AGE (r = 0.4, p < 0.0001), CBL (r = 0.36, p < 0.0001), and 4-HNE level in this material (r = 0.38, p < 0.0001) was showed.
Plasma MGO and protein carbonyls concentrations had positive correlation (r = 0.35, p < 0.0001). Plasma AGE level was negatively correlated with plasma total thiols (r = −0.35, p < 0.0001) and positively with plasma MGO level (r = 0.35, p < 0.0001). Also 4-HNE concentration in plasma showed positive relationship with plasma MGO level (r = 0.34, p < 0.0001), and with plasma CBL level (r = 0.32, p < 0.0001). Curiously enough, plasma 8-OHdG level had negative correlation with plasma total thiols concentration (r = −0.33, p < 0.0001) and positive correlation with concentration of MGO (r = 0.46, p < 0.0001), CML (r = 0.31, p < 0.0001), AGE (r = 0.45, p < 0.0001), CBL (r = 0.31, p < 0.0001), 4-HNE in plasma (r = 0.33, p < 0.0001).
The above correlations are shown in Figure 5.
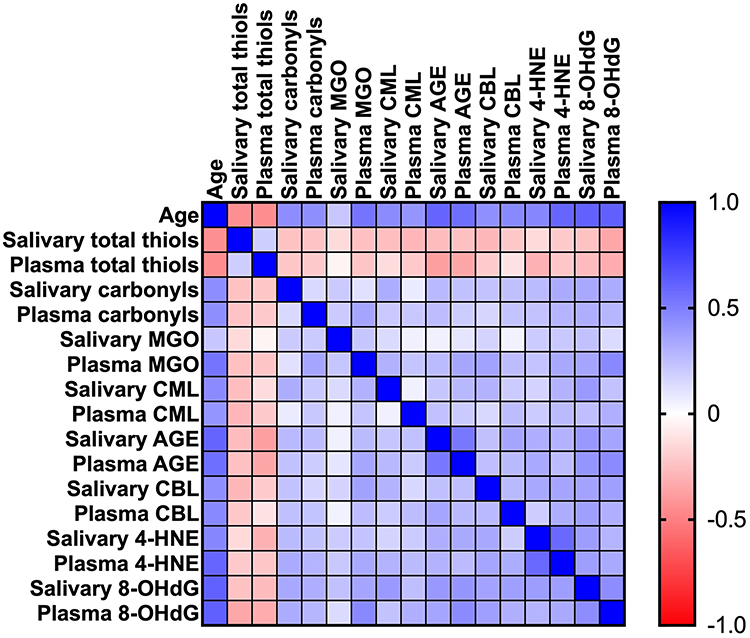 |
Figure 5 Heat map of correlations between age, salivary, and plasma concentration of oxidation, glycation, and carbamylation of proteins, lipids, and DNA. Abbreviations: AGE, advanced glycation end products; CBL, carbamyl-lysine; CML, Nε-(carboxymethyl) lysine; MGO, methylglyoxal adducts; 4-HNE, 4-hydroxynonenal protein adducts; 8-OHdG, 8-hydroxy-2’-deoxyguanosine. |
The Multivariate Linear Regression Model
All analyzed salivary and plasma parameters depend on age. Moreover, CML and AGE levels in saliva and CBL concentration in plasma are affected by sex (Table 3).
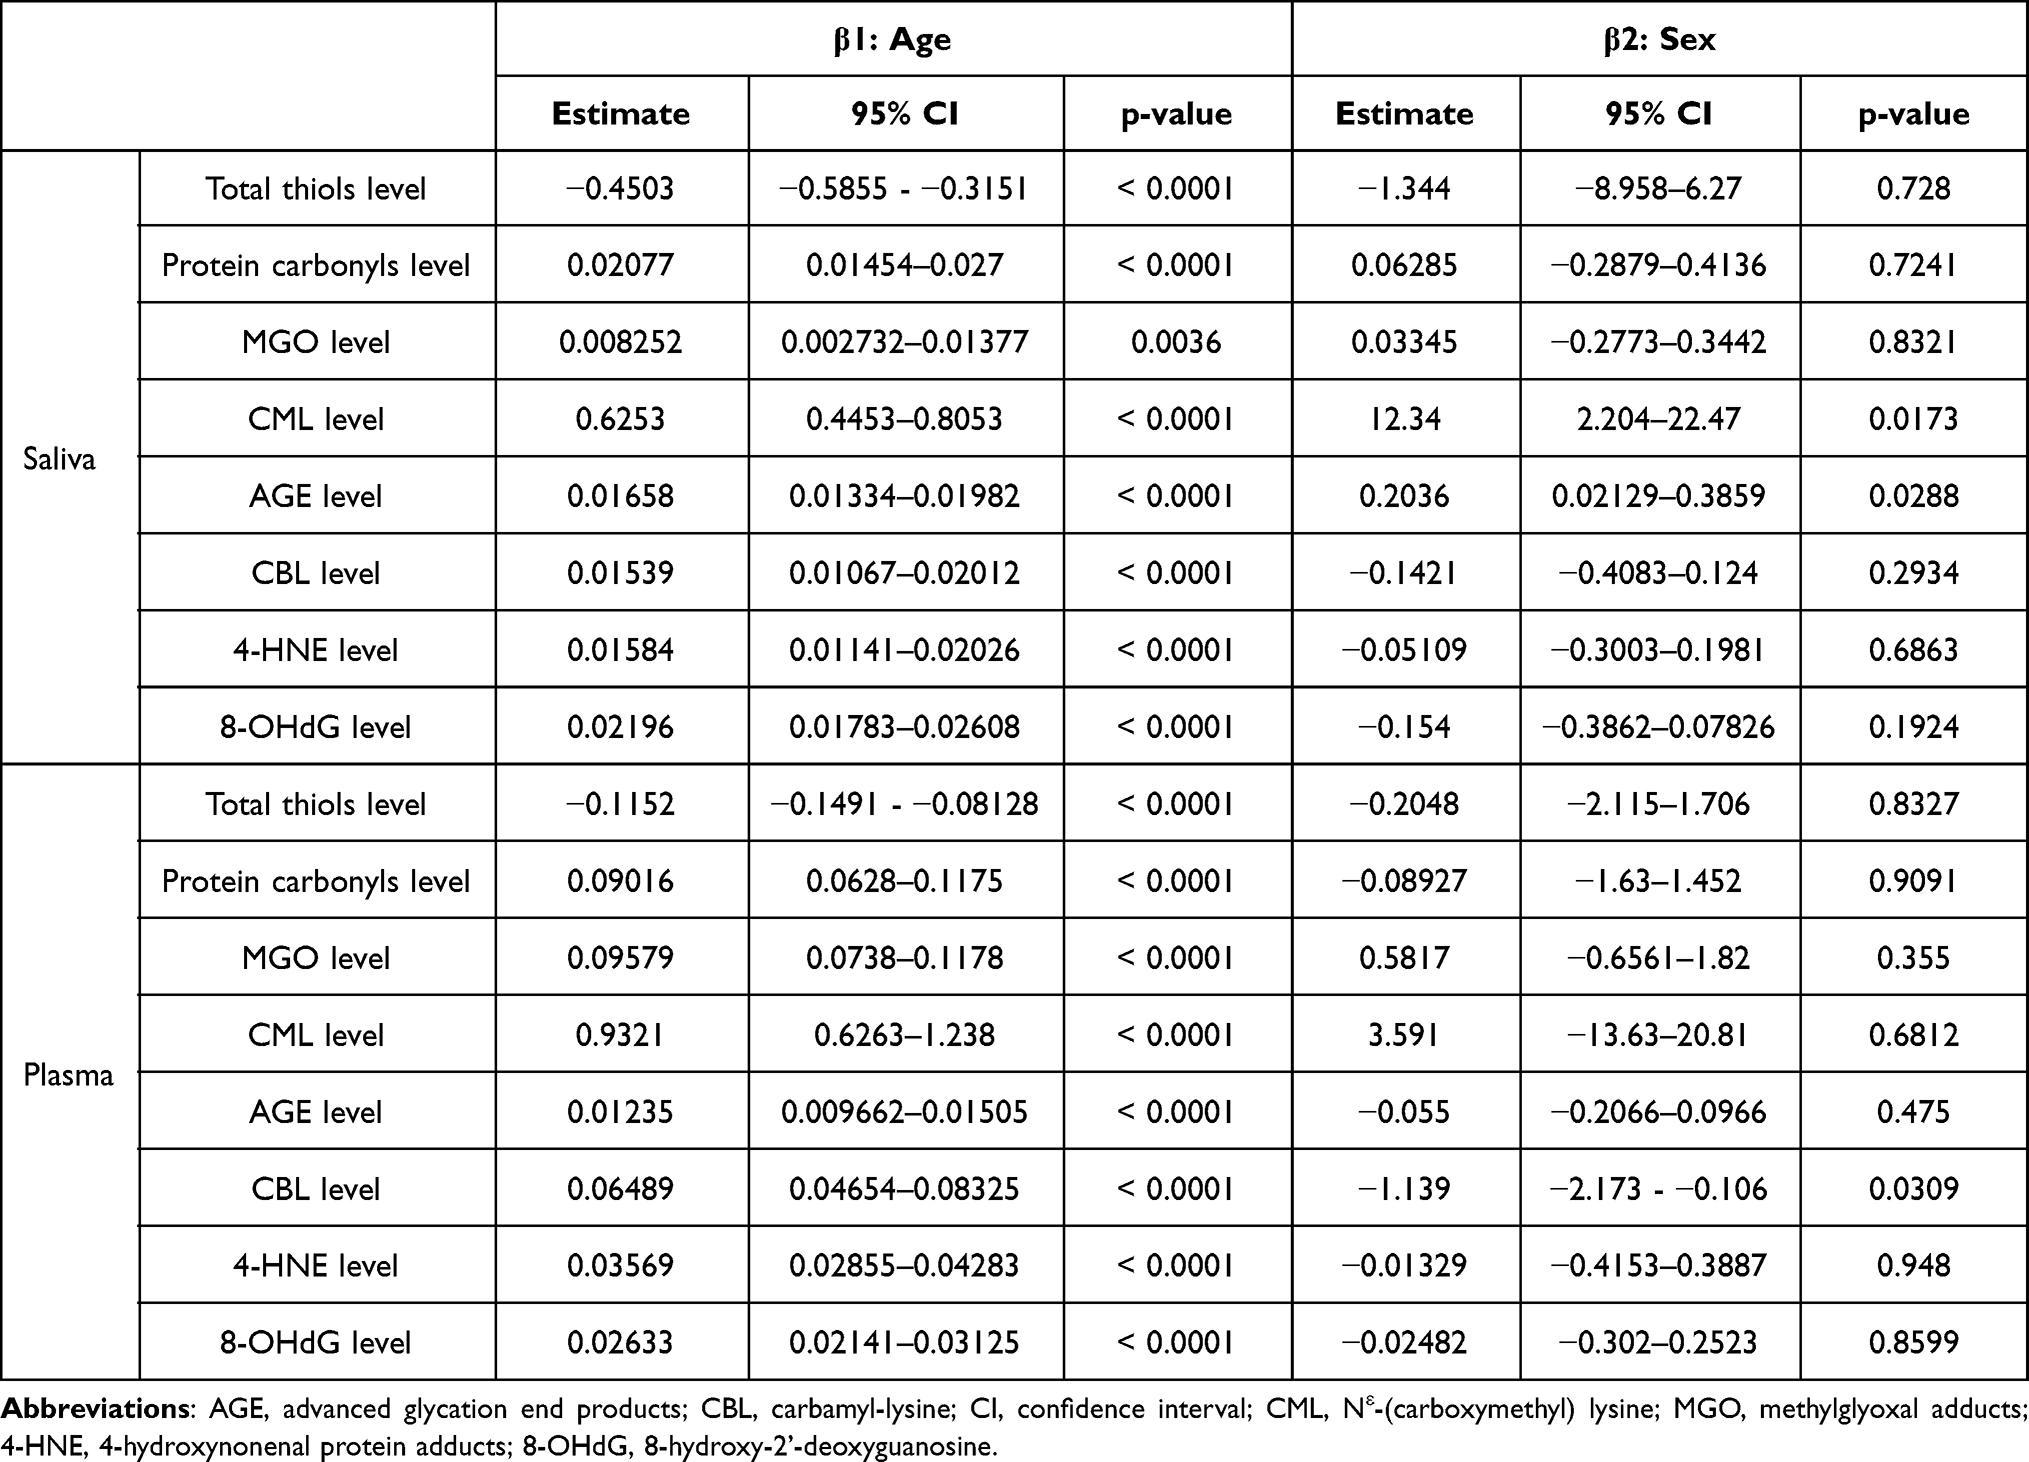 |
Table 3 Multiple Regression Analysis of Oxidation, Glycation, and Carbamylation of Salivary and Plasma Proteins, Lipids, and DNA |
ROC Analysis
Results of ROC analysis are shown in Table 4. All measured parameters in saliva except for MGO level and all parameters in plasma were significantly different between people under 15 years old and people 65 years and older. Statistically significant differences between working-age and elderly patients were presented by the concentration of total thiols in saliva and AGE, 4-HNE and 8-OHdG levels in saliva and plasma.
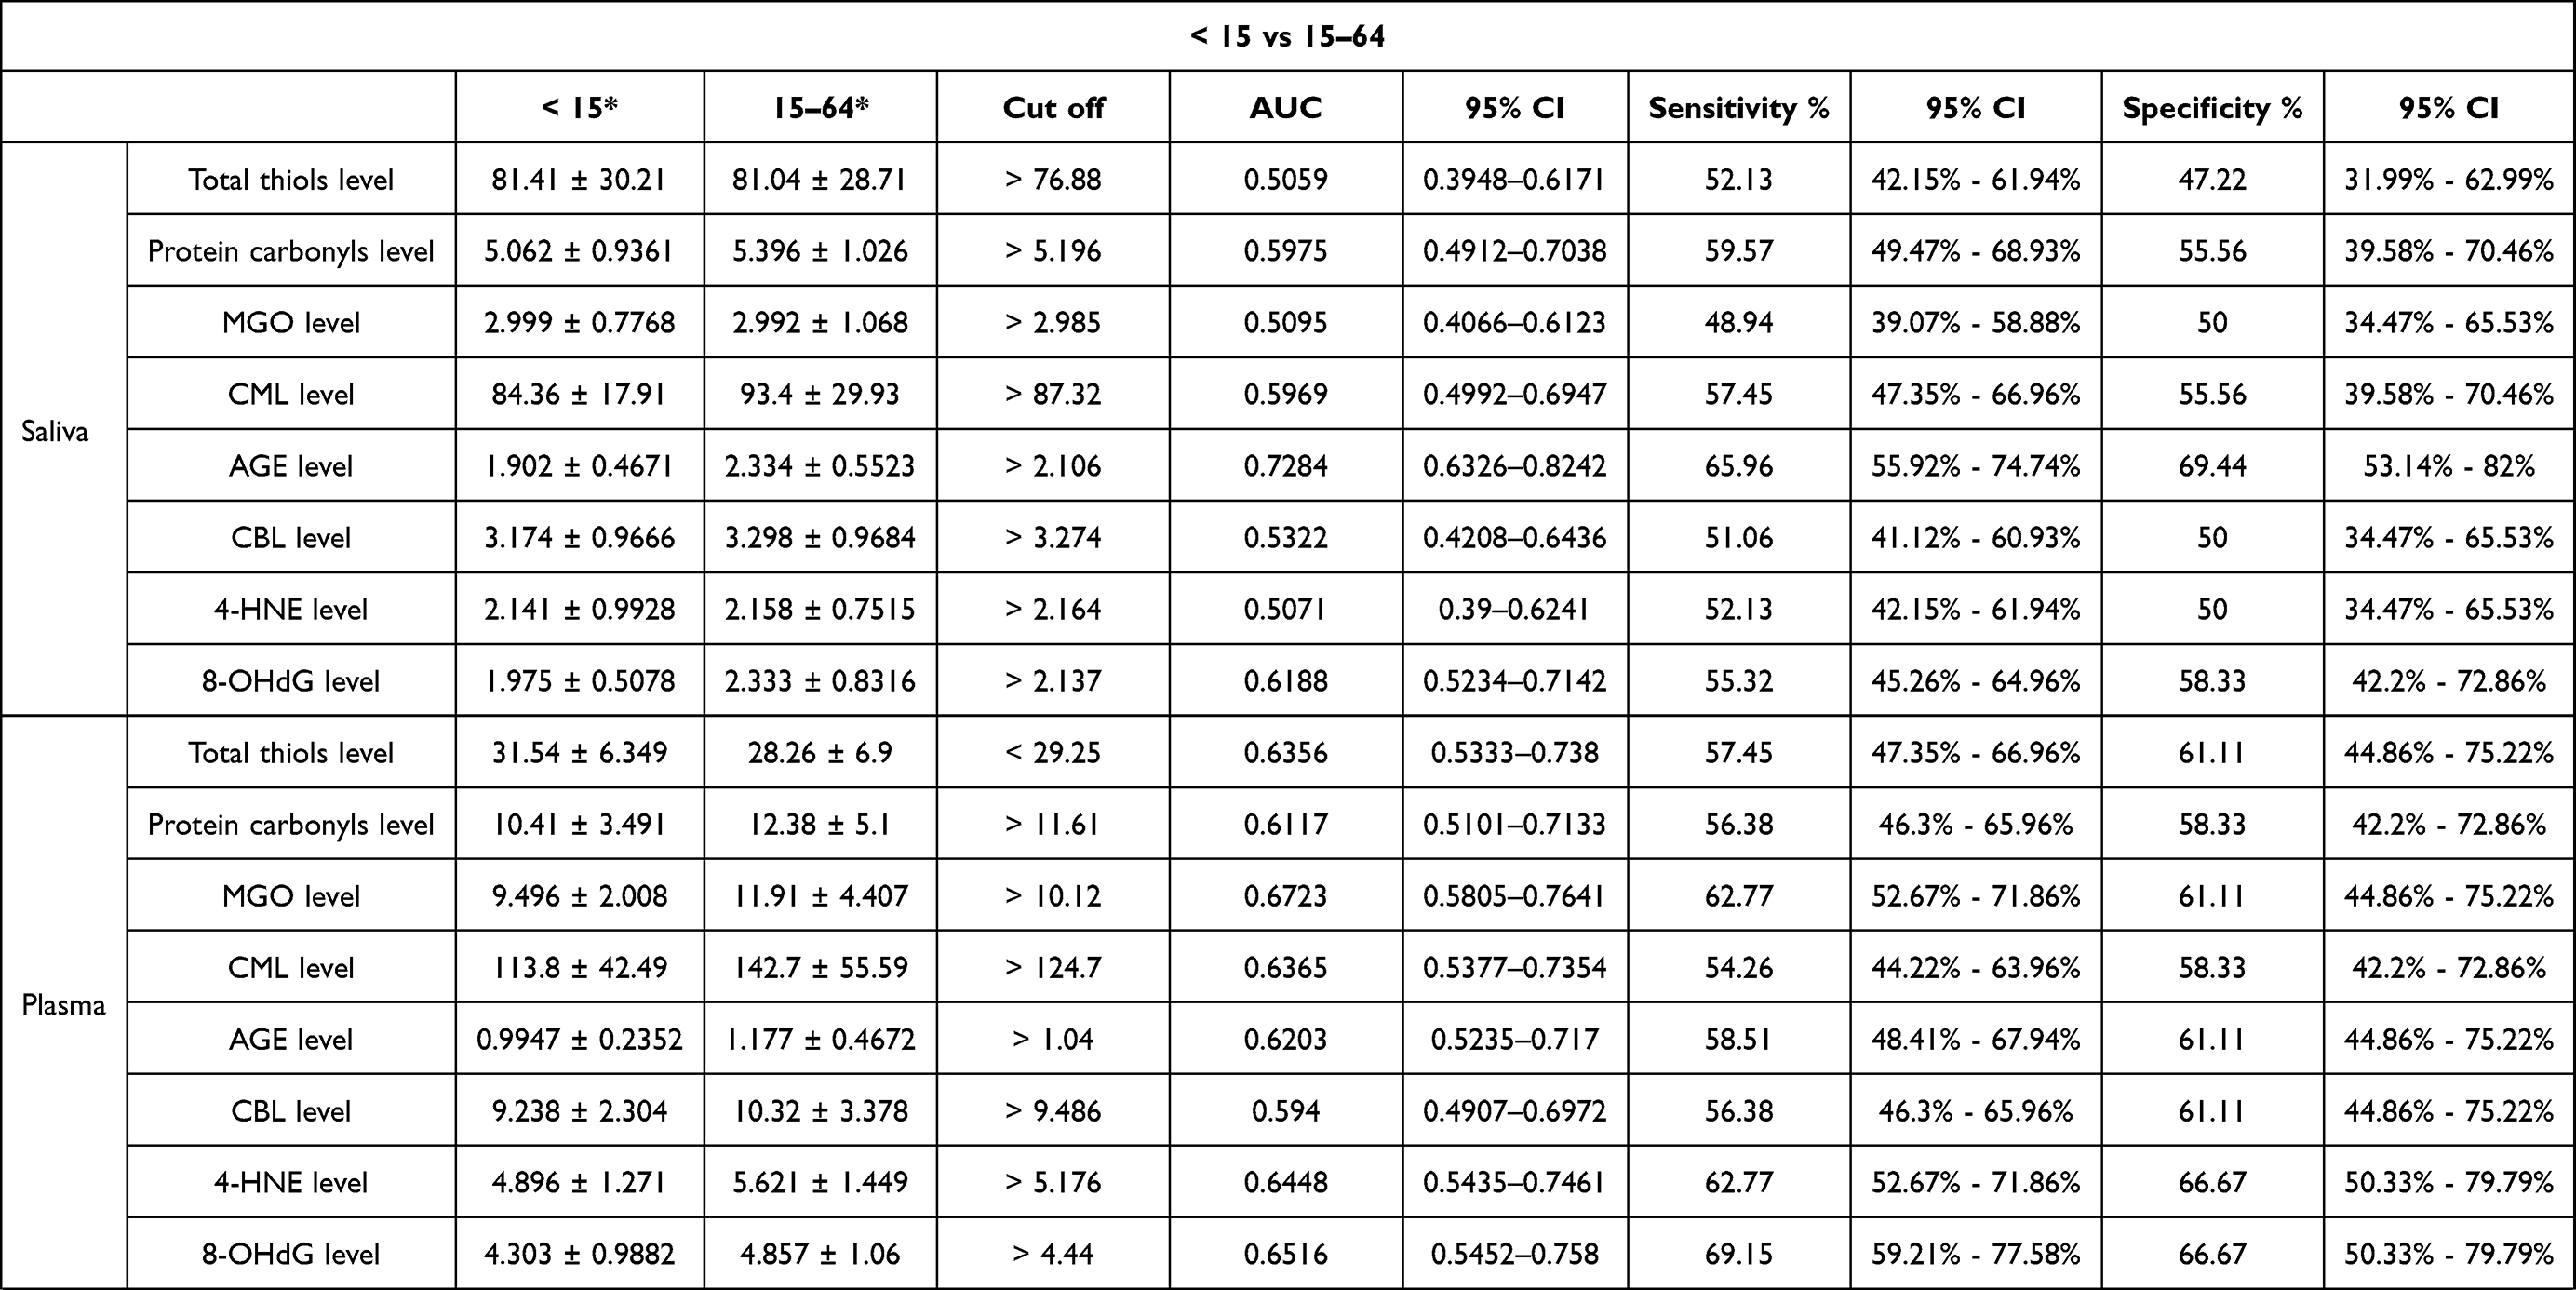 | 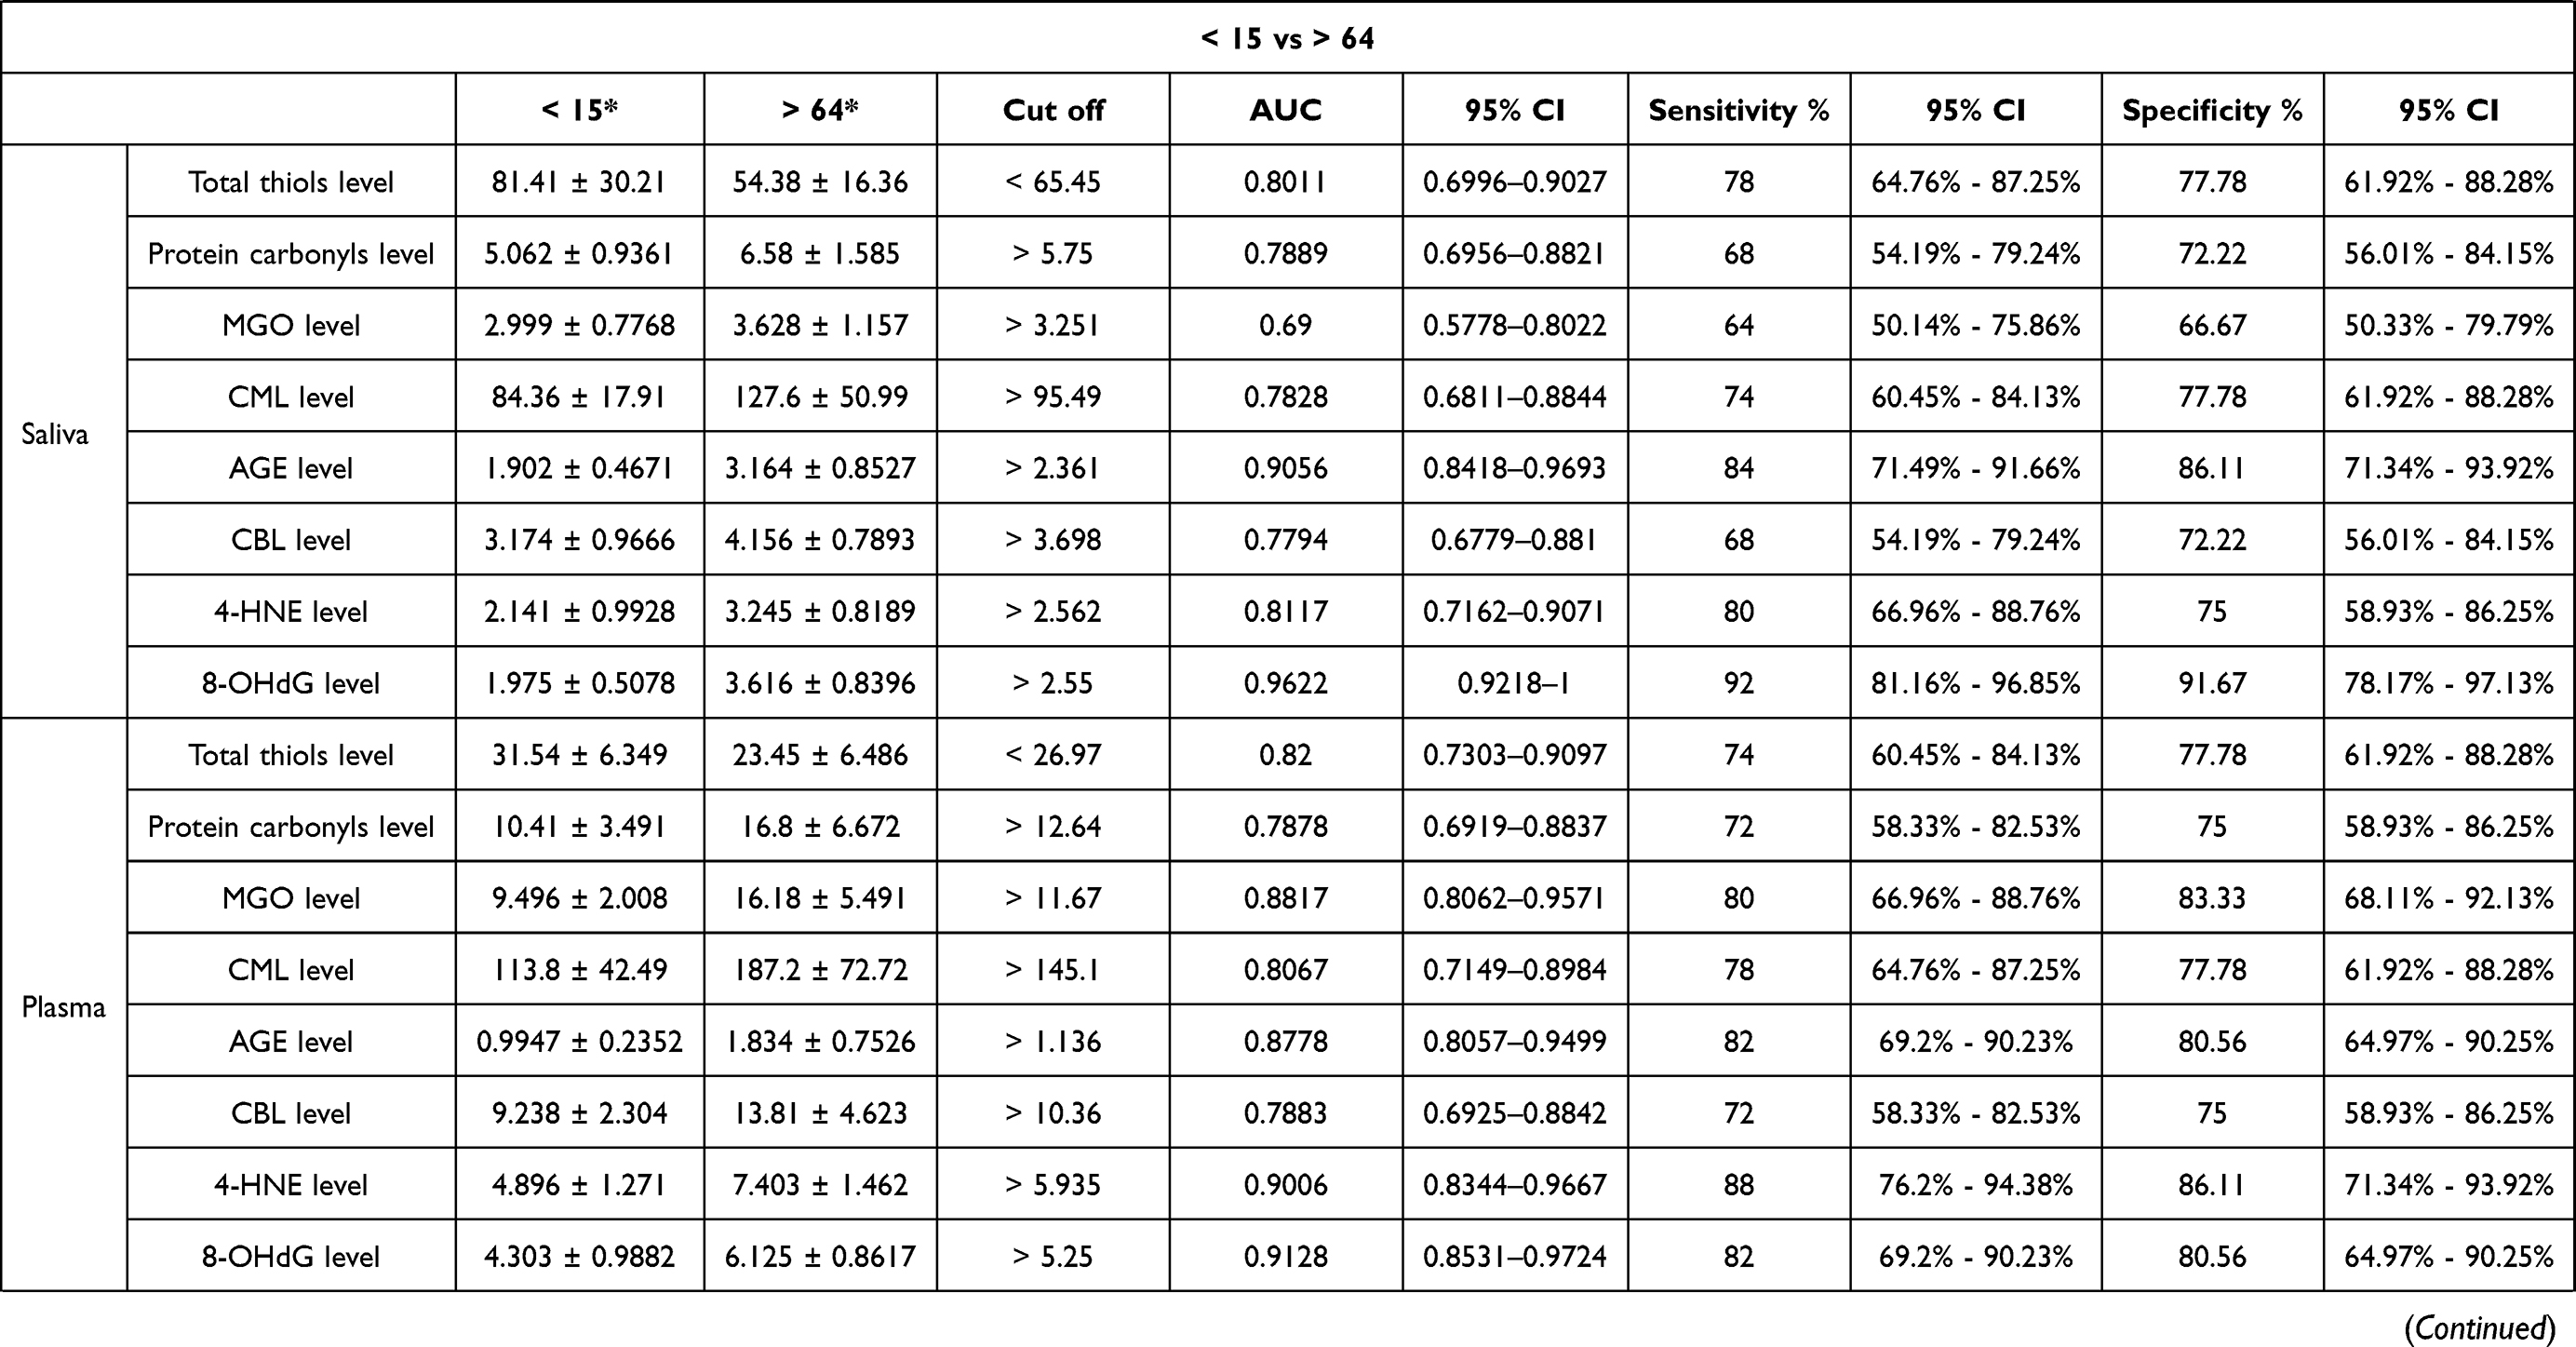 | 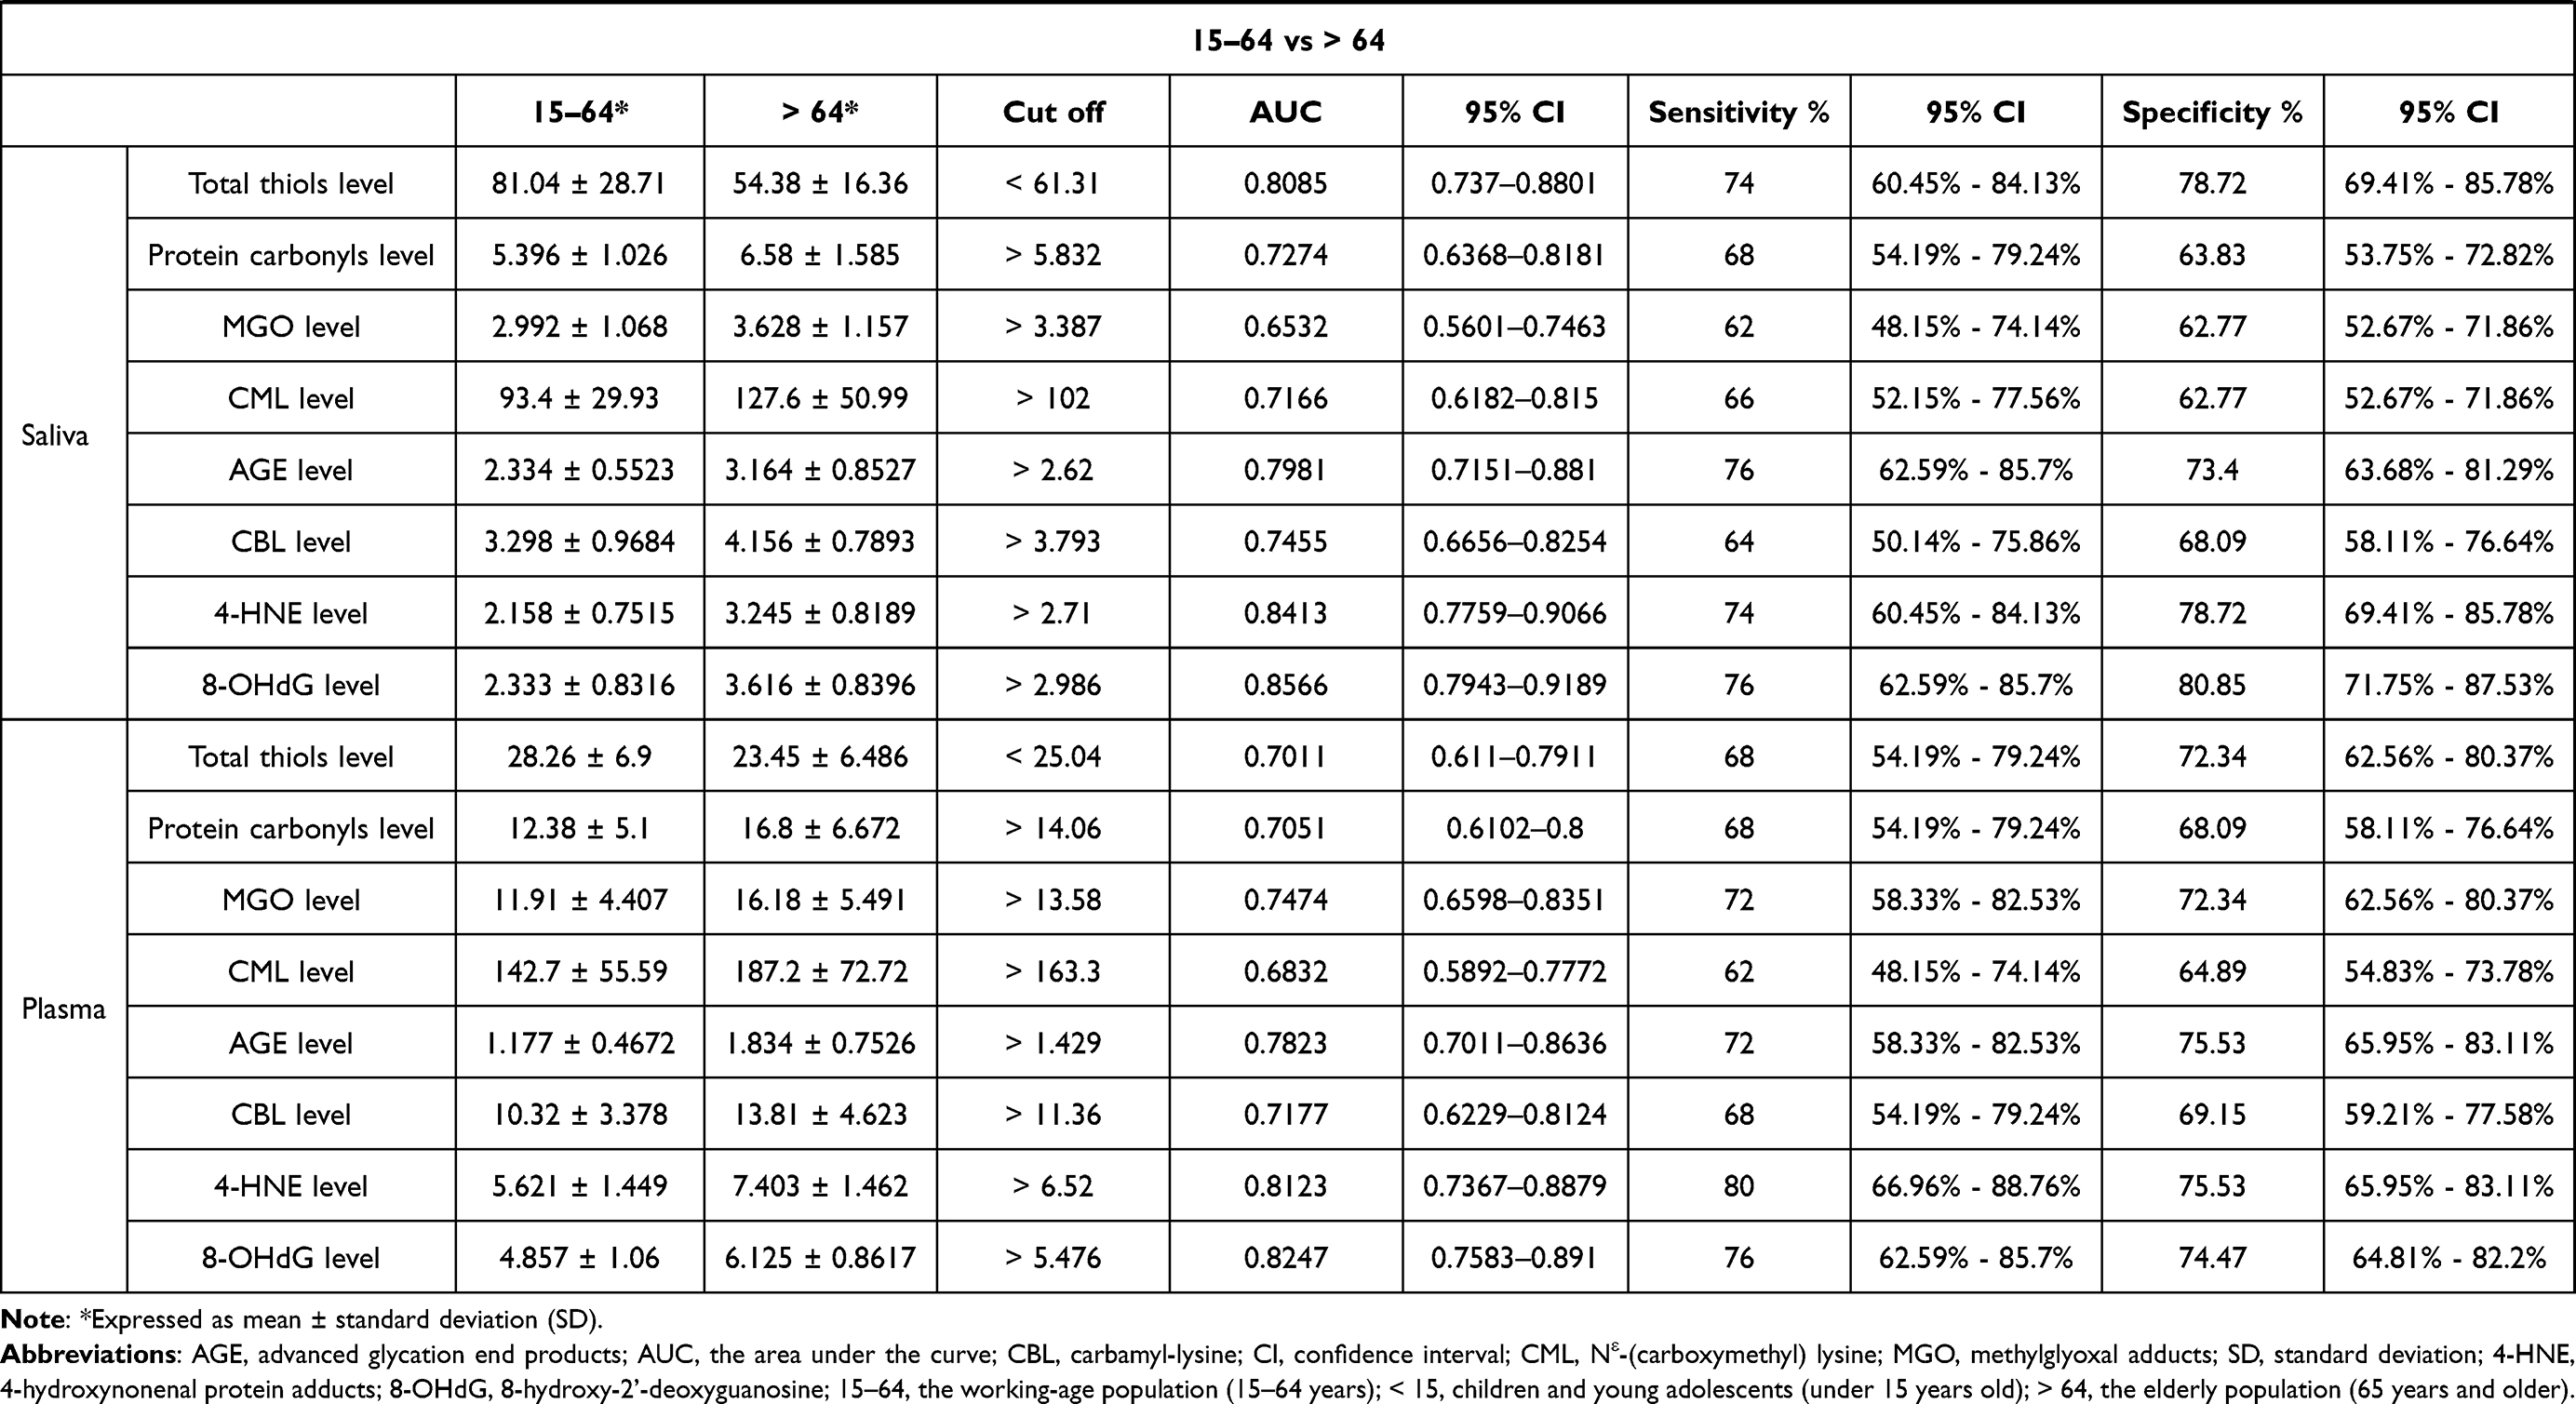 |
Table 4 ROC Analysis of Oxidation, Glycation, and Carbamylation of Salivary and Plasma Proteins, Lipids, and DNA Between Children and Adolescents (Under 15 Years Old), the Working-Age Population (15–64 Years), and the Older People (65 Years and Older) |
To summarize, AGE and 8-OHdG level concentrations are of particular diagnostic utility. Patients under 15 years old and aged 65 years and older were differentiated with high sensitivity and specificity by the level of AGE in saliva (84% and 86%) as well as in plasma (82% and 81%, respectively). Salivary AGE concentration also differentiated people in the range 15–64 years old and these 65 years and older with 76% sensitivity and 73% specificity and plasma AGE concentration – with 72% and 76%, respectively. Moreover, patients under 15 years old and aged 65 years and older were differentiated with high sensitivity and specificity by the level of AGE in saliva (84% and 86%) and plasma (82% and 81%, respectively). Children, young adolescents, and the elderly were differentiated with high sensitivity and specificity by the concentration of 8-OHdG in saliva (92% and 92%) and plasma (82% and 81%, respectively). Additionally, salivary 8-OHdG concentration differentiated the working-age and elderly populations with 76% sensitivity and 81% specificity and plasma AGE concentration – with 76% and 74%, respectively (Table 4).
Discussion
Aging is inextricably linked to oxidative and carbonyl stress.13,16,47 The presented results confirm previous observations that plasma proteins’ oxidation, glycation, and carbamylation significantly increase with age.11,48–51 This is not surprising since, in the elderly, there is a higher production of ROS via mitochondrial dysfunction and NOX overexpression, disturbances in the antioxidant enzymes/nonenzymatic free radical scavengers, but also decreased proteasome activity and protein repair mechanisms.52 Several studies have shown that enhanced protein carbonylation can cause and affect many age-related disorders such as Alzheimer’s disease, Parkinson’s disease, amyotrophic lateral sclerosis, diabetes, and cancer.5,12,17,19,48,53–55,60 The consequences of oxidative/glycative damage to proteins include changes in gene expression, molecular heterogeneity, disrupted intercellular communication, as well as increased susceptibility to environmental stress.5,6,12,17,19,48,53–55 However, it is unknown whether increased protein oxidation/glycation can be observed in other biofluids. Nowadays, special attention is paid to non-invasive sample collection, reducing patient anxiety and contributing to more frequent health monitoring. Among all bioliquids, saliva provides particular diagnostic advantages. These include inexpensive, painless, and stress-free collection in elderly and disabled patients.24,32–35
To our knowledge, we are the first to show that modifications of salivary proteins increase with age, which manifests as reduced total thiol levels and elevated carbonyl groups and glycation (↑CML, ↑AGE)/carbamylation (↑CBL) protein products. Although these compounds can be produced in the salivary glands, they can also enter the oral cavity via intracellular or extracellular routes.000 The first involves passive (diffusion and filtration) or specific transport (facilitated diffusion, pinocytosis, and active transport), while the extracellular pathway – ultrafiltration and transport across damaged cell membranes.33,56,57 Highly permeable salivary glands are surrounded by numerous capillaries and blood, allowing biomarkers in the bloodstream to penetrate the acini and ultimately be secreted into saliva. The highest fraction of biomolecules found in saliva ranges from 20 to 40 kDa, allowing the determination of glycated and carbamylated proteins in this biological fluid.24,25 It is believed that, in older individuals, exudation plays a vital role in the passage of proteins and other macromolecules into saliva.36–38 However, saliva is the filtrate from the salivary glands and the crevicular fluid from the gums and exudates from the oral mucosa. In older individuals, senile periodontal atrophy is observed, manifested by uniform alveolar bone loss and gingival recession promoting the passage of several substances from the blood into saliva.28,29 Enhanced damage to membrane lipids and thus enhanced permeability of oral cell membranes may be evidenced by an increase in salivary 4-HNE, one of the major indicators of salivary lipoperoxidation. Therefore, saliva is a particularly attractive diagnostic material for assessing aging. Although salivary MGO concentrations were not statistically different, the protein glycation products (↑CML, ↑AGE) were significantly higher in the elderly than in middle-aged and young subjects. Unlike early glycation products like Schiff bases and fructosamine, CML and AGE are highly immunogenic and thus are recognized by membrane receptors of macrophages, neurons, hepatocytes, cardiomyocytes, and adipocytes. AGE binding to the RAGE receptor not only triggers the pro-inflammatory NF-κB signaling but also enhances aldose reductase activity and increases the expression of adhesion molecules (↑ICAM, ↑VCAM). Under these conditions, NOX and cyclooxygenases (COX) are up-regulated, and secretion of pro-inflammatory factors is increased (↑IL-1, ↑IL-6, and ↑TNF-α).11,13–15 Importantly, nonenzymatic glycosylation is particularly detrimental to proteins with a long metabolic turnover, such as extracellular matrix proteins (eg, collagens, proteoglycans, or lens crystallin).8,9,58,59 It was shown that AGE induce cross-linking, conformational changes, and decreased resistance to proteolytic degradation, which promotes the accumulation of modified proteins in tissues.8,9,58,59 In the presented study, salivary AGE significantly correlated with their plasma concentrations. Therefore, saliva may be an alternative to blood for assessing the severity of protein glycation. However, it should be remembered that circulating AGE reflects mainly modifications of proteins with a short half-life, such as albumins, transferrins, and mucins. Therefore, AGE assessment in saliva may indirectly suggest interactions between circulating proteins, eg, in enzyme-substrate responses.24,35,58 Interestingly, recent studies indicate that many brain biomarkers correlate more strongly with saliva than blood or urine. The proximity of the brain and salivary glands and the specific vascularization may cause the products of neuronal metabolism to be found in higher concentrations in saliva.33,60–67 The brain is particularly vulnerable to oxidative and carbonyl stress since it consumes more oxygen than other organs and has less activity of antioxidant enzymes and a high content of transition metal ions.68–70 Although our study does not support this, saliva can provide a non-invasive assessment of brain aging. Increased deposition of protein glycoxidation products was found in the brains of patients with Alzheimer’s disease and Parkinson’s disease.8,38,67,71–74 Thus, further studies are needed on the use of saliva to evaluate the aging of the central nervous system.
The presented study also showed an age-related increase in protein carbamylation (↑CBL in both saliva and plasma of elderly patients). Carbamylation is the nonenzymatic attachment of isocyanic acid to free functional groups of proteins and amino acids.51,75 Although isocyanic acid is one of the metabolites of urea, its higher production also occurs through an increase in myeloperoxidase (MPO) activity catalyzing the oxidation of thiocyanate to hypochlorous acid. Since all patients in the present study had a normal renal function, higher CBL concentrations may confirm the involvement of inflammation in aging progression.76
Another theory of aging suggests that this process results from irreversible DNA damage within the telomeric and non-telomeric sequences of the genome.77–80 Therefore, it is not surprising that we observed a significant increase in 8-OHdG concentrations in both plasma and saliva of elderly subjects. Salivary 8-OHdG levels correlated positively with its blood concentrations, which supports the applicability of saliva to assess DNA oxidation during aging. The most common DNA injuries involve mitochondrial DNA (mtDNA), which is favored by close proximity to the ROS-producing respiratory chain.81–83 Oxidative DNA damages are also a critical factor responsible for tumor induction, proliferation, and malignancy.5,6,84–86 Unfortunately, salivary 8-OHdG may be of limited diagnostic value since its level is significantly increased in oral diseases, including periodontitis.32,87,88
Nowadays, biomarkers of aging are continually being sought.89,90 A growing number of diseases are associated with premature aging, including progeroid genetic syndromes, Alzheimer’s disease, Parkinson’s disease, arteriosclerosis, or diabetes mellitus.71,72,91–99 Although people age at different speeds, measuring the biological rate of aging is extremely difficult. Metric age does not reflect the actual rate of aging as it can be affected by various environmental, lifestyle, and daily stressors.100 Thus, information about accelerated aging could result in changes in diet, physical activity, and nutritional supplementation. To our knowledge, the presented study is the first to demonstrate the potential utility of saliva in the non-invasive assessment of aging. In detail, a two-way analysis of variance showed that the concentrations of salivary biomarkers were age-dependent but not sex-dependent. We also evaluated the effects of age and sex using multifactorial regression analysis, which confirmed our previous reports. Additionally, we have shown that salivary AGE and 8-OHdG have the greatest diagnostic utility. In the regression model, they are a predictor of aging because their salivary content increases with age. In the ROC analysis, we showed that salivary AGE and 8-OHdG significantly differentiate children and adolescents (under 15 years old) from the working-age population (15–64 years) and the older people (65 years and older). These biomarkers are characterized by high sensitivity and specificity and correlate positively with their blood levels. Moreover, salivary AGE and 8-OHdG are measured by readily available and validated methods. The use of saliva provides a non-invasive and stress-free sample collection. This biofluid has more extended stability than blood, urine, or cerebrospinal fluid.24,32–35
The present work has numerous limitations. Although further studies on more significant numbers of subjects are needed, it should be noted that smoking, periodontal disease, and caries may reduce the diagnostic utility of salivary biomarkers to the assessment of the aging process.32,87,88 The proposed biomarkers do not distinguish between biological and chronological age and are not very specific since they may also indicate other diseases with oxidative stress etiology. In addition, reference values for salivary and plasma redox biomarkers are still lacking, and a standardized/uniform saliva collection protocol is needed. With age, there is also a 40–50% reduction in the volume of the secretory follicles of the salivary glands, which significantly decreases saliva production.101,102 The oral cavity is the only place in the body exposed to many pro-oxidant and pro-inflammatory factors. These include air pollution, food, smoking, alcohol, other xenobiotics, and dental procedures and materials. All of them can also exacerbate oxidative/glycative damage to saliva.103–105
Conclusions
In conclusion, aging leads to increased oxidation, carbonylation, glycation, and carbamylation of salivary proteins, as well as intense oxidative damage to salivary lipids and DNA. Salivary biomarkers of oxidative and carbonyl stress were age-dependent but not sex-dependent. Salivary AGE and 8-OHdG reflect their blood levels and may be potential non-invasive biomarkers of aging. Further research is needed on the use of saliva to evaluate organ-specific senescence.
Data Sharing Statement
The original contributions presented in the study are included in the article. Further inquiries can be directed to the corresponding author.
Ethics Statement
The studies involving human participants were reviewed and approved by the Bioethics Committee of the Medical University of Bialystok (permission code R-I-002/62/2016 and R-I-002/43/2018). Written informed consent to participate in this study was provided by the participants.
Acknowledgment
We thank Dr. Sara Zięba for her assistance in collecting material for the study.
Funding
This work was granted by the Medical University of Bialystok, Poland (grant number: SUB/1/DN/21/002/3330).
Disclosure
The authors declare no conflicts of interest for this work.
References
1. Davalli P, Mitic T, Caporali A, Lauriola A, D’Arca D. ROS, Cell Senescence, and Novel Molecular Mechanisms in Aging and Age-Related Diseases. Oxid Med Cell Longev. 2016;2016:1–18. doi:10.1155/2016/3565127
2. El Assar M, Angulo J, Rodríguez-Mañas L. Oxidative stress and vascular inflammation in aging. Free Radic Biol Med. 2013;65:380–401. doi:10.1016/j.freeradbiomed.2013.07.003
3. Guo Z, Wang G, Wu B, et al. DCAF1 regulates Treg senescence via the ROS axis during immunological aging. J Clin Invest. 2020;130(11):5893–5908. doi:10.1172/JCI136466
4. Annesley SJ, Fisher PR. Mitochondria in Health and Disease. Cells. 2019;8(7):680. doi:10.3390/cells8070680
5. Cordani M, Donadelli M, Strippoli R, Bazhin AV, Sánchez-álvarez M. Interplay between ROS and Autophagy in Cancer and Aging: from Molecular Mechanisms to Novel Therapeutic Approaches. Oxid Med Cell Longev. 2019;2019:1–3. doi:10.1155/2019/8794612
6. Kudryavtseva AV, Krasnov GS, Dmitriev AA, et al. Mitochondrial dysfunction and oxidative stress in aging and cancer. Oncotarget. 2016;7(29):44879–44905. doi:10.18632/oncotarget.9821
7. Baranov S, Baranova E. Aging and Ambiguous ROS. System Genetics Analysis. Curr Aging Sci. 2017;10(1):6–11. doi:10.2174/1874609809666160921114504
8. Gella A, Durany N. Oxidative stress in Alzheimer disease. Cell Adh Migr. 2009;3(1):88–93. doi:10.4161/cam.3.1.7402
9. Ahmad S, Khan MS, Akhter F, et al. Glycoxidation of biological macromolecules: a critical approach to halt the menace of glycation. Glycobiology. 2014;24(11):979–990. doi:10.1093/glycob/cwu057
10. Yang K, Wang XQ, He YS, et al. Advanced glycation end products induce chemokine/cytokine production via activation of p38 pathway and inhibit proliferation and migration of bone marrow mesenchymal stem cells. Cardiovasc Diabetol. 2010;9(1):66. doi:10.1186/1475-2840-9-66
11. Moldogazieva NT, Mokhosoev IM, Melnikova TI, Porozov YB, Terentiev AA. Oxidative Stress and Advanced Lipoxidation and Glycation End Products (ALEs and AGEs) in Aging and Age-Related Diseases. Oxid Med Cell Longev. 2019;2019:1–14. doi:10.1155/2019/3085756
12. Yuan T, Yang T, Chen H, et al. New insights into oxidative stress and inflammation during diabetes mellitus-accelerated atherosclerosis. Redox Biol. 2019;20:247–260. doi:10.1016/j.redox.2018.09.025
13. Shen C-Y, Lu C-H, Wu C-H, et al. The Development of Maillard Reaction, and Advanced Glycation End Product (AGE)-Receptor for AGE (RAGE) Signaling Inhibitors as Novel Therapeutic Strategies for Patients with AGE-Related Diseases. Molecules. 2020;25(23):5591. doi:10.3390/molecules25235591
14. Yamagishi S, Matsui T, Ishibashi Y, et al. Phytochemicals Against Advanced Glycation End Products (AGEs) and the Receptor System. Curr Pharm Des. 2017;23(8):1135–1141. doi:10.2174/1381612822666161021155502
15. Omolaoye TS, du Plessis SS. Male infertility: a proximate look at the advanced glycation end products. Reprod Toxicol. 2020;93:169–177. doi:10.1016/j.reprotox.2020.02.002
16. Saeed M, Kausar MA, Singh R, Siddiqui AJ, Akhter A. The Role of Glyoxalase in Glycation and Carbonyl Stress Induced Metabolic Disorders. Curr Protein Pept Sci. 2020;21(9):846–859. doi:10.2174/1389203721666200505101734
17. Chawla A, Chawla R, Jaggi S. Microvasular and macrovascular complications in diabetes mellitus: distinct or continuum? Indian J Endocrinol Metab. 2016;20(4):546. doi:10.4103/2230-8210.183480
18. Chen J, Tan W. Platelet activation and immune response in diabetic microangiopathy. Clin Chim Acta. 2020;507:242–247. doi:10.1016/j.cca.2020.04.042
19. Madonna R, Balistreri CR, Geng Y-J, De Caterina R. Diabetic microangiopathy: pathogenetic insights and novel therapeutic approaches. Vascul Pharmacol. 2017;90:1–7. doi:10.1016/j.vph.2017.01.004
20. Nedić O, Rattan SIS, Grune T, Trougakos IP. Molecular effects of advanced glycation end products on cell signalling pathways, ageing and pathophysiology. Free Radic Res. 2013;47(sup1):28–38. doi:10.3109/10715762.2013.806798
21. Filošević Vujnović A, Jović K, Pištan E, Andretić Waldowski R. Influence of Dopamine on Fluorescent Advanced Glycation End Products Formation Using Drosophila melanogaster. Biomolecules. 2021;11(3):453. doi:10.3390/biom11030453
22. Desai KM, Chang T, Wang H, et al. Oxidative stress and aging: is methylglyoxal the hidden enemy?This review is one of a selection of papers published in a Special Issue on Oxidative Stress in Health and Disease. Can J Physiol Pharmacol. 2010;88(3):273–284. doi:10.1139/Y10-001
23. Bejarano E, Taylor A. Too sweet: problems of protein glycation in the eye. Exp Eye Res. 2019;178:255–262. doi:10.1016/j.exer.2018.08.017
24. Zhang C-Z, Cheng X-Q, Li J-Y, et al. Saliva in the diagnosis of diseases. Int J Oral Sci. 2016;8(3):133–137. doi:10.1038/ijos.2016.38
25. Maciejczyk M, Bielas M, Zalewska A, Gerreth K. Salivary Biomarkers of Oxidative Stress and Inflammation in Stroke Patients: from Basic Research to Clinical Practice. Oxid Med Cell Longev. 2021;2021:5545330. doi:10.1155/2021/5545330
26. Pereira JAM, Porto-Figueira P, Taware R, Sukul P, Rapole S, Câmara JS. Unravelling the Potential of Salivary Volatile Metabolites in Oral Diseases. A Review. Molecules. 2020;25(13):3098. doi:10.3390/molecules25133098
27. Carpenter GH. The Secretion, Components, and Properties of Saliva. Annu Rev Food Sci Technol. 2013;4(1):267–276. doi:10.1146/annurev-food-030212-182700
28. Porcheri C, Mitsiadis TA. Physiology, Pathology and Regeneration of Salivary Glands. Cells. 2019;8(9):976. doi:10.3390/cells8090976
29. Proctor GB. The physiology of salivary secretion. Periodontol. 2016;70(1):11–25. doi:10.1111/prd.12116
30. Matczuk J, Żendzian-piotrowska M, Maciejczyk M, Kurek K. Salivary lipids: a review. Adv Clin Exp Med. 2017;26(6):1023–1031. doi:10.17219/acem/63030
31. Kaneko C, Kobayashi T, Ito S, et al. Circulating levels of carbamylated protein and neutrophil extracellular traps are associated with periodontitis severity in patients with rheumatoid arthritis: a pilot case-control study. PLoS One. 2018;13(2):e0192365–e0192365. doi:10.1371/journal.pone.0192365
32. Yoshizawa JM, Schafer CA, Schafer JJ, Farrell JJ, Paster BJ, Wong DTW. Salivary biomarkers: toward future clinical and diagnostic utilities. Clin Microbiol Rev. 2013;26(4):781–791. doi:10.1128/CMR.00021-13
33. Malathi N, Mythili S, Vasanthi HR. Salivary Diagnostics: a Brief Review. ISRN Dent. 2014;2014:1–8. doi:10.1155/2014/158786
34. Pfaffe T, Cooper-White J, Beyerlein P, Kostner K, Punyadeera C. Diagnostic potential of saliva: current state and future applications. Clin Chem. 2011;57(5):675–687. doi:10.1373/clinchem.2010.153767
35. Pesce MA, Spitalnik SL. Saliva and the Clinical Pathology Laboratory. Ann N Y Acad Sci. 2007;1098(1):192–199. doi:10.1196/annals.1384.032
36. Maciejczyk M, Zalewska A, Ładny JR. Salivary Antioxidant Barrier, Redox Status, and Oxidative Damage to Proteins and Lipids in Healthy Children, Adults, and the Elderly. Oxid Med Cell Longev. 2019;2019:1–12. doi:10.1155/2019/4393460
37. Choromańska M, Klimiuk A, Kostecka-Sochoń P, et al. Antioxidant defence, oxidative stress and oxidative damage in saliva, plasma and erythrocytes of dementia patients. Can salivary AGE be a marker of dementia? Int J Mol Sci. 2017;18(10):873w4. doi:10.3390/ijms18102205
38. Zalewska A, Klimiuk A, Zięba S, et al. Salivary gland dysfunction and salivary redox imbalance in patients with Alzheimer’s disease. Sci Rep. 2021;11(1):23904. doi:10.1038/s41598-021-03456-9
39. Klimiuk A, Zalewska A, Knapp M, Sawicki R, Ładny JR, Maciejczyk M. Salivary gland dysfunction in patients with chronic heart failure is aggravated by nitrosative stress, as well as oxidation and glycation of proteins. Biomolecules. 2021;11(1):1–27. doi:10.3390/biom11010119
40. Maciejczyk M, Mil KM, Gerreth P, Hojan K, Zalewska A, Gerreth K. Salivary cytokine profile in patients with ischemic stroke. Sci Rep. 2021;11(1):17185. doi:10.1038/s41598-021-96739-0
41. Morawska K, Maciejczyk M, Zięba S, et al. Cytokine/Chemokine/Growth Factor Profiles Contribute to Understanding the Pathogenesis of the Salivary Gland Dysfunction in Euthyroid Hashimoto’s Thyroiditis Patients. Mediators Inflamm. 2021;2021:3192409. doi:10.1155/2021/3192409
42. World Health Organization. Surveys: Basic Methods - World Health Organization. World Health Organization; 2017.
43. Choromańska B, Myśliwiec P, Kozłowski T, et al. Antioxidant Barrier and Oxidative Damage to Proteins, Lipids, and DNA/RNA in Adrenal Tumor Patients. Oxid Med Cell Longev. 2021;2021:5543531. doi:10.1155/2021/5543531
44. Walker JM. The Bicinchoninic Acid (BCA) Assay for Protein Quantitation. In: Basic Protein and Peptide Protocols. Vol. 32. New Jersey: Humana Press;1994:5–8. doi:10.1385/0-89603-268-X:5
45. Ellman GL. Tissue sulfhydryl groups. Arch Biochem Biophys. 1959;82(1):70–77. doi:10.1016/0003-9861(59)90090-6
46. Reznick AZ, Packer L. Oxidative damage to proteins: spectrophotometric method for carbonyl assay. Methods Enzymol. 1994;233(C):357–363. doi:10.1016/S0076-6879(94)33041-7
47. Cabello-Verrugio C, Simon F, Trollet C, Santibañez JF. Oxidative Stress in Disease and Aging: mechanisms and Therapies 2016. Oxid Med Cell Longev. 2017;2017:1–2. doi:10.1155/2017/4310469
48. Monnier VM, Taniguchi N. Advanced glycation in diabetes, aging and age-related diseases: conclusions. Glycoconj J. 2016;33(4):691–692. doi:10.1007/s10719-016-9711-1
49. Suji G, Sivakami S. Glucose, glycation and aging. Biogerontology. 2004;5(6):365–373. doi:10.1007/s10522-004-3189-0
50. Nicolas C, Jaisson S, Gorisse L, et al. Carbamylation and glycation compete for collagen molecular aging in vivo. Sci Rep. 2019;9(1):18291. doi:10.1038/s41598-019-54817-4
51. Gorisse L, Pietrement C, Vuiblet V, et al. Protein carbamylation is a hallmark of aging. Proc Natl Acad Sci. 2016;113(5):1191–1196. doi:10.1073/pnas.1517096113
52. Bedard K, Krause K-H. The NOX Family of ROS-Generating NADPH Oxidases: physiology and Pathophysiology. Physiol Rev. 2007;87(1):245–313. doi:10.1152/physrev.00044.2005
53. Simpson DSA, Oliver PL. ROS Generation in Microglia: understanding Oxidative Stress and Inflammation in Neurodegenerative Disease. Antioxidants. 2020;9(8):743. doi:10.3390/antiox9080743
54. Wu Y, Chen M, Jiang J. Mitochondrial dysfunction in neurodegenerative diseases and drug targets via apoptotic signaling. Mitochondrion. 2019;49:35–45. doi:10.1016/j.mito.2019.07.003
55. Singh A, Kukreti R, Saso L, Kukreti S. Oxidative Stress: a Key Modulator in Neurodegenerative Diseases. Molecules. 2019;24(8):1583. doi:10.3390/molecules24081583
56. Dąbrowska Z, Bijowski K, Dąbrowska E, Pietruska M. Effect of oxidants and antioxidants on oral health. Med Ogólna i Nauk o Zdrowiu. 2020;26(2):87–93. doi:10.26444/monz/122255
57. Battino M, Ferreiro MS, Gallardo I, Newman HN, Bullon P. The antioxidant capacity of saliva. J Clin Periodontol. 2002;29(3):189–194. doi:10.1034/j.1600-051X.2002.290301x.x
58. Eichler J. Protein glycosylation. Curr Biol. 2019;29(7):R229–R231. doi:10.1016/j.cub.2019.01.003
59. Zińczuk J, Zaręba K, Kamińska J, et al. Association of Tumour Microenvironment with Protein Glycooxidation, DNA Damage, and Nitrosative Stress in Colorectal Cancer. Cancer Manag Res. 2021;13:6329–6348. doi:10.2147/CMAR.S314940
60. Klimiuk A, Maciejczyk M, Choromańska M, Fejfer K, Waszkiewicz N, Zalewska A. Salivary Redox Biomarkers in Different Stages of Dementia Severity. J Clin Med. 2019;8(6). doi:10.3390/jcm8060840
61. Walton EL. Saliva biomarkers in neurological disorders: a “spitting image” of brain health? Biomed J. 2018;41(2):59–62. doi:10.1016/j.bj.2018.04.005
62. Krahel A, Paszynska E, Slopien A, et al. Stress/Immune Biomarkers in Saliva among Children with ADHD Status. Int J Environ Res Public Health. 2021;18(2):769. doi:10.3390/ijerph18020769
63. Mehta T, Fayyaz M, Giler GE, et al. Current Trends in Biomarkers for Traumatic Brain Injury. Open Access J Neurol Neurosurg. 2020;12(4):86–94.
64. Maciejczyk M, Zalewska A, Gerreth K. Salivary Redox Biomarkers in Selected Neurodegenerative Diseases. J Clin Med. 2020;9(2):497. doi:10.3390/jcm9020497
65. Risso FM, Sannia A, Gavilanes DAW, et al. Biomarkers of brain damage in preterm infants. J Matern Neonatal Med. 2012;25(sup4):93–96. doi:10.3109/14767058.2012.715024
66. Wormwood KL, Aslebagh R, Channaveerappa D, et al. Salivary proteomics and biomarkers in neurology and psychiatry. Clin Appl. 2015;9(9–10):899–906. doi:10.1002/prca.201400153
67. François M, Bull CF, Fenech MF, Leifert WR. Current State of Saliva Biomarkers for Aging and Alzheimer’s Disease. Curr Alzheimer Res. 2018;16(1):56–66. doi:10.2174/1567205015666181022094924
68. Fan AP, An H, Moradi F, et al. Quantification of brain oxygen extraction and metabolism with [15O]-gas PET: a technical review in the era of PET/MRI. Neuroimage. 2020;220:117136. doi:10.1016/j.neuroimage.2020.117136
69. Falkowska A, Gutowska I, Goschorska M, Nowacki P, Chlubek D, Baranowska-Bosiacka I. Energy Metabolism of the Brain, Including the Cooperation between Astrocytes and Neurons, Especially in the Context of Glycogen Metabolism. Int J Mol Sci. 2015;16(11):25959–25981. doi:10.3390/ijms161125939
70. Maciejczyk M, Żebrowska E, Chabowski A. Insulin resistance and oxidative stress in the brain: what’s new? Int J Mol Sci. 2019;20(4):634. doi:10.3390/ijms20040874
71. Castellani R, Smith MA, Richey GL, Perry G. Glycoxidation and oxidative stress in Parkinson disease and diffuse Lewy body disease. Brain Res. 1996;737(1–2):195–200. doi:10.1016/0006-8993(96
72. Facheris M, Beretta S, Ferrarese C. Peripheral markers of oxidative stress and excitotoxicity in neurodegenerative disorders: tools for diagnosis and therapy? Polidori MC. J Alzheimer’s Dis. 2004;6(2):177–184. doi:10.3233/JAD-2004-6210
73. Sayre L, Smith M, Perry G. Chemistry and Biochemistry of Oxidative Stress in Neurodegenerative Disease. Curr Med Chem. 2001;8(7):721–738. doi:10.2174/0929867013372922
74. Pukhalskaia AE, Dyatlova AS, Linkova NS, et al. Sirtuins as Possible Predictors of Aging and Alzheimer’s Disease Development: verification in the Hippocampus and Saliva. Bull Exp Biol Med. 2020;169(6):821–824. doi:10.1007/s10517-020-04986-4
75. Jaisson S, Pietrement C, Gillery P. Protein Carbamylation: chemistry, Pathophysiological Involvement, and Biomarkers. Advances in Clinical Chemistry. 2018;84:1–38. doi:10.1016/bs.acc.2017.12.001
76. Delanghe S, Delanghe JR, Speeckaert R, Van Biesen W, Speeckaert MM. Mechanisms and consequences of carbamoylation. Nat Rev Nephrol. 2017;13(9):580–593. doi:10.1038/nrneph.2017.103
77. Qiu G-H, Zheng X, Fu M, Huang C, Yang X. The protective function of non-coding DNA in DNA damage accumulation with age and its roles in age-related diseases. Biogerontology. 2019;20(6):741–761. doi:10.1007/s10522-019-09832-3
78. Babbar M, Basu S, Yang B, Croteau DL, Bohr VA. Mitophagy and DNA damage signaling in human aging. Mech Ageing Dev. 2020;186:111207. doi:10.1016/j.mad.2020.111207
79. Agathangelou K, Apostolou Z, Garinis GA. Nuclear DNA Damage and Ageing. In:. 2018;309–322. doi:10.1007/978-981-13-2835-0_10
80. da Silva PFL, Schumacher B. DNA damage responses in ageing. Open Biol. 2019;9(11):190168. doi:10.1098/rsob.190168
81. Kowalska M, Piekut T, Prendecki M, Sodel A, Kozubski W, Dorszewska J. Mitochondrial and Nuclear DNA Oxidative Damage in Physiological and Pathological Aging. DNA Cell Biol. 2020;39(8):1410–1420. doi:10.1089/dna.2019.5347
82. Nissanka N, Moraes CT. Mitochondrial DNA damage and reactive oxygen species in neurodegenerative disease. FEBS Lett. 2018;592(5):728–742. doi:10.1002/1873-3468.12956
83. Kujoth GC, Hiona A, Pugh TD, et al. Mitochondrial DNA Mutations, Oxidative Stress, and Apoptosis in Mammalian Aging. Science. 2005;309(5733):481–484. doi:10.1126/science.1112125
84. Poulsen HE, Prieme H, Loft S. Role of oxidative DNA damage in cancer initiation and promotion. Eur J Cancer Prev. 1998;7(1):9–16.
85. Han Y, Chen JZ. Oxidative Stress Induces Mitochondrial DNA Damage and Cytotoxicity through Independent Mechanisms in Human Cancer Cells. Biomed Res Int. 2013;2013:1–8. doi:10.1155/2013/825065
86. Zińczuk J, Maciejczyk M, Zaręba K, et al. Pro-Oxidant Enzymes, Redox Balance and Oxidative Damage to Proteins, Lipids and DNA in Colorectal Cancer Tissue. Is Oxidative Stress Dependent on Tumour Budding and Inflammatory Infiltration? Cancers. 2020;12(6):523. doi:10.3390/cancers12061636
87. Kaur J, Politis C, Jacobs R. Salivary 8-hydroxy-2-deoxyguanosine, malondialdehyde, vitamin C, and vitamin E in oral pre-cancer and cancer: diagnostic value and free radical mechanism of action. Clin Oral Investig. 2016;20(2):315–319. doi:10.1007/s00784-015-1506-4
88. Adeoye J, Brennan PA, Thomson P. “Search less, verify more”—Reviewing salivary biomarkers in oral cancer detection. J Oral Pathol Med. 2020;49(8):711–719. doi:10.1111/jop.13003
89. Wagner K-H, Cameron-Smith D, Wessner B, Franzke B. Biomarkers of Aging: from Function to Molecular Biology. Nutrients. 2016;8(6):338. doi:10.3390/nu8060338
90. Bai X. Biomarkers of Aging. In:. 2018;217–234. doi:10.1007/978-981-13-1117-8_14
91. Ahmed MS, Ikram S, Bibi N, Mir A. Hutchinson–Gilford Progeria Syndrome: a Premature Aging Disease. Mol Neurobiol. 2017. doi:10.1007/s12035-017-0610-7
92. Foo MXR, Ong PF, Dreesen O. Premature aging syndromes: from patients to mechanism. J Dermatol Sci. 2019;96(2):58–65. doi:10.1016/j.jdermsci.2019.10.003
93. Schnabel F, Kornak U, Wollnik B. Premature aging disorders: a clinical and genetic compendium. Clin Genet. 2021;99(1):3–28. doi:10.1111/cge.13837
94. Leopold JA. Editorial commentary: premature peripheral arterial disease: a consequence of accelerated vascular aging due to less than ideal cardiovascular health? Trends Cardiovasc Med. 2021;31(6):359–360. doi:10.1016/j.tcm.2020.06.011
95. Ikeda Y, Kumagai H, Motozawa Y, Suzuki J, Akazawa H, Komuro I. Understanding Vascular Diseases: lessons From Premature Aging Syndromes. Can J Cardiol. 2016;32(5):650–658. doi:10.1016/j.cjca.2015.12.003
96. Huebschmann AG, Kohrt WM, Regensteiner JG. Exercise attenuates the premature cardiovascular aging effects of type 2 diabetes mellitus. Vasc Med. 2011;16(5):378–390. doi:10.1177/1358863X11419996
97. Burton DGA, Faragher RGA. Obesity and type-2 diabetes as inducers of premature cellular senescence and ageing. Biogerontology. 2018;19(6):447–459. doi:10.1007/s10522-018-9763-7
98. Maciejczyk M, Heropolitanska-Pliszka E, Pietrucha B, et al. Antioxidant defense, redox homeostasis, and oxidative damage in children with ataxia telangiectasia and Nijmegen breakage syndrome. Front Immunol. 2019;10(SEP):365. doi:10.3389/fimmu.2019.02322
99. Pietrucha B, Heropolitanska-Pliszka E, Maciejczyk M, et al. Comparison of Selected Parameters of Redox Homeostasis in Patients with Ataxia-Telangiectasia and Nijmegen Breakage Syndrome. Oxid Med Cell Longev. 2017;2017:1–8. doi:10.1155/2017/6745840
100. Skirbekk VF, Staudinger UM, Cohen JE. How to Measure Population Aging? The Answer Is Less than Obvious: a Review. Gerontology. 2019;65(2):136–144. doi:10.1159/000494025
101. Xu F, Laguna L, Sarkar A. Aging-related changes in quantity and quality of saliva: where do we stand in our understanding? J Texture Stud. 2019;50(1):27–35. doi:10.1111/jtxs.12356
102. Bel’skaya LV, Sarf EA, Solomatin DV. Age and Gender Characteristics of the Infrared Spectra of Normal Human Saliva. Appl Spectrosc. 2020;74(5):536–543. doi:10.1177/0003702819885958
103. Avezov K, Reznick AZ, Aizenbud D. Oxidative stress in the oral cavity: sources and pathological outcomes. Respir Physiol Neurobiol. 2015;209:91–94. doi:10.1016/j.resp.2014.10.007
104. Żukowski P, Maciejczyk M, Waszkiel D. Sources of free radicals and oxidative stress in the oral cavity. Arch Oral Biol. 2018;92:8–17. doi:10.1016/j.archoralbio.2018.04.018
105. Zieniewska I, Maciejczyk M, Zalewska A. The effect of selected dental materials used in conservative dentistry, endodontics, surgery, and orthodontics as well as during the periodontal treatment on the redox balance in the oral cavity. Int J Mol Sci. 2020;21(24):9684. doi:10.3390/ijms21249684
 © 2022 The Author(s). This work is published and licensed by Dove Medical Press Limited. The full terms of this license are available at https://www.dovepress.com/terms.php and incorporate the Creative Commons Attribution - Non Commercial (unported, v3.0) License.
By accessing the work you hereby accept the Terms. Non-commercial uses of the work are permitted without any further permission from Dove Medical Press Limited, provided the work is properly attributed. For permission for commercial use of this work, please see paragraphs 4.2 and 5 of our Terms.
© 2022 The Author(s). This work is published and licensed by Dove Medical Press Limited. The full terms of this license are available at https://www.dovepress.com/terms.php and incorporate the Creative Commons Attribution - Non Commercial (unported, v3.0) License.
By accessing the work you hereby accept the Terms. Non-commercial uses of the work are permitted without any further permission from Dove Medical Press Limited, provided the work is properly attributed. For permission for commercial use of this work, please see paragraphs 4.2 and 5 of our Terms.