")
Back to Journals » OncoTargets and Therapy » Volume 10
Overexpression of MPC1 inhibits the proliferation, migration, invasion, and stem cell-like properties of gastric cancer cells
Authors Zhou X, Xiong ZJ, Xiao SM, Zhou J, Ding Z, Tang LC, Chen XD, Xu R, Zhao P
Received 9 August 2017
Accepted for publication 26 September 2017
Published 24 October 2017 Volume 2017:10 Pages 5151—5163
DOI https://doi.org/10.2147/OTT.S148681
Checked for plagiarism Yes
Review by Single anonymous peer review
Peer reviewer comments 2
Editor who approved publication: Dr Tohru Yamada
Xiang Zhou,1 Zhu-juan Xiong,2 Shuo-meng Xiao,1 Jin Zhou,3 Zhi Ding,1 Ling-chao Tang,1 Xiao-dong Chen,1 Rui Xu,1 Ping Zhao1
1Department of Gastrointestinal Surgery, Sichuan Cancer Hospital & Institute, Sichuan Cancer Center, School of Medicine, University of Electronic Science and Technology of China, Chengdu, 2Nutritional Center, Sichuan Cancer Hospital & Institute, Sichuan Cancer Center, School of Medicine, University of Electronic Science and Technology of China, Chengdu, 3Department of Thoracic Oncology, Sichuan Cancer Hospital & Institute, Sichuan Cancer Center, School of Medicine, University of Electronic Science and Technology of China, Chengdu, China
Abstract: Invasion and metastasis are major malignant characteristics of human gastric cancer (GC), but the molecular mechanisms underlying the invasion and metastasis of GC cells remain elusive. MPC1, a key factor that controls pyruvate transportation through the inner mitochondrial membrane, was reported to be downregulated and correlated with poor prognosis in several cancers. However, the effects of MPC1 on human GC have not been illustrated. In this study, we investigated the potential role of MPC1 in the proliferation, migration, invasion, and stem cell-like properties of human GC cells and evaluated its prognostic significance for patients with GC. We found that MPC1 protein and mRNA levels were significantly decreased in GC tissues and cell lines. Low MPC1 expression was associated with tumor T stage, N stage, and advanced tumor node metastasis stage. Decreased MPC1 expression was an independent prognostic marker and correlated with poor overall survival of patients with GC. Furthermore, overexpression of MPC1 inhibited the proliferation, migration, invasion, and stem cell-like properties of GC cells. These findings suggest that MPC1 may be a novel prognostic marker and a potential therapeutic target in human GC.
Keywords: gastric cancer, invasion, migration, MPC1, proliferation
Introduction
Gastric cancer (GC) is one of the most common malignant tumors of the digestive system and the third most common cause of cancer-related death.1 Although the mortality rate has been decreasing in recent years thanks to significant improvements in early detection, surgical techniques, and chemotherapy, the clinical outcomes for patients with advanced-stage GC are unfavorable. Currently, accumulating evidence suggests that mitochondrial metabolism is required for tumorigenesis.2 It has been shown that mitochondrial respiration plays a critical role in treatment-resistant cancer cells,3 metastatic and circulating cancer cells,4 cancer stem cells, and tumor-initiating cells within several cancers.5 Moreover, key metabolic enzymes and pathways associated with mitochondrial metabolism are reported to be closely correlated with tumor initiation and progression.6
MPC1, an approximately 12 kDa protein with two predicted transmembrane domains, is located in the inner mitochondrial membrane. MPC1 was recently identified to be a critical component of a transporter complex to control rate-limiting pyruvate transportation through the inner mitochondrial membrane.7,8 Loss of MPC1 protein results in disability of the mitochondrial pyruvate carrier (MPC) complex function and blocks pyruvate entry into the tricarboxylic acid cycle, leading to a metabolism switch to increase glycolysis and the compensatory usage of glutamine.9,10
Currently, the important role of MPC1 was unveiled in several diseases, in particular in solid tumors.11,12 Decreased expression of MPC1 has been correlated with poor survival in esophageal squamous cell carcinoma, and lung, colon, and prostate cancers.13–16 It was also discovered that treatment with the MPC inhibitor UK5099 upregulated the expression of the stem cell markers Oct3/4 and Nanog in prostate cancer cells.12 However, the clinical significance and function of MPC1 in GC have not been established.
In the present study, we report that the protein and mRNA levels of MPC1 are downregulated in both human GC tissues and cell lines. Decreased MPC1 expression is associated with tumor invasion depth (T stage), lymph node metastasis (N stage), and advanced tumor node metastasis (TNM) stage. Low MPC1 expression is significantly correlated with poor overall survival in patients with GC. Overexpression of MPC1 inhibited the proliferation, migration, invasion, and stem cell-like properties of GC cells. Our results suggest that MPC1 may be considered as a novel prognostic indicator and a therapeutic target for human GC.
Materials and methods
Cell culture
Human GC cell lines MGC803, BGC823, SGC7901, and AGS (Cell Bank of Shanghai Institute of Cell Biology, Chinese Academy of Sciences, Beijing, China) as well as the immortalized gastric epithelium cell line GES-1 (American Type Culture Collection, Manassas, VA, USA) were cultured in RPMI 1640 medium (Sigma-Aldrich Co., St Louis, MO, USA) supplemented with 10% FBS (Sigma-Aldrich Co.).
Patients and tissue samples
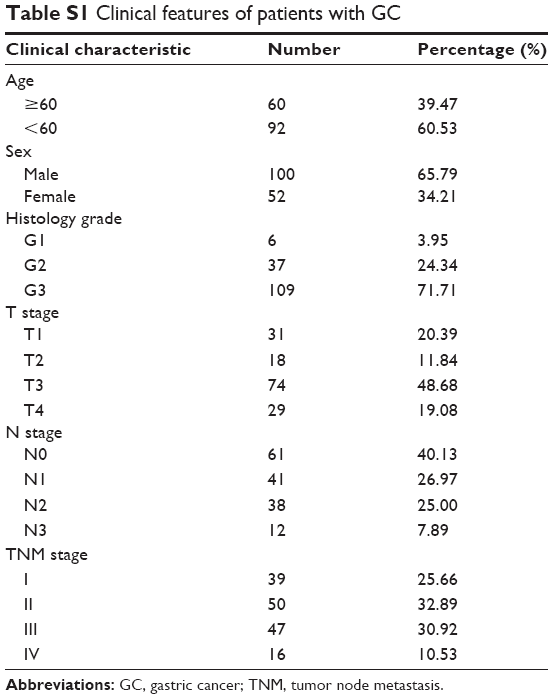
From January 2003 to December 2009, we collected a total of 152 formalin-fixed and paraffin-embedded surgical specimens of GC tumors and paired adjacent normal tissues from patients with GC who underwent surgical resection at the Sichuan Cancer Hospital & Institute, Chengdu, Sichuan Province, China. All patient samples were adenocarcinoma. All the 152 patients were treated with radical gastrectomy and D2 lymphadenectomy. The postoperative chemotherapy was based on fluorouracil regimens and none of the subjects received preoperative chemotherapy. All clinical information from the 152 specimens in this project was classified according to different clinical features (Table S1). All patients were followed-up more than 5 years. Written informed consent was obtained from all patients. The study was approved by the Ethical Committee of Sichuan Cancer Hospital & Institute.
Immunohistochemistry (IHC) and scoring
IHC detection of MPC1 was performed on 4 μm tissue sections with Dako Real Envision Detection System (Dako Denmark A/S, Glostrup, Denmark) according to the manufacturer’s instructions. After antigen retrieval and blocking, the tissue slides were incubated with the mouse anti-MPC1 monoclonal antibody (1:300; Abcam, Cambridge, UK) at 4°C overnight. Next, the slides were incubated at 37°C for 30 min after an HRP-conjugated secondary antibody (Dako Denmark A/S) was added. Each GC specimen was histologically graded by two pathologists according to the 7th edition of the American Joint Committee on Cancer TNM classification system17 in a double-blinded manner. H&E staining was performed to confirm the GC characteristics of the tumor sections (Figure S1A). The percentage of positive cancer cells was scored as: 1, 1% to 25% positive cells; 2, 26% to 50% positive cells; 3, 51% to 75% positive cells; and 4, >75% positive cells. The intensity was scored as follows: 0, no staining cells; 1, weak staining; 2, mild staining; and 3, strong staining (Figure S1B). The IHC staining score was obtained by multiplying the staining intensity from the average percentage of positive cells, following an accepted semi-quantitative evaluation method.18 Scores were analyzed using the statistical software X-tile19 with a score of 6 as the cutoff value. Therefore, total scores ≥8 were defined as MPC1high and scores ≤6 were defined as MPC1low (Figure S1C).
Western blotting
Cells and tissue samples were lysed in RIPA lysis buffer (Beyotime, Jiangsu, China) supplemented with protease inhibitors (phenylmethylsulfonyl fluoride [PMSF]; Thermo Fisher Scientific, Waltham, MA, USA) on ice. Lysates were centrifuged at 12,000 g for 15 min at 4°C before aliquots of 20 μg proteins were electrophoresed on 15% SDS-PAGE gels (Bio-Rad Laboratories Inc., Hercules, CA, USA), transferred onto PVDF membranes (EMD Millipore, Billerica, MA, USA), and incubated overnight with primary antibodies: anti-MPC1 (Abcam, 1:500), anti-FLAG (Beyotime, 1:1,000), anti-Sox-2 (Abcam, 1:500), anti-Oct-4 (Abcam, 1:400), anti-Nanog (Abcam, 1:300), and anti-β-actin (Beyotime, 1:1,000). The membranes were then incubated with appropriate HRP-conjugated secondary antibody for 2 h at room temperature. Chemiluminescence was detected using SuperSignal West Femto Maximum Sensitivity Substrate (enhanced chemiluminescence, Thermo Fisher Scientific). β-actin was used as a loading control. All of the experiments were performed in triplicate.
RNA extraction and qRT-PCR
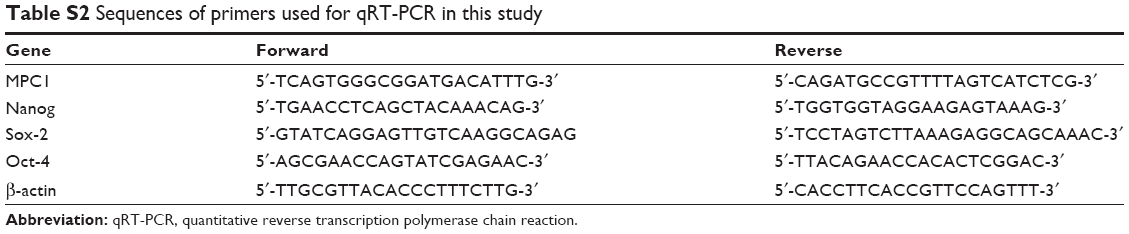
Total RNA was extracted from cells and 15 pairs of frozen tissue specimens using Trizol reagent (Takara Bio, Shiga, Japan) according to the manufacturer’s instructions. Reverse transcription was performed using reverse transcription reagents (Takara). The resulting cDNA was subjected to quantitative reverse transcription polymerase chain reaction (qRT-PCR) using the CFX96 Real-Time Quantitative PCR system (Bio-Rad Laboratories Inc.) with SYBR Premix Ex Taq II (Takara) following the manufacturer’s instructions. The primers used in this study are listed in Table S2. The relative mRNA expression levels were determined by the cycle threshold (Ct) normalized against β-actin using the 2−ΔΔCt formula. Experiments were performed in triplicate.
NCBI GEO datasets analysis
The mRNA levels of MPC1 in GC are publically available from the NCBI GEO database (accession number: GSE27342, GSE26942). Data were log2 transformed and quantile normalized using the R software (version 3.2.5; R Foundation for Statistical Computing, Vienna, Austria) along with packages from the BioConductor project as previously described.20 For the survival analysis of MPC1, an online tool was used to conduct Kaplan–Meier survival analysis, which included 380 patients with GC after surgery with available clinical data. The analyzed data were downloaded from the website and then Kaplan–Meier curves were plotted using GraphPad Prism 6.01 software (GraphPad Software, Inc., La Jolla, CA, USA). For the expression of the genes, each percentile of expression between the lower and upper quartiles was computed and the best performing threshold was used as the final cutoff for the univariate Cox regression analysis. The hazard ratio with 95% confidence interval and P-value were calculated.
Overexpression of MPC1 using lentivirus
To investigate the function of MPC1 in GC cells, we overexpressed MPC1 in MGC803 and SGC7901 cells. Lentiviral particles containing the GV341 expression vector were performed by GeneChem (Shanghai, China). The amplified sequences were C-terminally fused to FLAG (DYKDDDDK) tags by PCR. Lentiviral particles with a blank vector were used as a negative control. Next, the lentiviral-MPC1-FLAG and control lentivirus were infected into SGC7901 and MGC803 cells for 24 h in medium containing 6 μg/mL polybrene (Sigma-Aldrich Co.). Fresh culture medium containing 4 μg/mL puromycin was added to select stable puromycin-resistant GC cells.
Colony formation assay
To analyze differences in colony formation after MPC1 overexpression, SGC7901 and MGC803 GC cells were thoroughly dissociated and then plated in 6-well plates at a density of 500 cells per well in triplicate. Cells were cultured in 2 mL RPMI 1640 medium containing 10% FBS. The plates were then incubated for 14 days at 37°C with 5% CO2 until most cell clones had generated more than 50 cells. After staining with Giemsa dye for 15 min at room temperature, the numbers of colonies containing more than 50 cells were counted. Experiments were repeated three times.
Cell proliferation assay
Cells dissociated from SGC7901 and MGC803 were prepared into single cell suspension and seeded in 96-well plates at approximately 1,000 cells per well in 0.1 mL of RPMI 1640 medium containing 10% FBS. At 24, 48, 72, and 96 h, culture medium was abandoned and then 0.1 mL of fresh RPMI 1640 containing 10% FBS and 0.01 mL cell counting kit-8 solution (CCK-8; Dojindo Laboratories, Tokyo, Japan) was added. After incubation at 37°C for 1.5 h, the plates were agitated for 15 min, and the optical density of the solution was measured at 450 nm in a photometer according to the protocol.
Migration and invasion assays
Cell migration and invasion assays were performed using modified Boyden chambers with 8 mm pore filter inserts in 24-well plates (BD Biosciences, San Jose, CA, USA). For the invasion assay, the insert membranes were precoated with 10 μL of Matrigel (BD Biosciences)/RPMI 1640 (1:1, v/v) for 30 min at 37°C. GC cells were serum-starved for 12 h before being added to the upper chamber at a density of 2×10⁴ cells per well with 200 μL serum-free RPMI 1640 medium. Then, 500 μL RPMI 1640 medium containing 10% FBS was added to the basal chambers. The plates were incubated for 24 h. For the migration assay, the insert membranes were not coated with Matrigel, but they were cultured under the same conditions. After fixation with 4% paraformaldehyde for 20 min, the insert membranes were cut and the cells on the upper surface of the membrane were removed with a cotton swab. Then the cells on the lower surface of the membrane were stained with crystal violet solution (Beyotime). The number of cells attached to the lower surface was counted in five randomly selected high-power fields under an inverted microscope and photographed.
Tumorsphere formation assay
Adherent SGC7901 and MGC803 cells with different treatments were harvested by trypsin digestion and suspended in serum-free DMEM/F12 medium (Gibco, Thermo Fisher Scientific) supplemented with 20 ng/mL recombinant human EGF (Sigma-Aldrich Co.), 20 ng/mL bFGF (Sigma-Aldrich Co.), and 1× B27 (Invitrogen, Thermo Fisher Scientific). The cells were seeded in 24-well ultra-low-attachment plates (Corning Incorporated, Corning, NY, USA) to acquire tumorspheres. The number of primary GC cell spheres was counted after 2 weeks in five random fields. Each experiment was performed in triplicate.
Subcutaneous xenograft tumorigenicity experiments
This experiment was conducted in accordance with Animal Welfare and 3Rs (Replacement, Reduction, and Refinement) guidelines and was approved by the Ethical Committee of Sichuan Cancer Hospital & Institute. Female BALB/c nude mice (5 to 6 weeks old) were purchased from Laboratory Animal Center of Sichuan University (Chengdu, China) and housed in a pathogen-free environment. MPC1-FLAG or control SGC7901 cells were injected subcutaneously into the axilla of the mice (2×10⁴ cells in 0.2 mL Matrigel [1:1, v/v]). Subcutaneous tumor growth was inspected every day. The mice were sacrificed 4 weeks after implantation, and the tumors were collected and weighed.
Statistical analysis
All experiments were conducted at least three times. Results were presented as the mean ± standard deviation. Statistical analysis was performed using the SPSS 19.0 software (IBM Corporation, Armonk, NY, USA). Student’s t-test was used for comparing the two groups and Pearson χ2 test was used to determine the correlation between MPC1 expression and the clinicopathological features of patients with GC. The mRNA levels of MPC1 in GSE27342 were compared using paired t-test. Kaplan–Meier survival plots and log-rank statistics were used to compare the survival rates of patients. Univariate and multivariate survival analyses were performed using a Cox proportional hazards model with stepwise selection. The cutoff value of the IHC score was determined by the statistical software X-tile.19 A value of P<0.05 was considered significant.
Results
MPC1 protein and mRNA levels were downregulated in both GC tissues and cell lines
We detected the expression of MPC1 in our 152 paired tumor tissues and adjacent normal tissues. MPC1 staining was observed in the cytoplasm of GC cells (Figure 1A). The proportion of MPC1high cells in GC tissues (48.68%, 74/152) was markedly lower than that in adjacent normal tissues (79.61%, 121/152, P<0.001) (Table 1). Moreover, the IHC scores of MPC1 in GC tissues were significantly lower than the corresponding normal tissues (P<0.001, Figure 1B), indicating that the protein levels of MPC1 were significantly downregulated in GC tissues. We detected the mRNA levels of 15 pairs of fresh GC tissues and corresponding adjacent normal tissues by qRT-PCR analysis. The results demonstrated that MPC1 mRNA levels were higher in normal specimens than in GC tissues (P<0.01, Figure 1C). In addition, results from GSE27342 and GSE26942 demonstrated that the mRNA levels of MPC1 in GC tissues were obviously lower than in adjacent normal tissues (P<0.001 and P=0.0016, respectively, Figure 1D). We then analyzed two pairs of fresh GC tissues and corresponding adjacent normal tissues by Western blotting and our results showed that the protein levels of MPC1 in GC tissues were downregulated (Figure 1E). To investigate the expression of MPC1 protein and mRNA levels in GC cell lines in comparison with gastric epithelium cells, MGC803, SGC7901, BGC823, AGS, and GES-1 were tested. The results demonstrated that the MPC1 protein and mRNA levels were obviously downregulated in four GC cells lines (MGC803, SGC7901, BGC823, and AGS) compared with gastric epithelium cell line GES-1, especially MGB803 and SGC7901 (Figure 1F and G). As a result, MGC803 and SGC7901 were employed for our further study. Overall, our results suggested that the MPC1 protein and mRNA levels were downregulated in both GC tissues and cell lines.
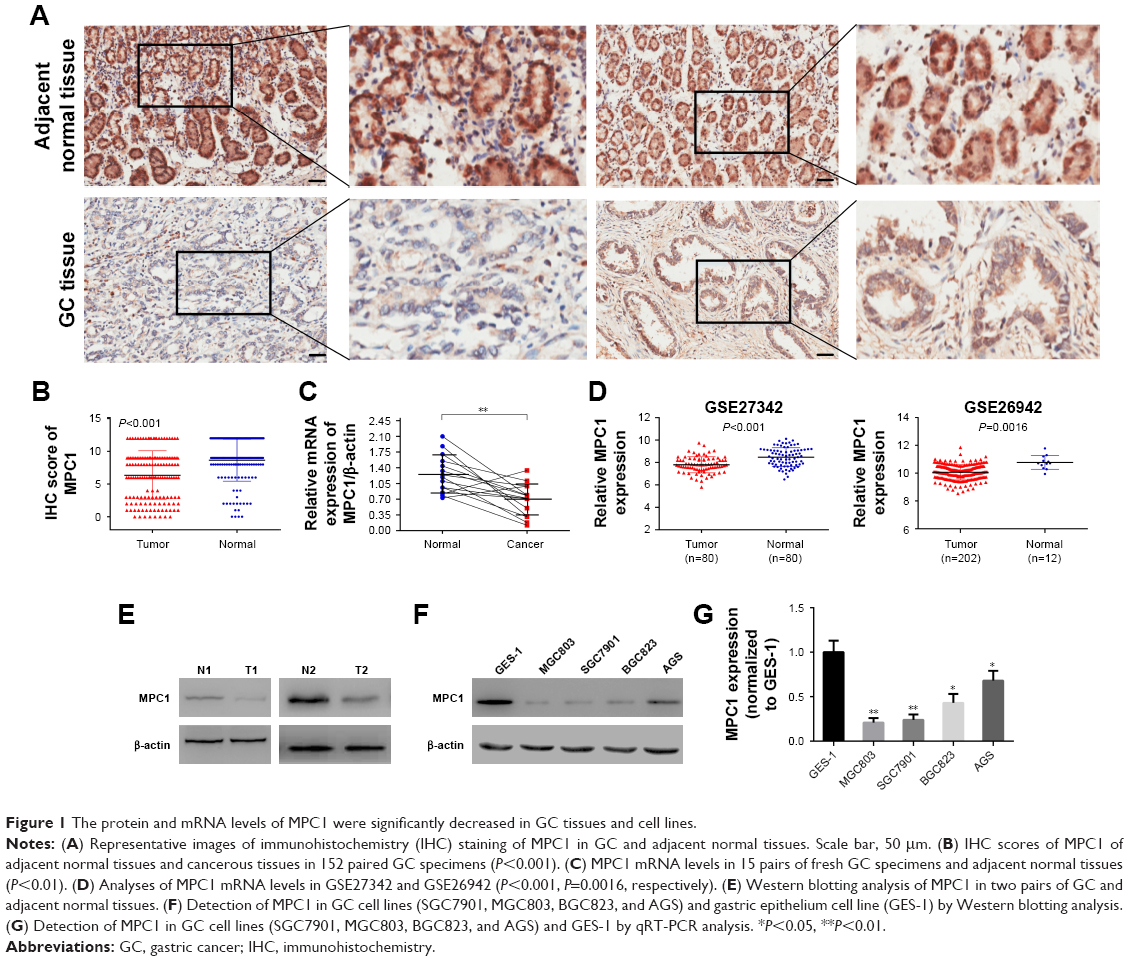 | Figure 1 The protein and mRNA levels of MPC1 were significantly decreased in GC tissues and cell lines. |
 | Table 1 MPC1 expression in GC and adjacent normal mucosa |
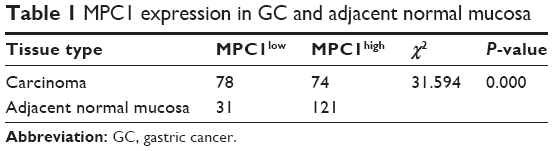
MPC1 expression was correlated with the clinicopathological features of patients with GC
We analyzed the correlation between MPC1 expression and the clinicopathological features of patients with GC. As shown in Table 2, we listed the clinicopathological indices of 152 patients with GC and corresponding MPC1 levels. Among the 152 cases, 78 cases were MPC1low and 74 were MPC1high (Table 1). MPC1 expression was negatively correlated with T stage (tumor invasion depth) (P<0.001, Table 2; Figure 2A), N stage (lymph node metastasis) (P=0.037), and TNM stage (P=0.028). No significant correlations between MPC1 expression and age, sex, tumor site or histological grade were found (Table 2). Furthermore, we analyzed the relationship between IHC scores of MPC1 and TNM stage in our 152 cases and our results revealed that low MPC1 was correlated with advanced TNM stage (P=0.005, Figure 2B). We also analyzed the mRNA levels of MPC1 in different TNM stages from GSE26942. Results from GSE26942 indicated that lower MPC1 expression was correlated with advanced TNM stages (P=0.016, Figure 2C). These results suggested that decreased MPC1 expression was significantly associated with tumor invasion depth, lymph node metastasis, and TNM stage in patients with GC.
 | Table 2 The relationship between MPC1 expression and clinicopathological features of GC patients |
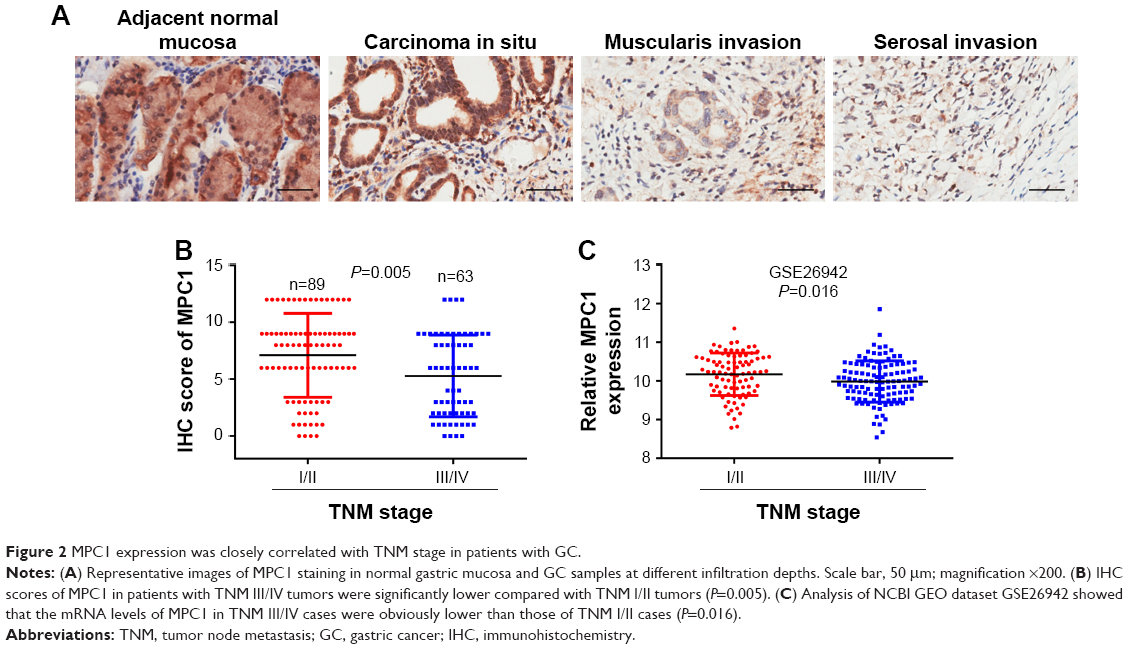 | Figure 2 MPC1 expression was closely correlated with TNM stage in patients with GC. |
Decreased MPC1 expression predicted poor overall survival of patients with GC
To further evaluate the prognostic significance of MPC1 expression in GC, Kaplan–Meier survival analysis of our 152 patients with GC were conducted. The overall survival rates for MPC1high patients were significantly higher than those with MPC1low tumors (P<0.001, Figure 3A). Univariate and multivariate analyses of the 152 cases showed that low MPC1 expression was an independent prognostic indicator for the overall survival of GC patients (Table 3). Moreover, survival analysis of 380 GC patients after surgery from the NCBI GEO database using the online tool kmplot (http://www.kmplot.com/gastric) indicated that low MPC1 expression was associated with poor overall survival (P=0.0036, Figure 3B).
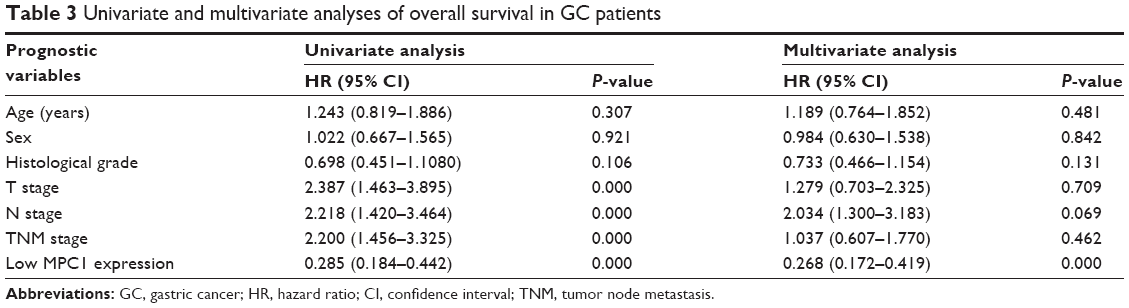 | Table 3 Univariate and multivariate analyses of overall survival in GC patients |
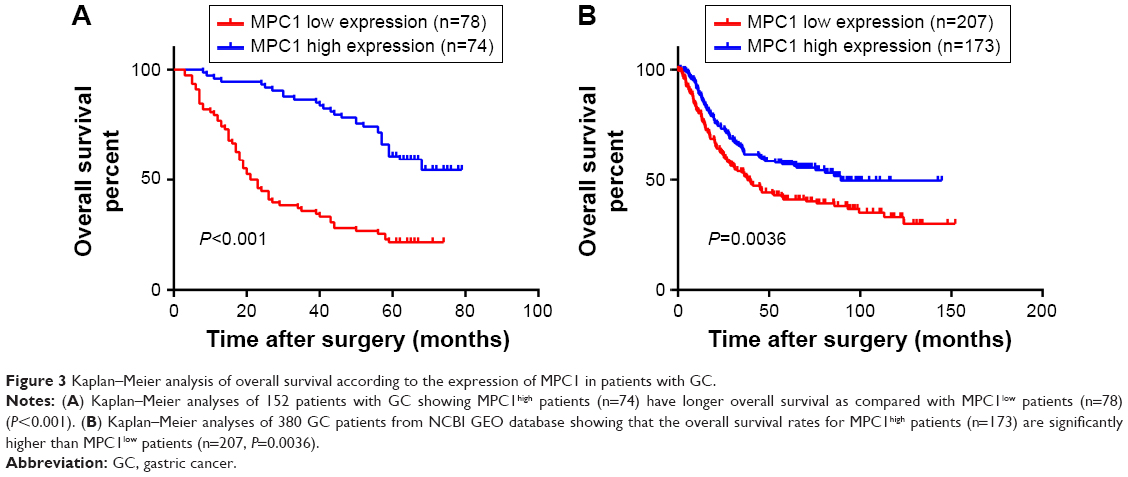 | Figure 3 Kaplan–Meier analysis of overall survival according to the expression of MPC1 in patients with GC. |
Overexpression of MPC1 attenuated the proliferation, migration, and invasion of GC cells
To confirm the function of MPC1 in GC progression, we evaluated the subsequent effects of MPC1 overexpression on the proliferation, migration, and invasion of GC cells. Overexpression of MPC1 protein levels in MGC803 and SGC7901 cells was tested by Western blotting analysis (Figure 4A). The colony formation assay showed that the number and average size of colonies formed by MPC1-FLAG MGC803 and SGC7901 cells in vitro were smaller than those formed by control cells (P<0.05, Figure 4B and C). In our CCK-8 assays, the proliferation ability was significantly inhibited in MPC1-FLAG MGC803 and SGC7901 cells (Figure 4D). The migration and invasion assays showed that overexpression of MPC1 significantly impaired the migrating and invasive capabilities of GC cells (P<0.05, Figure 4E and F). These results suggested that overexpression of MPC1 inhibited the proliferation, migration, and invasion of GC cells in vitro.
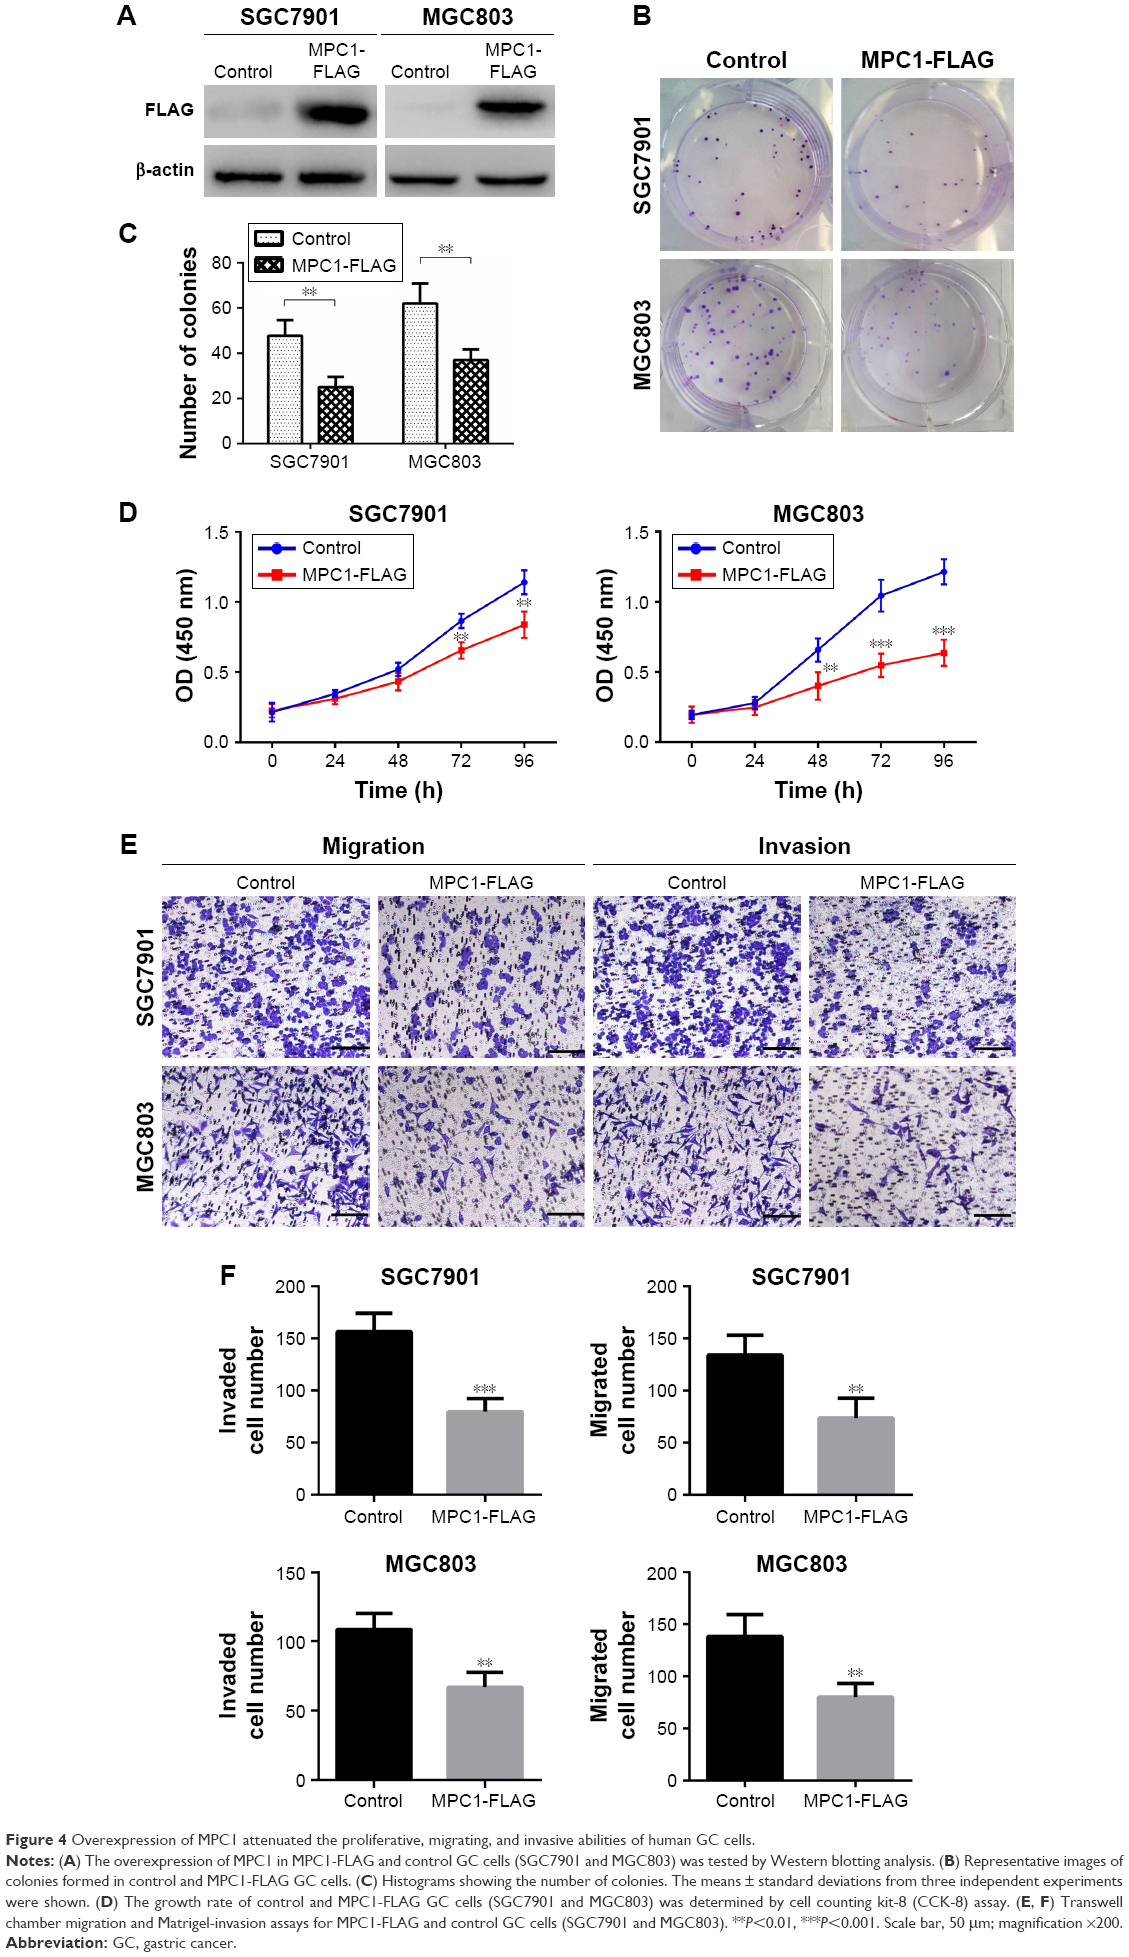 | Figure 4 Overexpression of MPC1 attenuated the proliferative, migrating, and invasive abilities of human GC cells. |
Overexpression of MPC1 impaired stem cell-like properties in GC cells
To investigate whether overexpression of MPC1 has an effect on stem cell properties of GC cells, stem cell markers such as Nanog, Sox-2, and Oct-421,22 were detected using Western blotting and qRT-PCR analyses. Enhanced MPC1 expression led to significant decrease in the protein and mRNA levels of Nanog, Sox-2, and Oct-4 compared with control cells (Figure 5A and B). We then evaluated the effect of MPC1 overexpression on the sphere formation ability of GC cells. We found that the number and size of spheres formed by MPC1-FLAG cells were decreased (Figure 5C and D). In vivo, tumor-initiating capability of SGC7901 cells was inhibited by MPC1 overexpression. The size of xenograft tumors derived from MPC1-FLAG cells was significantly smaller than those formed by control cells (Figure 5E). The weights of the xenograft tumors corresponded to their sizes (P<0.01, Figure 5F).
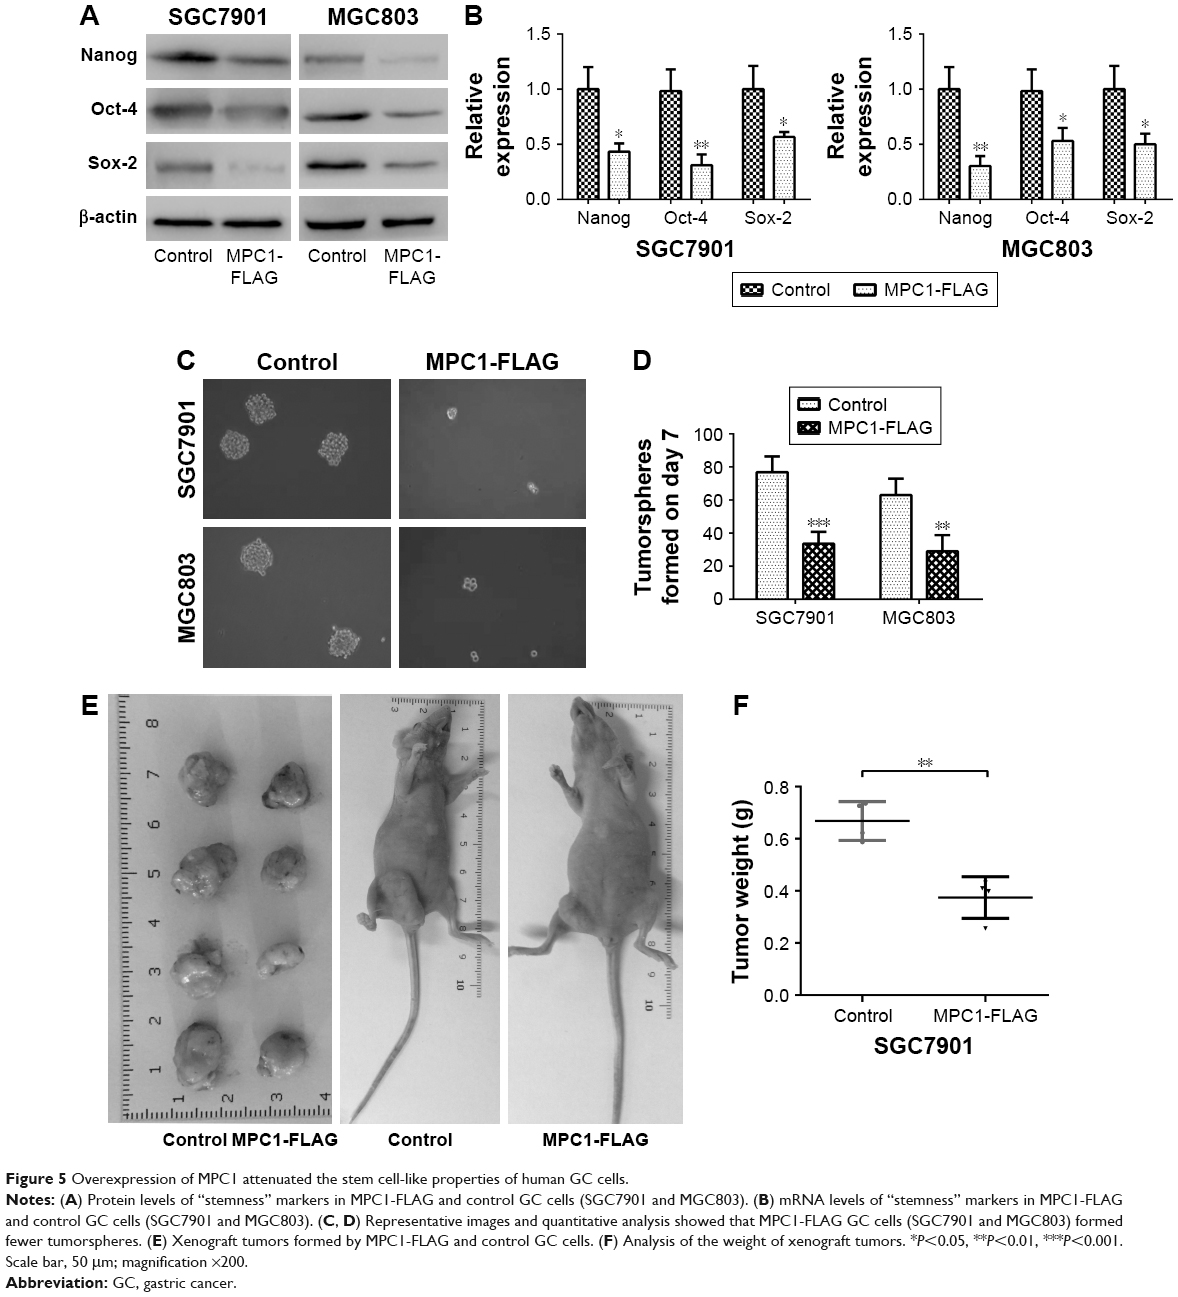 | Figure 5 Overexpression of MPC1 attenuated the stem cell-like properties of human GC cells. |
Discussion
GC cells have metabolic alterations characterized by an increased rate of glycolysis and producing high amounts of lactate in the presence of oxygen, a process known as the Warburg effect.23,24 Multiple mechanisms contribute to this metabolic derangement in cancer cells, of which the metabolism of pyruvate is one of the most important differences made by normal cells and cancer cells. Cancer cells divert pyruvate and its precursors to fuel other anabolic processes or convert it to lactate for excretion.25 Altered pyruvate metabolism appears to be critical in enabling and promoting the transformed phenotype in many cancers. One of the mechanisms to explain the decrease in mitochondrial pyruvate oxidation within cancer cells was a loss of mitochondrial pyruvate import.26
MPC1 and MPC2 were originally known as BRP44L and BRP44, and were recently found to form a hetero-oligomeric complex mounting in the inner mitochondrial membrane and facilitating pyruvate into the mitochondrial matrix.7,8 Downregulation of MPC1 was reported in a variety of tumor cell lines and solid tumors.15 Several studies illustrated that cancer cells could reduce the activity of MPC by inhibiting the expression of MPC1 to facilitate tumor growth, and that tumor metastasis could be impaired by enhancing MPC1 expression.14,27 In prostate cancer, it was discovered that COUP-TF II was recruited to the MPC1 promoter to suppress MPC1 expression and overexpression of MPC1 suppressed tumor cell growth and invasion.14 Although studies demonstrated that MPC1 played a critical role in several cancers, the function of MPC1 in GC cells and its prognostic significance in patients with GC remained ambiguous.
In this study, we firstly detected the protein and mRNA levels of MPC1 in GC tissues and cell lines with Western blotting, immunohistochemical staining, and qRT-PCR analyses. Furthermore, mRNA levels of MPC1 in two NCBI GEO datasets (accession numbers: GSE27342 and GSE26942) were explored and a publicly available GC patients database (NCBI GEO database) was analyzed using an online tool (http://www.kmplot.com/gastric) to generate Kaplan–Meier curves. We found that the protein and mRNA levels of MPC1 were downregulated in both GC tissues and cell lines. Our results expanded the knowledge of the expression patterns of MPC1, which were also reported to be downregulated in esophageal squamous cell carcinoma and prostate, colon, kidney, and lung cancers.15,16,28 Our survival analysis demonstrated that low MPC1 expression was an independent prognostic indicator and predicted poor overall survival in patients with GC. To our knowledge, this is the first clinicopathological study to link MPC1 to the clinical outcome of patients with GC.
Considering that aerobic glycolysis has been generally associated with cancer cell proliferation, we evaluated the function of MPC1 in the proliferation of GC cells. Through colony formation assay, we found that overexpression of MPC1 resulted in decreased colony number and size in both SGC7901 and MGC803 cells. Our CCK-8 assay demonstrated that overexpression of MPC1 strongly inhibited the proliferation in both cells. In MGC803 cells, significant difference in proliferation was observed as early as 48 h, whereas in SGC7901 cells, it was first observed at 72 h.
Currently, fascinating and novel studies have shown that aerobic glycolysis is also coupled to a series of other cellular functions contributing to the progression of cancer in addition to proliferation.29 Tumor cells tend to have increased acid production due to aerobic glycolysis and this resulted in normal cell death and extracellular matrix degradation. These changes facilitate filopodia formation and enhance the migration and invasion of cancer cells.30–34 Therefore, we investigated the role of MPC1 in the migrating and invasive capabilities of GC cells. Our results indicated that overexpression of MPC1 significantly decreased the migrating and invasive abilities of GC cells. It was discovered that the inhibition of MPC function by using UK5099 promoted the “stemness” of prostate cancer cells.12 In the murine prostate cancer cell line RM-1, MPC1 gene knockout significantly increased “stemness” features, migrating capabilities, and resistance to both chemotherapy and radiotherapy.22 Furthermore, it was also reported that overexpression of MPC1 in colorectal cancer cell lines resulted in decreased ability of tumorsphere formation, impaired in vivo tumorigenicity, and downregulated stem cell markers.15 Thus, we investigated whether overexpression of MPC1 could have an effect on the stem cell properties in GC cells. We selected Nanog, Sox-2, and Oct-4 as GC stem markers.21 As shown in Figure 5A and B, overexpression of MPC1 decreased the expression of GC stem markers. Furthermore, we found that MPC1 overexpression inhibited the formation of tumorspheres in vitro and tumor-initiating capacity in vivo. Our study indicated that MPC1 overexpression impaired the stem cell-like properties of GC cells.
Conclusion
In conclusion, our study illustrates an important function of MPC1 in the malignant behaviors of GC. We demonstrated that MPC1 expression was downregulated in both GC tissues and cell lines. Low MPC1 expression correlates with poor overall survival in patients with GC. Furthermore, MPC1 overexpression inhibits the proliferation, migration, invasion, and stem cell-like properties of GC cells. Our findings suggest that MPC1 is a novel prognostic marker and tumor suppressor gene for patients with GC, and can be a potential candidate target for the treatment of GC.
Acknowledgment
This work was supported by Science and Technique Development Fund of Sichuan Province (No 140105).
Disclosure
The authors report no conflicts of interest in this work.
References
Ferlay J, Soerjomataram I, Dikshit R, et al. Cancer incidence and mortality worldwide: sources, methods and major patterns in GLOBOCAN 2012. Int J Cancer. 2015;136(5):E359–E386. | ||
Tan AS, Baty JW, Dong LF, et al. Mitochondrial genome acquisition restores respiratory function and tumorigenic potential of cancer cells without mitochondrial DNA. Cell Metab. 2015;21(1):81–94. | ||
Viale A, Pettazzoni P, Lyssiotis CA, et al. Oncogene ablation-resistant pancreatic cancer cells depend on mitochondrial function. Nature. 2014;514(7524):628–632. | ||
LeBleu VS, O’Connell JT, Gonzalez HK, et al. PGC-1alpha mediates mitochondrial biogenesis and oxidative phosphorylation in cancer cells to promote metastasis. Nat Cell Biol. 2014;16(10):992–1003. | ||
Sancho P, Burgos-Ramos E, Tavera A, et al. MYC/PGC-1alpha balance determines the metabolic phenotype and plasticity of pancreatic cancer stem cells. Cell Metab. 2015;22(4):590–605. | ||
Camarda R, Zhou AY, Kohnz RA, et al. Inhibition of fatty acid oxidation as a therapy for MYC-overexpressing triple-negative breast cancer. Nat Med. 2016;22(4):427–432. | ||
Bricker DK, Taylor EB, Schell JC, et al. A mitochondrial pyruvate carrier required for pyruvate uptake in yeast, Drosophila, and humans. Science. 2012;337(6090):96–100. | ||
Herzig S, Raemy E, Montessuit S, et al. Identification and functional expression of the mitochondrial pyruvate carrier. Science. 2012;337(6090):93–96. | ||
Compan V, Pierredon S, Vanderperre B, et al. Monitoring mitochondrial pyruvate carrier activity in real time using a BRET-based biosensor: investigation of the Warburg effect. Mol Cell. 2015;59(3):491–501. | ||
Yang C, Ko B, Hensley CT, et al. Glutamine oxidation maintains the TCA cycle and cell survival during impaired mitochondrial pyruvate transport. Mol Cell. 2014;56(3):414–424. | ||
Vadvalkar SS, Matsuzaki S, Eyster CA, et al. Decreased mitochondrial pyruvate transport activity in the diabetic heart: role of mitochondrial pyruvate carrier 2 (MPC2) acetylation. J Biol Chem. 2017;292(11):4423–4433. | ||
Zhong Y, Li X, Yu D, et al. Application of mitochondrial pyruvate carrier blocker UK5099 creates metabolic reprogram and greater stem-like properties in LnCap prostate cancer cells in vitro. Oncotarget. 2015;6(35):37758–37769. | ||
Li X, Ji Y, Han G, et al. MPC1 and MPC2 expressions are associated with favorable clinical outcomes in prostate cancer. BMC Cancer. 2016;16(1):894. | ||
Wang L, Xu M, Qin J, Lin SC, Lee HJ, Tsai SY, Tsai MJ. MPC1, a key gene in cancer metabolism, is regulated by COUPTFII in human prostate cancer. Oncotarget. 2016;7(12):14673–14683. | ||
Schell JC, Olson KA, Jiang L, et al. A role for the mitochondrial pyruvate carrier as a repressor of the Warburg effect and colon cancer cell growth. Mol Cell. 2014;56(3):400–413. | ||
Li Y, Li X, Kan Q, et al. Mitochondrial pyruvate carrier function is negatively linked to Warburg phenotype in vitro and malignant features in esophageal squamous cell carcinomas. Oncotarget. 2017;8(1):1058–1073. | ||
Edge SB, Compton CC. The American Joint Committee on Cancer: the 7th edition of the AJCC cancer staging manual and the future of TNM. Ann Surg Oncol. 2010;17(6):1471–1474. | ||
Shi H, Chen S, Jin H, et al. Downregulation of MSP58 inhibits growth of human colorectal cancer cells via regulation of the cyclin D1-cyclin-dependent kinase 4-p21 pathway. Cancer Sci. 2009;100(9):1585–1590. | ||
Camp RL, Dolled-Filhart M, Rimm DL. X-tile: a new bio-informatics tool for biomarker assessment and outcome-based cut-point optimization. Clin Cancer Res. 2004;10(21):7252–7259. | ||
Gentleman RC, Carey VJ, Bates DM, et al. Bioconductor: open software development for computational biology and bioinformatics. Genome Biol. 2004;5(10):R80. | ||
Akhavan-Niaki H, Samadani AA. Molecular insight in gastric cancer induction: an overview of cancer stemness genes. Cell Biochem Biophys. 2014;68(3):463–473. | ||
Li X, Han G, Li X, et al. Mitochondrial pyruvate carrier function determines cell stemness and metabolic reprogramming in cancer cells. Oncotarget. 2017;8(28):46363–46380. | ||
Yuan LW, Yamashita H, Seto Y. Glucose metabolism in gastric cancer: The cutting-edge. World J Gastroenterol. 2016;22(6):2046–2059. | ||
Cavalli LR, Varella-Garcia M, Liang BC. Diminished tumorigenic phenotype after depletion of mitochondrial DNA. Cell Growth Differ. 1997;8(11):1189–1198. | ||
Vander Heiden MG, Cantley LC, Thompson CB. Understanding the Warburg effect: the metabolic requirements of cell proliferation. Science. 2009;324(5930):1029–1033. | ||
Eboli ML, Paradies G, Galeotti T, Papa S. Pyruvate transport in tumour-cell mitochondria. Biochim Biophys Acta. 1977;460(1):183–187. | ||
Schell JC, Rutter J. The long and winding road to the mitochondrial pyruvate carrier. Cancer Metab. 2013;1(1):6. | ||
Zhu H, Luo H, Zhu X, Hu X, Zheng L, Zhu X. Pyruvate kinase M2 (PKM2) expression correlates with prognosis in solid cancers: a meta-analysis. Oncotarget. 2017;8(1):1628–1640. | ||
Bettum IJ, Gorad SS, Barkovskaya A, et al. Metabolic reprogramming supports the invasive phenotype in malignant melanoma. Cancer Lett. 2015;366(1):71–83. | ||
Liu JJ, Liu JY, Chen J, et al. Scinderin promotes the invasion and metastasis of gastric cancer cells and predicts the outcome of patients. Cancer Lett. 2016;376(1):110–117. | ||
Lardner A. The effects of extracellular pH on immune function. J Leukoc Biol. 2001;69(4):522–530. | ||
Williams AC, Collard TJ, Paraskeva C. An acidic environment leads to p53 dependent induction of apoptosis in human adenoma and carcinoma cell lines: implications for clonal selection during colorectal carcinogenesis. Oncogene. 1999;18(21):3199–3204. | ||
Gatenby RA, Gawlinski ET. The glycolytic phenotype in carcinogenesis and tumor invasion: insights through mathematical models. Cancer Res. 2003;63(14):3847–3854. | ||
Ward PS, Thompson CB. Metabolic reprogramming: a cancer hallmark even warburg did not anticipate. Cancer Cell. 2012;21(3):297–308. |
Supplementary materials
Overexpression of MPC1 inhibits the proliferation, migration, invasion, and stem cell-like properties of gastric cancer cells
 | Table S1 Clinical features of patients with GC |
 | Table S2 Sequences of primers used for qRT-PCR in this study |
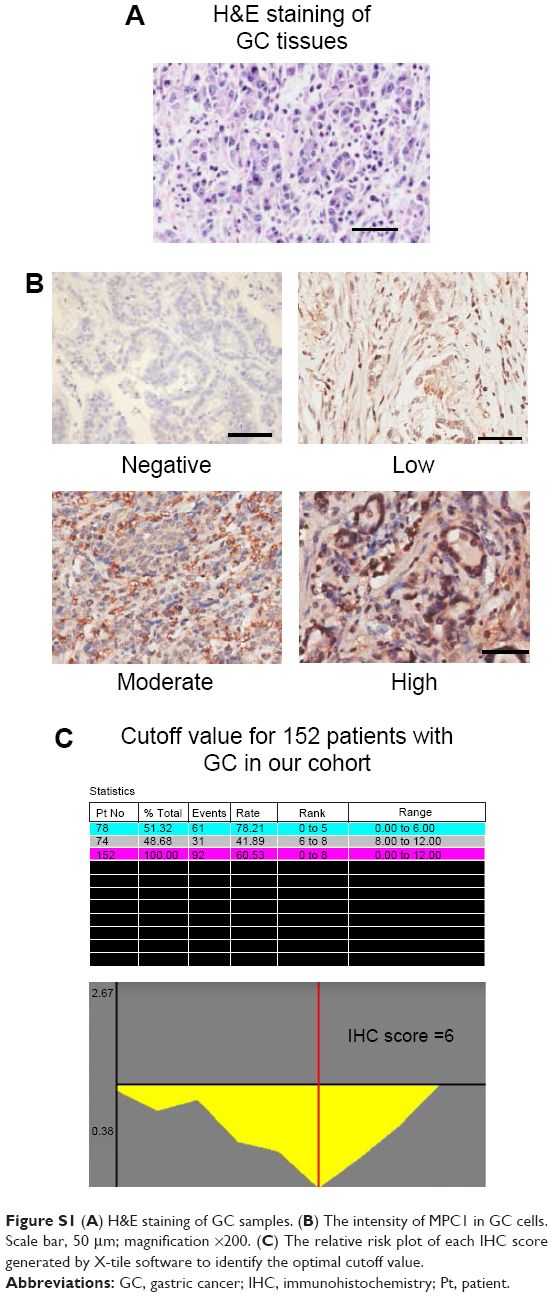 | Figure S1 (A) H&E staining of GC samples. (B) The intensity of MPC1 in GC cells. Scale bar, 50 μm; magnification ×200. (C) The relative risk plot of each IHC score generated by X-tile software to identify the optimal cutoff value. |
 © 2017 The Author(s). This work is published and licensed by Dove Medical Press Limited. The full terms of this license are available at https://www.dovepress.com/terms.php and incorporate the Creative Commons Attribution - Non Commercial (unported, v3.0) License.
By accessing the work you hereby accept the Terms. Non-commercial uses of the work are permitted without any further permission from Dove Medical Press Limited, provided the work is properly attributed. For permission for commercial use of this work, please see paragraphs 4.2 and 5 of our Terms.
© 2017 The Author(s). This work is published and licensed by Dove Medical Press Limited. The full terms of this license are available at https://www.dovepress.com/terms.php and incorporate the Creative Commons Attribution - Non Commercial (unported, v3.0) License.
By accessing the work you hereby accept the Terms. Non-commercial uses of the work are permitted without any further permission from Dove Medical Press Limited, provided the work is properly attributed. For permission for commercial use of this work, please see paragraphs 4.2 and 5 of our Terms.