")
Back to Journals » OncoTargets and Therapy » Volume 12
Overexpression of lncRNA PTENP1 suppresses glioma cell proliferation and metastasis in vitro
Authors Hu S, Xu L, Li L, Luo D, Zhao H, Li D, Peng B
Received 3 August 2018
Accepted for publication 18 October 2018
Published 21 December 2018 Volume 2019:12 Pages 147—156
DOI https://doi.org/10.2147/OTT.S182537
Checked for plagiarism Yes
Review by Single anonymous peer review
Peer reviewer comments 2
Editor who approved publication: Dr Leo Jen-Liang Su
Su Hu,1,* Li Xu,1,2,* Lihua Li,1 Dongdong Luo,1 Hailin Zhao,1 Dan Li,1 Biao Peng1
1Department of Neurosurgery, The Affiliated Cancer Hospital & Institute of Guangzhou Medical University, Guangzhou 510095, Guangdong, People’s Republic of China; 2Department of Neurosurgery, The Central People’s Hospital of Zhanjiang, Zhanjiang 524045, Guangdong, People’s Republic of China
*These authors contributed equally to this work
Background: Glioma is one of the most common malignancies of the central nervous system in adults. The lncRNA PTEN pseudogene-1 (PTENP1) has been reported to play an important role in the development and progression of various cancers. However, the molecular mechanism by which lncRNA PTENP1 affects the development and progression of gliomas remains unclear.
Materials and methods: The levels of PTENP1 expression in glioma tissues and normal brain tissues were detected by quantitative real-time PCR. Cell Counting Kit-8 and 5-ethynyl-2'-deoxyuridine staining assays were performed to detect cell proliferation. Flow cytometry was used to analyze cell cycle progression. Transwell assay and scratch test were used to detect cell migration and invasion, and Western blot studies were performed to detect protein expression.
Results: Our results showed that expression of lncRNA PTENP1 was decreased in glioma tissues when compared with normal brain tissues. Overexpression of PTENP1 suppressed SHG44 and U251 cell proliferation and significantly decreased the numbers of S-phase cells. Furthermore, the invasion and migration abilities of SHG44 and U251 cells were reduced after being transfected with a PTENP1 overexpression plasmid. Overexpression of PTENP1 induced the expression of p21 protein and suppressed the p38 signaling pathway.
Conclusion: Our study investigated the function of PTENP1 in glioma and provided new insights for treating that malignancy.
Keywords: lncRNA PTENP1, glioma, proliferation, invasion, migration
Background
Glioma is the most common malignant tumor of the adult central nervous system (CNS). According to the statistical data provided by the Central Brain Tumor Registry of the US, gliomas account for 28% of all CNS tumors and approximately 80% of malignant intracranial tumors.1 While the cause of glioma remains unclear, increasing evidence suggests that glioma occurrence and progression are associated with abnormal epigenetic regulation. Recent studies revealed that lncRNA plays a key role in the initiation and development of glioma via an epigenetic regulation mechanism.
LncRNA is a type of noncoding RNA with a length exceeding 200 nucleotides and locates in both the cell nucleus and cytoplasm.2 In recent years, lncRNA has gained widespread attention for its potential role in tumor regulation.3–5 The well-known lncRNA, metastasis-associated lung adenocarcinoma transcript 1 (MALAT-1), is highly expressed in ovarian carcinomas and may sponge miR-211 as a competing endogenous RNA. This effect may upregulate PHF19 expression and thereby facilitate ovarian carcinoma progression.6 Phosphatase and tensin homologue (PTEN) is a known tumor suppressor.7 Inactivation or dysregulation of PTEN can cause overactivation of the AKT/FOXO1 signaling pathway, and the subsequent initiation of colorectal cancer.8 LncRNA PTEN pseudogene-1 (PTENP1) is the pseudogene of PTEN and acts as a tumor suppressor. It is highly homologous to PTEN, as it shares a 98% sequence identity with the PTEN mRNA sequence.9,10 However, the expression levels and biological function of PTENP1 in gliomas have not yet been elucidated. MAPK is a serine/threonine protein kinase that plays an important role in human cancers. In human breast cancer, PTENP1 downregulates the phosphorylation of p38 MAPK protein, which indicates that PTENP1 can regulate the proliferation and migration of breast cancer cells by regulating the p38 MAPK signaling pathway.11 Moreover, p21 is an important cell cycle regulator. While p21 inhibits CDK2,12 it also plays essential positive roles by stabilizing cyclin D-CDK4 complexes and allowing their nuclear import.13 However, it remains unknown whether lncRNA PTENP1 can regulate the p38 MAPK and p21 pathways to control the proliferation and migration of glioma cells. Here, we evaluated the possible function of PTENP1 and found that it acts as a tumor suppressor due to its ability to induce p21 expression and suppress the p38 MAPK pathway in gliomas.
Materials and methods
Tissue collection
Tissue samples from 13 low-grade gliomas (LGGs; nine grade I and four grade II tumors) and 10 high-grade gliomas (four grade III and six grade IV tumors) were obtained from the Department of Neurosurgery at the Affiliated Cancer Hospital & Institute of Guangzhou Medical University. The glioma specimens were verified and classified according to the WHO Classification of Tumors by two experienced clinical pathologists. Six samples of normal brain tissue were obtained from patients with mechanical brain injuries. Those tissues were also collected from the Department of Neurosurgery at the Affiliated Cancer Hospital & Institute of Guangzhou Medical University. The study protocol was approved by the Institutional Review Board of the Affiliated Cancer Hospital and Institute of Guangzhou Medical University. Written informed consent was obtained from all patients, and the Ethics Committee of the hospital approved the study protocol.
Cell culture and transfection
SHG44 and U251 human glioma cells were purchased from the American Type Culture Collection (ATCC; Manassas, VA, USA) and cultured in high-glucose DMEM (Thermo Fisher Scientific, Waltham, MA, USA) supplemented with 10% FBS (Thermo Fisher Scientific) at 37°C with 5% CO2. The cells were passaged every 2–3 days, and cells in their log growth phase were used in this study.
A PTENP1 overexpression plasmid (pcDNA3.0-PTENP1), control plasmid (pcDNA3.0), and siRNA (siPTENP1) were purchased from Vipotion (Guangzhou, People’s Republic of China). At 24 hours before transfection, 1×10⁴ cells were cultured in a 12-well culture plate. When cell confluence reached 50%–70%, PTENP1 recombinant plasmids, control plasmids, or siPTENP1 were diluted in serum-free culture medium to a concentration of 100 nmol/L. Next, a 1 mL aliquot of transfection medium was mixed with Lipofectamine 2000 and used for transfection according to a standardized protocol. After 4 hours of transfection, the transfection medium was replaced with fresh standard culture medium.
Fluorescence-based quantitative real-time PCR
TRIzol reagent was used to extract the total RNA from glioma tissues and cells, respectively. A 1 μg sample of total RNA was mixed with 0.5 μL of reverse transcriptase and 0.5 μL of primer in a 10 μL reaction mixture, after which reverse transcription was performed for 10 minutes at 98°C followed by 60 minutes at 37°C. Next, 1 μL of the resulting cDNA was mixed with 1 μL of specific primers in a 20 μL total reaction volume and treated according to the following protocol: denaturation at 94°C for 2 minutes, followed by 40 cycles of heating at 94°C for 20 seconds, 58°C for 20 seconds, and 72°C for 30 seconds. The relative levels of gene expression were normalized to those for GAPDH. Each quantitative PCR analysis was performed on an Applied Biosystems 7500 Sequence Detection system (Thermo Fisher Scientific), and the 2−ΔΔCt method was used to quantify the resulting data. The primers used for PTENP1 were 5′-TCAGAACATGGCATACACCAA-3′ (forward) and 5′-TGATGACGTCCGATTTTTCA-3′ (reverse), and those used for GAPDH were 5′-ACACCCACTCCTCCACCTTT-3′ (forward) and 5′-TTACTCCTTGGAGGCCATGT-3′ (reverse). The experiment was performed in triplicate.
Cell proliferation
Cell proliferation was detected by using the Cell Counting Kit-8 (CCK-8) assay and 5-ethynyl-2′-deoxyuridine (EdU) staining method. SHG44 and U251 cells were trypsinized and resuspended in culture medium. Next, 100 μL of cell suspension containing 1×10⁴ cells was placed in each well of a 96-well plate, after which 10 μL of CCK-8 medium was added to each well. At the predetermined time point, the cell culture medium was discarded and the absorbance of each well was detected at 570 nm. The mean absorbance value of each experimental group was recorded.
The EdU incorporation assay was performed using a Cell-Light™ EdU Apollo® 567 In Vitro Imaging Kit (RiboBio, Guangzhou, People’s Republic of China) according to the manufacturer’s instructions. Briefly, cells were cultured with 100 μL of EdU (50 μM) for 2 hours and then fixed with 4% paraformaldehyde for 30 minutes at 37°C. The cells were then washed twice with PBS containing 0.5% Triton X-100 in a decolorization shaker. Next, 100 μL of Apollo 567 stain reaction buffer was added, and the cells were incubated for 30 minutes while being shielded from light. The cells were then stained with 100 μL of DAPI (1 mg/mL) for 30 minutes at room temperature. The images of the cells were captured using a fluorescence microscope (Olympus Corporation, Tokyo, Japan), and the percentage of EdU-positive cells was calculated using the formula: EdU add-in cells/DAPI-stained cells ×100%.
Cell cycle analysis
After transfection, cells were harvested and the concentration was adjusted to 1×10⁶ cells/mL. They were then treated with reagents provided in a CycleTEST PLUS DNA Reagent Kit (Becton Dickinson, Franklin Lakes, NY, USA) according to the manufacturer’s instructions. Cell cycle status was analyzed by flow cytometry and using propidium iodide (PI) as a specific fluorescent dye probe. The PI fluorescence intensity of 10,000 cells was measured for each sample using a FACScan flow cytometer (Becton Dickinson).
In vitro invasion studies
The Transwell inserts were coated with a layer of Matrigel, and cells that had been transfected in FBS-free medium for 24 hours were cultured on the insert membrane. A complete cell culture medium containing FBS was added to each lower chamber, and the Transwell plates were incubated for 72 hours in a 37°C incubator containing 5% CO2. After incubation, the cells were fixed and stained for imaging and counting. Four microscopic fields for each chamber were randomly selected for viewing, and IPP software was used to count the number of cells that had passed through each insert membrane.
Scratch test
SHG44 and U251 cells in their log growth phase were passaged and transferred into the wells of a six-well plate at a density of 5×10⁵ cells/mL. The cells were then cultured for 48 hours in a 37°C incubator with 5% CO2. Straight scratches were created on the bottom of the wells with a 10 μL pipette tip. PBS solution was used to wash off suspending cells, and the remaining cells were cultured in serum-free medium for another 48 hours. A MOTIC inverted microscope was used for observation and photography, and IPP software was used to analyze the width of the scratches.
Statistical analyses
All experiments were performed in triplicate, and results are presented as mean ± SD. All statistical analyses were performed using IBM SPSS Statistics for Windows, Version 19.0 (IBM Corporation, Armonk, NY, USA). One-way ANOVA or unpaired Student’s t-test was used to analyze the statistical significance of differences between groups. P-values <0.05 were considered statistically significant.
Results
LncRNA PTENP1 expression was decreased in glioma tissues
To investigate how lncRNA PTENP1 functions in glioma, we first detected the levels of lncRNA PTENP1 expression in glioma tissues. Our quantitative real-time PCR results showed that lncRNA PTENP1 expression was decreased in the glioma tissues when compared with its expression in normal brain tissue (Figure 1A). We also investigated the relationship between lncRNA PTENP1 expression and the degree of glioma malignancy and found that lncRNA PTENP1 was expressed at lower levels in glioblastoma multiforme patients when compared with LGG patients (Figure 1B). This result suggested that lncRNA PTENP1 may play an important role in glioma.
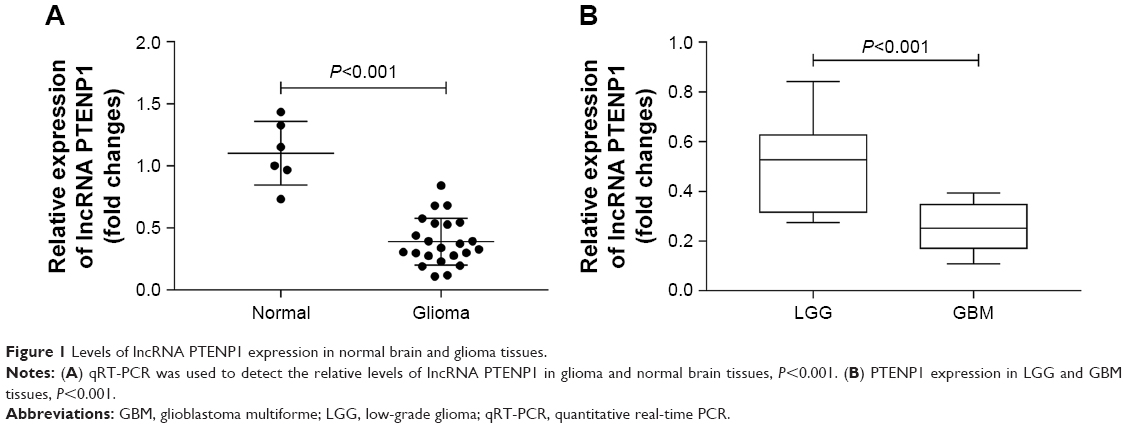 | Figure 1 Levels of lncRNA PTENP1 expression in normal brain and glioma tissues. |
Elevated lncRNA PTENP1 expression inhibited the proliferation of glioma cells
To further investigate how lncRNA PTENP1 functions in glioma, the lncRNA PTENP1 overexpression plasmid pcDNA3.0-PTENP1 was transfected into glioma cells. A subsequent analysis showed that PTENP1 expression was significantly increased in SHG44 and U251 cells after they had been transfected with pcDNA3.0-PTENP1. Furthermore, expression of lncRNA PTENP1 in PTENP1-transfected cells was altered after transfection with siPTENP1 (Figure 2A). CCK-8 assay and EdU staining results showed that overexpression of PTENP1 suppressed the proliferative abilities of SHG44 and U251 cells, and the suppressive effect of PTENP1 was decreased after siPTENP1 transfection (Figure 2B–D). These results revealed that elevated lncRNA PTENP1 levels could suppress the proliferation of SHG44 and U251 cells.
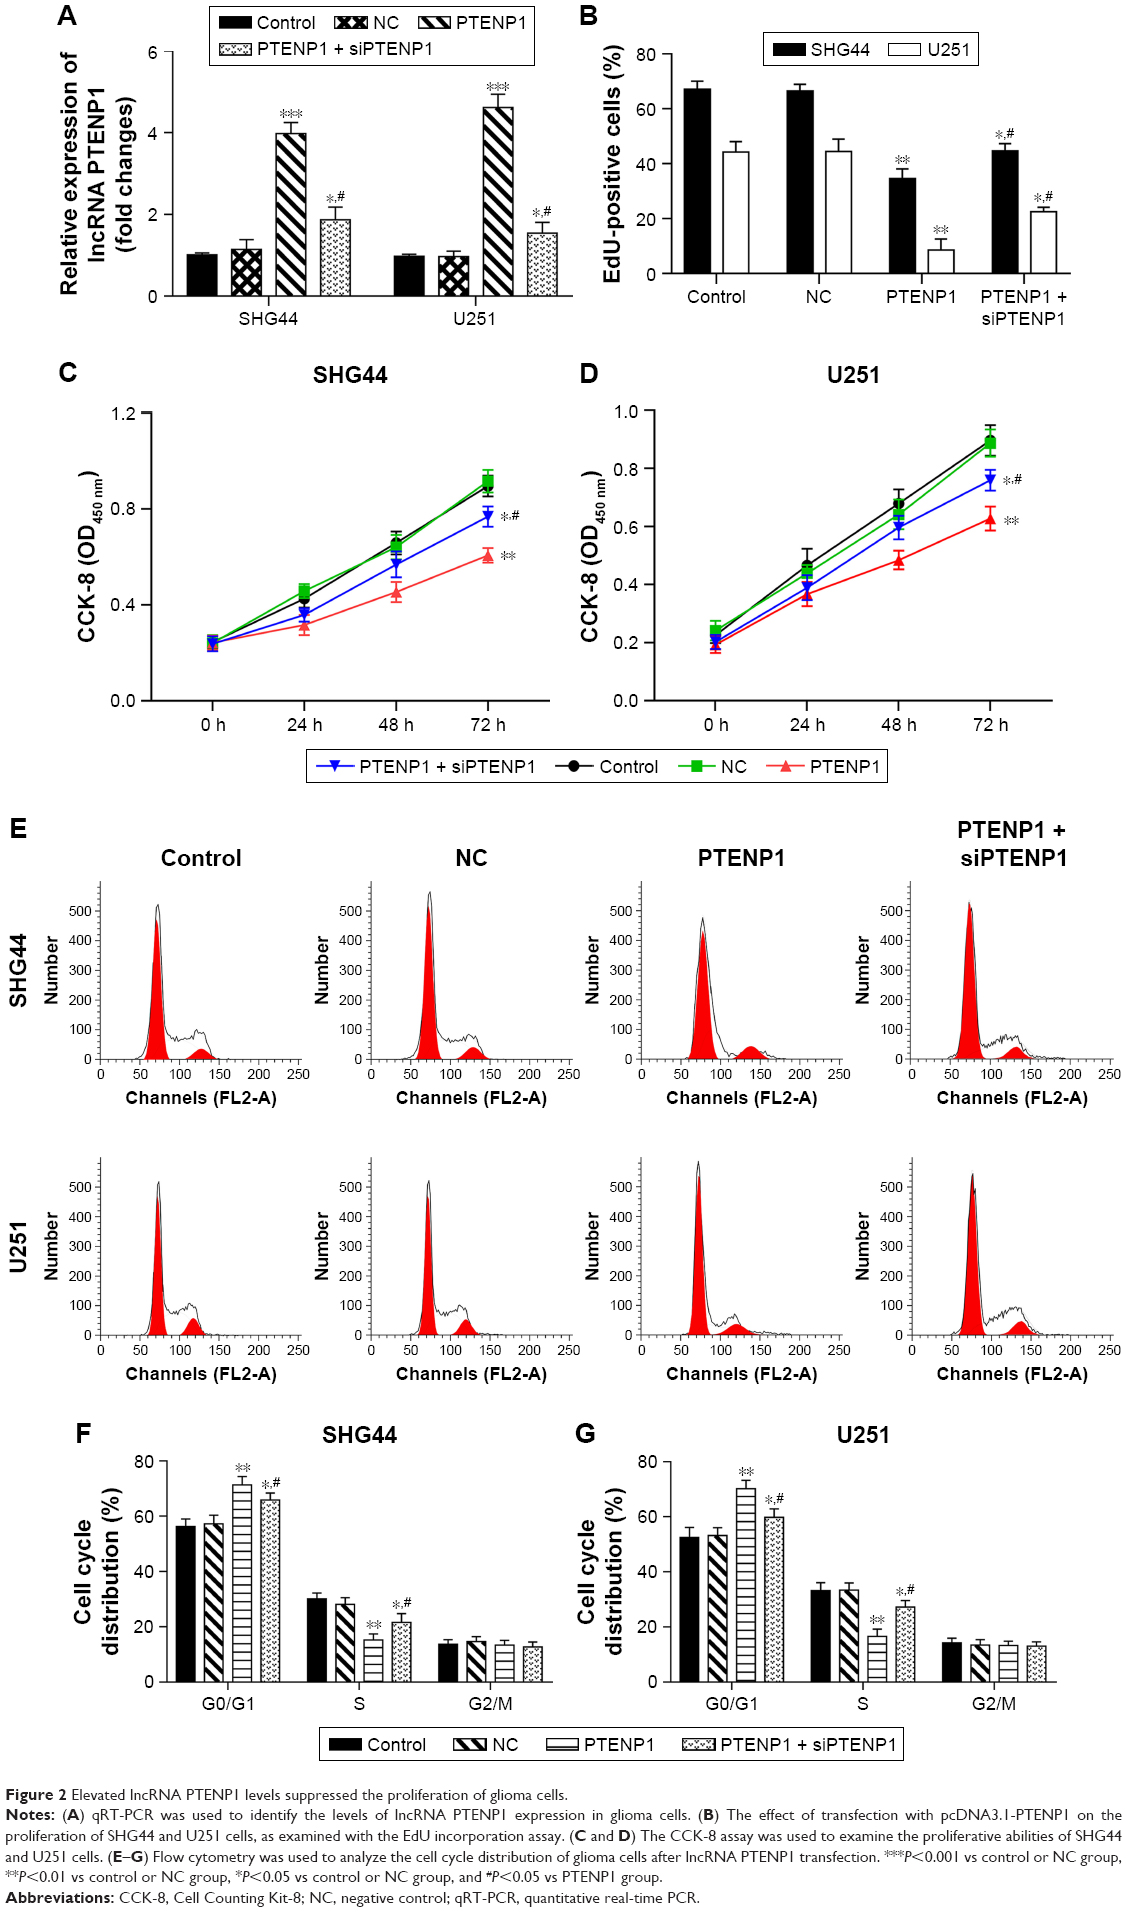 | Figure 2 Elevated lncRNA PTENP1 levels suppressed the proliferation of glioma cells. |
Upregulation of lncRNA PTENP1 induced cell cycle arrest in glioma cells
SHG44 and U251 cells were transfected with lncRNA PTENP1, and their cell cycles were then analyzed by flow cytometry. The data revealed that overexpression of lncRNA PTENP1 increased the numbers of SHG44 and U251 cells in G1 phase and decreased the numbers of cells in S phase. Furthermore, knockdown of PTENP1 decreased the prevalence of G1-phase cells and increased the prevalence of S-phase cells in samples of PTENP1-transfected SHG44 and U251 cells (Figure 2E–G). This result suggested that overexpression of lncRNA PTENP1 could induce cell cycle arrest in glioma cells.
Upregulation of lncRNA PTENP1 inhibited the invasion of glioma cells
Transwell assays were performed to detect the effect of lncRNA PTENP1 on cell invasion. The Transwell experiments showed that the invasion abilities of SHG44 and U251 cells transfected with pcDNA3.0-PTENP1 were significantly suppressed when compared with those of cells in the control group and mock-transfected group, and knockdown of PTENP1 could increase the invasion abilities of PTENP1-transfected SHG44 and U251 cells (Figure 3A and B). These data indicated that upregulation of lncRNA PTENP1 could significantly inhibit the invasion ability of glioma cells.
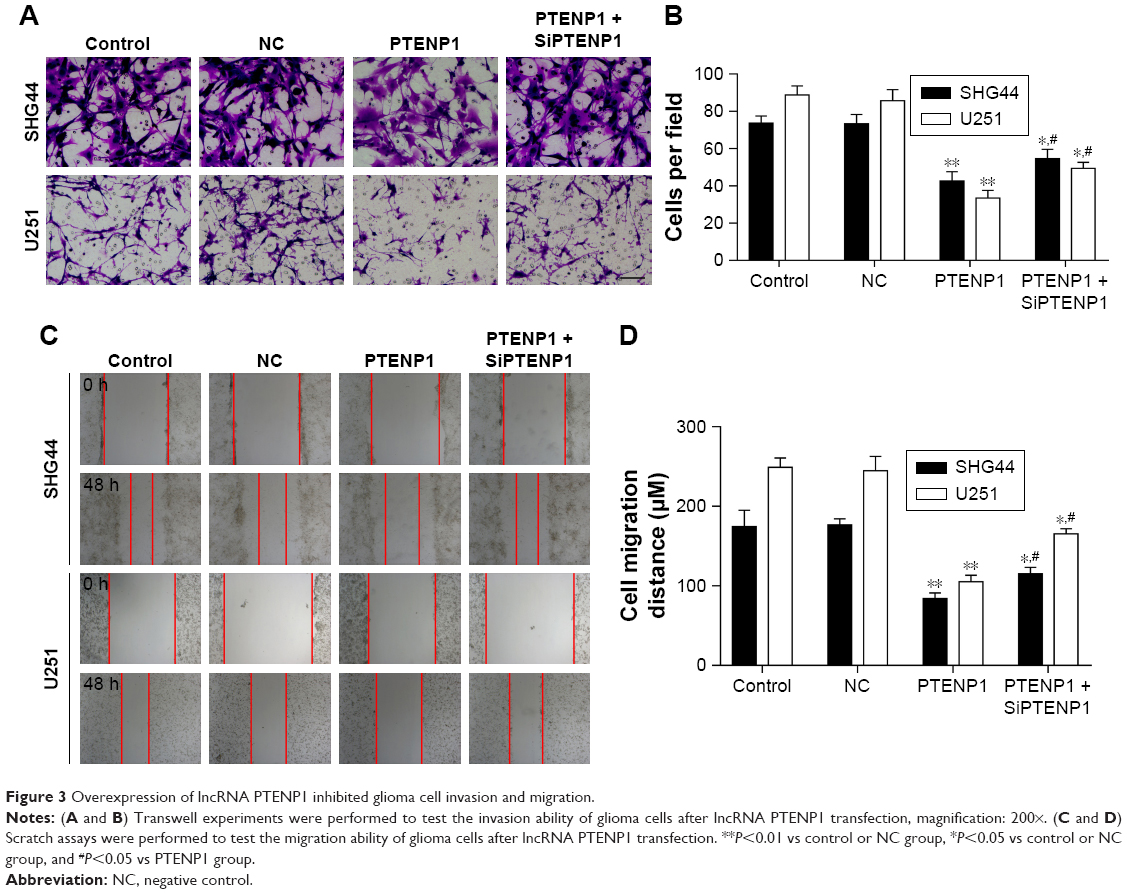 | Figure 3 Overexpression of lncRNA PTENP1 inhibited glioma cell invasion and migration. |
LncRNA PTENP1 inhibited the migration ability of glioma cells
We next investigated how lncRNA PTENP1 affects the migration ability of glioma cells. SHG44 and U251 cells were transfected with lncRNA PTENP1, after which their migration abilities were tested with the scratch assay. The results showed that the width of lncRNA PTENP1 transfection group was greater than that of the control group for both SHG44 and U251 cells, and knockdown of PTENP1 could decrease the width of the PTENP1-transfected SHG44 and U251 cells (Figure 3C and D). These results suggested that lncRNA PTENP1 could inhibit the migration ability of glioma cells.
LncRNA PTENP1 promoted p21 expression and blocked the p38 MAPK signaling pathway
We next investigated how lncRNA PTENP1 affects the p38 MAPK signaling pathway. Western blot studies showed that PTENP1 overexpression increased p21 levels and decreased the levels of phosphorylated p38 (Figure 4). This result indicated that lncRNA PTENP1 might exert its effect by activating the p38 MAPK pathway.
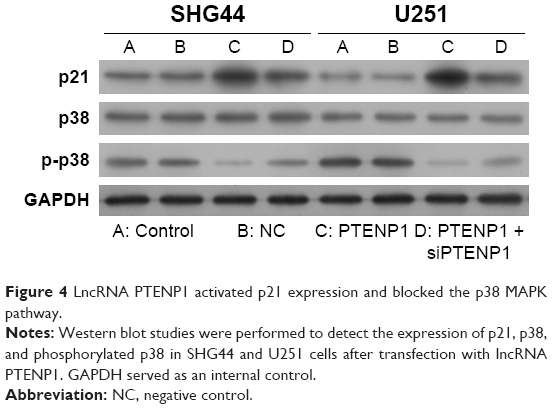 | Figure 4 LncRNA PTENP1 activated p21 expression and blocked the p38 MAPK pathway. |
A p38 agonist ameliorated the inhibitory effect of PTENP1 on glioma cell proliferation and invasion
The levels of phosphorylated p38 in PTENP1-transfected SHG44 and U251 cells became increased after treatment with the p38 agonist P79350 (Figure 5). Furthermore, the proliferative abilities of PTENP1-transfected SHG44 and U251 cells were also increased after P79350 treatment (Figure 6A–C). Moreover, after being treated with P79350, the numbers of G1-phase cells among the transfected SHG44 and U251 cells decreased while the numbers of S-phase cells increased (Figure 6D–F). The results of the Transwell invasion assay and wound healing assay showed increases in the migration and invasion abilities of PTENP1-transfected SHG44 and U251 cells that had been treated with P79350 (Figure 7).
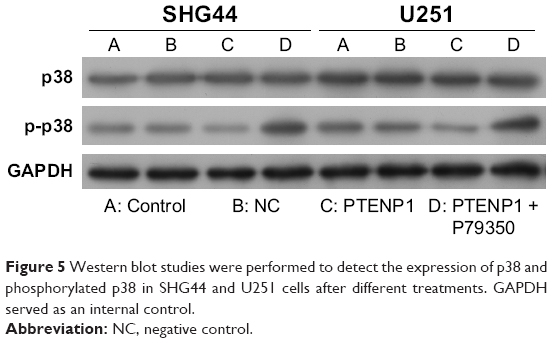 | Figure 5 Western blot studies were performed to detect the expression of p38 and phosphorylated p38 in SHG44 and U251 cells after different treatments. GAPDH served as an internal control. |
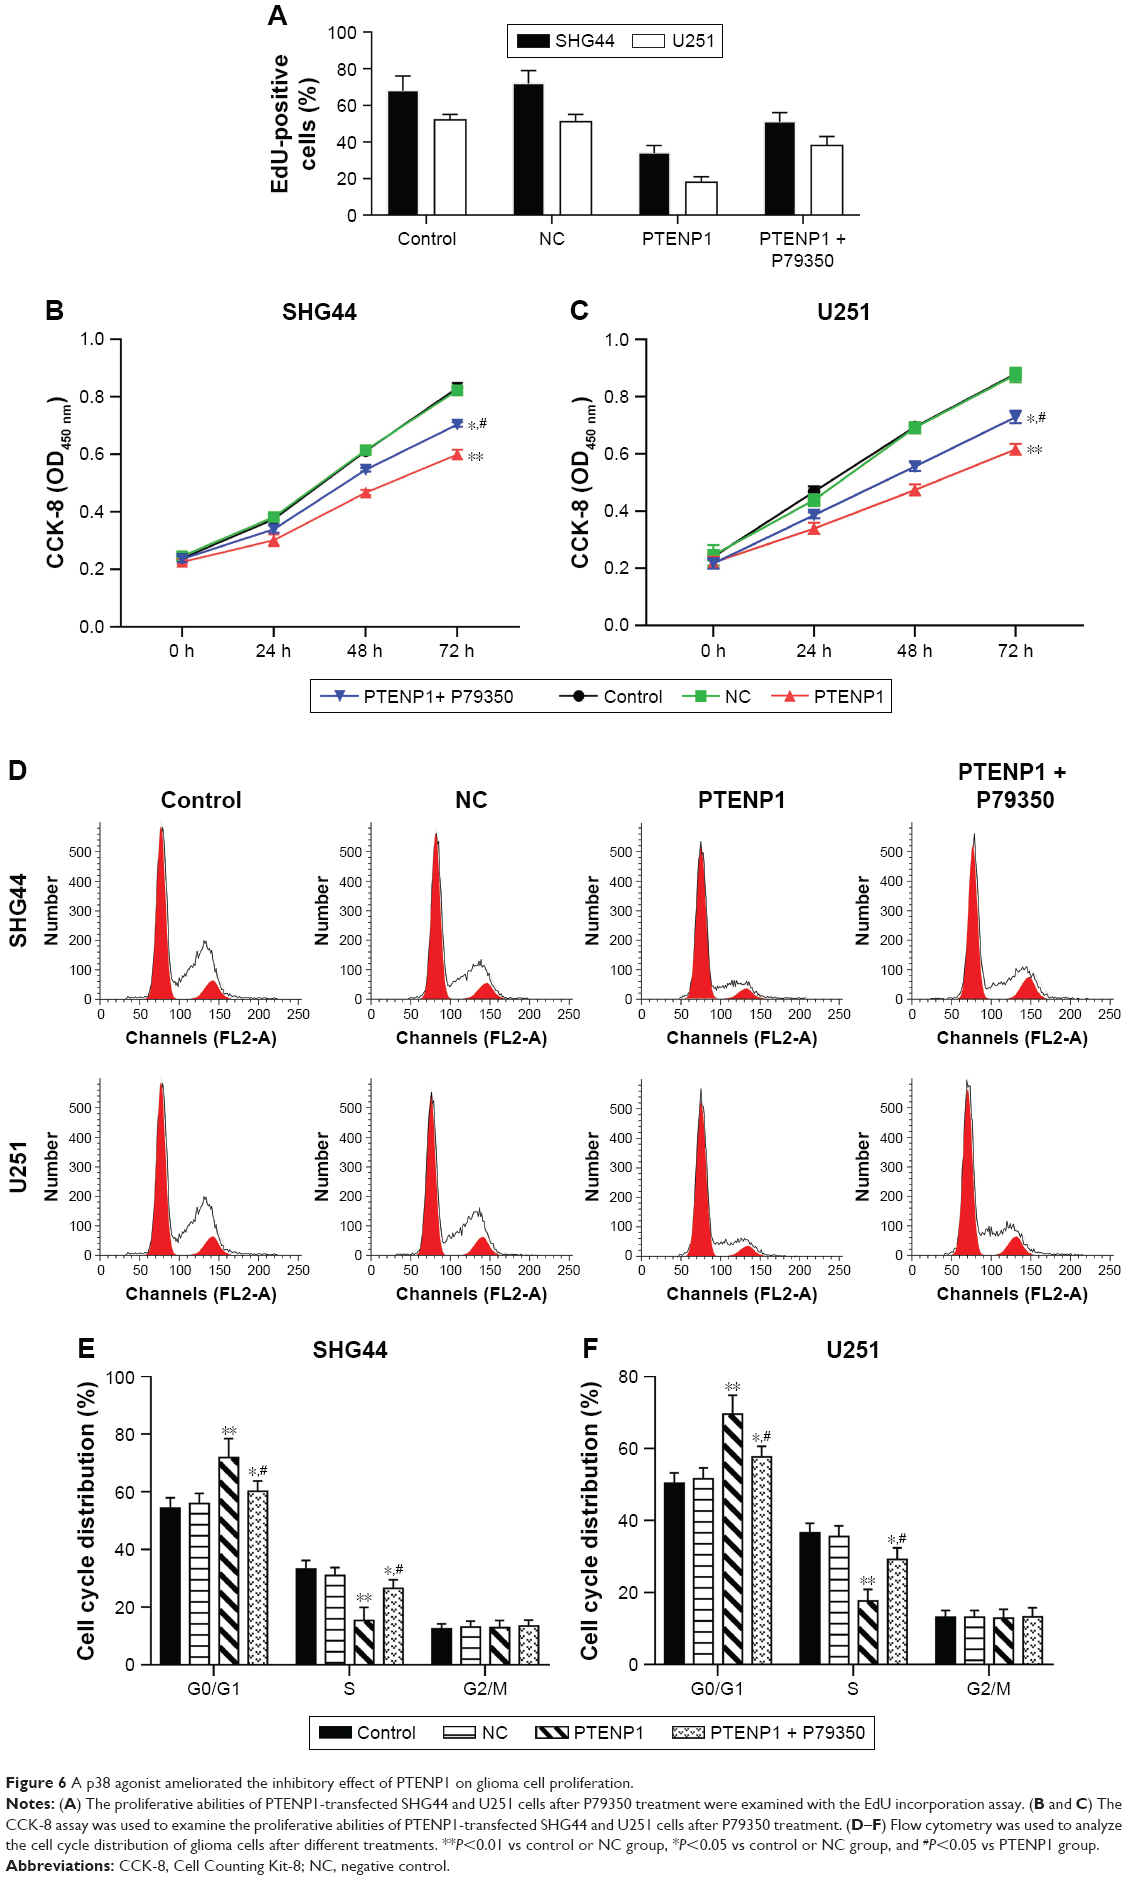 | Figure 6 A p38 agonist ameliorated the inhibitory effect of PTENP1 on glioma cell proliferation. |
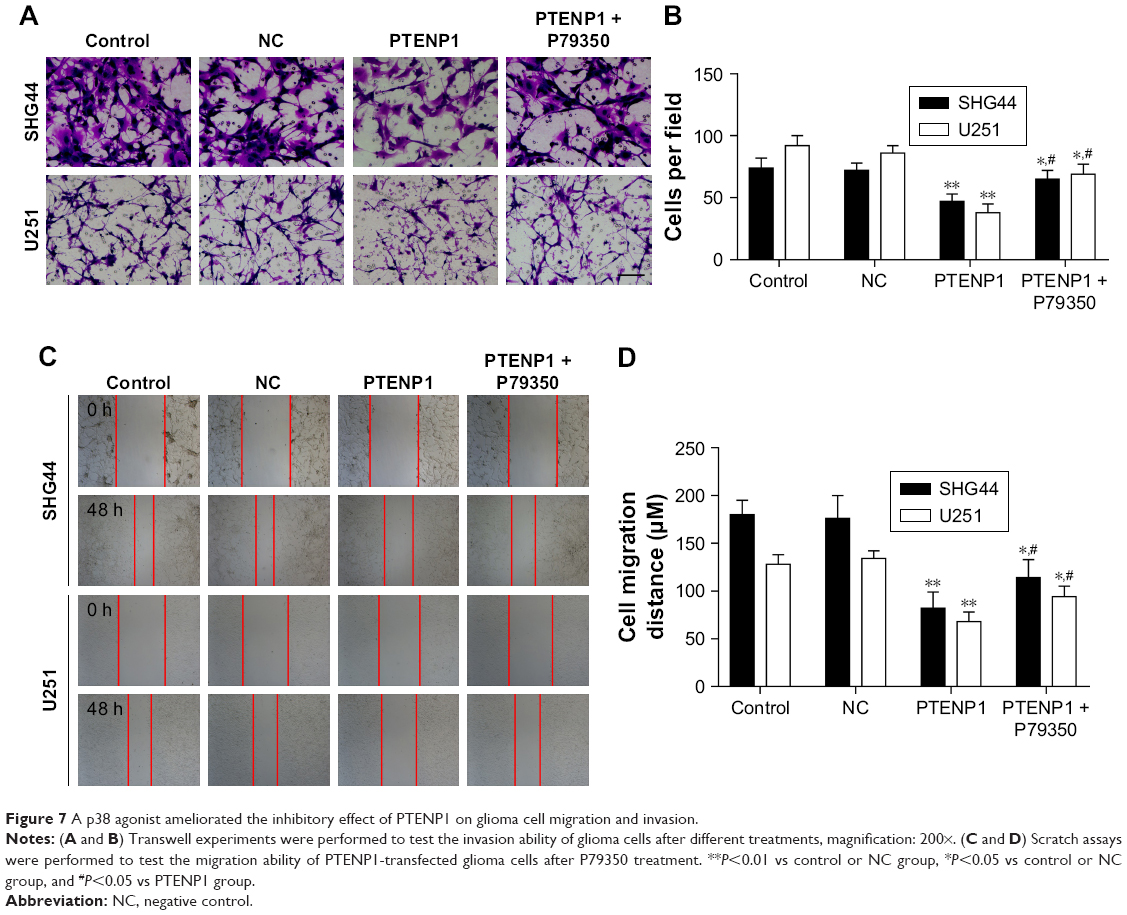 | Figure 7 A p38 agonist ameliorated the inhibitory effect of PTENP1 on glioma cell migration and invasion. |
Discussion
LncRNAs are a type of noncoding RNAs with a length of >200 nucleotides. Several studies have proven that lncRNAs can regulate cell differentiation, apoptosis, cell cycle, and proliferation and migration of malignant tumor cells, and also confirmed their involvement in regulating transcription activity, chromatin modifications, and intranuclear interference. Previous studies also showed that lncRNA may play an important role in the initiation and progression of glioma. Shi et al14 discovered that lncRNA H19 is expressed at significantly higher levels in high-grade gliomas when compared with LGGs. Furthermore, the invasion and migration capabilities of U87 and U251 glioma cells significantly decreased when H19 expression was suppressed.14 Zhang and Leung15 used siRNA to knockdown the expression of lncRNA CRNDE gene in D54, U87, and U251 glioma cells, and found that such knock down led to an inhibition of cell proliferation and induction of cell apoptosis, and also prevented the invasion of glioma cells. Wang et al16 discovered that the levels of lncRNA MEG3 expression in normal brain tissues were significantly higher than those in glioma tissues, and that overexpression of MEG3 could suppress the proliferation of U251 and U87 cells and lead to apoptosis. LncRNA PTENP1 is the pseudogene of PTEN, with a highly (95%) homologous region at the 3′ UTR ends. Poliseno et al17 discovered that these two genes have the same microRNA annealing point in that region. Those studies also proved that PTENP1 could competitively bind to microRNA and prevent microRNA from negatively controlling PTEN, thus preserving the antitumor function of PTEN. In clear cell kidney carcinoma, PTENP1 expression is suppressed by miR-21, resulting in enhanced cancer cell proliferation, invasion, and metastasis in vitro.18 In hepatocellular carcinoma, the levels of both PTENP1 and PTEN are decreased, and they act as ceRNAs to downregulate miR-193a, which targets the cancer suppression gene PTEN; this downregulation of miR-192a leads to the eventual suppression of cancer.19 The levels of PTENP1 expression in liver cancer cells are significantly lower than those in normal hepatocytes. When PTENP1 is overexpressed in liver cancer cells, it helps to modulate the PI3K/AKT signaling pathway, leading to the suppression of cancer cell proliferation, migration, and invasion, resulting in cell autophagy and apoptosis.20 However, little is known about the role of PTENP1 in suppressing glioma cell proliferation and migration.
In this study, we detected the levels of PTENP1 expression in glioma tissues and normal brain tissues from human patients and found that PTENP1 was expressed at lower levels in the glioma tissues when compared with the normal brain tissues. This indicates that PTENP1 may play a crucial role in glioma, which is consistent with published results from previous studies conducted on other cancers.21,22 We also found that elevated levels of lncRNA PTENP1 markedly suppressed the proliferation of SHG44 and U251 cells. A cell cycle analysis showed that an upregulation of lncRNA PTENP1 expression could increase the percentage of SHG44 and U251 cells in G1 phase and decrease the percentage of cells in S phase. Furthermore, overexpression of lncRNA PTENP1 could suppress glioma cell migration and invasion. A previous study showed that lncRNA PTENP1 inhibited breast cancer cell proliferation and migration by activating the MAPK signaling pathway.23 Therefore, we investigated the effect of lncRNA PTENP1 on the p38 MAPK pathway. The results showed that elevated levels of lncRNA PTENP1 could upregulate p21 expression and downregulate phosphorylated p38 expression in both SHG44 and U251 cells. These results suggested that lncRNA PTENP1 exerts its effect by activating the MAPK pathway.
Conclusion
In summary, we demonstrated that the levels of lncRNA PTENP1 in glioma tissues were significantly lower than those in normal brain tissues. An elevation of lncRNA PTENP1 levels induced by pcDNA3.0-PTENP1 transfection markedly suppressed the proliferation of glioma cells and reduced their migration and invasion abilities. All the above showed that PTENP1 could suppress the proliferation and migration of glioma cells by increasing p21 expression and inhibiting the p38 MAKP pathway. These findings indicate that PTENP1 plays a critical role in glioma progression and may aid in the development of new diagnostic and therapeutic approaches for glioma.
Acknowledgment
This work was funded by the Science and Technology Program of Guangzhou (201707010380) and the Guangzhou Key Medical Discipline Construction Project Fund.
Disclosure
The authors report no conflicts of interest in this work.
References
Sun Y, Wang Z, Zhou D. Long non-coding RNAs as potential biomarkers and therapeutic targets for gliomas. Med Hypotheses. 2013;81(2):319–321. | ||
Rinn JL, Chang HY. Genome regulation by long noncoding RNAs. Annu Rev Biochem. 2012;81:145–166. | ||
Zhou S, Wang J, Zhang Z. An emerging understanding of long noncoding RNAs in kidney cancer. J Cancer Res Clin Oncol. 2014;140(12):1989–1995. | ||
Ren S, Liu Y, Xu W, et al. Long noncoding RNA MALAT-1 is a new potential therapeutic target for castration resistant prostate cancer. J Urol. 2013;190(6):2278–2287. | ||
Tian Y, Zhang X, Hao Y, Fang Z, He Y. Potential roles of abnormally expressed long noncoding RNA UCA1 and Malat-1 in metastasis of melanoma. Melanoma Res. 2014;24(4):335–341. | ||
Tao F, Tian X, Ruan S, Shen M, Zhang Z. miR-211 sponges lncRNA MALAT1 to suppress tumor growth and progression through inhibiting PHF19 in ovarian carcinoma. FASEB J. Epub 2018 Jun 6. | ||
Koschmann C, Farooqui Z, Kasaian K, et al. Multi-focal sequencing of a diffuse intrinsic pontine glioma establishes PTEN loss as an early event. NPJ Precis Oncol. 2017;1(1):32. | ||
Pan S, Deng Y, Fu J, et al. Decreased expression of ARHGAP15 promotes the development of colorectal cancer through PTEN/AKT/FOXO1 axis. Cell Death Dis. 2018;9(6):673. | ||
Fujii GH, Morimoto AM, Berson AE, Bolen JB. Transcriptional analysis of the PTEN/MMAC1 pseudogene, psiPTEN. Oncogene. 1999;18(9):1765–1769. | ||
Dahia PL, FitzGerald MG, Zhang X, et al. A highly conserved processed PTEN pseudogene is located on chromosome band 9p21. Oncogene. 1998;16(18):2403–2406. | ||
Chen S, Wang Y, Zhang JH, et al. Long non-coding RNA PTENP1 inhibits proliferation and migration of breast cancer cells via AKT and MAPK signaling pathways. Oncol Lett. 2017;14(4):4659–4662. | ||
Hengst L, Göpfert U, Lashuel HA, Reed SI. Complete inhibition of Cdk/cyclin by one molecule of p21(Cip1). Genes Dev. 1998;12(24):3882–3888. | ||
LaBaer J, Garrett MD, Stevenson LF, et al. New functional activities for the p21 family of CDK inhibitors. Genes Dev. 1997;11(7):847–862. | ||
Shi Y, Wang Y, Luan W, et al. Long non-coding RNA H19 promotes glioma cell invasion by deriving miR-675. PLoS One. 2014;9(1):e86295. | ||
Zhang XQ, Leung GK. Long non-coding RNAs in glioma: functional roles and clinical perspectives. Neurochem Int. 2014;77:78–85. | ||
Wang P, Ren Z, Sun P. Overexpression of the long non-coding RNA MEG3 impairs in vitro glioma cell proliferation. J Cell Biochem. 2012;113(6):1868–1874. | ||
Poliseno L, Salmena L, Zhang J, Carver B, Haveman WJ, Pandolfi PP. A coding-independent function of gene and pseudogene mRNAs regulates tumour biology. Nature. 2010;465(7301):1033–1038. | ||
Yu G, Yao W, Gumireddy K, et al. Pseudogene PTENP1 functions as a competing endogenous RNA to suppress clear-cell renal cell carcinoma progression. Mol Cancer Ther. 2014;13(12):3086–3097. | ||
Qian YY, Li K, Liu QY, Liu ZS. Long non-coding RNA PTENP1 interacts with miR-193a-3p to suppress cell migration and invasion through the PTEN pathway in hepatocellular carcinoma. Oncotarget. 2017;8(64):107859–107869. | ||
Kovalenko TF, Sorokina AV, Ozolinya LA, Patrushev LI. Methylation of the pseudogene PTENP1 5′-terminal region in endometrial cancer and hyperplasia. Russ J Bioorgan Chem. 2013;39(4):397–405. | ||
Shi X, Tang X, Su L. Over-expression of long non-coding RNA PTENP1 inhibits cell proliferation and migration via suppression of miR-19b in breast cancer cells. Oncol Res. 2017;26(6):869–878. | ||
Li RK, Gao J, Guo LH, Huang GQ, Luo WH. PTENP1 acts as a ceRNA to regulate PTEN by sponging miR-19b and explores the biological role of PTENP1 in breast cancer. Cancer Gene Ther. 2017;24(7):309–315. | ||
Chen S, Wang Y, Zhang JH, et al. Long non-coding RNA PTENP1 inhibits proliferation and migration of breast cancer cells via AKT and MAPK signaling pathways. Oncol Lett. 2017;14(4):4659–4662. |
 © 2018 The Author(s). This work is published and licensed by Dove Medical Press Limited. The full terms of this license are available at https://www.dovepress.com/terms.php and incorporate the Creative Commons Attribution - Non Commercial (unported, v3.0) License.
By accessing the work you hereby accept the Terms. Non-commercial uses of the work are permitted without any further permission from Dove Medical Press Limited, provided the work is properly attributed. For permission for commercial use of this work, please see paragraphs 4.2 and 5 of our Terms.
© 2018 The Author(s). This work is published and licensed by Dove Medical Press Limited. The full terms of this license are available at https://www.dovepress.com/terms.php and incorporate the Creative Commons Attribution - Non Commercial (unported, v3.0) License.
By accessing the work you hereby accept the Terms. Non-commercial uses of the work are permitted without any further permission from Dove Medical Press Limited, provided the work is properly attributed. For permission for commercial use of this work, please see paragraphs 4.2 and 5 of our Terms.