")
Back to Journals » OncoTargets and Therapy » Volume 13
Overexpression of GIHCG is Associated with a Poor Prognosis and Immune Infiltration in Hepatocellular Carcinoma
Authors Xiao S, Huang S, Yang J
Received 16 July 2020
Accepted for publication 18 October 2020
Published 12 November 2020 Volume 2020:13 Pages 11607—11619
DOI https://doi.org/10.2147/OTT.S271966
Checked for plagiarism Yes
Review by Single anonymous peer review
Peer reviewer comments 2
Editor who approved publication: Prof. Dr. Geoffrey Pietersz
Siyu Xiao,1,* Shanzhou Huang,2,* Jie Yang3
1Department of Clinical Laboratory, The Sixth Affiliated Hospital, Sun Yat‐sen University, Guangzhou, People’s Republic of China; 2Department of General Surgery, Guangdong Provincial People’s Hospital, Guangdong Academy of Medical Sciences, School of Medicine, South China University of Technology, Guangzhou, People’s Republic of China; 3Guangdong Lung Cancer Institute, Guangdong Provincial People’s Hospital, Guangdong Academy of Medical Sciences, School of Medicine, South China University of Technology, Guangzhou, People’s Republic of China
*These authors contributed equally to this work
Correspondence: Jie Yang
Guangdong Lung Cancer Institute, Guangdong Provincial People’s Hospital, Guangdong Academy of Medical Sciences, School of Medicine, South China University of Technology, No. 106, 2nd Zhongshan Road, Guangzhou, People’s Republic of China
Email [email protected]
Purpose: Hepatocellular carcinoma (HCC) is one of the most commonly diagnosed digestive cancers and the fourth leading cause of death worldwide. Long noncoding RNAs (lncRNAs) with key roles in HCC development and progression have emerged and are used in the diagnosis and prognostic prediction of HCC. The lncRNA gradually increased during hepatocarcinogenesis (GIHCG) is a novel lncRNA with aberrant expression in many tumors, but its prognostic value and biological role in HCC have not been fully studied. Thus, the aim of this study was to explore the expression pattern and potential biological role of GIHCG in HCC.
Patients and Methods: The expression pattern of GIHCG in HCC was analyzed in our HCC cohort and validated in The Cancer Genome Atlas (TCGA) database. To assess the prognostic value of GIHCG, survival analyses and Cox regression analyses were carried out in two HCC cohorts. Functional enrichment analysis was used to predict the gene sets and pathways related to aberrant GIHCG expression. Furthermore, the relationship between GIHCG expression and immune infiltration in HCC was analyzed.
Results: GIHCG was highly expressed in HCC tissues compared with normal liver tissues. In addition, high GIHCG expression was significantly correlated with inferior clinicopathological characteristics and shorter survival times. High GIHCG expression was an independent prognostic factor for overall survival and disease-free survival in the HCC cohort in our center and in the TCGA-LIHC cohort. Hallmark terms such as “G2M checkpoint”, “MYC targets” and “DNA repair” were enriched in the GIHCG high-expression groups. High GIHCG expression negatively correlated with the infiltration of memory CD4+ and CD8+ T cells, natural killer cells, macrophages, dendritic cells, neutrophils and monocytes.
Conclusion: The findings of our study indicate that GIHCG is a biomarker that can be used to predict the prognosis of HCC patients and is correlated with immune cell infiltration in HCC.
Keywords: GIHCG, prognosis, immune cell infiltration
Introduction
Hepatocellular carcinoma (HCC) is the third most common digestive cancer and the fourth leading cause of cancer death worldwide.1 The 5-year survival rate of HCC is lower than 20%,2 which is primarily attributed to the difficulty of early diagnosis via current biomarkers.3 As a result, most HCC patients are diagnosed at an advanced stage, at which point the opportunity to receive curative treatments is lost.4,5 Moreover, even for those undergoing surgical resection, recurrence remains a major problem, and half of the patients with recurrence die within 1 year. Thus, an urgent need to develop new approaches for early diagnosis, real-time monitoring, and effective treatment of HCC remains.
Long noncoding RNAs (lncRNAs) make up a large class of noncoding transcripts that are usually greater than 200 nucleotides in length. Multiple studies have reported that aberrant lncRNA expression affects tumor cell growth, apoptosis, invasion, and metastasis. LncRNAs may be useful in cancer diagnosis and prognostic evaluations and some functional lncRNAs may serve as potential therapeutic targets based on their key roles in vital biological processes of tumor development and progression.6–12
One lncRNA known as gradually increased during hepatocarcinogenesis (GIHCG) is a functional lncRNA that was recently identified by Sui et al in HCC.13 The GIHCG gene alias is GIHCG inhibitor of miR-200b/200a/429 expression. The GIHCG gene has 4727 bases and is located on 12q14.1, and the Ensembl ID of GIHCG is ENSG00000257698 (Ensembl version: ENSG00000257698.2). The former transcript name was RP11-620J15.3 (Ensembl version: ENSG00000257698.1). By epigenetically inhibiting miR-200b/a/429 expression, Sui et al showed that GIHCG affects the proliferation, migration, and invasion of HCC cell lines.13 In addition, GIHCG has been reported to be overexpressed in and promote tumor progression of renal cell carcinoma, tongue squamous cell carcinoma, ovarian cancer, cervical cancer, breast cancer, colorectal cancer and gastric cancer.14–21
We hypothesized that GIHCG may act as an oncogene during tumorigenesis, however the prognostic value of GIHCG and its possible biological functions in HCC have yet to be fully assessed. Our study aims to assess the prognostic value of GIHCG in both the public HCC database and our clinical HCC cohort and to explore potential pathway correlations with GIHCG expression.
Patients and Methods
SYSU HCC Sample Collection and Follow-Up
The present study included 120 patients with HCC who underwent R0 surgical resection between July 2013 and December 2014 from the First Affiliated Hospital, Sun Yat-sen University (SYSU). One hundred HCC samples were formalin-fixed and paraffin-embedded as the main evaluation cohort. The other 20 fresh HCC tissues with paired adjacent normal tissue (ANT) samples were obtained and stored in RNAlater solution (Invitrogen, USA) immediately after resection and then frozen in liquid nitrogen until further use, as previously described.22 None of the enrolled patients received any radiotherapy or chemotherapy before surgery, and all specimens were confirmed by pathology. Data on the clinical and pathological characteristics, such as tumor stage, differentiation grade, presentation of tumor thrombi, HBsAg status and AFP level, were retrieved from the inpatient database. Overall survival (OS) was defined as the period from resection to death or the last follow-up. Disease-free survival (DFS) was defined as the period between surgery and death or first confirmed relapse until the last follow-up date in December 2018.
This study conformed to the 1964 Declaration of Helsinki and was approved by the Ethics Committee of the First Affiliated Hospital, Sun Yat-sen University. Written informed consent was obtained from all patients for the use of their tissue samples.
RNA Extraction and GIHCG Expression Measurement
Total RNA was extracted from approximately 100 mg of tissue using the Qiagen RNeasy Mini Kit according to the manufacturer’s instructions as previously described.23 To detect GIHCG expression in HCC and ANTs, Quantitative real-time PCR (qRT-PCR) was performed using the Power SYBR Green PCR Master Mix (Applied Biosystems, USA) according to the manufacturer’s instructions with gene-specific primers. Primers were designed as follows:
GIHCG forward primer, 5′-CTTTCAAGAAGTTTGGCTGTC-3′; GIHCG reverse primer: 5′-GCTCATTCAACGGATAAGTC-3′; GAPDH forward primer: 5′-TGTGGGCATCAATGGATTTGG-3′; GAPDH reverse primer: 5′-ACACCATGTATTCCGGGTCAAT-3′.
Chromogenic in situ Hybridization (CISH)
To evaluate the expression level of GIHCG, CISH was applied to SYSU HCC samples. All slices were fixed for 2–12 hrs with 4% paraformaldehyde (DEPC, Servicebio, Wuhan, China), incubated in proteinase K (Servicebio) for 30 mins and rinsed three times with PBS (Servicebio). Next, the samples were prehybridized in hybridization buffer (Servicebio) at 37°C for 1 hr. Then, fresh hybridization buffer containing 8 ng/mL of the corresponding probe was used to replace the prehybridization buffer, and the samples were incubated at 37°C overnight. Finally, nuclear fast red (Servicebio) staining was performed to visualize the cell nuclei of the samples, and the samples were mounted in neutral balsam (Sinopharm Chemical Reagent Co., Ltd) and examined by bright-field microscopy. Based on the staining intensity, the patients were divided into high- or low-expression groups as previously described.22
Public Datasets Download and Validation
To determine the expression profile of GIHCG in HCC, we downloaded the expression data, clinical information and mutation data from The Cancer Genome Atlas (TCGA) Liver Hepatocellular Carcinoma (TCGA-LIHC) dataset (April 21, 2020) using the R package TCGAbiolinks24 (version 2.14.0). GIHCG expression levels were compared using transcripts per kilobase million (TPM) normalization. After exclusion of repeat samples from the same patient, 371 HCC and 50 paired normal liver tissues were included for expression analysis. In addition, patients with any missing or insufficient data on TNM stage, OS or DFS were excluded from the survival analysis and correlation analysis of GIHCG with clinicopathologic characteristics. Finally, a total of 347 HCC patients were included for the correlation and survival analysis. High- and low-expression patients were divided according to the median expression level of GIHCG. Because a limited number of normal liver samples were available in the TCGA-LIHC dataset, the expression of GIHCG in HCC and normal liver tissue was further validated in GEPIA, a web server for analyzing the RNA-sequencing data from TCGA and thousands of normal samples from GTEx projects (http://gepia.cancer-pku.cn).
Functional Enrichment Analysis for GIHCG
Differentially expressed genes between the high- and low-expression groups were identified using the R package Limma25 (version 3.42.2). Gene Set Enrichment Analysis (GSEA) and Gene Ontology (GO) analyses were conducted with the R package (clusterProfiler,26 version 3.14.3) to explore different molecular mechanisms and involved pathways between high- and low-expression groups in the TCGA-LIHC dataset. Hallmark gene sets and molecular signatures were obtained from the Molecular Signatures Database. Normalized enrichment scores were acquired using gene set permutations 1000 times, and a cutoff P-value of 0.05 was used to filter the significant enrichment results.
Immune Cell Infiltrates Analysis
To evaluate the correlation between GIHCG expression and tumor-infiltrating immune cells (TIICs), we performed single-sample gene set enrichment analysis (ssGSEA),27 a method used to transform the bulk transcriptomic expression data into relative abundance of specific immune cell types, to quantitatively identify the proportion of TIICs in the tumor microenvironment. Feature gene panels for each immune cell type were obtained and referenced from recent publications.28,29 The ssGSEA enrichment scores of each immune cell type were calculated by using TCGA-LIHC expression data and R package GSVA30 (version 1.34.0). The immune cell infiltration profiles and marker genes of different immune cell subsets was compared between the GIHCG high- and low-expression groups. For heatmap visualization, the ssGSEA scores were normalized to show the relative abundance of infiltrating immune cell populations.
Statistical Analysis
All statistical analyses were performed using R software (version 3.6.2) with the corresponding packages. The Shapiro–Wilk method was used for normality tests. The mean ± standard deviation (mean ± SD) is presented for normally distributed variables, and the median is presented for nonnormally distributed variables. The relationships between categorical variables were compared using the χ2 test, and continuous variables were analyzed with Student’s t-test. Kaplan-Meier survival analysis and the Log-rank test were employed to analyze OS and DFS (R package survival, version 3.1–8). Univariate and multivariate Cox regression analyses were performed to evaluate the prognostic value of GIHCG.
Results
GIHCG Expression in HCC and Normal Tissues
GIHCG expression was first investigated in the SYSU HCC cohort. CISH staining revealed that HCC tissues exhibited significantly higher GIHCG expression than the adjacent normal liver tissue. Representative photos showed GIHCG low- and high-expression in normal liver tissue (Figure 1A) and HCC (Figure 1B). The relative GIHCG mRNA expression was significantly higher in HCC tissues compared to normal tissues (Figure 1C).
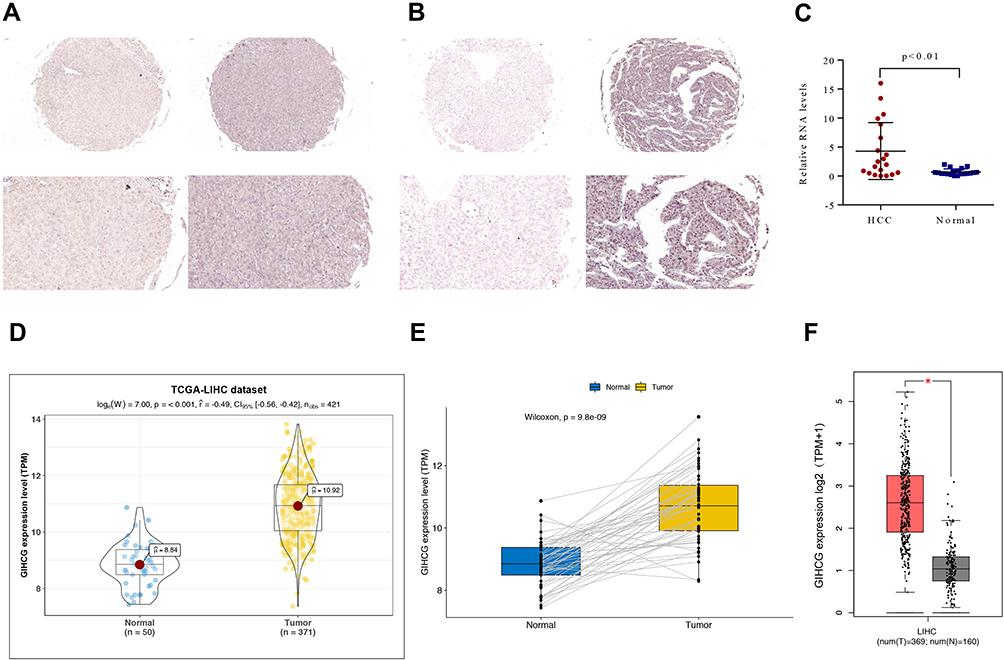 |
Figure 1 GIHCG expression in HCC and normal liver samples. (A and B) Representative photos (magnification: 20× and 40×) of GIHCG expression in adjacent normal liver tissues (A) and HCC (B) tissues. (C) GIHCG expression was examined by qRT-PCR in 20 paired HCC tissues and adjacent normal liver tissues. (D and E) Comparison of GIHCG expression in HCC and normal liver using the TCGA-LIHC cohort containing 371 HCC samples and 50 paired adjacent normal liver tissue samples as shown in Panel B; (F) Comparison expression of GIHCG in HCC (TCGA-LIHC: 369 HCC samples, excluding 2 repeated patients) and normal liver (GETx: 160 donation liver samples). |
This expression pattern was then validated in 371 HCC and 50 adjacent normal liver tissues using the TCGA-LIHC dataset. In the TCGA-LIHC cohort, GIHCG expression was significantly higher in tumors than in normal tissues (P-value < 0.001). GIHCG expression in HCC and normal liver samples is plotted in Figure 1D. Furthermore, in the 50 paired adjacent normal tissues from the same HCC patients, GIHCG expression was significantly upregulated in the HCC tissues compared with the adjacent normal liver tissues (Figure 1E). Using the online GEPIA databases, which included many more normal liver tissues from the GTEx projects, GIHCG expression was also significantly upregulated in HCC tissues (n = 369) compared with normal liver tissues (n = 160, Figure 1F). These results demonstrate that GIHCG is highly expressed in HCC tissues compared to normal tissues.
Correlation of GIHCG Expression with Clinicopathological Characteristics
To investigate the association between GIHCG expression and clinical factors in HCC patients, we analyzed the GIHCG expression in different clinicopathological subgroups in both the SYSU HCC and TGCA-LIHC cohorts. We performed CISH staining via semiquantitative measurement of GIHCG in the SYSU HCC cohort. Within all the SYSU HCC samples, 58 (58.0%) displayed high GIHCG expression. The relationship between the GIHCG expression level and HCC clinicopathological features is shown in Table 1. The results showed that GIHCG expression was significantly associated with tumor numbers (P < 0.05), tumor size (P < 0.05), AFP level and tumor thrombus (P < 0.05).
 |
Table 1 Association Between GIHCG Expression and the Clinicopathological Characteristics of Patients in SYSU HCC Cohort |
In the TCGA-LIHC cohort, as shown in Figure 2, GIHCG overexpression was positively associated with the TNM stage, histological grade and T stage (Figure 2A–C); however, other clinicopathologic factors, such as gender, AFP levels and status of hepatitis virus infection, had no significant association with GIHCG expression (data not shown). In addition, GIHCG high expression was significantly correlated with TP53 mutation (Figure 2D).
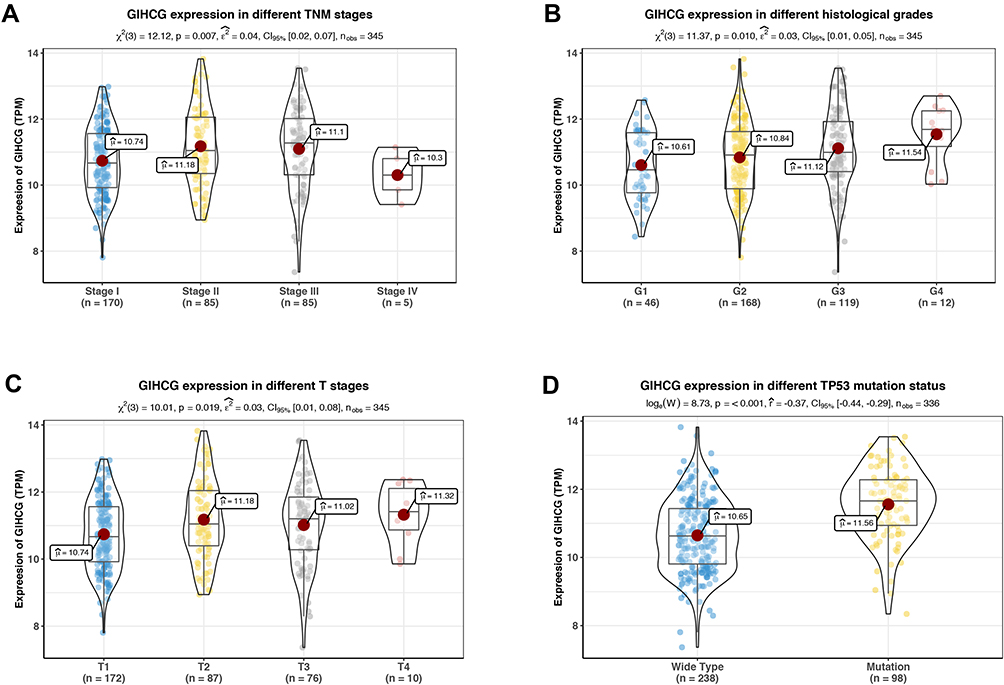 |
Figure 2 Correlation of GIHCG expression with clinical and pathological characteristics. GIHCG expression profiles in different TNM stages (A), histological grades (B), T stages (C) and TP53 mutation status (D). GIHCG expression is significantly correlated to tumor stage, tumor grade, tumor size and TP53 mutation in HCC. |
High GIHCG Expression Predicts Poor Survival Among Patients with HCC
To verify the prognostic value of GIHCG expression in HCC, we performed a Kaplan-Meier analysis in the SYSU HCC cohort and TCGA-LIHC cohort. In the SYSU HCC cohort, the median OS time of the low-GIHCG-expression group was significantly longer than that of the high-GIHCG-expression group (HR=0.269, 95% CI: 0.133–0.544; P<0.001; Figure 3A), and the median DFS of the low-GIHCG-expression group was significantly longer than that of the high-GIHCG-expression group (HR=0.262, 95% CI: 0.129–0.530; P<0.001; Figure 3B). Consistent with the SYSU HCC cohort, in the TCGA-LIHC cohort, the median OS time of the low-GIHCG-expression group was significantly longer than that of the high-GIHCG-expression group (HR=0.537, 95% CI: 0.378–0.763; P<0.001; Figure 3C), and the median DFS time of the low-GIHCG-expression group was significantly longer than that of high-GIHCG-expression group (HR=0.614, 95% CI: 0.457–0.825; P<0.001; Figure 3D).
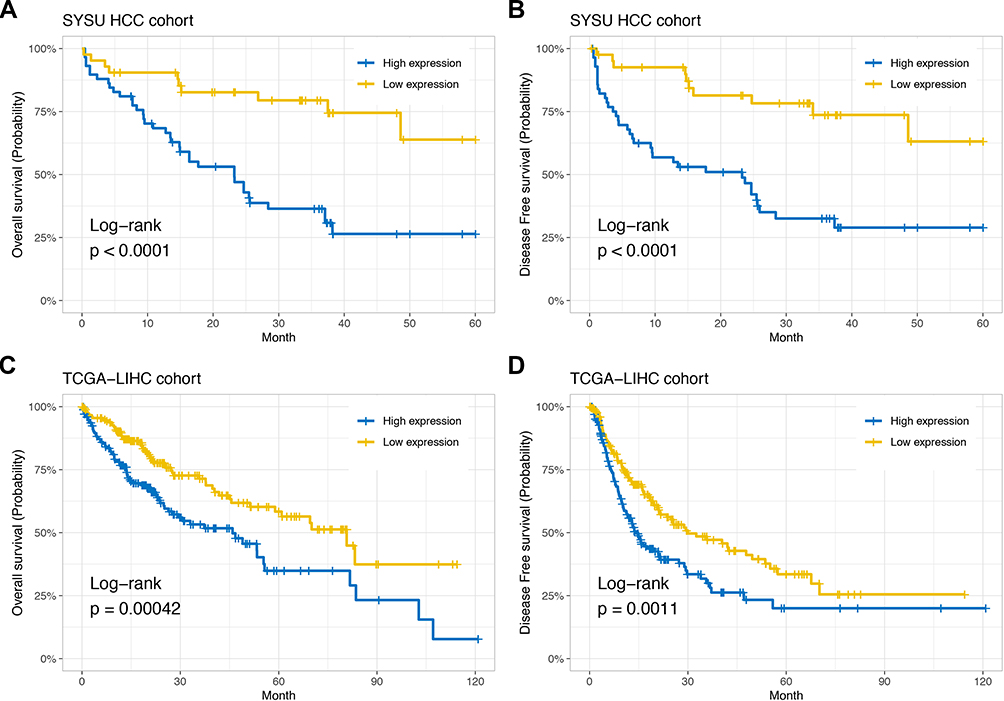 |
Figure 3 High GIHCG expression is associated with poor prognosis. Kaplan-Meier curves show overall survival (A) and disease-free survival (B) curves for 58 GIHCG high-expression patients and 42 GIHCG low-expression patients in the SYSU HCC cohort. Kaplan-Meier plots show overall survival (C) and disease-free survival (D) curves for 185 GIHCG high-expression patients and 186 GIHCG high-expression patients from the TCGA-LIHC cohort. |
Moreover, univariate and multivariate Cox regression analysis was performed to determine the relationships between risk factors and prognosis in the two HCC cohorts. The results revealed that tumor nodule number, tumor size, TNM stage, histological grade, tumor thrombi, AFP level and GIHCG expression level were significantly associated with OS and DFS in the SYSU cohort. In the TCGA-LIHC cohort, TNM stage, T stage, hepatitis virus infection and GIHCG expression were significantly associated with OS and DFS (Tables 2 and 3).
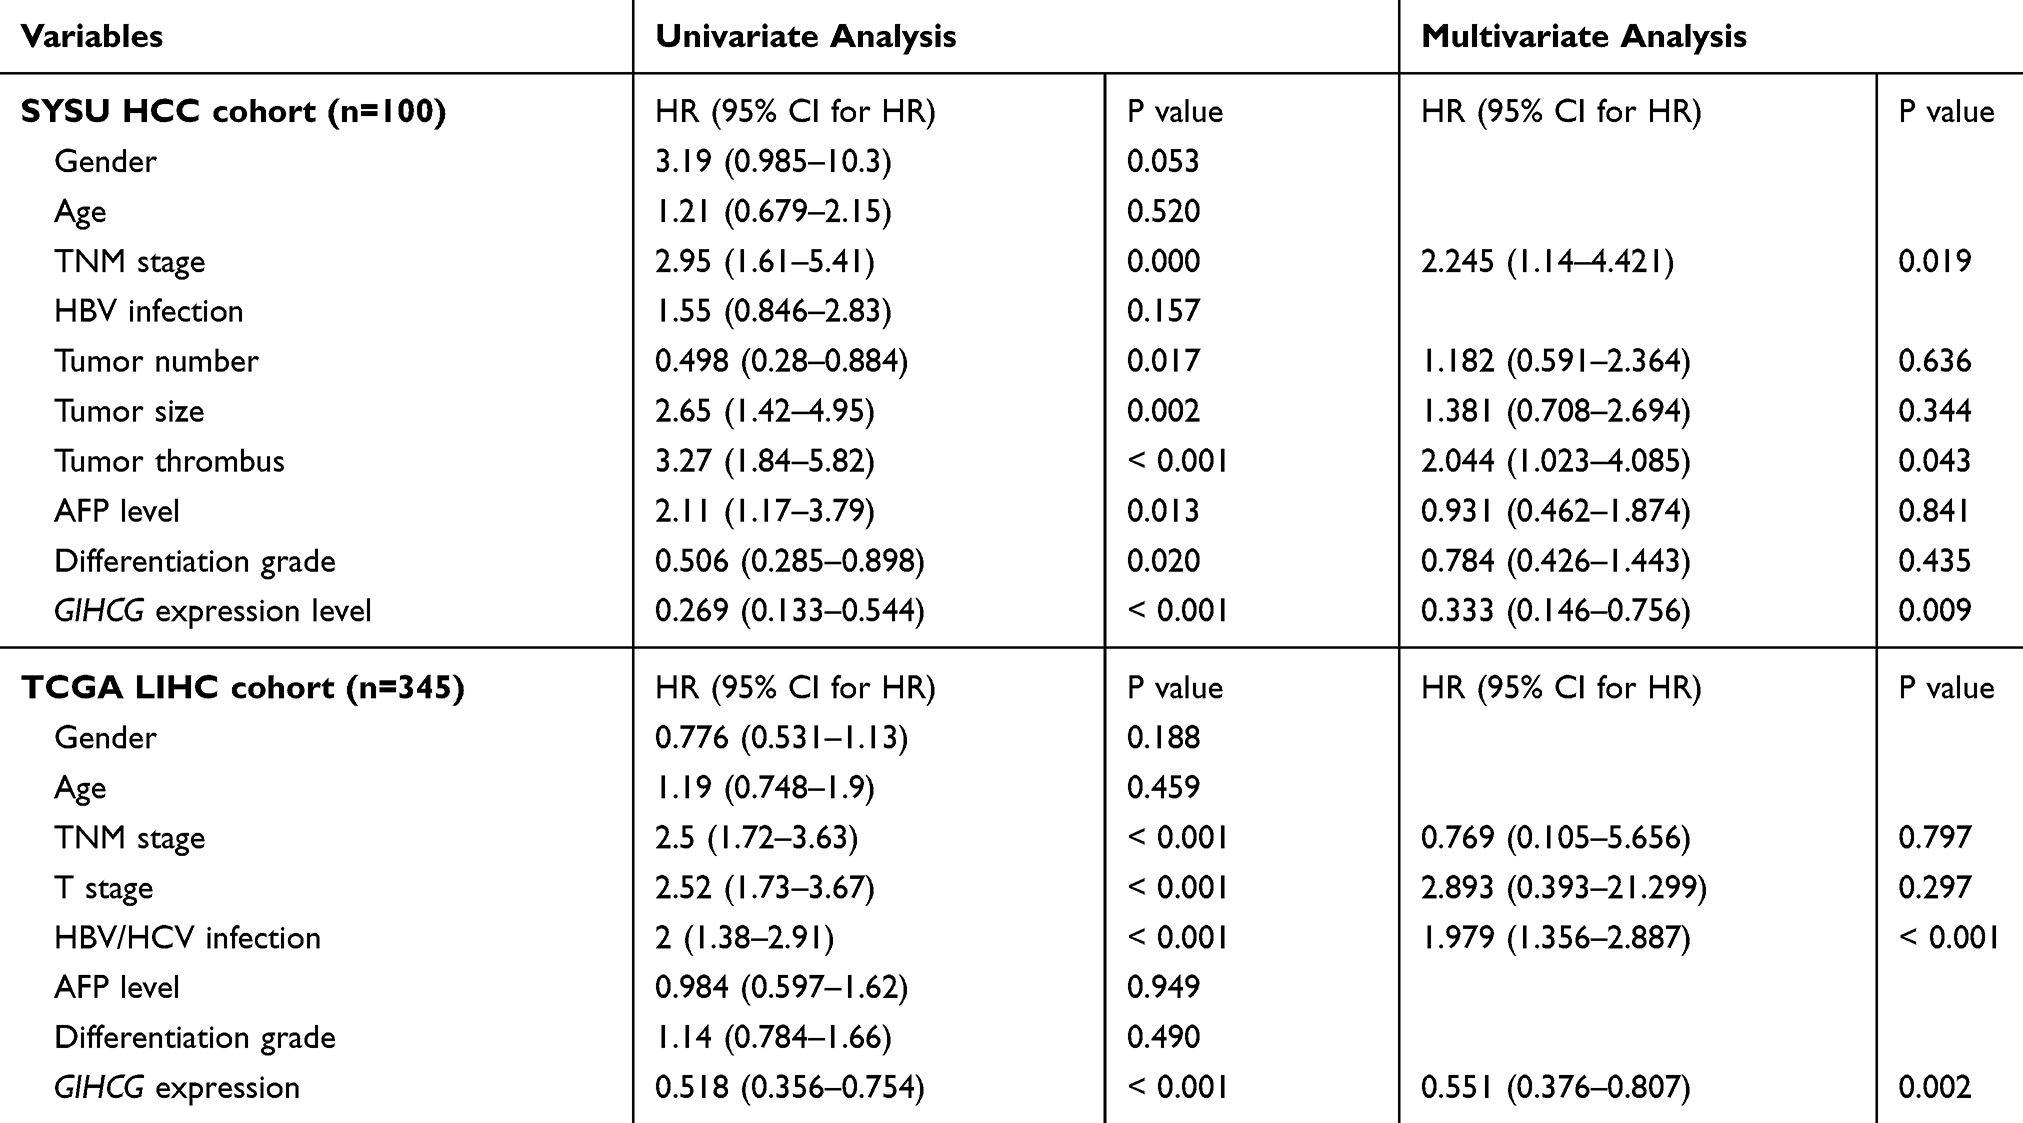 |
Table 2 Univariate and Multivariate Cox Regression Analyses of Risk Factors Associated with Overall Survival in SYSU HCC and TCGA-LIHC Cohort |
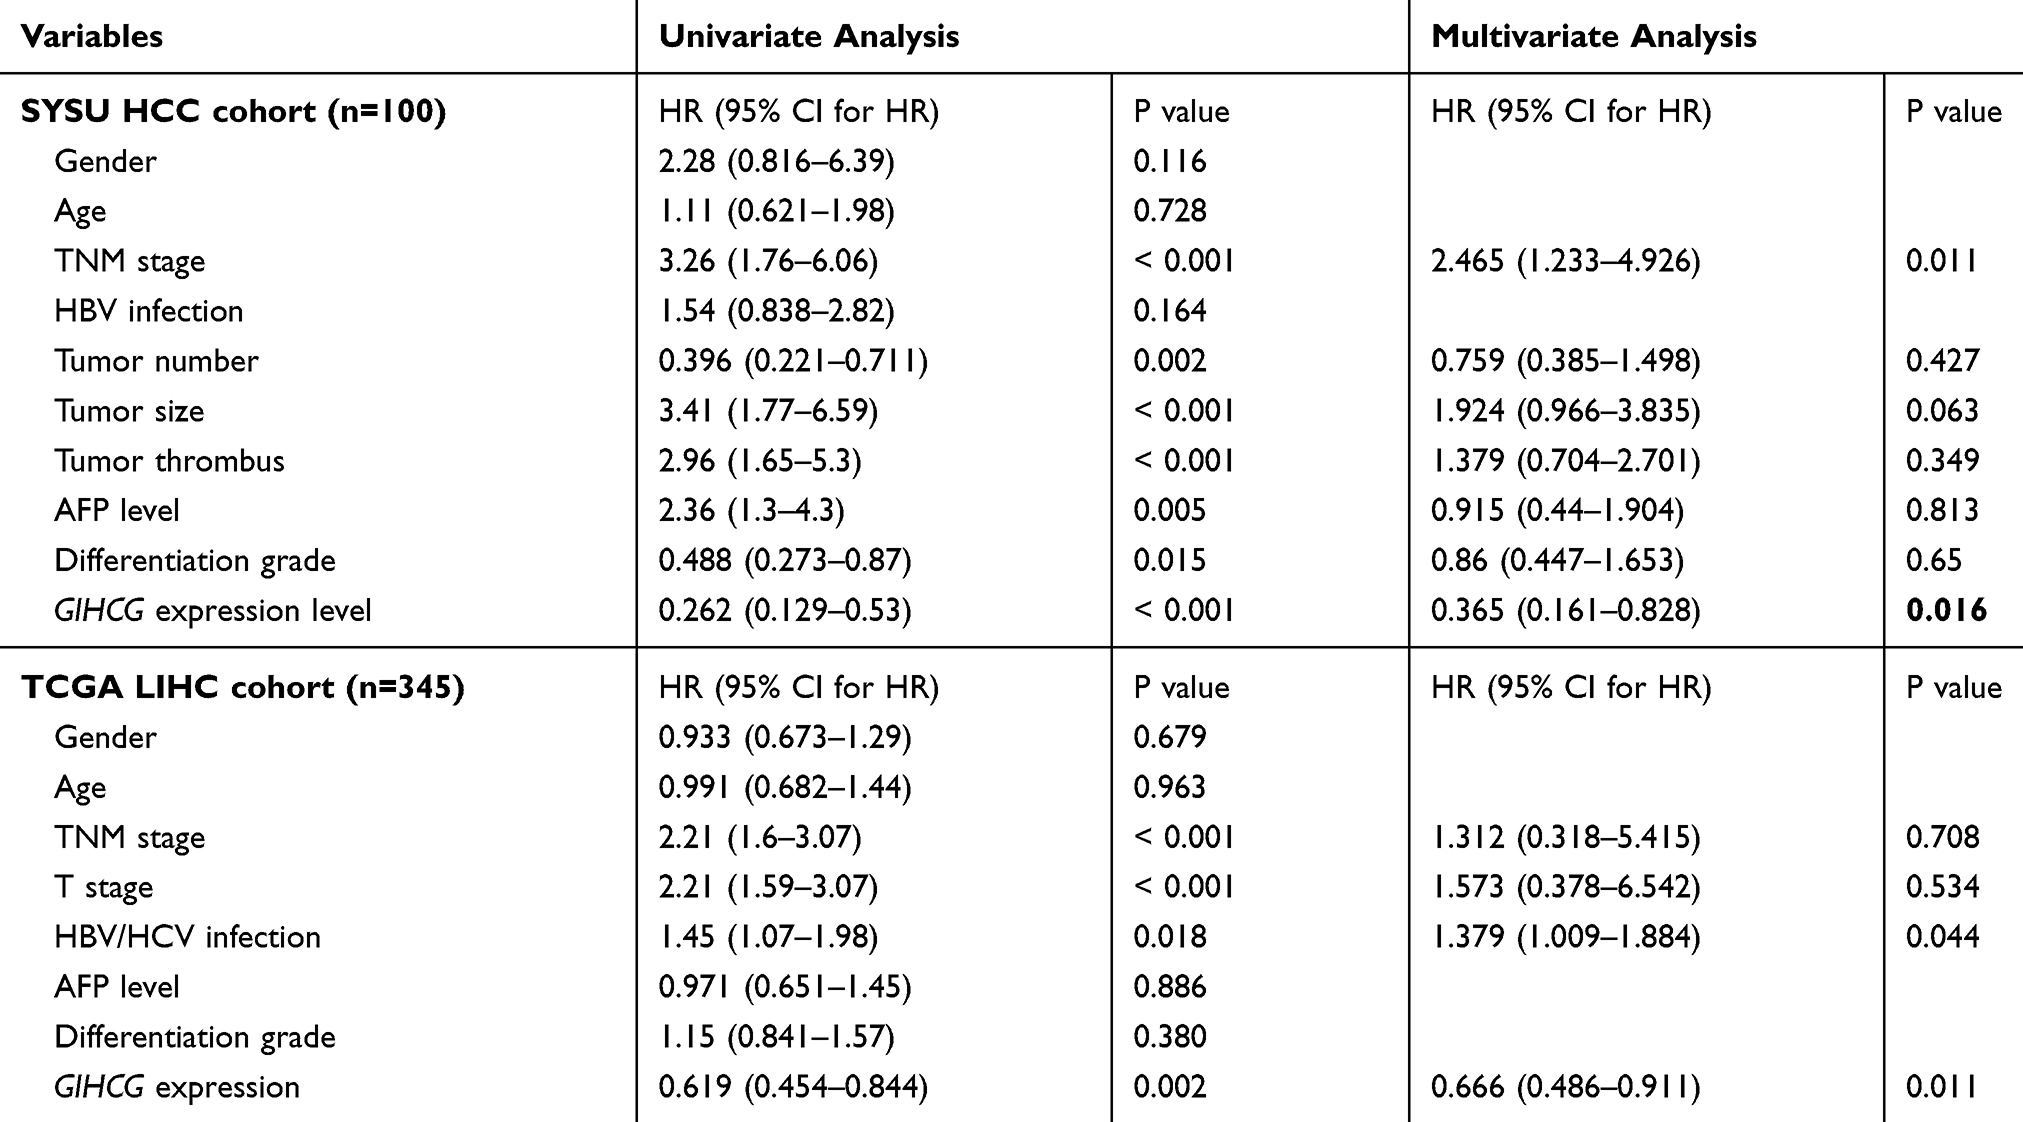 |
Table 3 Univariate and Multivariate Cox Regression Analyses of Risk Factors Associated with Disease-Free Survival in SYSU HCC and TCGA-LIHC Cohort |
These significant prognostic risk factors were included in the multivariate Cox regression analysis. The results showed that in the SYSU cohort, tumor thrombi (HR=2.044; 95% CI: 1.023–4.085; P=0.043), TNM stage (HR=2.245; 95% CI: 1.14–4.421; P=0.019) and GIHCG expression level (HR=0.333; 95% CI: 0.146–0.756; P= 0.009) were independent prognostic factors for OS (Table 2, Supplementary Figure 1A). Further, TNM stage (HR=2.465; 95% CI: 1.233–4.926; P=0.011) and GIHCG expression level (HR=0.365; 95% CI: 0.161–0.828; P= 0.016) were independent prognostic factors for DFS (Table 3, Supplementary Figure 1B). In the TCGA-LIHC cohort, hepatitis virus infection (HR=1.979; 95% CI: 1.356–2.887; P< 0.001) and GIHCG expression (HR=0.551; 95% CI: 0.376–0.807; P=0.002) were independent prognostic factors for OS (Table 2, Supplementary Figure 1C) and hepatitis virus infection (HR=1.379; 95% CI: 1.009–1.884; P=0.044) and GIHCG expression (HR=0.666; 95% CI: 0.486–0.911; P=0.011) were independent prognostic factors for DFS (Table 3, Supplementary Figure 1D).
To test the robustness of GIHCG expression for the prediction of HCC survival, we validated the prognostic significance in different clinicopathological subgroups. The result of the subgroups analysis showed that GIHCG expression can also serve as a prognostic factor for OS and DFS in most subgroups (Figure 4, Supplementary Figure 2–5). In summary, the above results show that high GIHCG expression is positively correlated with poor survival among HCC patients.
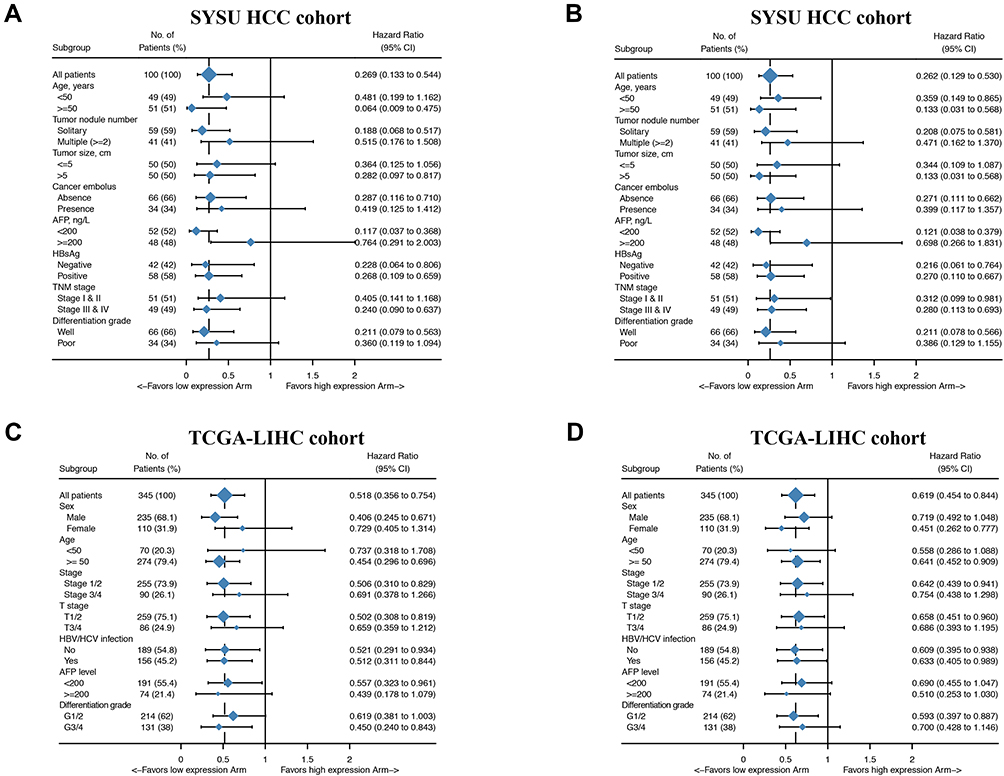 |
Figure 4 Hazard ratio values for subgroup analyses of GIHCG expression in HCC patients. Forest plots summarizing the hazard ratio (HR) between GIHCG expression and survival in HCC patients as analyzed by the different clinicopathological subgroups. (A) HR values for OS in the SYSU HCC cohort. (B) HR values for DFS in the SYSU HCC cohort. (C) HR values for OS in the TCGA-LIHC cohort. (D) HR values for DFS in the TCGA-LIHC cohort. |
Functional Enrichment Analysis of High GIHCG Expression
To evaluate potential key molecules and pathways associated with GIHCG expression, we performed GO analysis and GSEA between high- and low-expression groups. The top enriched GO terms in biological processes (BP), cellular components (CC) and molecular function (MF) are shown in Figure 5A and Supplementary Table 1. GO analysis revealed that “RNA catabolic process”, “organic acid catabolic process” and “spindle organization” were the main terms involved in BP; “spindle”, “chromosomal region” and “cytosolic ribosome” were significantly enriched in CC; and “coenzyme binding”, “structural constituent of ribosome” and “catalytic activity, acting on DNA” were the top enriched terms in MF. GSEA enrichment analysis showed that the significantly enriched hallmark terms included “G2M checkpoint”, “E2F targets”, “spermatogenesis”, “MYC targets” and “DNA repair” (Figure 5B and C, Supplementary Table 2), which were associated with the proliferation of cancer cells. The results of the KEGG pathway analysis showed that 77 pathways were enriched (p<0.05), among which “Cell cycle”, “Ribosome”, “Fanconi anemia pathway”, “Spliceosome” and “DNA replication” were highly associated with high GIHCG expression (Figure 5D, Supplementary Table 3).
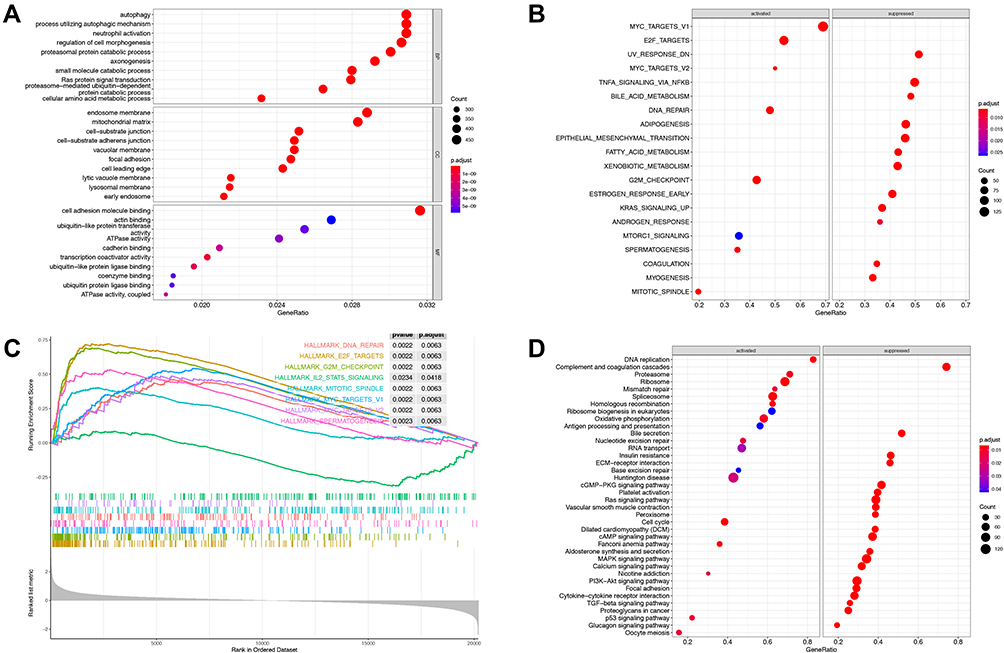 |
Figure 5 Gene set enrichment analysis between GIHCG high- and low-expression groups. (A) Gene Ontology enrichment analysis includes biological processes, cellular components and molecular function. (B) Enriched hallmark terms correlated to GIHCG expression. (C) Representative hallmark terms enrichment plot. (D) GSEA-based Kyoto Encyclopedia of Genes and Genomes (KEGG) analysis revealed the enriched activated and suppressed pathways between the GIHCG high- and low- expression groups. The circle size indicates the counts of enriched terms and the color represents the P value. |
Correlations Between GIHCG Expression and Immune Cell Infiltration and Markers
Because tumor microenvironmental alterations correlate with a poor prognosis among HCC patients,31–34 we investigated the correlation between the GIHCG expression level and the proportions of TIICs in the TCGA-LIHC cohort. Figure 6A shows the relative abundance of 28 TICs populations for 345 HCC tumor samples in the TCGA-LIHC cohort. The results of the ssGSEA showed that antitumor immune cells, including central memory T cells, effector memory T cells, type 1 T helper cells, type 17 T helper cells, CD56bright natural killer cells and natural killer cells, were significantly lower in the high-GIHCG-expression group than the low-GIHCG-expression group (Figure 6B and Supplementary Table 4). Other TIICs, such as activated CD4 regulatory T cells, CD56dim natural killer cells, neutrophils, plasmacytoid dendritic cells, eosinophils and monocytes, also significantly differed between the high-GIHCG- and low-GIHCG-expression groups. Specifically, GIHCG expression had a significant negative correlation with the proportion of TIICs, including central memory CD4/8 T cells, effector memory CD4/8 T cells, type 1/17 T helper cells, immature dendritic cells, plasmacytoid dendritic cells, neutrophils, eosinophils and monocytes (Figure 7A and Supplementary Table 5). We next explored the correlation between GIHCG expression and the marker of genes of different immune cell subsets (Figure 7B and Supplementary Table 6). The GIHCG expression level was positively correlated with the gene markers of T cells (CD8A, CD8B, CD2, CD3D, CD3E), T cell exhaustion (LAG3, CTLA4, GZMB), B cells (CD19), macrophages (CD68, IRF5, VSIG4, MS4A4A), dendritic cells (HLA-DPB1, HLA-DQB1, HLA-DRA, ITGAX), natural killer cells (KIR2DL4, NCAM1) and neutrophils (ITGAM). These results suggest that GIHCG expression correlates with the tumor microenvironment in HCC.
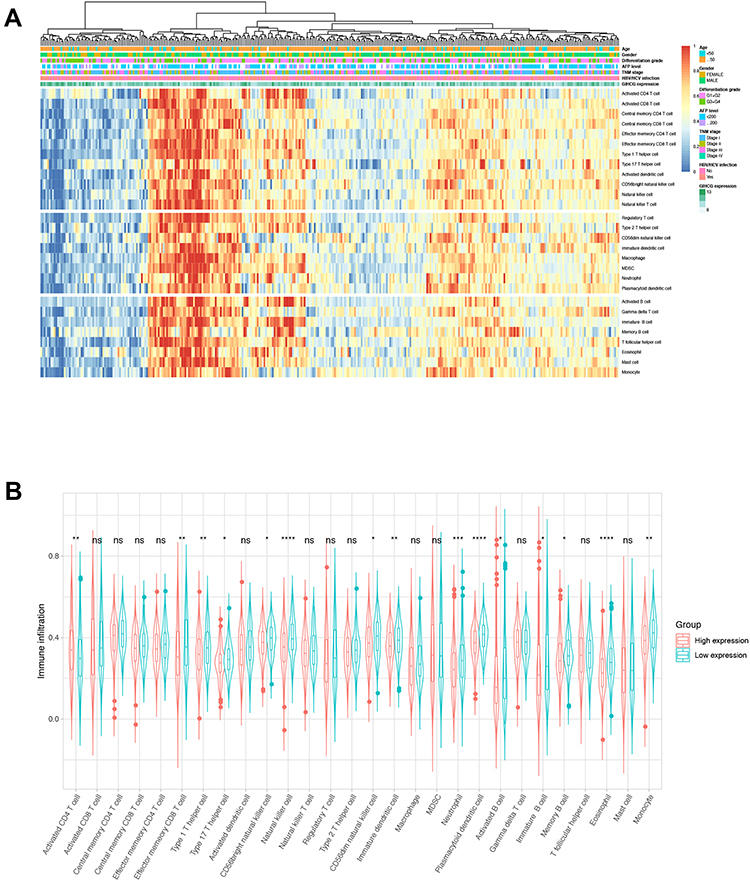 |
Figure 6 Visualization of the relationships between infiltrating immune cells and GIHCG expression. (A) A heatmap shows the relative infiltration of immune cell proportion for all TCGA-LIHC tumor patients (normalized ssGESA). GIHCG value, age, gender, tumor stage, and AFP are shown as patient annotations. (B) Comparison of infiltration immune cells differences in the GIHCG high- and low-expression groups. Symbol “****”, “***”, “**”, “*”, “ns” indicate a P value <0.0001, <0.001, <0.01, <0.05 and >0.05, respectively. |
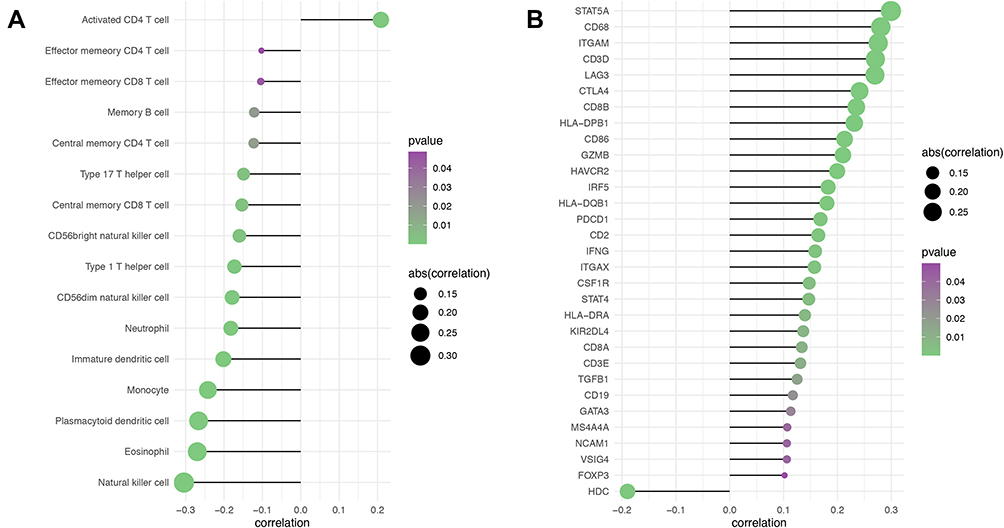 |
Figure 7 Correlation of GIHCG expression and immune cell infiltration in HCC. (A) Spearman correlation analysis between GIHCG expression and the proportion of immune cell infiltration. (B) Correlation analysis between GIHCG expression and immune cell marker genes. Only significant results were plotted. The circle size indicates the absolute value of R and the color represents the P value. |
Discussion
Although many advances have been achieved in the management and treatment of HCC, HCC ranks as the third leading cause of tumor-related death worldwide. Identification of meaningful biomarkers associated with HCC progression are still needed. GIHCG acts as an onco-long noncoding RNA in many types of cancer, but its prognostic value, biological functions, and relationship with the tumor microenvironment have not been fully assessed. In this study, we analyzed the prognostic value and potential biological functions of GIHCG in HCC.
In the current study, we systematically analyzed the GIHCG expression pattern in HCC, and our results demonstrated that GIHCG expression is significantly increased in HCC tissues compared with normal liver tissues. High GIHCG expression was positively correlated with poor clinicopathologic factors and poor survival among HCC patients. GIHCG expression was an independent prognostic factor of OS and DFS for HCC patients. These results were validated in both public databases and local HCC cohorts, and the results were consistent with those of a previous study.13
Additionally, bioinformatics results revealed that high GIHCG levels activated proliferation pathways in HCC, which is consistent with the findings of Sui et al showing that GIHCG promotes HCC cell proliferation and metastasis in vivo by silencing miR-200b/a/429.13 The GO terms suggested that GIHCG overexpression could alter the RNA catabolic process in HCC. KEGG pathway analysis revealed that “Cell cycle” and “DNA replication” were linked to GIHCG overexpression. Previous studies have supported that lncRNAs are involved in vital biological processes, such as the cell cycle and DNA repair.35,36 GSEA showed that GIHCG overexpression is involved in pivotal hallmarks of proliferation, including “G2M checkpoint”, “E2F targets”, “MYC targets” and “DNA repair”. LncRNAs are reported to be regulated by MYC and affect MYC expression in different cancer types, which could influence cancer cell viability and proliferation.37,38 GIHCG may also be involved in these key pathways, but further studies are needed to confirm this hypothesis.
LncRNAs are directly and indirectly involved in the crosstalk between immune cells and tumor cells, and dysregulated lncRNA expression in these cells could drive tumorigenesis in HCC.39–42 Our results demonstrate that GIHCG expression is significantly correlated with the tumor microenvironment in HCC. High GIHCG expression negatively correlated with the infiltration of memory CD4+ and CD8+ T cells, natural killer cells, macrophages, dendritic cells, neutrophils and monocytes. By analyzing the correlation between GIHCG and immune cell markers, we found that increased GIHCG expression was significantly associated with the abovementioned immune cells. This finding suggests that GIHCG may play a role in regulating the microenvironment in HCC and influences HCC patient prognosis. This hypothesis and the detailed mechanism warrant further investigation.
Conclusion
In conclusion, our results provide evidence that GIHCG expression is increased in HCC and leads to a poor prognosis, making it possible for GIHCG to be considered a novel prognostic biomarker for HCC. In addition, GIHCG may affect the infiltration and function of immune cells in HCC.
Abbreviations
HCC, Hepatocellular carcinoma; lncRNAs, Long noncoding RNAs; GIHCG, lncRNA increased during hepatocarcinogenesis; GEPIA, Gene Expression Profiling Interactive Analysis; TCGA, The Cancer Genome Atlas; LIHC, Liver Hepatocellular Carcinoma; TPM, transcripts per kilobase million; OS, overall survival; DFS, disease-free survival; ANT, adjacent normal tissue; qRT-PCR, Quantitative real-time PCR; CISH, Chromogenic in situ hybridization; GSEA, Gene Set Enrichment Analysis; TIICs, tumor-infiltrating immune cells; ssGSEA, single sample gene set enrichment analysis.
Acknowledgment
These authors contributed equally to the article and should be considered as co-first authors: Siyu Xiao and Shanzhou Huang.
Disclosure
The authors report no conflicts of interest in this work.
References
1. Bray F, Ferlay J, Soerjomataram I, Siegel RL, Torre LA, Jemal A. Global cancer statistics 2018: GLOBOCAN estimates of incidence and mortality worldwide for 36 cancers in 185 countries. CA Cancer J Clin. 2018;68(6):394–424. doi:10.3322/caac.21492
2. Allemani C, Matsuda T, Di Carlo V, et al. Global surveillance of trends in cancer survival 2000–14 (CONCORD-3): analysis of individual records for 37 513 025 patients diagnosed with one of 18 cancers from 322 population-based registries in 71 countries. Lancet. 2018;391(10125):1023–1075. doi:10.1016/S0140-6736(17)33326-3
3. Tzartzeva K, Obi J, Rich NE, et al. Surveillance Imaging and Alpha Fetoprotein for Early Detection of Hepatocellular Carcinoma in Patients With Cirrhosis: A Meta-analysis. Gastroenterology. 2018;154(6):1706–1718. doi:10.1053/j.gastro.2018.01.064
4. Forner A, Reig M, Bruix J. Hepatocellular carcinoma. Lancet. 2018;391(10127):1301–1314.
5. Bruix J, Reig M, Evidence-Based Diagnosis SM. Staging, and Treatment of Patients With Hepatocellular Carcinoma. Gastroenterology. 2016;150(4):835–853.
6. Ponting CP, Oliver PL, Reik W. Evolution and functions of long noncoding RNAs. Cell. 2009;136(4):629–641.
7. Gugnoni M, Ciarrocchi A. Long Noncoding RNA and Epithelial Mesenchymal Transition in Cancer. Int J Mol Sci. 2019;20:8.
8. Zou Y, Xu S, Xiao Y, et al. Long noncoding RNA LERFS negatively regulates rheumatoid synovial aggression and proliferation. J Clin Invest. 2018;128(10):4510–4524.
9. Chen C, He W, Huang J, et al. LNMAT1 promotes lymphatic metastasis of bladder cancer via CCL2 dependent macrophage recruitment. Nat Commun. 2018;9(1):3826.
10. Fatica A, Bozzoni I. Long non-coding RNAs: new players in cell differentiation and development. Nat Rev Genet. 2014;15(1):7–21. doi:10.1038/nrg3606
11. Liang W-C, Ren J-L, Wong C-W, et al. LncRNA-NEF antagonized epithelial to mesenchymal transition and cancer metastasis via cis-regulating FOXA2 and inactivating Wnt/β-catenin signaling. Oncogene. 2018;37(11):1445–1456. doi:10.1038/s41388-017-0041-y
12. Yuan J-H, Yang F, Wang F, et al. A Long Noncoding RNA Activated by TGF-β Promotes the Invasion-Metastasis Cascade in Hepatocellular Carcinoma. Cancer Cell. 2014;25(5):666–681. doi:10.1016/j.ccr.2014.03.010
13. Sui C-J, Zhou Y-M, Shen W-F, et al. Long noncoding RNA GIHCG promotes hepatocellular carcinoma progression through epigenetically regulating miR-200b/a/429. J Mol Med (Berl). 2016;94(11):1281–1296. doi:10.1007/s00109-016-1442-z
14. Zhang X, Mao L, Li L, He Z, Wang N, Song Y. Long noncoding RNA GIHCG functions as an oncogene and serves as a serum diagnostic biomarker for cervical cancer. J Cancer. 2019;10(3):672–681. doi:10.7150/jca.28525
15. He ZH, Qin XH, Zhang XL, Yi JW, Han JY. Long noncoding RNA GIHCG is a potential diagnostic and prognostic biomarker and therapeutic target for renal cell carcinoma. Eur Rev Med Pharmacol Sci. 2018;22(1):46–54.
16. Zhao H, Xing G, Wang Y, Luo Z, Liu G, Meng H. Long noncoding RNA HEIH promotes melanoma cell proliferation, migration and invasion via inhibition of miR-200b/a/429. Biosci Rep. 2017;37(3):3. doi:10.1042/BSR20170682
17. Jiang X, Li Q, Zhang S, Song C, Zheng P. <p>Long noncoding RNA GIHCG induces cancer progression and chemoresistance and indicates poor prognosis in colorectal cancer. Onco Targets Ther. 2019;12:1059–1070. doi:10.2147/OTT.S192290
18. Liu G, Jiang Z, Qiao M, Wang F. Lnc-GIHCG promotes cell proliferation and migration in gastric cancer through miR- 1281 adsorption. Molecular Genetics & Genomic Medicine. 2019;7(6):e711. doi:10.1002/mgg3.711
19. Yao N, Yu L, Zhu B, Gan HY, Guo BQ. LncRNA GIHCG promotes development of ovarian cancer by regulating microRNA-429. Eur Rev Med Pharmacol Sci. 2018;22(23):8127–8134.
20. Fan LY, Shi KY, Xu D, et al. LncRNA GIHCG regulates microRNA-1281 and promotes malignant progression of breast cancer. Eur Rev Med Pharmacol Sci. 2019;23(24):10842–10850.
21. Ma L, Wang Q, Gong Z, Xue L, Zuo Z. Long noncoding RNA GIHCG enhanced tongue squamous cell carcinoma progression through regulating miR-429. J Cell Biochem. 2018;119(11):9064–9071. doi:10.1002/jcb.27164
22. Huang S, Li J, Tam NL, et al. Uridine-cytidine kinase 2 upregulation predicts poor prognosis of hepatocellular carcinoma and is associated with cancer aggressiveness. Mol Carcinog. 2019;58(4):603–615. doi:10.1002/mc.22954
23. Huang S, Zhong W, Shi Z, et al. Overexpression of signal sequence receptor γ predicts poor survival in patients with hepatocellular carcinoma. Hum Pathol. 2018;81:47–54. doi:10.1016/j.humpath.2018.06.014
24. Colaprico A, Silva TC, Olsen C, et al. TCGAbiolinks: an R/Bioconductor package for integrative analysis of TCGA data. Nucleic Acids Res. 2016;44(8):e71. doi:10.1093/nar/gkv1507
25. Ritchie ME, Phipson B, Wu D, et al. limma powers differential expression analyses for RNA-sequencing and microarray studies. Nucleic Acids Res. 2015;43(7):e47. doi:10.1093/nar/gkv007
26. Yu G, Wang L-G, Han Y, He Q-Y. clusterProfiler: an R package for comparing biological themes among gene clusters. OMICS: A Journal of Integrative Biology. 2012;16(5):284–287. doi:10.1089/omi.2011.0118
27. Hackl H, Charoentong P, Finotello F, Trajanoski Z. Computational genomics tools for dissecting tumour–immune cell interactions. Nat Rev Genet. 2016;17(8):441–458. doi:10.1038/nrg.2016.67
28. Charoentong P, Finotello F, Angelova M, et al. Pan-cancer Immunogenomic Analyses Reveal Genotype-Immunophenotype Relationships and Predictors of Response to Checkpoint Blockade. Cell Rep. 2017;18(1):248–262. doi:10.1016/j.celrep.2016.12.019
29. Jia Q, Wu W, Wang Y, et al. Local mutational diversity drives intratumoral immune heterogeneity in non-small cell lung cancer. Nat Commun. 2018;9(1):5361. doi:10.1038/s41467-018-07767-w
30. Subramanian A, Tamayo P, Mootha VK, et al. Gene set enrichment analysis: a knowledge-based approach for interpreting genome-wide expression profiles. Proc Natl Acad Sci U S A. 2005;102(43):15545–15550. doi:10.1073/pnas.0506580102
31. Zhou J, Ding T, Pan W, Zhu L-Y, Li L, Zheng L. Increased intratumoral regulatory T cells are related to intratumoral macrophages and poor prognosis in hepatocellular carcinoma patients. Int J Cancer. 2009;125(7):1640–1648. doi:10.1002/ijc.24556
32. Dong P, Ma L, Liu L, et al. CD86+/CD206+, Diametrically Polarized Tumor-Associated Macrophages, Predict Hepatocellular Carcinoma Patient Prognosis. Int J Mol Sci. 2016;17(3):320. doi:10.3390/ijms17030320
33. Lu C, Rong D, Zhang B, et al. Current perspectives on the immunosuppressive tumor microenvironment in hepatocellular carcinoma: challenges and opportunities. Mol Cancer. 2019;18(1):130. doi:10.1186/s12943-019-1047-6
34. Fu Y, Liu S, Zeng S, Shen H. From bench to bed: the tumor immune microenvironment and current immunotherapeutic strategies for hepatocellular carcinoma. J Exp Clin Cancer Res. 2019;Volume 12(1):396. doi:10.1186/s13046-019-1396-4
35. Kitagawa M, Kitagawa K, Kotake Y, Niida H, Ohhata T. Cell cycle regulation by long non-coding RNAs. Cell Mol Life Sci. 2013;70(24):4785–4794.
36. Su M, Wang H, Wang W, et al. LncRNAs in DNA damage response and repair in cancer cells. Acta Biochim Biophys Sin (Shanghai). 2018;50(5):433–439.
37. Iaccarino I. lncRNAs and MYC: an Intricate Relationship. Int J Mol Sci. 2017;18:7.
38. Cawley S, Bekiranov S, Ng HH, et al. Unbiased mapping of transcription factor binding sites along human chromosomes 21 and 22 points to widespread regulation of noncoding RNAs. Cell. 2004;116(4):499–509.
39. Chen D, Lu T, Tan J, Li H, Wang Q, Wei L. Long Non-coding RNAs as Communicators and Mediators Between the Tumor Microenvironment and Cancer Cells. Front Oncol. 2019;9:739.
40. Luo Y, Yang J, Yu J, et al. Long Non-coding RNAs: emerging Roles in the Immunosuppressive Tumor Microenvironment. Front Oncol. 2020;10:48.
41. Ji J, Yin Y, Ju H, et al. Long non-coding RNA Lnc-Tim3 exacerbates CD8 T cell exhaustion via binding to Tim-3 and inducing nuclear translocation of Bat3 in HCC. Cell Death Dis. 2018;9(5):478.
42. Jiang R, Tang J, Chen Y, et al. The long noncoding RNA lnc-EGFR stimulates T-regulatory cells differentiation thus promoting hepatocellular carcinoma immune evasion. Nat Commun. 2017;8:15129.
 © 2020 The Author(s). This work is published and licensed by Dove Medical Press Limited. The full terms of this license are available at https://www.dovepress.com/terms.php and incorporate the Creative Commons Attribution - Non Commercial (unported, v3.0) License.
By accessing the work you hereby accept the Terms. Non-commercial uses of the work are permitted without any further permission from Dove Medical Press Limited, provided the work is properly attributed. For permission for commercial use of this work, please see paragraphs 4.2 and 5 of our Terms.
© 2020 The Author(s). This work is published and licensed by Dove Medical Press Limited. The full terms of this license are available at https://www.dovepress.com/terms.php and incorporate the Creative Commons Attribution - Non Commercial (unported, v3.0) License.
By accessing the work you hereby accept the Terms. Non-commercial uses of the work are permitted without any further permission from Dove Medical Press Limited, provided the work is properly attributed. For permission for commercial use of this work, please see paragraphs 4.2 and 5 of our Terms.