")
Back to Journals » OncoTargets and Therapy » Volume 13
Overexpression of COL24A1 in Hepatocellular Carcinoma Predicts Poor Prognosis: A Study Based on Multiple Databases, Clinical Samples and Cell Lines
Received 24 January 2020
Accepted for publication 19 March 2020
Published 2 April 2020 Volume 2020:13 Pages 2819—2832
DOI https://doi.org/10.2147/OTT.S247133
Checked for plagiarism Yes
Review by Single anonymous peer review
Peer reviewer comments 2
Editor who approved publication: Prof. Dr. Takuya Aoki
Long Yan, Feng Xu, Chaoliu Dai
Department of General Surgery, Shengjing Hospital of China Medical University, Shenyang, Liaoning, People’s Republic of China
Correspondence: Chaoliu Dai
Department of General Surgery, Shengjing Hospital of China Medical University, No. 36 Sanhao Street, Heping District, Shenyang, Liaoning, People’s Republic of China
Tel + 8618940251697
Fax + 8624-96615
Email [email protected]
Purpose: Hepatocellular carcinoma (HCC) ranks as the second leading cause of cancer-related deaths worldwide and its incidence tends to increase globally. Current biomarkers can hardly reflect diagnostic significance and therapeutic efficiency accurately. The role of collagen 24A1 (COL24A1) in HCC, as a member of the collagen family, remains unclear and needs to be proved.
Methods: HCC-associated RNA sequencing datasets were obtained from The Cancer Genome Atlas (TCGA), International Cancer Genome Consortium (ICGC) and Oncomine databases. R language was used to screen and analyze the differential expression genes (DEGs). Gene Ontology (GO) pathway analyses of DEGs were carried out using g:profiler. Then, the STRING database and cytoscape software were applied to estimate the correlations between DEGs. GEPIA and HCCDB database were used to verify and analyze these results. Finally, qPCR and immunohistochemistry staining on clinical samples and HCC cell lines were conducted to further verify the above results.
Results: The expression of COL24A1 in HCC tissues was significantly higher than that in normal hepatic (NH) tissues. The analysis of TCGA and Oncomine database samples proved that COL24A1 expression was connected with tumor grade, tumor stage and pathologic stage. Meanwhile, the overall survival (OS) curve also validated that high expression of COL24A1 indicated poor prognosis. And the above results have been verified in our clinical samples and HCC cell lines. Furthermore, there is a significant increase of the expression of COL24A1 in various tumors. COL24A1, together with other interactive proteins, has a significant effect on the prognosis of HCC.
Conclusion: Overall, COL24A1 may be an oncogene in the development of HCC. Also, the overexpression of COL24A1 in HCC may help diagnose HCC and evaluate prognosis.
Keywords: COL24A1, hepatocellular carcinoma, database, differentially expressed gene, prognosis
Introduction
Hepatocellular carcinoma (HCC) is the second leading cause of cancer-related death worldwide,1 and its incidence is increasing globally.2 Without adequate diagnostic and prognostic biomarkers, the few effective treatments result in a poor prognosis of HCC, which is approximately 3–11% for 5-year survival rates.3 Owing to the limited understanding of the molecular mechanisms underlying HCC pathogenesis, developing specific and efficacious pharmacological strategies to treat, stop, or prevent progression to advanced stages is challenging.4 Therefore, this study aimed to find an effective diagnostic and therapeutic target, with the goal of prolonging the survival time of patients with HCC.
Collagens are a series of extracellular proteins that impart structural completeness to the connective tissue of almost every organ system. The collagen family includes 28 different α-chain trimers or types that give rise to a large variety of suprastructures, such as fibrils, filaments, and networks.5,6 Collagen is also the main component of the tumor extracellular matrix, and it plays an important role in the development of tumors.7,8
Many studies have investigated the collagen family in HCC. Hepatocellular carcinoma is primarily associated with cirrhosis. Elastin and collagen proteins are abundant in liver cancer tissue, and their relationship with prognosis is gradually being emphasized.9 Dr Liu et al10 have indicated that activation of the PTK2-PI3K/Akt/mTOR pathway by COL4A1 and COL4A2 may contribute to hepatocarcinogenesis. Moreover, Dr Kimura et al11 have found that COL15A1 is up-regulated in HCC, and it contributes to the capillarization of HCC. Furthermore, Dr Zhang has demonstrated12 that collagen I enhances tumor cell proliferation and the epithelial-mesenchymal transition of HCC, and is predictive of the progression of residual HCC cells after suboptimal heat treatment. Dr Ma et al13 have also found that COL1A1 promotes Slug-dependent epithelial-to-mesenchymal transition, thereby enhancing the invasion and metastasis of HCC.
COL24A1, which is predominantly expressed in bone tissue, is a poorly characterized member of the fibril-forming family of collagen molecules.14 This type of fibrocollagen may play an important role in regulating the physiological processes of bone and cartilage. The low level of COL24A1 expression observed in non-skeletal tissues (such as the brain, eyes, and other organs) suggests that this protein may play a broader role in organogenesis.15 In addition, Dr. Kiyoshi has demonstrated that the overexpression of the COL24A1 gene may be a valuable biomarker for prognosis in HNSCC.7
Certain markers, such as AFP,16 AFP-L3,17 GCP3,18 and MDK,19 have often been used in HCC diagnosis. Nevertheless, most of these markers are unlikely to exactly reflect the diagnostic and therapeutic efficiency.20 Thus, we evaluated the expression of COL24A1 in the TCGA, ICGC, and Oncomine databases and clinical samples to examine its clinical significance in HCC. In addition, we determined the expression of COL24A1 by using many analytical methods to further explore the molecular mechanisms of COL24A1 in the process of HCC.
Materials and Methods
TCGA Database Analysis
To explore the expression of COL24A1 in HCC, we downloaded data for 374 HCC and 50 NH tissue samples in aggregate from the TCGA database (http://cancergenome.nih.gov/). Clinical variables, such as age, sex, pathologic stage, tumor grade, and AJCC TNM cancer stage,21,22 were used for the assessment of the correlation between the expression of COL24A1 and these parameters.
ICGC and Oncomine Database Analysis
A total of 240 HCC and 202 NH tissue samples were downloaded from the ICGC database (https://icgc.org), and the differential expression was examined. A total of 75 HCC tissue samples were collected from the Oncomine database (https://www.oncomine.org) and used to investigate clinical and prognostic differences.
RNA Sequence Data Processing and Differential Expression Analysis
DEseq, edgeR, and the limma package inR23–26 were used to confirm the differentially expressed mRNAs (DEmRNAs) between the HCC and NH tissues. To obtain sufficiently strong and convincing results in this large sample size, we used a false discovery rate (FDR) <0.01 and fold change >10 as thresholds indicating differential RNA expression. The heat map and volcano plots were constructed with the ggplot2 package in R.27
Differential Gene Function and Protein–Protein Interaction (PPI) Network Analysis
The Gene Ontology (GO) analysis of g:profiler (http://biit.cs.ut.ee/gprofiler/gost) was used to provide GO terms for DEmRNAs, and to identify significant biological functions28 (FDR < 0.01). To elucidate the molecular mechanisms of the cellular activities regulating tumorigenesis, the construction of a PPI network is imperative. The PPI network for screening genes was established with the STRING online database, and the interaction score was set to ≥0.4.29 In addition, the results were delineated in Cytoscape software.
Validation of Differential Expression in GEPIA and HCCDB
GEPIA was developed by Dr. Zhang’s laboratory at Peking University. The data source of this tool is the TCGA database. We used this tool to analyze the expression of COL24A1 in different tumors and to explore the varying prognosis associated with differential expression of COL24A1 in all tumors.
HCCDB was provided by Tsinghua University to verify the repeatability of identification of HCC gene expression patterns and the annotation of transcripts.30 In this database, we analyzed the expression of COL24A1 and co-expressed genes in HCC.
Expression of COL24A1 in Clinical Samples and Cell Lines
To further identify the COL24A1 mRNA expression differences between HCC and NH tissues, we collected 80 pairs of clinical cases from the Shengjing Hospital of China Medical University between January 2017 and December 2018. All patients (61 males and 19 females; median age, 61.5; range, 37–77 years old) were postoperatively diagnosed with HCC. We also cultured HepG2, Huh-7, and LO2 cells simultaneously. All the three cell lines were purchased from the Cell bank of Chinese Academy of Sciences, Shanghai. RNA from each sample, including cells, HCC, and NH tissues, was extracted according to the TaKaRa RNAiso Plus protocol. Next, the expression of COL24A1 was measured with TaKaRa TB GreenTM Premix Ex TaqTM II (Takara Biomedical Technology, Beijing) with a Roche LightCycler® 480 system. In this case, β-Actin was used as an internal standard. The PCR cycle protocol used the following parameters: 1 cycle of 30 s at 95°C, 40 cycles of 95°C for 5 s, and 60°C for 20 s. The fold change in expression was calculated with the 2−ΔΔct method. The primers used are as follows: COL24A1 forward: 5′-CCCAGCACGAATCTGCAAAG-3′, reverse: 5′-GTCTGGCCACCAGCACTGAA-3′; and β-Actin forward: 5′-TGGCACCCAGCACAATGAA-3′, reverse: 5′-CTAAGTCATAGTCCGCCTAGAAGCA-3′. Ethical approval was provided by the Shengjing Hospital of China Medical University Ethics committee.
COL24A1 protein levels were measured by immunohistochemistry (IHC). We collected 40 HCC clinical cases from the Shengjing Hospital of China Medical University from January 2015 to December 2016. All patients (32 males and 8 females; median age, 60.5 years; range, 36–85 years old) were diagnosed with HCC during postoperative examinations. All specimens were HCC tissues. The specimens were embedded in paraffin, and all the tissue blocks were cut into 4 μm thick sections. The rabbit anti-COL24A1 antibody was provided by Biorbyt (California, United States. 1:2000). The expression of COL24A1 in tumor tissues was estimated according to the comprehensive score of COL24A1 staining intensity and positivity rate. Immunostaining was recorded according to the following criteria: 1) staining intensity scores of A: no staining = 0, weak = 1, medium = 2, strong = 3, and 2) positive staining ratio of COL24A1, evaluated as B: range 0 (< 5%), range 1 (5–50%) and range 2 (>50%). The total score (A*B) of COL24A1 expression was divided into low expression (0,1,2) and high expression (3,4,6) groups. Finally, we calculated the correlation between COL24A1 expression in HCC, and patient prognosis and survival time.
Statistical Analysis
Statistical analysis, including receiver operating characteristic (ROC), Kaplan-Meier survival analyses, independent sample T-tests and χ2 tests were performed in SPSS 23.0. Univariate and multivariate analyses were based on Cox proportional hazard regression models. P < 0.05 was considered to indicate a statistically significant difference.
Results
TCGA Filtering
A total of 424 samples from the TCGA database for HCC were used. Two statistical methods in R, DEseq and edgeR, were used to screen differentially expressed genes (DEGs). Venn maps (Figure 1A), heat maps (Figure 1B), and volcano plots (Figure 1C) were constructed for these two groups of DEGs. We selected COL24A1 by combining the results of database screening and the relevant literature. With DEseq statistics, the expression fold change was 15.9 between HCC and NH tissues, and the FDR was 0.0003. Meanwhile, with edgeR statistics, the COL24A1 expression fold change was 15.52 between HCC and NH tissues, whereas the FDR was 3.7*10−15. The difference was clear and significant. Moreover, the expression level of COL24A1 was relatively high, in the top one-third among all detected genes.
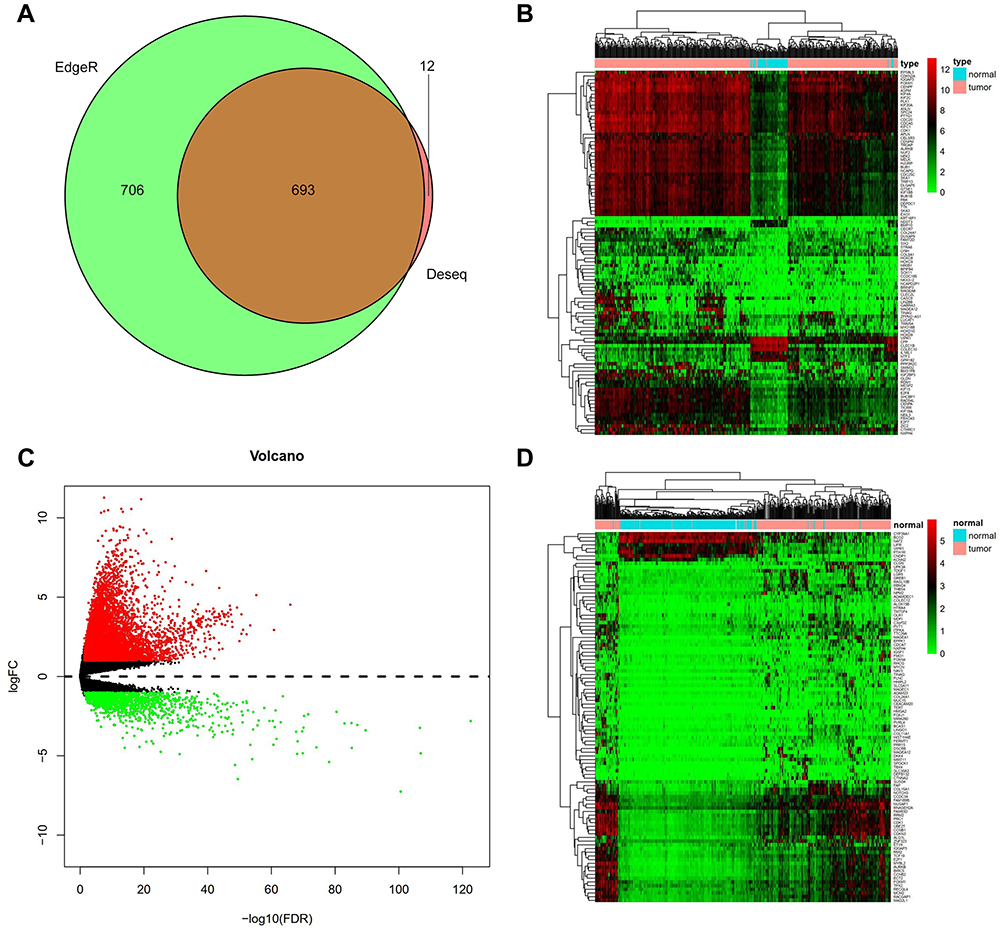 |
Figure 1 Differentially expressed genes in TCGA and ICGC. (A) A total 1399 differential genes were obtained by edgeR and 705 differential genes by DEseq (fold change>10, P< 0.01). Venn diagram of data between the two statistical methods were 693 common differential genes. (B) We screened Heatmap of 100 signature genes in the differential genes of TCGA database. Each column represents a sample and each row represents one of the 100 genes. The expression levels of the 100 genes are shown in different colors, from green to red with increasing expression. (C) We detected 3621 differentially expressed genes (DEGs) in HCC from NH tissues by edgeR and screened volcano plot of DEGs. Each green dot shows a downregulated gene and each red dot shows an upregulated gene (fold change>2, P< 0.05). (D) Heatmap of the 100 signature genes in the differential genes of ICGC database we screened. |
ICGC Validation
We also collected 442 samples from the ICGC database to confirm the COL24A1 expression differences between HCC and HN tissues. We constructed a heatmap (Figure 1D) of 100 significant DEGs, and the expression fold change in COL24A1 was 9.5 between HCC and NH tissues. The FDR was 4.71*10−13. Therefore, the clear difference observed in the TCGA database was also confirmed in the ICGC database.
COL24A1 Expression
The analysis of the independent sample T-tests of 424 TCGA samples revealed that COL24A1 expression was associated with tumor grade (T=3.234, P=0.001; Table 1), TNM stage (T=2.038, P=0.043; Table 1), T stage (T=2.065, P=0.04; Table 1) and pathologic stage (T=2.038, P=0.043; Table 1) on the basis of pathological diagnosis. We also collected statistical results for 75 tissue samples from the Oncomine database, including comparisons among different grades of HCC (Figure 2A), different stages of HCC (Figure 2B), cases with or without vascular invasion (Figure 2C), and cases with or without satellites (Figure 2D). As with our clinical specimens, the COL24A1 expression level was detected with PCR. The results indicated that COL24A1 was clearly over-expressed in HCC, rather than NH tissue (Figure 3A). In addition, in the three cell lines that we cultured, the expression of COL24A1 in the tumor cell lines HepG2 and Huh-7 was significantly higher than that in the normal hepatocyte cell line LO2 (Figure 3B). As shown in Figure 4, IHC was used to measure COL24A1 protein expression level, and the IHC staining of COL24A1 in HCC specimens is shown in Figure 4A–D, revealing no, weak, moderate or strong staining (X100); Figure 4E–H shows high-power field images (X400). Location analysis confirmed that COL24A1 was mainly concentrated in the cytoplasm in tumor cells. χ2 Tests were performed to assess the correlations between COL24A1 expression (low and high) and clinicopathological characteristics (Table 2). The results indicated that high expression of COL24A1 was predictive of later TNM stage and worse tumor grade, but was not significantly correlated with T stage and BCLC stage.
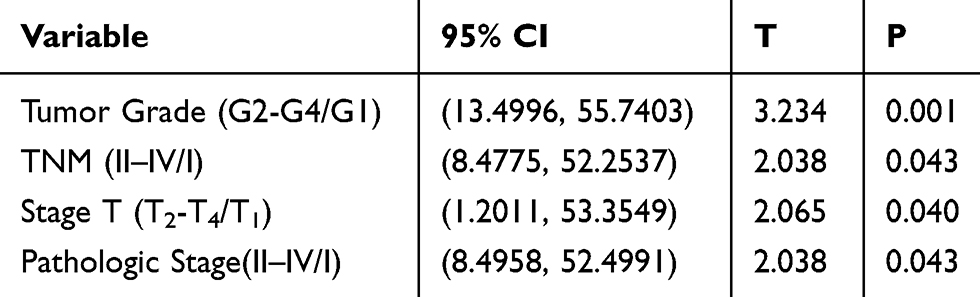 |
Table 1 Clinical Association Between COL24A1 Expression and Clinicopathological Variables in HCC Patients |
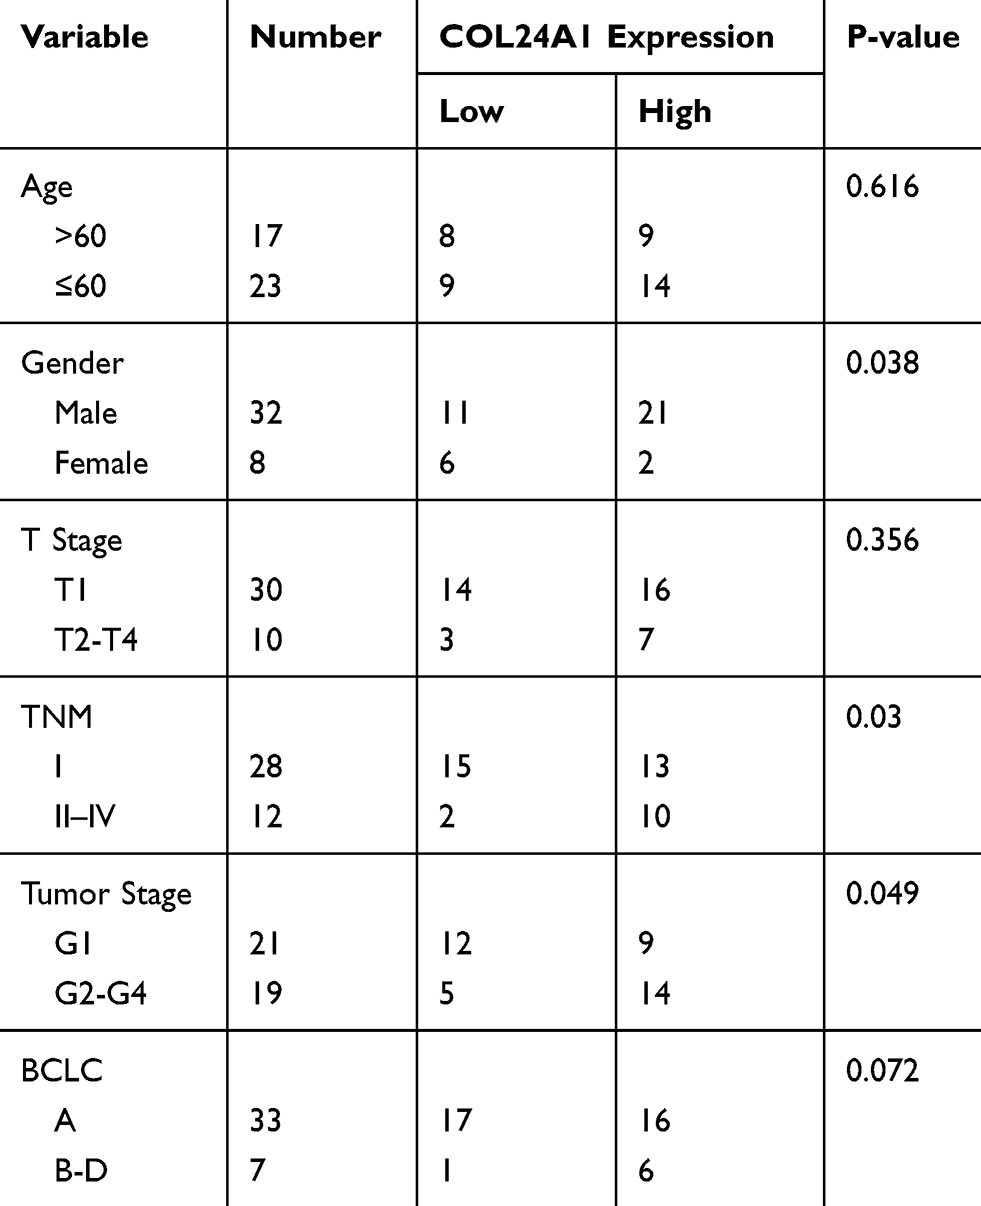 |
Table 2 Clinical Association Between COL24A1 Expression and Clinicopathological Variables in HCC Clinical Samples |
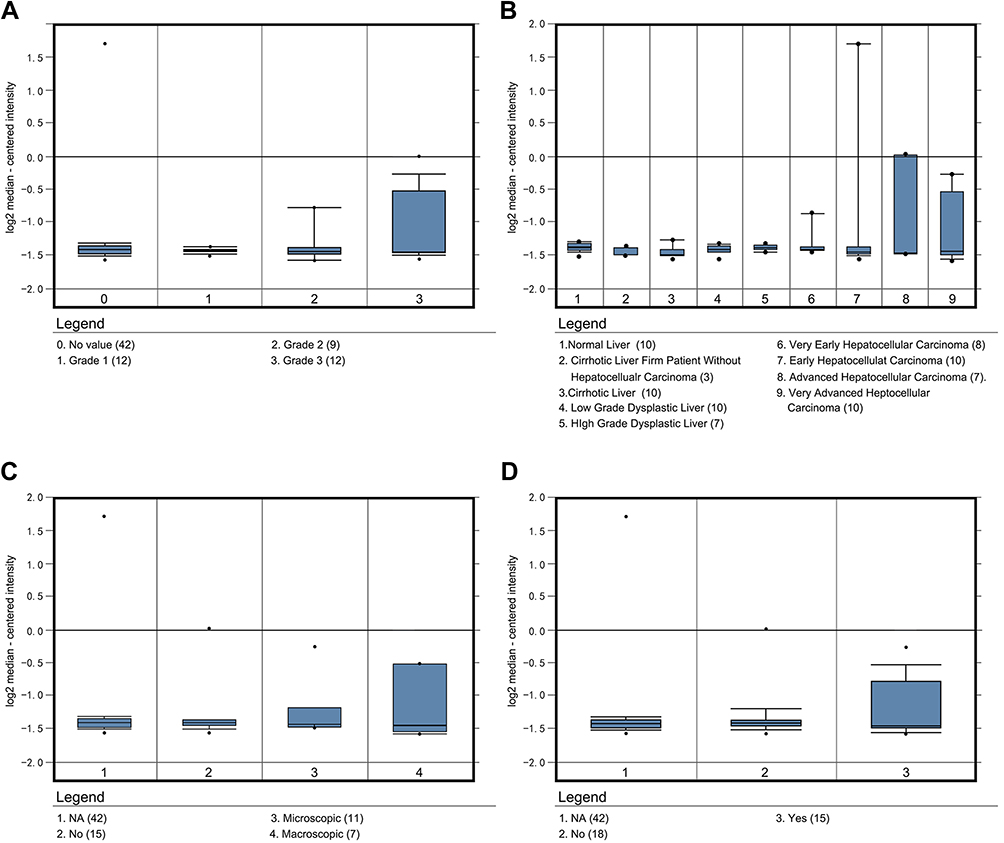 |
Figure 2 COL24A1 expression analysis in 75 samples in Oncomine. (A) The COL24A1 expression in different grade of HCC. (B) The COL24A1 in different HCC stage. (C) The different COL24A1 expression in HCC with vascular invasion. (D) The different COL24A1 expression in HCC with or without satellites. |
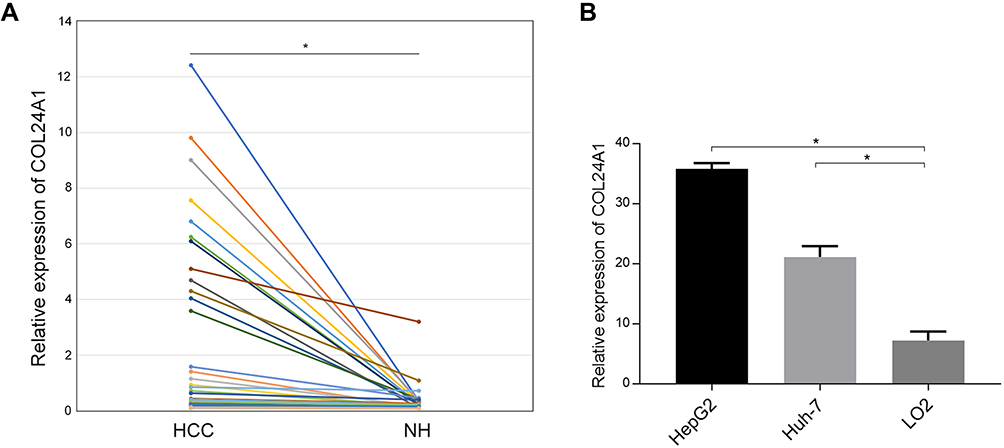 |
Figure 3 T-test of PCR results in 80 pair of clinical samples and 3 cell lines. (A) T-test of PCR results in 80 pair of clinical samples showed that the expression of COL24A1 in HCC tissues was significantly higher than that in normal hepatic (NH) tissues (*P<0.01). (B) The expression of COL24A1 in HepG2 and Huh-7 was also significantly higher than that in LO2 cell line (*P<0.01) |
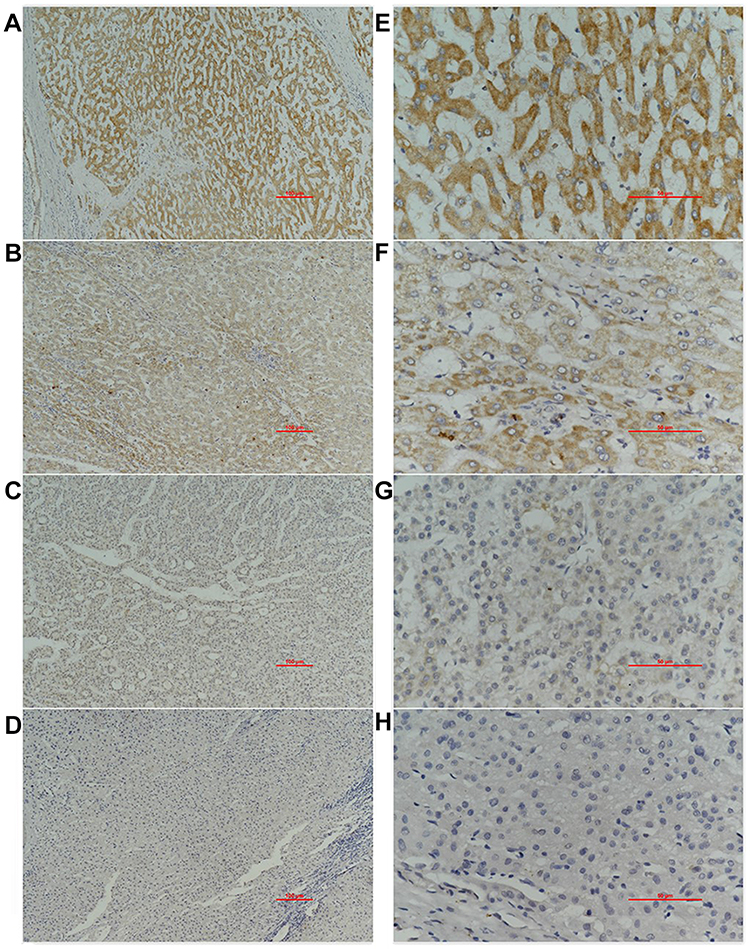 |
Figure 4 Immunohistochemical result in 40 clinical samples. Immunohistochemical staining of COL24A1 in 40 HCC specimens: (A–D) represent no staining, weak, moderate, strong (X100); (E–H) are high-power field images (X400). |
Diagnostic and Survival Analysis
Univariate Cox regression analysis indicated that the OS of HCC was markedly correlated with tumor grade, TNM stage, stage T, pathologic stage, and COL24A1 expression (Table 3). However, multivariate analysis revealed that the expression of COL24A1 and the prognosis of HCC were also significantly (Table 4). Moreover, the OS of patients with HCC in both the TCGA (Figure 5A) and Oncomine (Figure 5C) databases, and 40 clinical cases collected from our hospital (Figure 5D), were analyzed with Kaplan-Meier plotter, and the results indicated that high COL24A1 expression was correlated with shorter OS in patients with HCC. The disease-free survival analysis of COL24A1 in TCGA was also investigated (Figure 5B). The diagnostic value of COL24A1 in HCC was estimated with a ROC curve (X-axis: 1-specificity; Y-axis: sensitivity). An AUC value of 0.75 revealed a favorable diagnostic value (P < 0.001; Figure 6A).
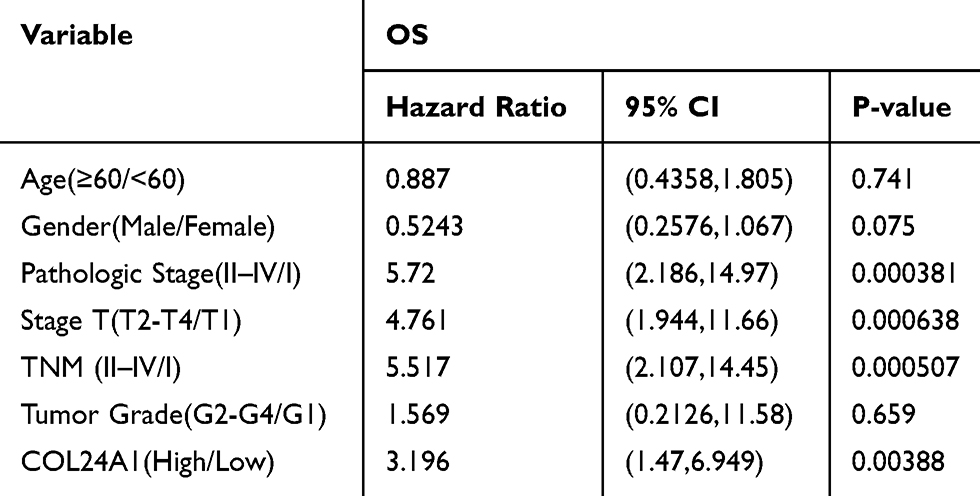 |
Table 3 Univariate Analysis of Prognostic Factors of HCC |
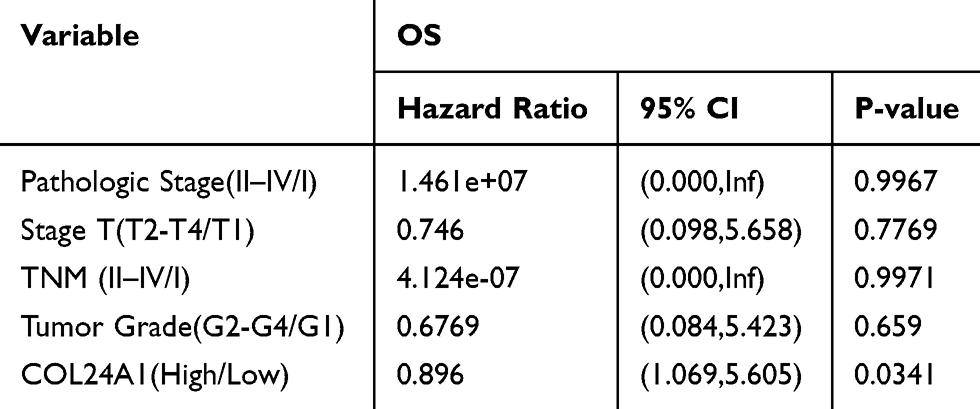 |
Table 4 Multivariate Analysis of Prognostic Factors of HCC |
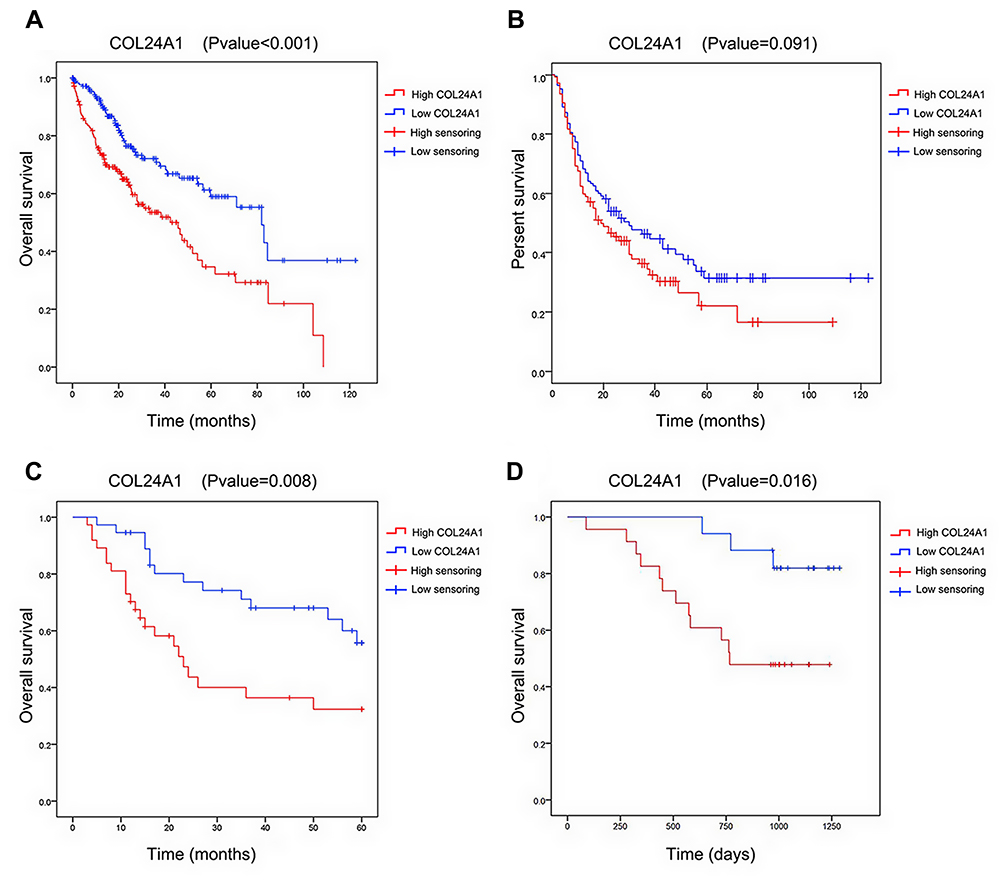 |
Figure 5 Survival analysis of COL24A1 in databases and clinical cases. (A) Survival analysis of COL24A1 in 374 samples in TCGA database demonstrated that high COL24A1 expression was significantly associated with a reduced OS using Kaplan-Meier Plotter. (B) Disease free survival analysis of COL24A1 in 374 samples in TCGA database did not demonstrate that high COL24A1 expression was significantly associated with the reduced OS. (C) Survival analysis of COL24A1 in 75 samples in Oncomine database demonstrated that high COL24A1 expression was significantly associated with a reduced OS. (D) Survival analysis of COL24A1 in 40 clinical cases demonstrated that high COL24A1 expression was significantly associated with a reduced OS. |
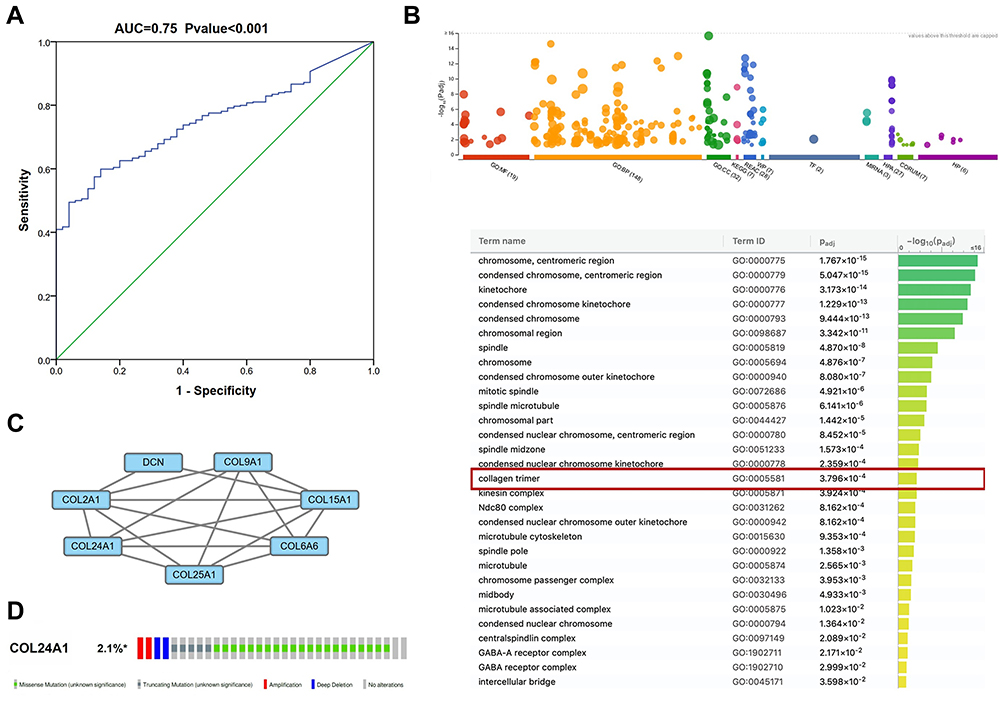 |
Figure 6 The ROC curve, GO analysis, PPI network analysis, alteration analysis of COL24A1. (A) The ROC curve of COL24A1 expression in HCC, the curve indicated that COL24A1 possessed a moderate diagnostic ability for GC (AUC =0.75, P < 0.001). (B) GO analysis of the differentially expressed mRNAs in g:Profiler. (C) PPI network analysis of the differentially expressed mRNAs in STRING database. (D) A total of 2.1% of HCC cases exhibited COL24A1 transformation in cBioPortal. |
Bioinformatic Analysis
According to GO analysis of the DEmRNAs in g:Profiler, COL24A1 was enriched in the terms cellular component and collagen trimer, which contains MARCO, FCN3, FCN2, COLEC10, COL6A6, CCBE1, COL15A1, COL25A1, COL9A1, CTHRC1, DCN, COL2A1, C1QL1, COL24A1, GLDN, and C1QL4. The adjusted P value was 3.796*10−4 (Figure 6B).
We input all the DEGs screened by Deseq into STRING and obtained 882 DEGs for PPI analysis in Cytoscape. The network was constructed with combined scores ≥0.4 and contained 774 nodes and 8473 edges. Then, a functional module was identified with the MCODE plugin, which comprised seven nodes and 17 edges, including COL24A1, COL15A1, COL25A1, COL2A1, COL6A6, COL9A1, and DCN (Figure 6C). We also analyzed the prognostic value of the other six proteins according to the TCGA database, and we found that four of them are simultaneously closely associated with prognosis (Figure 7). The results also reveal the value of COL24A1 in protein interaction and prognosis.
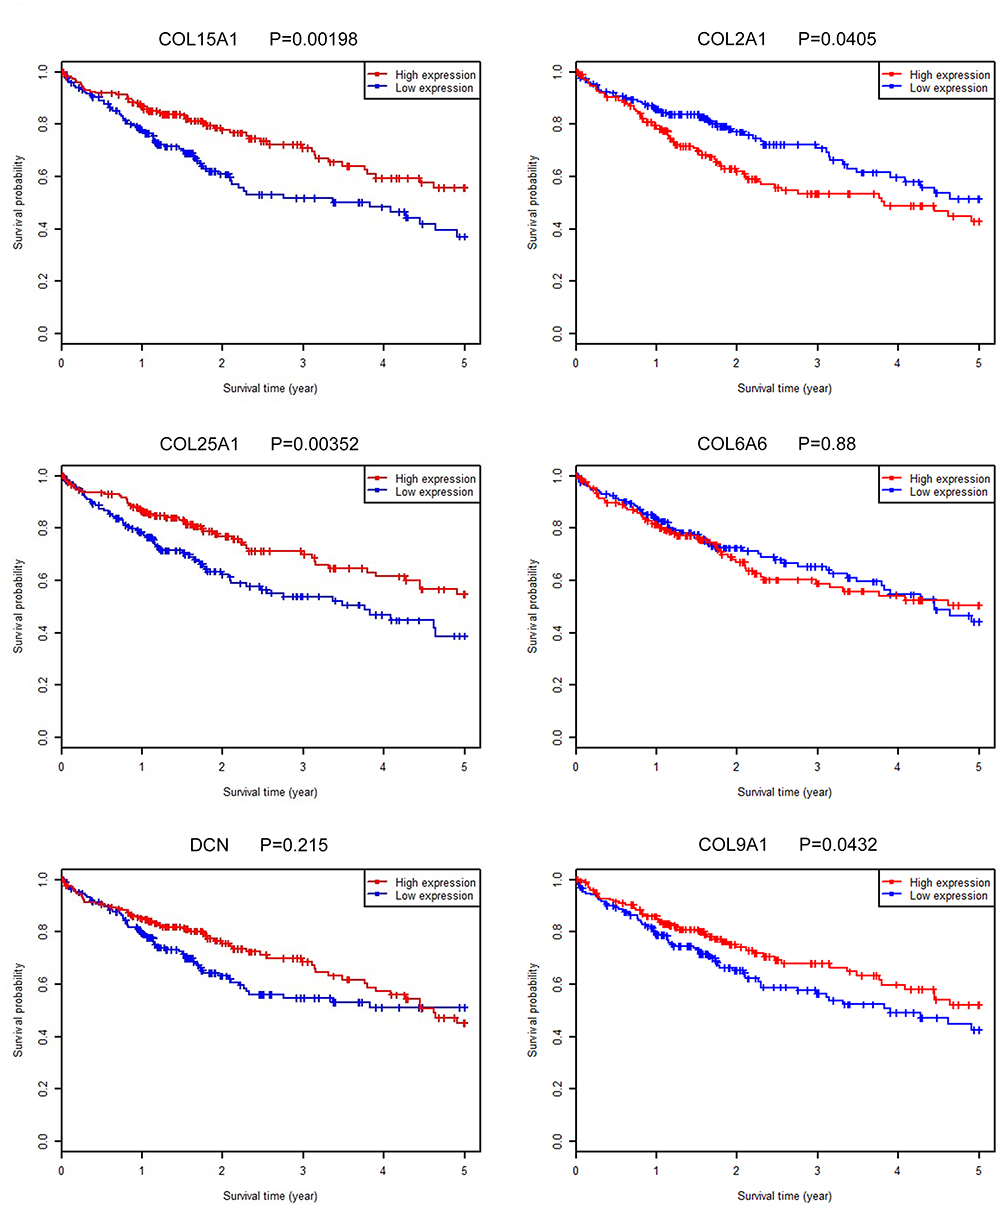 |
Figure 7 Survival analysis of COL5A1, COL25A1, DCN, COL2A1, COL6A6 and COL9A1 in TCGA database. Survival analysis of COL5A1, COL25A1, COL2A1 and COL9A1 in TCGA database demonstrated that high expression of them were significantly associated with the reduced OS. |
The modification of COL24A1 in 1424 cases of HCC in cBioPortal was investigated31,32 (Figure 6D). The results revealed that 2.1% (30/1424) of HCC cases presented COL24A1 modification, containing missense mutations (21/1424), amplifications (2/1424), truncating mutations (5/1424), and extensive deletions (2/1424).
Finally, we validated the differential expression of COL24A1 with the GEPIA tool and HCCDB database. In GEPIA, we found that the expression of COL24A1 in 10 tumor tissues—hepatocellular carcinoma, breast invasive carcinoma, cholangiocarcinoma, colon adenocarcinoma, head and neck squamous cell carcinoma, lung adenocarcinoma, lung squamous cell carcinoma, prostate adenocarcinoma, sarcoma, and pheochromocytoma/paraganglioma—was clearly higher than that in normal tissues (Figure 8A). In addition, we performed statistical analysis of the expression of COL24A1 in all tumors, and the OS curve again validated that high expression of COL24A1 was indicative of poor prognosis (Figure 8B). Then, in HCCDB, we demonstrated that the COL24A1 expression in HCC tissues was more significant than that in NH tissues in 8 of 10 clinical cohorts (Figure 9A). COL24A1 was expressed in various tissues, but its expression was low in normal liver tissues (Figure 9B) and significantly higher in HCC (Figure 9C). The HCC meta co-expression network is also summarized in this database (Figure 9D).
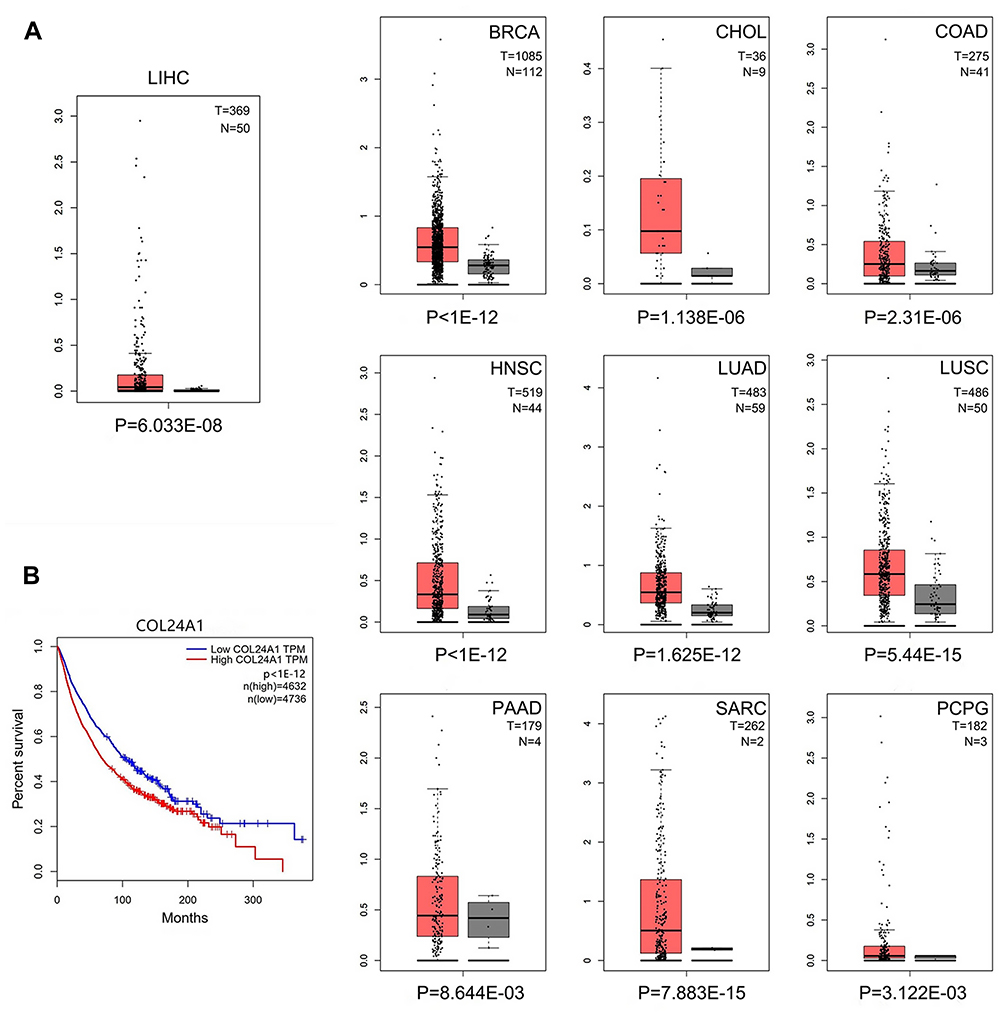 |
Figure 8 COL24A1 expression analysis in GEPIA. (A) The expression of COL24A1 in 10 tumor tissues were obviously higher than that in normal tissues. (B) The OS curve of all tumor samples in TCGA validated that high expression of COL24A1 indicated poor prognosis. |
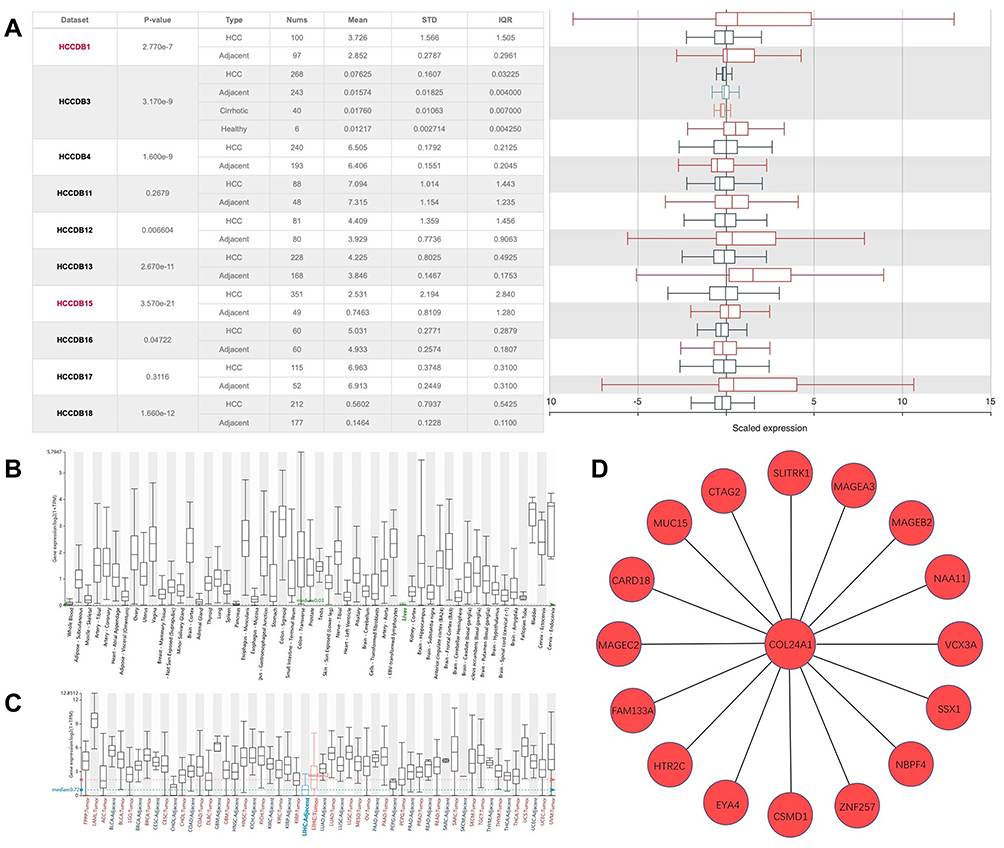 |
Figure 9 COL24A1 expression analysis in HCCDB. (A) COL24A1 expression in 8 of 10 clinical cohorts has significant differences between HCC and NH tissues. (B) The expression of col24a1 in normal liver tissues was very low. (C) The expression of COL24A1 varied in different tissues and tumors, and the difference was significant in hepatocellular carcinoma. (D) HCC meta co-expression network about COL24A1 in HCCDB. |
Discussion
HCC is a common malignant tumor worldwide, and it is often diagnosed in advanced stages, when the fatality rate is very high.33 At present, the diagnosis of hepatocellular carcinoma primarily depends on CT, MRI and other imaging methods,34 or some serological indicators such as AFP and AFP-L3.35 The overall detection rate remains relatively low. Therefore, determining effective diagnostic and prognostic targets for HCC is necessary. However, no systematic study on the diagnostic and prognostic value of COL24A1 in HCC has been reported to date.
As shown in two heat maps, the COL24A1 expression in HCC tissues in the two databases was significantly higher than that in NH tissues. In addition, as shown in Table 1, the association between COL24A1 expression and clinicopathological features was evaluated with independent sample T-tests. The high expression of COL24A1 indicated more serious tumor invasion, poorer pathologic stage and later clinical stage, and these results were confirmed in our IHC analysis of 40 clinical samples, as shown in Table 2. Simultaneously, as illustrated in Figure 2, high expression of COL24A1 was also predictive of vascular invasion and the presence of satellites. The analysis of the TCGA and ICGC database suggested that COL24A1 has significantly higher expression in HCC than in NH tissues. The results of our analysis of 80 pairs of clinical samples with PCR tests were essentially the same. Therefore, COL24A1 was inferred to be an oncogene involved in the occurrence and development of HCC. Then, we chose two classic liver cancer cell lines, HepG2 and Huh-7, and one normal hepatocyte cell line, LO2, to further validate the results. As expected, the expression of COL24A1 in HepG2 and Huh-7 was higher than that in LO2. We then used GEPIA to explore the expression of COL24A1 in different tumors, and we found that COL24A1 was highly expressed in at least 10 tumors; thus, also suggesting that COL24A1 expression might be common among different tumors in different organs. Finally, we grouped all tumors according to the expression of COL24A1 and analyzed the prognosis. The OS curve validated that high expression of COL24A1 indeed indicated a poor prognosis. This finding again suggested that COL24A1 may play a similar role in different tumors. However, the underlying mechanisms must be confirmed with more in vivo and in vitro studies.
As confirmed in Tables 3 and 4, univariate and multivariate analysis indicated COL24A1 expression as an independent prognostic factor. In addition, we grouped the patients from the TCGA and Oncomine databases according to the expression of COL24A1. The results indicated that high COL24A1 expression was exactly correlated with a shorter OS of patients with HCC, and the same trend was also found in our 40 follow-ups of clinical samples. However, as shown in Figure 5B, when we analyzed the disease-free survival of two groups of cases from the TCGA database, the P value was >0.05. However, as illustrated in the whole curve, the disease-free survival of the high COL24A1 expression group was still lower than that of the low COL24A1 expression group. Although the difference was not highly significant, this finding may be useful for reference. Finally, the ROC (Figure 6A) analysis demonstrated COL24A1 had a remarkable diagnostic value for HCC (AUC = 0.75; P < 0.001).
To date, no specific studies have reported the correlation of COL24A1 expression and other indicators. Because cooperative detection of multiple indicators can increase the diagnostic rate of HCC, we also performed GO analysis and protein interaction network analysis. We found that COL25A1, COL15A1, COL2A1, COL6A6, COL9A1, and DCN, as well as some other related genes and proteins, such as COL5A1, COL25A1, COL2A1, and COL9A1, in the PPI model were significantly associated with the OS. Their co-expression is clearly of great significance for the prognosis of HCC.
In our study, we considered COL24A1 as an effective replacement or supplement to the currently used prognostic parameters. Simultaneously, we detected the alterations in COL24A1 in HCC to identify potential mechanisms in HCC. The results revealed that 2.1% of COL24A1 includes alterations such as missense mutations, amplifications, truncating mutations, and extensive deletions. From GO analysis, PPI network analysis, and mutation type analysis, we inferred that in tumors with late clinical stage, poor pathological classification as well as poor biological behavior, COL24A1 may interact with other proteins in its family, thereby transforming the expression of collagen proteins and proteoglycans such as DCN.36 Changes in these protein components may affect different biological activities of tumors, such as occurrence, development, invasion, and metastasis, and may ultimately lead to different prognosis. Liver cirrhosis is one of the most important steps in the development of HCC. The variety in the expression of collagen family may be associated with the long-term cirrhosis in the occurrence and development of HCC.37 Nevertheless, although the above analysis provides a novel picture for future investigation, further studies are needed to validate the functions of COL24A1 in HCC.
Conclusions
In conclusion, COL24A1 was found to be overexpressed in HCC and to have remarkable diagnostic and prognostic value for HCC. It is expected to become a new diagnostic and prognostic indicator of HCC in the future.
Ethics and Consent Statement
The present study was approved by the Ethics Committee of The Shengjing Hospital of China Medical University (Liaoning, China), because the samples we used were medical waste, the informed consent was not required, we would keep patient data strictly confidential. In line with the declaration of Helsinki. Ethical code: 2019PS542K.
Acknowledgments
Funding: This study was supported by Department of Science &Technology of Liaoning province project (2017225032), Science and Technology Bureau of Shenyang City project (17-230-9-16), and 345 Talent Project. The authors also would like to thank The Cancer Genome Atlas (https://cancergenome.nih.gov/), International Cancer Genome Consortium (https://icgc.org) and Oncomine (https://www.oncomine.org).
Author Contributions
(I) Conception and design: Long Yan
(II) Administrative support: Chaoliu Dai
(III) Provision of study materials or patients: Chaoliu Dai and Feng Xu
(IV) Collection and assembly of data: Long Yan
(V) Data analysis and interpretation: Long Yan
(VI) Manuscript writing: All authors
(VII) Final approval of manuscript: All authors
All authors contributed to data analysis, drafting or revising the article, gave final approval of the version to be published, and agree to be accountable for all aspects of the work.
Disclosure
The authors report no conflicts of interest in this work.
References
1. Kim E, Lisby A, Ma C, et al. Promotion of growth factor signaling as a critical function of beta-catenin during HCC progression. Nat Commun. 2019;10(1):1909. doi:10.1038/s41467-019-09780-z
2. De Toni EN, Schlesinger-Raab A, Fuchs M, et al. Age independent survival benefit for patients with hepatocellular carcinoma (HCC) without metastases at diagnosis: a population-based study. Gut. 2019.
3. DiStefano JK, Davis B. Diagnostic and prognostic potential of AKR1B10 in human hepatocellular carcinoma. Cancers. 2019;11(4):486. doi:10.3390/cancers11040486
4. Li YM, Liu ZY, Wang JC, et al. Receptor-interacting protein kinase 3 deficiency recruits myeloid-derived suppressor cells to hepatocellular carcinoma through the chemokine (C-X-C Motif) Ligand 1-Chemokine (C-X-C Motif) receptor 2 axis. Hepatology. 2019;70:1564–1581.
5. Matsuo N, Tanaka S, Yoshioka H, Koch M, Gordon MK, Ramirez F. Collagen XXIV (Col24a1) gene expression is a specific marker of osteoblast differentiation and bone formation. Connect Tissue Res. 2008;49(2):68–75. doi:10.1080/03008200801913502
6. Myllyharju J, Kivirikko KI. Collagens, modifying enzymes and their mutations in humans, flies and worms. Trends Genet. 2004;20(1):33–43. doi:10.1016/j.tig.2003.11.004
7. Misawa K, Kanazawa T, Imai A, et al. Prognostic value of type XXII and XXIV collagen mRNA expression in head and neck cancer patients. Mol Clin Oncol. 2014;2(2):285–291. doi:10.3892/mco.2013.233
8. Yin Y, Zhao Y, Li AQ, Si JM. Collagen: a possible prediction mark for gastric cancer. Med Hypotheses. 2009;72(2):163–165. doi:10.1016/j.mehy.2008.09.010
9. Maehara J, Masugi Y, Abe T, et al. Quantification of intratumoral collagen and elastin fibers within hepatocellular carcinoma tissues finds correlations with clinico-patho-radiological features. Hepatol Res. 2019.
10. Liu Y, Zhang J, Chen Y, et al. The correlation and role analysis of COL4A1 and COL4A2 in hepatocarcinogenesis. Aging. 2020;12(1):204–223. doi:10.18632/aging.v12i1
11. Kimura K, Nakayama M, Naito I, et al. Human collagen XV is a prominent histopathological component of sinusoidal capillarization in hepatocellular carcinogenesis. Int J Clin Oncol. 2016;21(2):302–309. doi:10.1007/s10147-015-0888-2
12. Zhang R, Ma M, Lin XH, et al. Extracellular matrix collagen I promotes the tumor progression of residual hepatocellular carcinoma after heat treatment. BMC Cancer. 2018;18(1):901. doi:10.1186/s12885-018-4820-9
13. Ma HP, Chang HL, Bamodu OA, et al. Collagen 1A1 (COL1A1) is a reliable biomarker and putative therapeutic target for hepatocellular carcinogenesis and metastasis. Cancers. 2019;11(6):786. doi:10.3390/cancers11060786
14. Matsuo N, Tanaka S, Gordon MK, Koch M, Yoshioka H, Ramirez F. CREB-AP1 protein complexes regulate transcription of the collagen XXIV gene (Col24a1) in osteoblasts. J Biol Chem. 2006;281(9):5445–5452. doi:10.1074/jbc.M509923200
15. Koch M, Laub F, Zhou P, et al. Collagen XXIV, a vertebrate fibrillar collagen with structural features of invertebrate collagens: selective expression in developing cornea and bone. J Biol Chem. 2003;278(44):43236–43244. doi:10.1074/jbc.M302112200
16. Sengupta S, Parikh ND. Biomarker development for hepatocellular carcinoma early detection: current and future perspectives. Hepatic Oncol. 2017;4(4):111–122. doi:10.2217/hep-2017-0019
17. Khien VV, Mao HV, Chinh TT, et al. Clinical evaluation of lentil lectin-reactive alpha-fetoprotein-L3 in histology-proven hepatocellular carcinoma. Int J Biol Markers. 2001;16(2):105–111. doi:10.1177/172460080101600204
18. Qiao SS, Cui ZQ, Gong L, et al. Simultaneous measurements of serum AFP, GPC-3 and HCCR for diagnosing hepatocellular carcinoma. Hepato-Gastroenterol. 2011;58(110–111):1718–1724. doi:10.5754/hge11124
19. Zhu WW, Guo JJ, Guo L, et al. Evaluation of midkine as a diagnostic serum biomarker in hepatocellular carcinoma. Clin Cancer Res. 2013;19(14):3944–3954. doi:10.1158/1078-0432.CCR-12-3363
20. Zhou J, Yu L, Gao X, et al. Plasma microRNA panel to diagnose hepatitis B virus-related hepatocellular carcinoma. J Clin Oncol. 2011;29(36):4781–4788. doi:10.1200/JCO.2011.38.2697
21. Kamarajah SK, Frankel TL, Sonnenday C, Cho CS, Nathan H. Critical evaluation of the American Joint Commission on Cancer (AJCC) 8th edition staging system for patients with hepatocellular carcinoma (HCC): a Surveillance, Epidemiology, End Results (SEER) analysis. J Surg Oncol. 2018;117(4):644–650. doi:10.1002/jso.24908
22. Kim Y, Moris DP, Zhang XF, et al. Evaluation of the 8th edition American Joint Commission on Cancer (AJCC) staging system for patients with intrahepatic cholangiocarcinoma: a surveillance, epidemiology, and end results (SEER) analysis. J Surg Oncol. 2017;116(6):643–650. doi:10.1002/jso.24720
23. Robinson MD, McCarthy DJ, Smyth GK. edgeR: a Bioconductor package for differential expression analysis of digital gene expression data. Bioinformatics. 2010;26(1):139–140. doi:10.1093/bioinformatics/btp616
24. Anders S, Huber W. Differential expression analysis for sequence count data. Genome Biol. 2010;11(10):R106. doi:10.1186/gb-2010-11-10-r106
25. McCarthy DJ, Chen Y, Smyth GK. Differential expression analysis of multifactor RNA-Seq experiments with respect to biological variation. Nucleic Acids Res. 2012;40(10):4288–4297. doi:10.1093/nar/gks042
26. Ritchie ME, Phipson B, Wu D, et al. limma powers differential expression analyses for RNA-sequencing and microarray studies. Nucleic Acids Res. 2015;43(7):e47. doi:10.1093/nar/gkv007
27. Ito K, Murphy D. Application of ggplot2 to pharmacometric graphics. CPT Pharmacometrics Syst Pharmacol. 2013;2:e79.
28. Raudvere U, Kolberg L, Kuzmin I, et al. g:Profiler: a web server for functional enrichment analysis and conversions of gene lists (2019 update). Nucleic Acids Res. 2019;47(W1):W191–w8. doi:10.1093/nar/gkz369
29. Szklarczyk D, Gable AL, Lyon D, et al. STRING v11: protein-protein association networks with increased coverage, supporting functional discovery in genome-wide experimental datasets. Nucleic Acids Res. 2019;47(D1):D607–D13. doi:10.1093/nar/gky1131
30. Lian Q, Wang S, Zhang G, et al. HCCDB: a database of hepatocellular carcinoma expression atlas. Genom Proteom Bioinf. 2018;16(4):269–275. doi:10.1016/j.gpb.2018.07.003
31. Gao J, Aksoy BA, Dogrusoz U, et al. Integrative analysis of complex cancer genomics and clinical profiles using the cBioPortal. Sci Signal. 2013;6(269):pl1. doi:10.1126/scisignal.2004088
32. Cerami E, Gao J, Dogrusoz U, et al. The cBio cancer genomics portal: an open platform for exploring multidimensional cancer genomics data. Cancer Discov. 2012;2(5):401–404. doi:10.1158/2159-8290.CD-12-0095
33. Zhou K, Fountzilas C. Outcomes and quality of life of systemic therapy in advanced hepatocellular carcinoma. Cancers. 2019;11(6):861. doi:10.3390/cancers11060861
34. Li J, Wang J, Lei L, Yuan G, He S. The diagnostic performance of gadoxetic acid disodium-enhanced magnetic resonance imaging and contrast-enhanced multi-detector computed tomography in detecting hepatocellular carcinoma: a meta-analysis of eight prospective studies. Eur Radiol. 2019;29(12):6519–6528. doi:10.1007/s00330-019-06294-6
35. Toader E, Bancu A, Mitrica DE, Constantinescu G, Stefanescu G, Balan GG. Interrelations between elevated alpha-fetoprotein levels and tumor morphology of patients with hepatocellular carcinoma. Rom J Morphol Embryol. 2019;60(1):181–187.
36. Li G, Li M, Liang X, et al. Identifying DCN and HSPD1 as potential biomarkers in colon cancer using 2D-LC-MS/MS combined with iTRAQ technology. J Cancer. 2017;8(3):479–489. doi:10.7150/jca.17192
37. Mittal S, El-Serag HB. Epidemiology of hepatocellular carcinoma: consider the population. J Clin Gastroenterol. 2013;47(Suppl):S2–6. doi:10.1097/MCG.0b013e3182872f29
 © 2020 The Author(s). This work is published and licensed by Dove Medical Press Limited. The full terms of this license are available at https://www.dovepress.com/terms.php and incorporate the Creative Commons Attribution - Non Commercial (unported, v3.0) License.
By accessing the work you hereby accept the Terms. Non-commercial uses of the work are permitted without any further permission from Dove Medical Press Limited, provided the work is properly attributed. For permission for commercial use of this work, please see paragraphs 4.2 and 5 of our Terms.
© 2020 The Author(s). This work is published and licensed by Dove Medical Press Limited. The full terms of this license are available at https://www.dovepress.com/terms.php and incorporate the Creative Commons Attribution - Non Commercial (unported, v3.0) License.
By accessing the work you hereby accept the Terms. Non-commercial uses of the work are permitted without any further permission from Dove Medical Press Limited, provided the work is properly attributed. For permission for commercial use of this work, please see paragraphs 4.2 and 5 of our Terms.