")
Back to Journals » International Journal of General Medicine » Volume 15
Overexpressing PLOD Family Genes Predict Poor Prognosis in Pancreatic Cancer
Authors Zhang J, Tian Y, Mo S, Fu X
Received 4 December 2021
Accepted for publication 8 March 2022
Published 17 March 2022 Volume 2022:15 Pages 3077—3096
DOI https://doi.org/10.2147/IJGM.S341332
Checked for plagiarism Yes
Review by Single anonymous peer review
Peer reviewer comments 3
Editor who approved publication: Dr Scott Fraser
Jing Zhang,1,2 YanZhang Tian,1 ShaoJian Mo,1 XiFeng Fu1
1Department of Biliary and Pancreatic Surgery, Third Hospital of Shanxi Medical University, Shanxi Bethune Hospital, Shanxi Academy of Medical Sciences, Tongji Shanxi Hospital, Taiyuan, Shanxi, 030032, People’s Republic of China; 2The Fifth People’s Hospital of Datong, Datong, Shanxi Province, 037006, People’s Republic of China
Correspondence: XiFeng Fu, Department of Biliary and Pancreatic Surgery, Third Hospital of Shanxi Medical University, Shanxi Bethune Hospital, Shanxi Academy of Medical Sciences, Tongji Shanxi Hospital, Taiyuan, 030032, People’s Republic of China, Email [email protected]
Background: Pancreatic cancer is a common malignant tumor. Multiple studies have shown that procollagen lysyl-hydroxylase (PLOD) family genes were closely related to tumor progression and metastasis in a variety of human cancers. This study aimed to explore the prognosis and biological role of PLOD family genes in pancreatic adenocarcinoma (PAAD).
Methods: GEPIA, GEO, HPA, CCLE, Kaplan–Meier plotter, cBioPortal, LinkedOmics, DAVID6.8, STRING, and TIMER were employed to determine the prognostic values and biological function of PLOD family members in PAAD.
Results: The mRNA and protein expression patterns of PLOD family members were noticeably up-regulated in PAAD compared with normal tissues. PLOD family gene expression was also up-regulated in pancreatic cancer cell lines. PLOD1 was correlated with histological and pathological grades of pancreatic cancer. PLOD2 was related to histological grade. The high expression of PLOD1-2 was correlated with the poor overall survival rate and relapse-free survival rate in patients with PAAD. Additionally, PLODs showed high sensitivity and specificity in distinguishing pancreatic cancer from normal tissues. Through the functional enrichment analysis of PLOD-related genes in PAAD, we found that PLODs were enriched in collagen fiber tissue structure, lysine degradation, and collagen biosynthesis. Pathway analysis confirmed that PLODs regulated the proliferation, migration, and metastasis of pancreatic cancer through the RalGEF-Ral signaling pathway. Furthermore, the level of expression of PLOD1-2 was positively correlated with the activity of tumor-infiltrating immune cells, including CD8+T cells, neutrophils, macrophages, and dendritic cells. The level of expression of PLOD3 was inversely correlated with the level of infiltration of CD8+T cells. PLOD1 and PLOD2 were highly expressed in pancreatic cancer tissues with TP53 and KRAS mutations, respectively. However, the level of expression of PLOD3 in SMAD4 wild-type pancreatic cancer was increased.
Conclusion: The findings showed that individual PLOD genes or PLOD family genes could be potential prognostic biomarkers for PAAD.
Keywords: PLOD, pancreatic cancer, prognosis, mutations, tumor-infiltrating immune cells
Introduction
Pancreatic cancer is a type of digestive system tumor with a very high degree of malignancy degree, its mortality and morbidity are similar. The 5-year overall survival rate is about 9%.1 Pancreatic cancer is the fourth leading cause of cancer-related death in the United States1 and the sixth leading cause of cancer-related death in China.2 In contrast to other tumor entities such as melanoma, lung cancer, and breast cancer, Medical therapeutic innovations have been scarce in pancreatic ductal adenocarcinoma (PDAC) and survival rates have only marginally improved over the last few decades.1 A unique feature of PDAC is the presence of a desmoplastic stroma that accounts for a majority of the tumor volume, rendering this tumor entity one of the most stroma-rich solid tumor types.3,4 The tumor cell-centric view of previous decades has probably contributed to the lack of significant progress in successful drug development for pancreatic cancer, and the tumor microenvironment itself has become a target of current drug development efforts.5 A histologic hallmark of PDAC is the prominent TME. The TME consists of different non-tumor cells such as fibroblasts, immune cells, endothelial cells, and neurons. In addition, abundant extracellular matrix components such as collagen, hyaluronic acid, and stromal cell proteins create a highly dynamic and hypovascular TME that promote tumor progression and therapeutic resistance.6 Collagen is an important component of ECM. Collagen-cell interactions are involved in maintaining normal tissue function and promoting cancer progression.7,8 Procollagen-lysine, 2-oxoglutarate 5-dioxygenase (PLOD) lysine hydroxylation of collagen, promote cross-linking and deposition; abnormal lysine hydroxylation will promote the development of such tumors.9 The PLOD family is composed of three members, PLOD 1/2/3, which are highly homologous and play a role in lysyl hydroxylation of collagen.9,10 More studies have shown that the over-expression of PLOD family genes plays a role in promoting tumor cell proliferation,11 migration,12 invasion,13 and metastasis12 in human cancer. In addition, hydroxylysine residues provide attachment sites for carbohydrates.14 PLOD1 and PLOD2 are involved in the glycolytic metabolism of renal cell carcinoma and promote the proliferation and invasion of renal cell carcinoma.15 In the present study, the expression, biological significance, and prognosis of PLOD family genes in pancreatic cancer were investigated.
Materials and Methods
GEPIA2 Analysis
The GEPIA database (http://gepia.cancer-pku.cn/) is an on-line dataset for the expression profiles of PLOD family members obtained through pan-cancer analysis and for the comparison of gene expression profiles in cancer and paired normal tissues.16 To study the expression of PLOD family gene members in various cancers, data from TCGA and Genotypic Tissue Expression (GTEx) databases were obtained for visualization of expression profiles. The gene expression of PLODs in pancreatic cancer (PAAD) and non-tumor tissues was compared using the GEPIA2 study. Data screening conditions were as follows: (1) Tumor type: pancreatic cancer; (2) Tissue comparison: pancreatic cancer tissue and normal pancreas tissue; (3) Data-type mRNA; (4) Significance: P < 0.01; (5) Differential level of expression: more than two-fold.
GEO Analysis
GEO database (https://www.ncbi.nlm.nih.gov/geo/), as an international common repository can archive and distribute freely those data submitted by a team involved in collection and collation of microarray, second-generation sequencing, and other forms of high-throughput functional genomics data.17 Gene expression profile datasets GSE1651518 and GSE1547119 were downloaded from the datasets: GSE16515 and GSE15471 use this platform (The Affymetrix Human Genome U133PLus2.0 array); GSE16515 contains gene expression microarray data from 36 pancreatic and 16 paracancerous tissues. GSE15471 contains gene expression microarrays from 39 pancreatic and 39 paracancerous tissue specimens. The original data were preprocessed in the R language (Limma suite), and the expression matrix data of GSE16515 and GSE15471 were obtained by probe transformation according to the annotation information of the chip platform, from which the expression values of PLOD1/2/3 were extracted. A receiver operating characteristic (ROC) model was used to evaluate its diagnostic effectiveness in pancreatic cancer.
HPA Data Analysis
The HPA dataset (https://www.proteinatlas.org/) is open access, allowing researcher free access to the data to explore human proteins.20 The immunohistochemistry of PLOD in PAAD patients was confirmed by referring to the HPA database. According to dyeing intensity and quantity, protein levels of expression were classified into four categories: the classification criteria for protein level of expressions were as follows: negative, not detected; weak and < 25%, not detected; weak combined with either 25–75% or 75%, low; moderate, and < 25%, low; moderate combined with either 25–75% or 75%, medium; strong and < 25%, medium; and strong combined with either 25–75% or 75%, high.
Kaplan–Meier Plotter Survival Analysis
The Kaplan–Meier plotter database data sources include GEO, EGA, and TCGA. The primary purpose of the tool is to discover and verify biomarkers, survival, and prognosis in cancer patients based on a meta-analysis.21 We used mRNA sequencing data from this general pancreatic cancer analysis database to ascertain the association between PLOd1/2/3 and overall survival and recurrence survival in pancreatic cancer. The number of cases at risk, risk ratio (HR), 95% confidence interval (CI), and P-value were shown accordingly. P-values below 0.05 were considered statistically significant.
ROC Curves
Using the UCSC XENA database (https://xenabrowser.net/datapages/) via the Toil process (Vivian et al 2017) allows unified handling of TCGA and GTEx TPM RNAseq data formats. The PAAD of TCGA and the corresponding normal tissue data of GTEx were extracted. The corresponding normal tissue data from TCGA for PAAD and GTEx were extracted. Transcripts of RNAseq data in TPM (transcripts per million reads) were log2 transformed for inter-sample expression comparison using the R package (pROC packet [Version 1.17.0.1] (for analysis) | | ggplot2 package] [Version 3.3.3 (for visualization). The values of the area under the ROC curve (AUC) were between 0.5 and 1. The AUC had an accuracy exceeding 0.9.
CCLE Analysis
The database contains an atlas of in-group deep analysis of thousands of cancer cell lines and the analysis of genetic mutations in more than 1000 CCLE databases, RNA, Cancer Cell Line Encyclopedia cell lines.22 We studied the expression of PLOD1/2/3 in pancreatic cancer cell lines using the CCLE database.
LinkedOmics Database Analysis
The LinkedOmics Database (http://www.linkedomics.org/login.php) is a Web-based platform for analyzing 32 cubes associated with TCGA cancer.23 The LinkFinder module of LinkedOmics was used to study differentially expressed genes associated with PLOD1, 2, and 3 in the TCGA pancreatic cancer (PAAD) cohort (n = 183). The Pearson correlation coefficient was used for statistical analysis. We also adopted the LinkedOmics database to determine the expression of PLOD family genes in TP53, KRAS, SMAD4, CDKN2A wild-type, and mutant pancreatic cancers. The results were presented in the forms of scatter diagrams and box diagrams. P-values below 0.05 were considered statistically significant. A Pearson correlation coefficient greater than 0.3 was considered to represent a moderate correlation.
cBioPortal Data Analysis
cBioPortal for Cancer Genomics is a network resource that can visualize and analyze multidimensional cancer genomic data.24 Copy number variants (CNV), mutations, and gene types in pancreatic cancer based on the cBioPortal on-line instructions were evaluated. A P-value of 0.05 was deemed to indicate a significant difference.
DAVID
To reveal the functions of 121 positively correlated and 237 negatively correlated PLOD family genes in pancreatic cancer from LinkedOmics database analysis, the DAVID database25 was used to explore the functions of PLOD family genes in pancreatic cancer. In this study, gene ontology (GO) and Kyoto Encyclopedia of Genes and Genomes (KEGG) pathway enrichment analyses were performed on PLOD family members and their 121 positives and 237 negative related genes using the DAVID tool, respectively. GO is a biological process (BP) of network construction and module analysis from molecular to biological level, including molecular function (MF), BP, and cellular component. The critical value for important GO terms and KEGG pathways is an error detection rate (EDR) of less than 0.05. The enrichment GO terms and pathways of genes were ordered by enrichment score (-log10 (P-value)).
TIMER Analysis
TIMER is an InterNet platform resource for comprehensive investigation of the relationship between immune cells and multiple cancer types.26 TIMER applied algorithms to evaluate the abundance of tumor-infiltrating immune cells from the gene expression spectrum. In this database, we evaluated the correlation between the expression of PLODs and the abundance of immune infiltrates in pancreatic cancer and the correlation analysis of PLOD co-expressed genes.
Construction of Functional Protein Interaction Networks
The search tool for retrieval of the interaction gene (STRING) database aims to build a functional protein association network by integrating known and predicted protein-protein association data from a large number of organisms.27 The STRING resource is available at http://string-db.org/. We used the STRING database to establish functional protein-protein interaction networks between PLOD family genes. We chose the interaction associated with Homo sapiens and showed a confidence score of more than 0.9 for 30 interactors.
Result
Transcriptional Level of PLODs in Cancer
First, we evaluated the level of expressions of PLOD family genes in different types of human cancers using the GEPIA2 database. PLOD family genes showed relatively up-regulated expression patterns in most cancer types (Figure 1A–C). Meanwhile, we demonstrated PLODs expression profile across all tumor samples and paired normal tissues. (Bar plot. Supplementary Figure 1). Second, we used the GEPIA2 database to compare the expression of PLOD in PAAD with that in normal pancreatic tissues. (Figure 2A). In the GEO database, we compared PLODs mRNA expression in normal pancreatic tissues and PAAD using GSE16515 and GSE15471 datasets, respectively (Figure 2B and C). The expression of PLOD was significantly up-regulated in pancreatic cancer compared with normal pancreatic tissue.
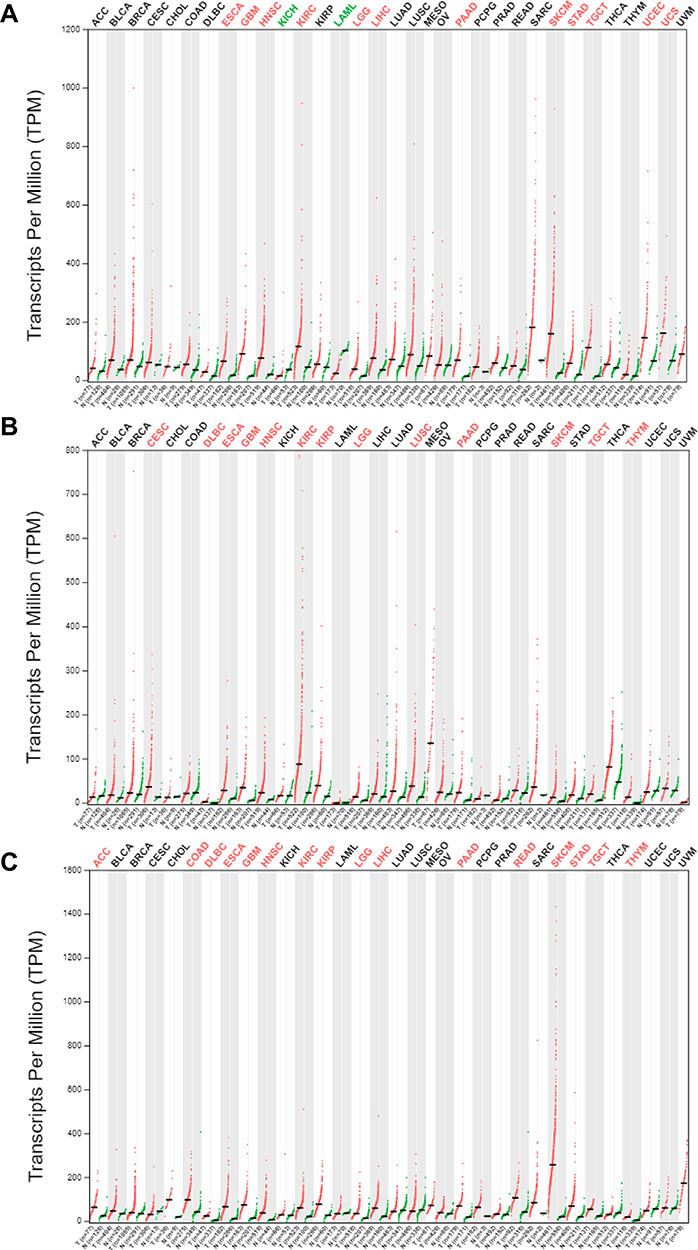 |
Figure 1 Expression of PLOD family members in different tumor tissues. (A–C) depict the transcription levels of PLOD1, PLOD2, and PLOD3 in different types of cancer, respectively. Red, up-regulated; green, down-regulated. |
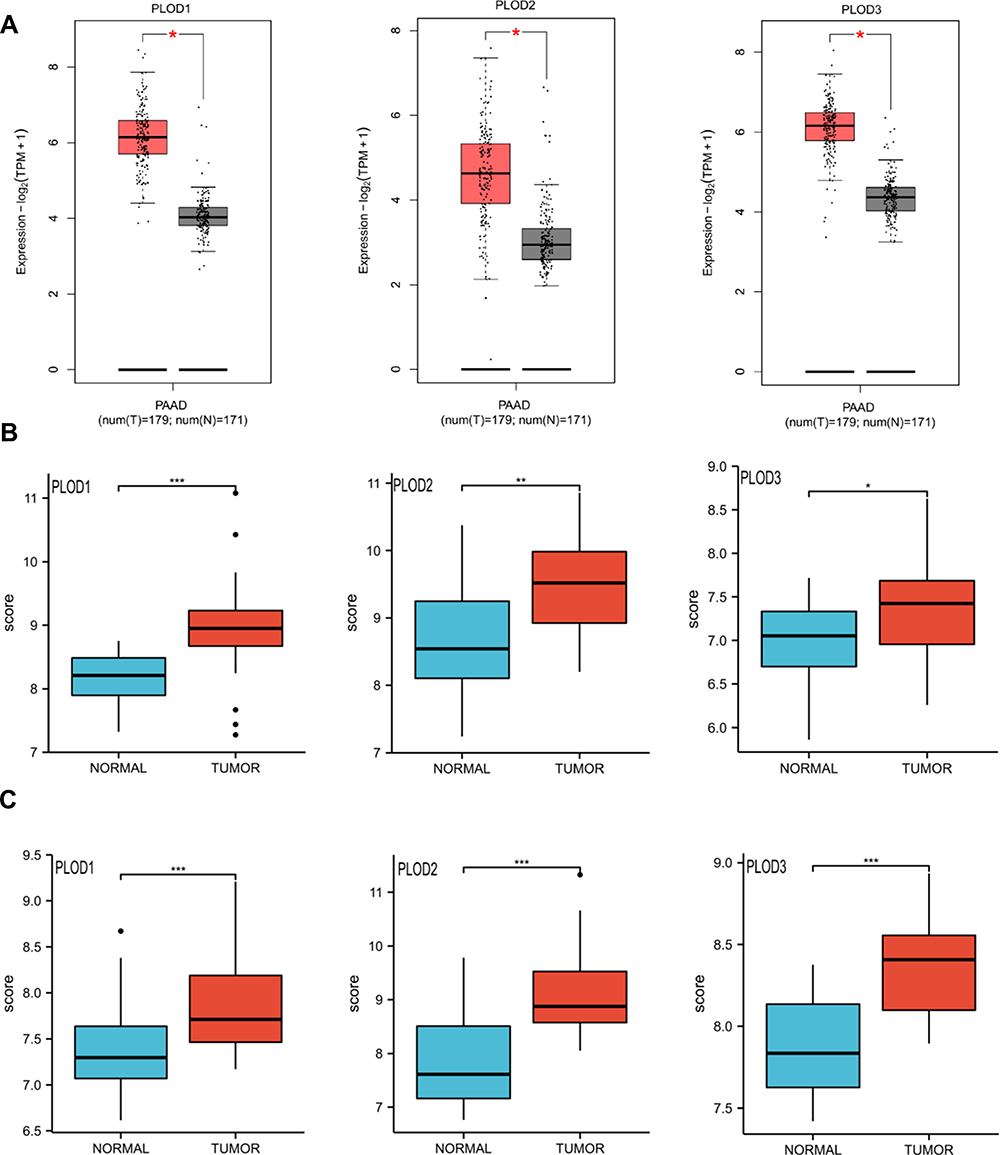 |
Figure 2 (A) Boxplot results of the level of expressions of PLODs family members in PAAD analyzed using GEPIA. Red box, tumor samples; grey box, normal samples. T, tumor; N, normal. (B and C) Boxplot results of PLOD family member levels of expression in PAAD were analyzed using GSE16515 and GSE15471 respectively. *Denotes P < 0.05, **Denotes P < 0.01, ***Denotes P < 0.001. |
The Transcription Level of PLODs in the Pancreatic Cancer Cell Line
The distribution of PLOD gene expression in different pancreatic cancer cell lines was demonstrated in the CCLE database. Figure 3A shows that PLOD1 is highly expressed in pancreatic cancer cell lines Panc02.13, PANC-1, and BXPC-3. Figure 3B indicates that PLOD2 is highly expressed in PANC-1, Panc02.13, and SU86.86 in pancreatic cancer cell lines. Figure 3C shows that PLOD3 is highly expressed in pancreatic cancer cell lines Panc02.13, MIA PACA-2, and PANC-1.
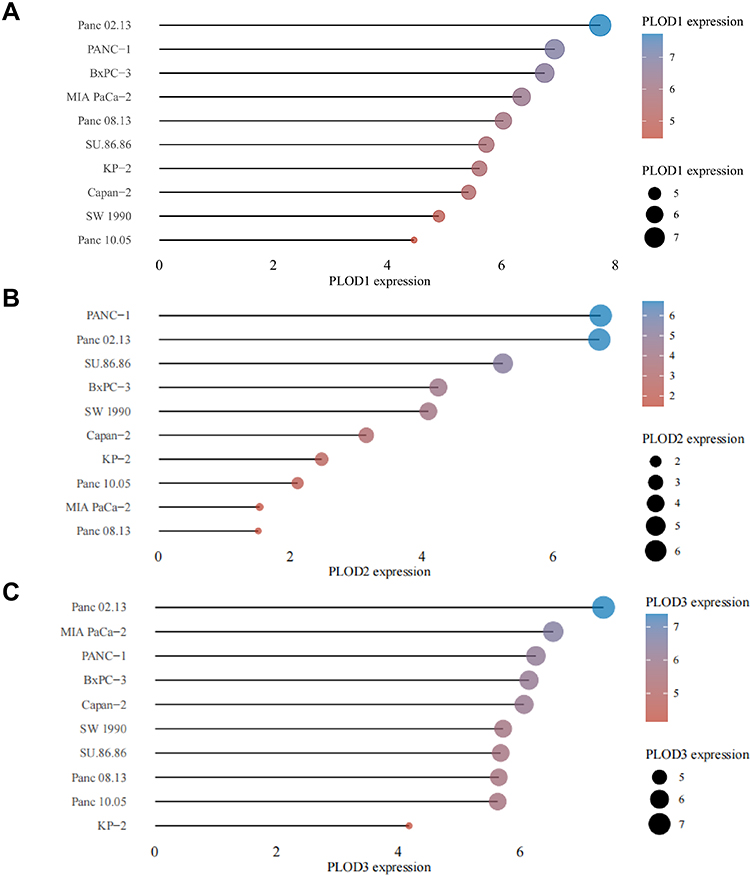 |
Figure 3 CCLE analysis of the expression of members of the PLODs family in pancreatic cancer cell lines. Figure (A–C) show the expression of PLOD1/2/3 in pancreatic cancer cell lines, respectively. The horizontal axis in the figure represents the expression of the gene, the ordinate represents different cell lines, the size of the dot in the figure represents the level of expression, and the different colors also represent the level of expression. |
Levels of Expressions of Proteins in PLODs in the Human Protein Map
The further to investigate the expression of PLOD at the protein level in pancreatic cancer, we used the HPA database to further verify their level of expressions. PLOD1 was moderately expressed in pancreatic cancer, but not in normal pancreatic tissue (Figure 4A). PLOD2 and PLOD3 were highly expressed in pancreatic cancer, but not in normal pancreatic tissue (Figure 4B and C).
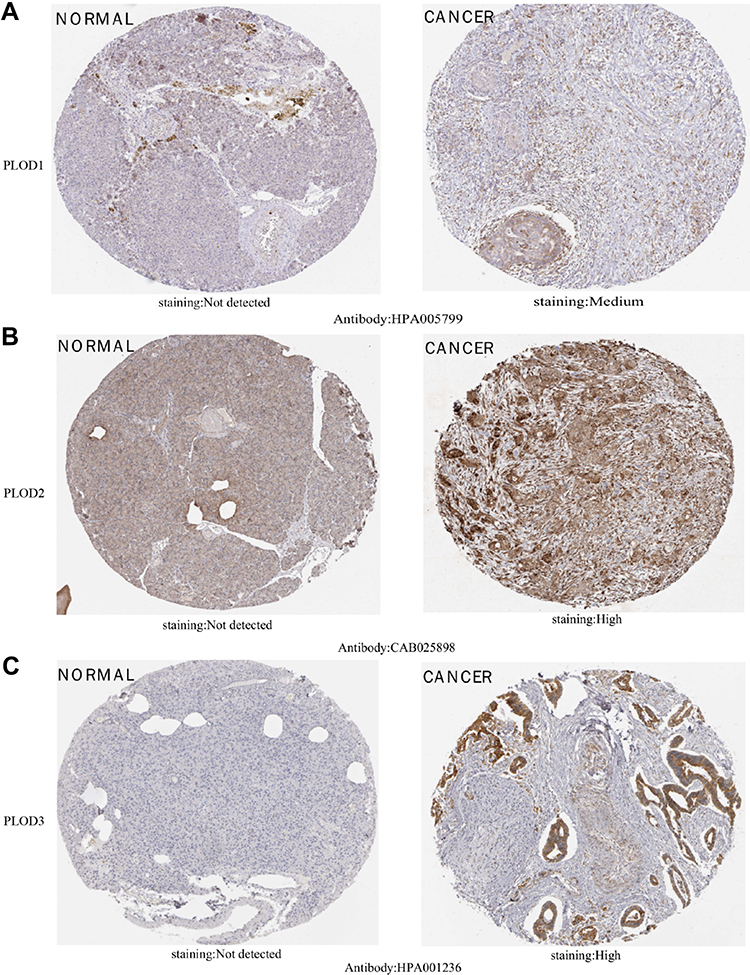 |
Figure 4 IHC images of different members of the PLOD family were detected using the Human Protein Atlas (HPA). (A) shows PLOD1 in pancreatic cancer and not in normal pancreatic tissue. (B and C) show highly expressed PLOD2 and PLOD3 in pancreatic cancer but not expressed in normal pancreatic tissue. |
Prognostic Value of PLODs in Patients with PAAD
We found that PLOD family genes are significantly over-expressed in pancreatic tissue, and we further explored the prognostic value of PLODs in pancreatic cancer patients. The Kaplan–Meier Plotter database was used based on the mRNA expression of individual members of the PLOD family. High transcription levels of PLOD1 (P = 0.033) and PLOD2 (P = 0.0062) were significantly associated with shorter OS in PAAD patients (Figure 5A). High transcription levels of PLOD1 (P = 0.005) and PLOD2 (P = 0.00086) were significantly associated with shorter RFS in PAAD patients (Figure 5B). High levels of expression of PLOD3 mRNA were not significantly associated with OS and RFS in patients with PAAD. Based on TCGA and GTEx datasets, we plotted ROC curves for differentiating normal and pancreatic cancer tissues. In the prediction of normal and tumor outcomes, the PLOD family genes showed high accuracy. The ROC curves showed that the PLOD1 AUC was 0.975, the CI was 0.957–0.993, the PLOD2 AUC was 0.873, the CI was 0.832–0.914, the PLOD3 AUC was 0.964, the CI was 0.943–0.986 (Figure 5C). We then further investigated the correlation of PLODs with clinical and pathological features. The high expression of PLOD1 was significantly associated with clinical tumor T staging (P = 0.038), histological classification (P = 0.049), and pathological classification (P = 0.013). The high expression of PLOD2 was associated with the histological classification (P = 0.038). PLOD3 was not significantly associated with clinicopathological features (Table 1). Taken together, these results suggested that PLOD family genes were commonly up-regulated in PAAD, and patients with high expression of PLOD1 and PLOD2 had a shorter survival period implying a potential role in PAAD development and progression.
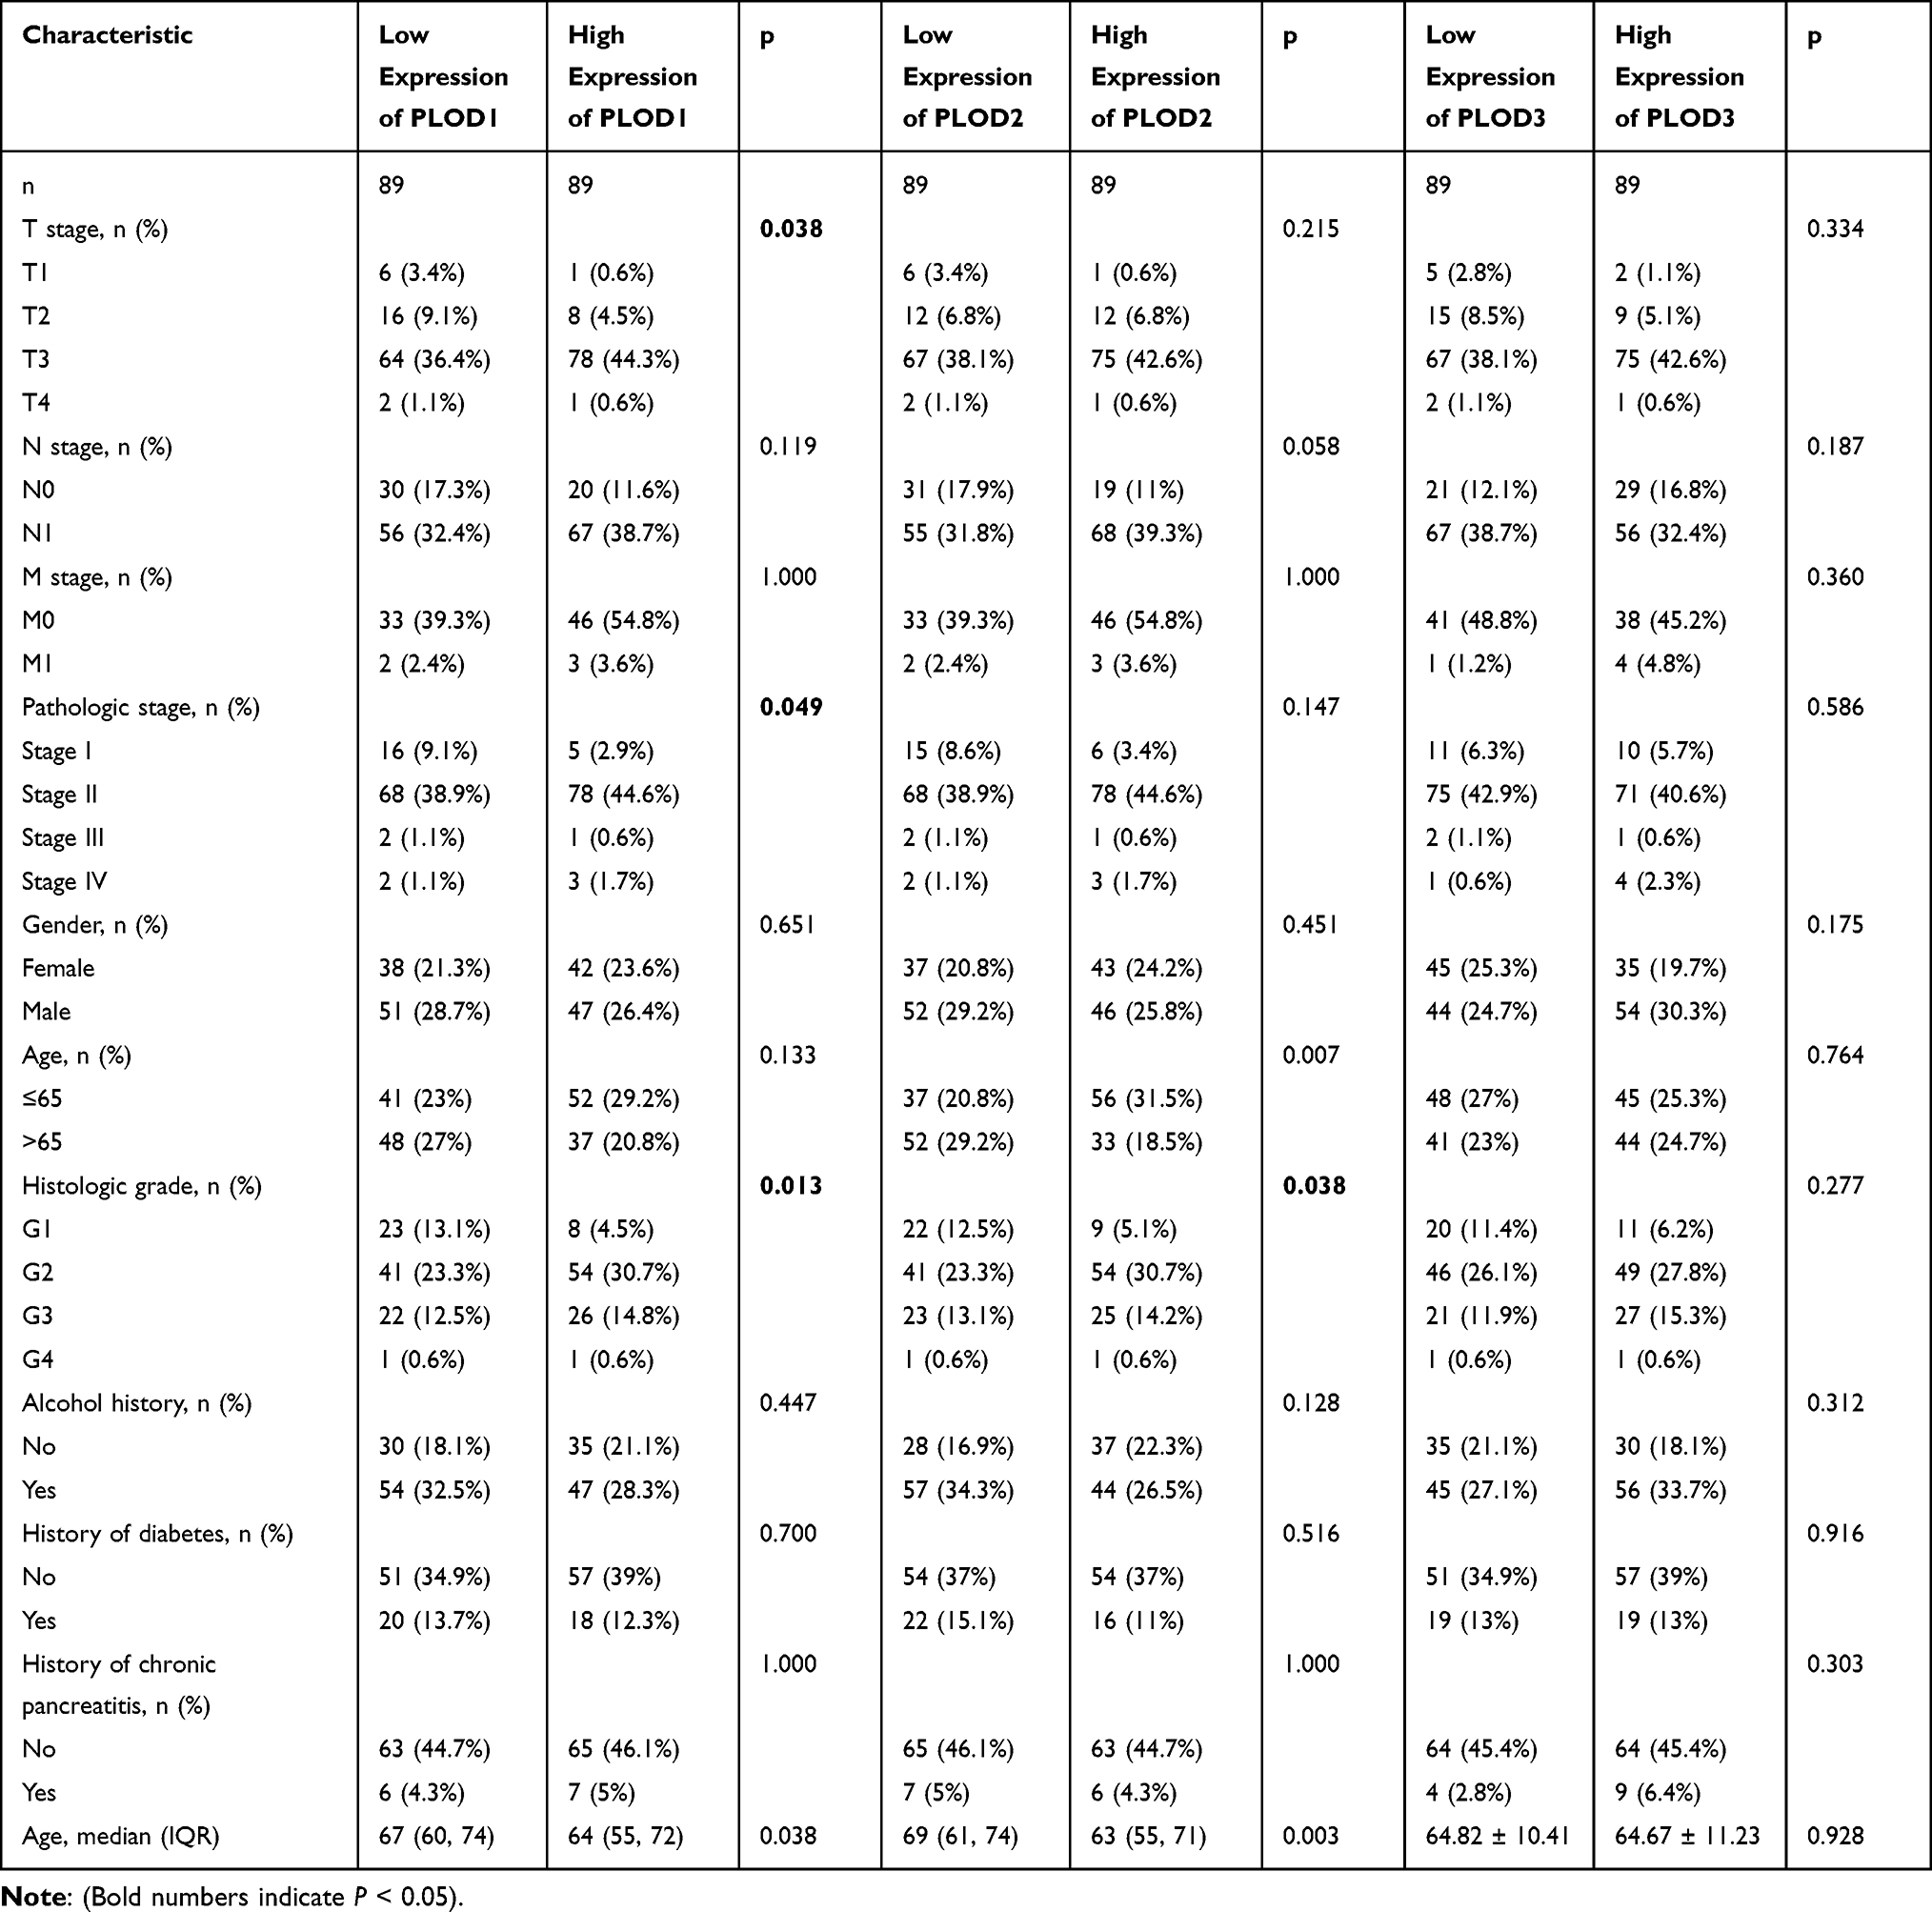 |
Table 1 Baseline Table of the Relationship Between PLOD Family Genes and Clinicopathological Features of Pancreatic Cancer |
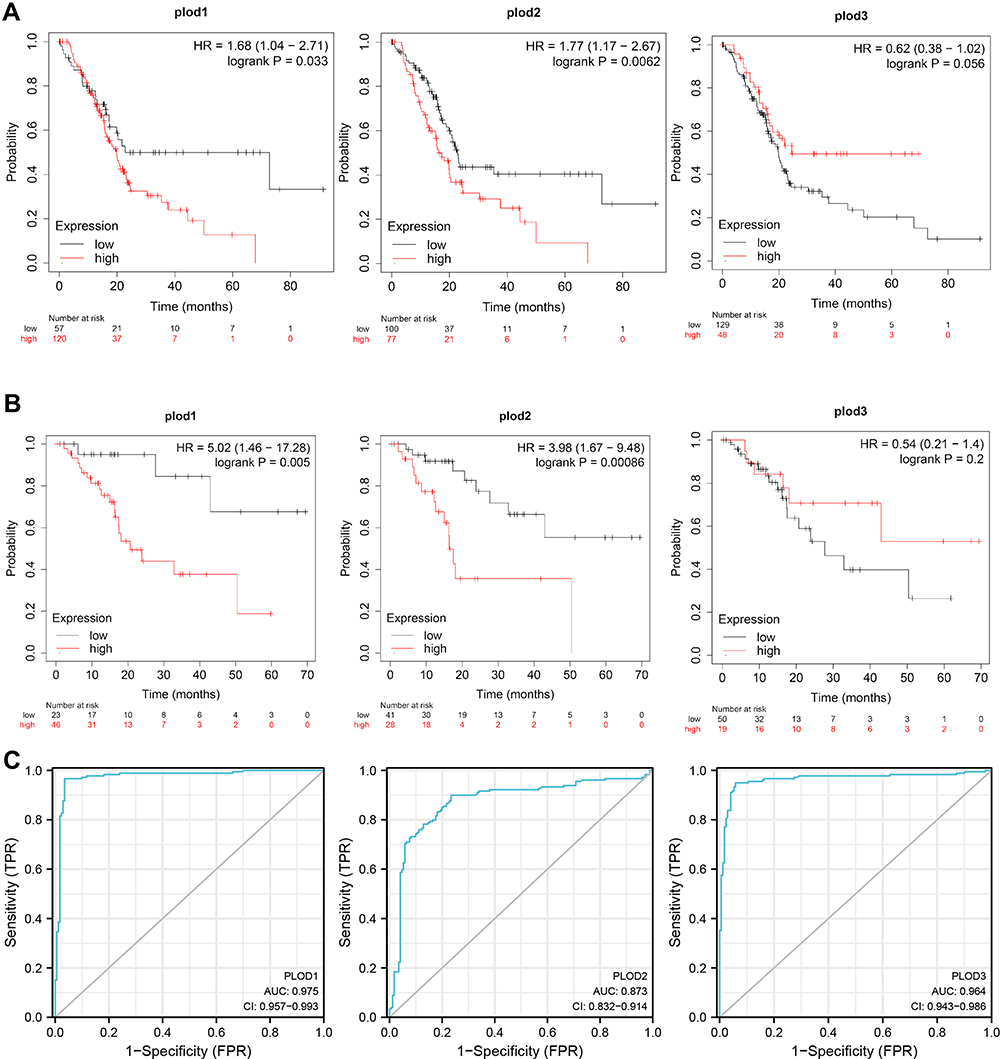 |
Figure 5 Survival analysis of PLOD family members in PAAD. (A) Over-expressions of PLOD1 and PLOD2 were associated with shorter OS in PAAD. (B) Over-expressions of PLOD1 and PLOD2 were associated with shorter RFS in PAAD. (C) PLODs have high accuracy in predicting the outcome (normal or tumor). |
Expression of PLODS in Pancreatic Cancer with KRAS, TP53, CDKN2A, and SMAD4 Mutations
As high-frequency mutations of KRAS, TP53, SMAD4, and CDKN2A were closely related to the occurrence and development of pancreatic cancer, we analyzed the level of expressions of PLOD family genes in KRAS, TP53, CDKN2A, and SMAD4 mutant pancreatic cancers. Compared with pancreatic cancer without mutation, the level of expression of PLOD1 in TP53 mutant pancreatic cancer was higher (Figure 6D). The level of expression of PLOD2 and PLOD3 in TP53 mutant pancreatic cancer was not higher (Figure 6E and F). The expression of PLOD2 was increased in KRAS mutant pancreatic carcinoma (Figure 6B), however, the level of expression of PLOD3 in SMAD4 wild-type pancreatic cancer was increased (Figure 6I). The expression levels of PLOD1 and PLOD3 were not associated with KRAS mutation (Figure 6A and C). The level of expression of PLOD1 and PLOD2 in SMAD4 mutant pancreatic cancer was not higher (Figure 6G and H).The high expression of PLOD family genes in pancreatic cancer was not associated with CDKN2A mutation (Figure 6J to L).
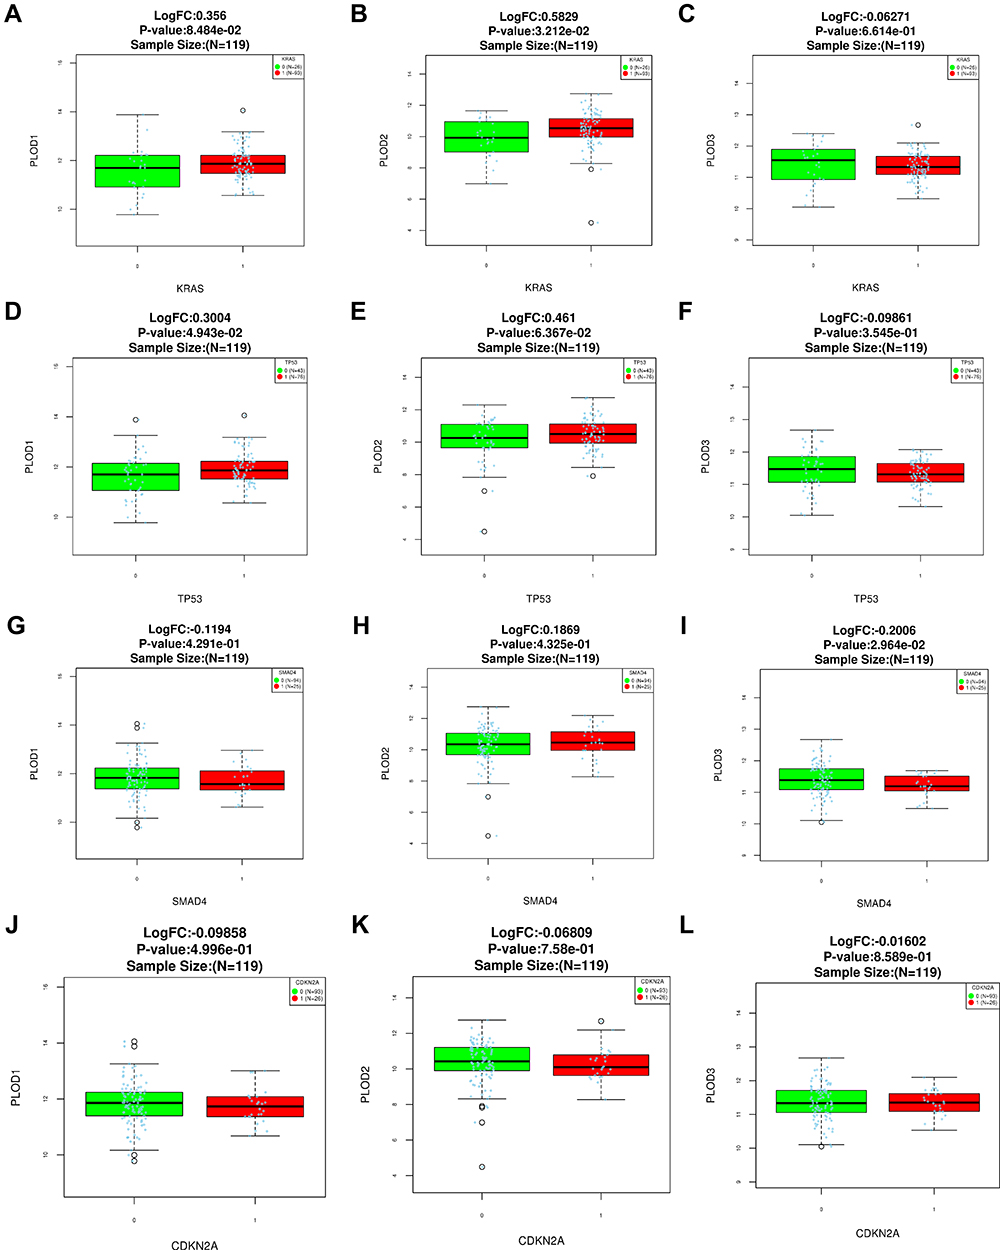 |
Figure 6 Expression levels of PLOD family genes in pancreatic cancer with KRAS mutations (A-C). Expression levels of PLOD family genes in pancreatic cancer with TP53 mutations (D-F).Expression levels of PLOD family genes in pancreatic cancer with SMAD4 mutations (G-I).Expression levels of PLOD family genes in pancreatic cancer with CDKN2A mutations (J-L). |
Genetic Variation Analysis of the PAAD PLODs
The frequency of genetic alterations in the three PLOD genes among PAAD patients was identified using the cBioPortal database. As shown in Figure 7A, 43 (29%) PAAD patients exhibited significant alterations in the three PLOD genes, including amplification, deep deletion, truncating mutation, missense mutation, and transcriptional up-regulation. Specifically, the percentage changes in the genetic alterations of PLOD1, PLOD2, and PLOD3 among PAAD patients were 16, 10, and 10%, respectively (Figure 7B).
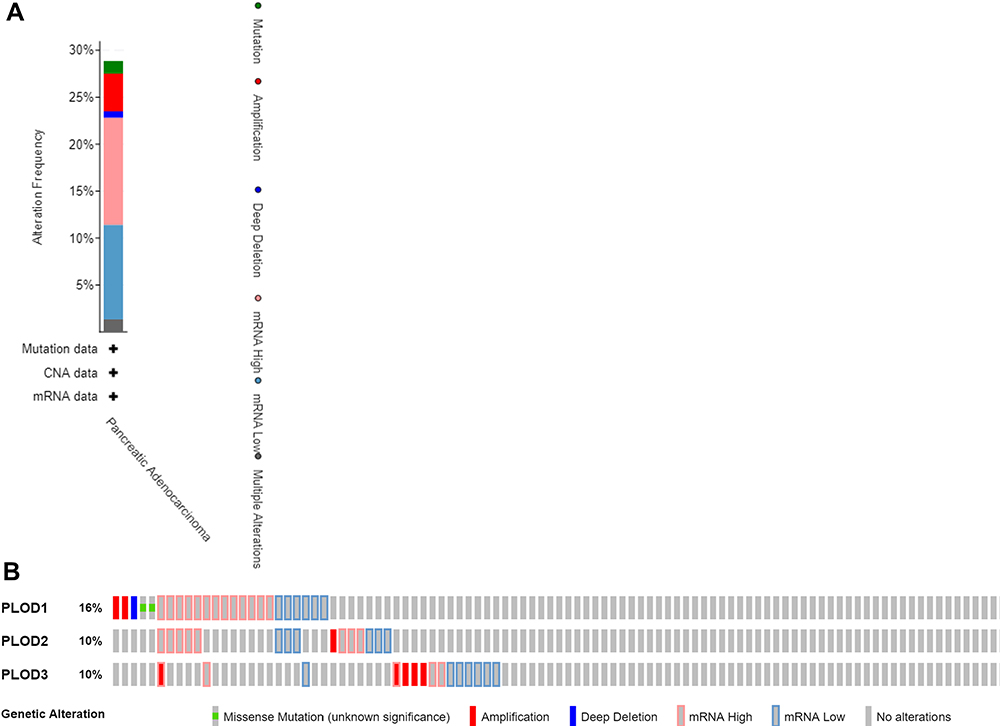 |
Figure 7 (A) Summary of alterations in PLOD family members in PAAD. (B) mRNA expression alterations (RNA Seq V2 RSEM) of the PLOD family genes in PAAD patients. |
PLOD Family Member Expression Was Associated with PAAD Immune Levels of Infiltration
To explore the immune microenvironment, the relationship between the levels of immune infiltration and the expression of PLODs in PAAD was investigated using data in the TIMER database. Results showed that all members of the PLOD family were not correlated with tumor purity. The level of PLOD1/2 expression was significantly positively associated with the level of infiltration of CD8 + T cells, neutrophils, macrophages, and dendritic cells (Figure 8A and B). PLOD3 mRNA expression was negatively associated with the level of infiltration of CD8 + T cells (Figure 8C).
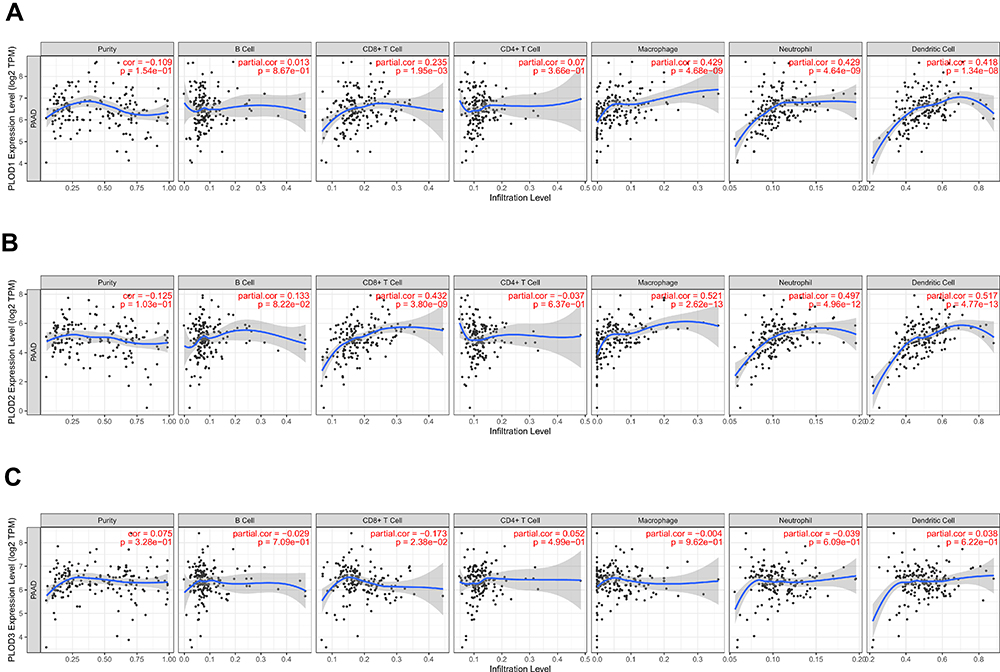 |
Figure 8 (A) The correlation between each type of TIICs (B-cells, CD4+ T-cells, CD8+ T-cells, neutrophils, macrophage, and dendritic cells) and PLOD1. (B) The correlation between each type of TIICs (B-cells, CD4+ T-cells, CD8+ T-cells, neutrophils, macrophages, and dendritic cells) andPLOD2. (C) The correlation between each type of TIICs (B-cells, CD4+ T-cells, CD8+ T-cells, neutrophils, macrophages, and dendritic cells) and PLOD3). |
Taken together, these results further confirmed the key role of PLOD family members in regulating immune activity in the PAAD microenvironment.
Analysis of the Genes Associated with the PLOD Family in PAAD
The further to validate the function of PLODs-related molecules in PAAD, the mRNA sequencing data of 178 PAAD patients in TCGA were analyzed using the functional module of the LinkedOmics database. As shown in the volcanic map, the PAAD samples had 3340, 4829, and 2251 genes with a significant positive correlation with PLOD1, PLOD2, and PLOD3. While 3338, 3803, and 5205 genes showed a significant negative correlation with PLOD1, PLOD2, and PLOD3 in the PAAD sample, respectively (Figure 9A to C). To identify the molecules associated with PLODs in pancreatic cancer, 121 genes were found to be positively correlated with PLOD1, 2, and 3 (Figure 9D and Supplementary Table 1), and 237 were negatively correlated with PLOD1, 2, and 3 (Figure 9E and Supplementary Table 2). Among 121 genes positively correlated with PLODs and 237 negatively correlated genes, PLOD1 and RalA were moderately positively correlated (RHO = 0.469). PLOD2 was moderately positively correlated with RalA (RHO = 0.532). A low correlation was found between PLOD3 and RalA (RHO = 0.34). We found that RalA was a concurrent regulatory molecule of PLODs in pancreatic cancer (Figure 9F to H).
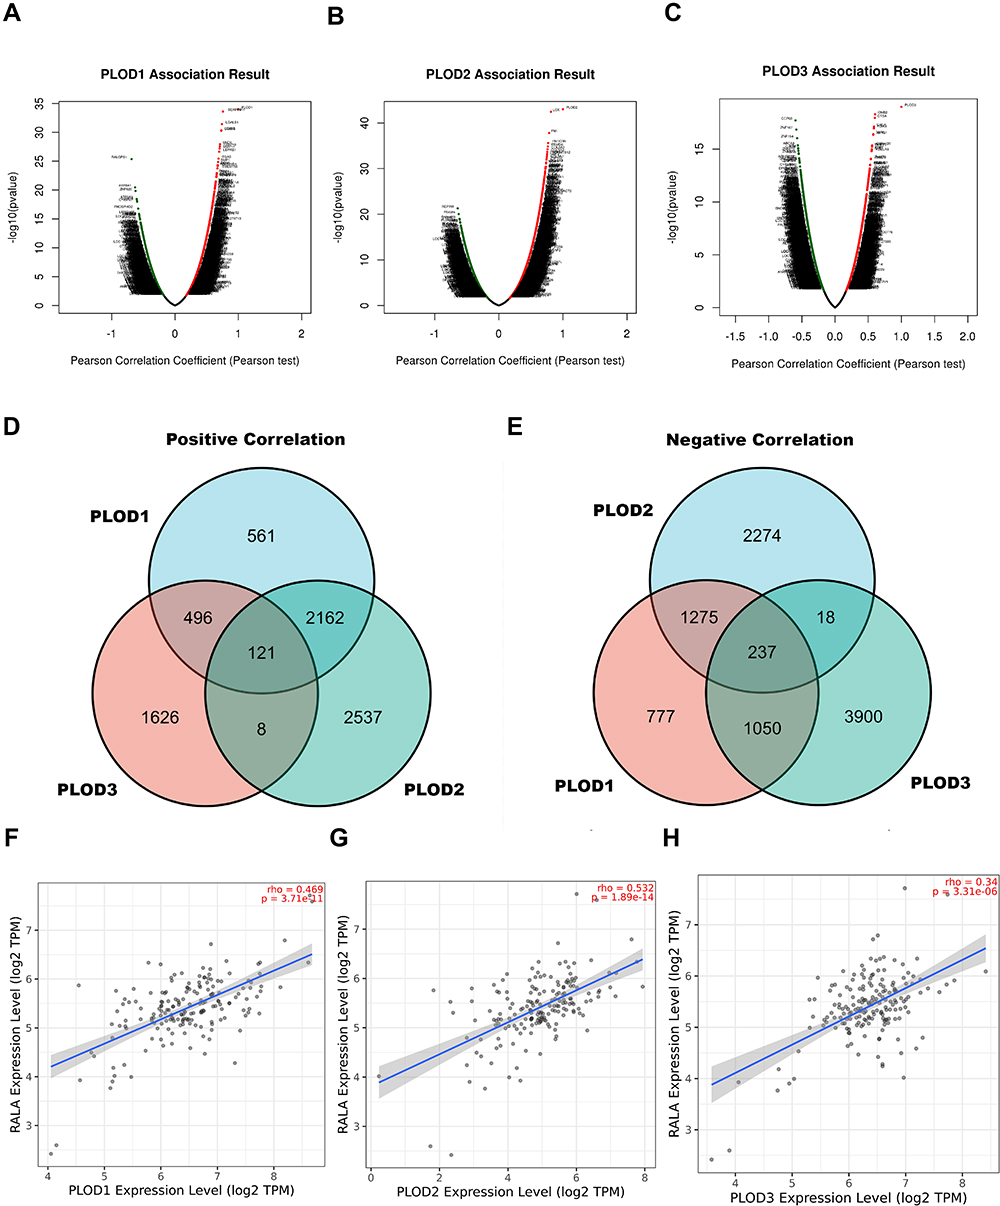 |
Figure 9 Signaling modules correlated with PLOD family genes in PAAD. (A–C) The volcano plot showed the co-expression genes correlated with PLOD1, 2, and 3 in the PAAD cohort from the TCGA database. (D and E) Venn diagram showing the positively and negatively co-expressed genes correlated with PLOD1, 2, and 3. (F–H) Scatter plot of PLOD1 to 3 correlations with RALA. |
GO Enrichment and KEGG Analysis of PLOD1/2/3
The further to explore the biological functions of these PLODs interacting genes in PAAD, we constructed the GO and KEGG pathways using DAVID. Results of positive co-expression gene biological processes (BP) showed that these genes were mainly involved in cell division, response to hypoxia, intercell adhesion, and chromosomal separation. For GO cellular component analysis, the term apparent enrichment was spindle, sticky spots, and egg fissure. Significantly enriched MF terms included L-ascorbic acid-binding, oxidoreductase activity, procollagen-lysine 5-dioxygenase activity, and microtubule-binding protein. KEGG pathway analysis revealed extracellular matrix−receptor interaction, focal adhesion, and enrichment of cancer pathways (Figure 10A and Supplementary Table 3). Results of negative co-expression gene BP showed branched-chain amino acids, cardiac conduction function regulation, blood pressure regulation, and drug metabolism. For GO cellular component analysis, the term apparent enrichment was the mitochondrial matrix, neuron cellular cell membrane, intracellular, myogenic fibres. Significantly enriched MF terms included nucleic acid binding, catalytic activity, monooxygenase activity, and hydrolase activity. KEGG pathway analysis showed the degradation of valine, leucine, isoleucine, metabolic pathway, reabsorption of proximal tubule bicarbonate, and gastric acid secretion (Figure 10B and Supplementary Table 4). In conclusion, the results show that PLODs are primarily involved in tumor-related regulatory mechanisms such as local adhesion, adhesion spots, oxidoreductase activity, tumor pathways, and lysine degradation.
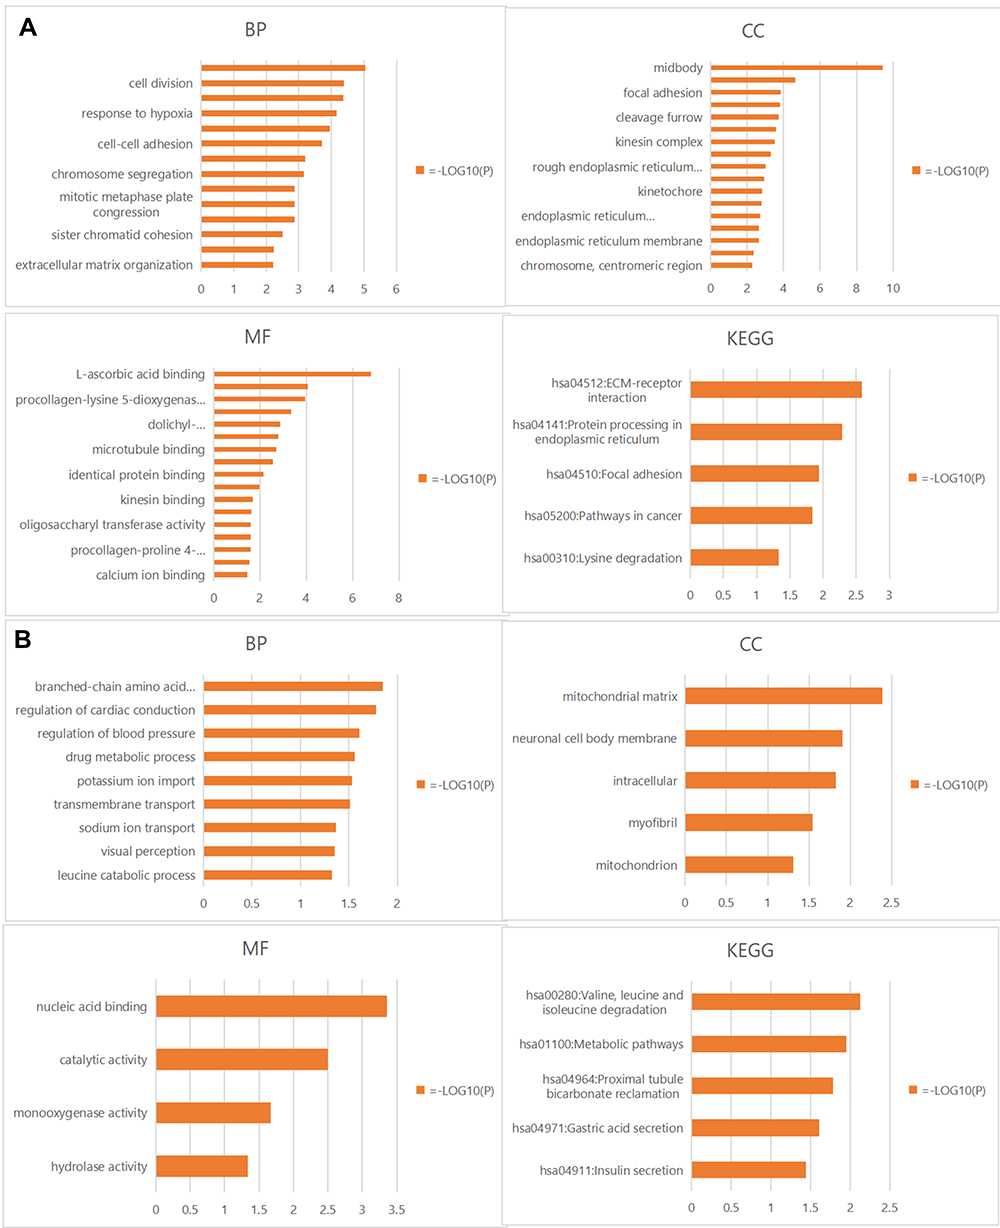 |
Figure 10 (A) Positively correlated gene enrichment. (B) Negatively correlated gene enrichment. Entry GO: BP, CC, and MF terms, KEGG pathway. Abbreviations: GO, Gene Ontology; KEGG, Kyoto Encyclopedia of Genes and Genomics; BP, biological processes; CC, cell composition; MF, molecular function. |
Functional Protein Interaction Network of the PLOD Family Genes
We began with the STRING database looking for interacting protein networks of the PLOD family. The enclosure of the network included 10 functional partners with the highest interactive confidence scores, namely COL5A2, COL5A1, COL1A1, COL1A2, COLGALT1, COL3A1, COL4A1, COL4A2, COL12A1, and COL2A1. The inner shell included 20 other functional partners, all with interactive confidence scores higher than 0.9 (Figure 11). These BP functions were mainly involved in hydroxylysine biosynthesis processes, negative regulation of post-translational protein modification, collagen synthesis processes, and peptide-lysine hydroxylation. MFs include primary collagen-lysine 5-dioxygenase activity, extracellular matrix structural components given to tensile strength, and primary collagen galactosyltransferase activity. KEGG pathway analysis showed protein digestion and absorption, ECM-receptor interaction, adhesion spot enrichment, and lysine degradation. In conclusion, the results indicated that the PLOD family genes were primarily involved in regulating collagen metabolism and extracellular matrix composition.
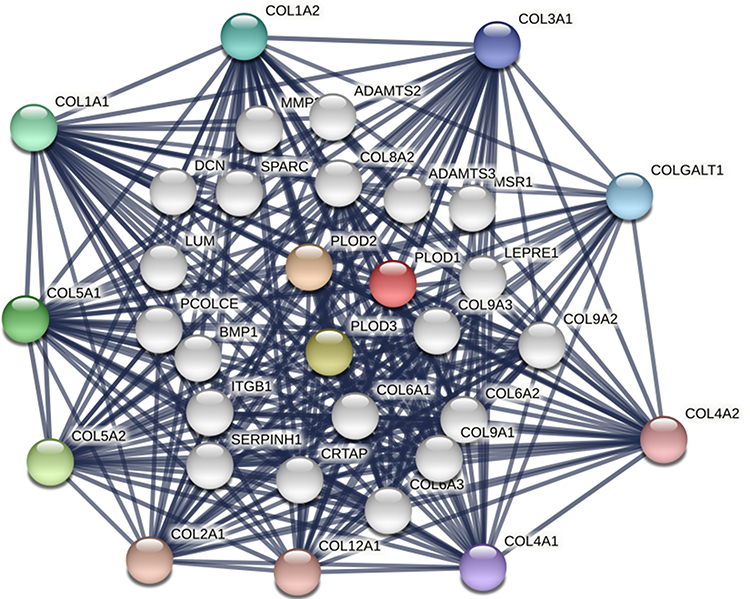 |
Figure 11 Protein interaction network of 30 functional partners with a confidence score above 0.9 based on the STRING database. PLOD1, 2, and 3 are the seed genes. Ten interacting partners with the highest confidence scores were colored and placed in the outer shell. The other twenty interacting partners were placed in the inner shell. The blue lines represent the correlation between proteins and the thickness of the lines indicates the strength of data support. |
Discussion
In our study, all PLOD family genes were found to be highly expressed in pancreatic cancer. In all PAAD patients, high levels of expression of PLOD1 and PLOD2 were associated with shorter OS and RFS. Through the ROC, we found that PLODs had high accuracy in predicting the outcome (normal or tumor). We further proved that the combinatorial use of expressions of more PLOD genes could be a superior prognostic indicator for PAAD patients. Through gene ontology and pathway enrichment analysis, PLOD family genes were mainly involved in the regulation of collagen metabolism and extracellular matrix composition. The RalGEF-Ral signal pathway might be a regulatory module that mediates the effect of PLOD on PAAD.
PLOD family genes were involved in the biological processes of various malignant tumors. PLOD1 had been reported as having an aberrant level of expression that was significantly correlated with various human cancers, including stomach, colorectal, and liver cancers.28–30 Moreover, Jiang et al31 found that PLOD1 regulated the proliferation and invasion of osteosarcoma cells through the Wnt/β-catenin signaling pathway. Hypoxia-inducible factor 1A (HIF-1A) increased the expression of PLOD2, increasing tumor hardness in breast cancer, and promoted tumor cell metastasis to lymph nodes and lungs.12 In pancreatic cancer, increased expression of PLOD2 under hypoxic conditions could promote movement of pancreatic cancer cells and thus tumor progression.32 This study was consistent with our results. In addition, PLOD3 could promote lung cancer metastasis by regulating STAT3.33 PLOD3 was up-regulated in gastric cancer, promoting the proliferation of gastric cancer cells and affecting the prognosis of patients with gastric cancer.34
In conclusion, the PLOD family genes were involved in the tumorigenesis of multiple cancers and affected the patient prognosis. We proposed that individual PLOD genes or PLOD family genes could be potential prognostic biomarkers for PAAD.
With numerous studies in the genomics of pancreatic cancer, high-frequency mutations in Kras, TP53, SMAD4, and CDKN2A had been confirmed in pancreatic cancer and were closely related to the occurrence and development of pancreatic cancer.35 Tumor suppressor genes inactivated in pancreatic cancer include TP53 (mutated in 75–90% of PDAC cases), P16/CDKN2A (mutated in 50–98% of PDAC cases), and SMAD4 (mutated in 20–50% of PDAC cases).36 High-frequency mutated genomic changes seen in pancreatic cancer led to significant genomic instability and might limit the effectiveness of treatment by leading to secondary or acquired chemical resistance, especially impairing the effectiveness of targeted drugs.35 We unexpectedly found that aberrant expressions of PLOD family genes were significantly associated with TP53 mutations, KRAS mutations, and SMAD4 mutations in pancreatic cancer. The PLOD family genes had the potential to be a therapeutic target for these high-frequency mutated genomic pancreatic cancers.
Functional enrichment analysis of PLODs in the biological function of PAAD indicated that these genes were mainly involved in collagen synthesis and lysine hydroxylation. The KEGG pathway was rich in ECM-receptor interactions, enrichment of adhesion sites, and lysine degradation. Collagen was one of the main components of the extracellular matrix, and the hydroxylation of lysine residues is a key step in collagen biosynthesis.7,9 Increased collagen deposition and cross-linking promoted cancer development and progression by enhancing cancer cell migration, invasion, and proliferation.37,38 Another study found that the invasion of pancreatic cancer was found to be closely related to ECM.39 Therefore, we believed that PLOD family genes were involved in the malignant BP of pancreatic cancer.
Hetero-immune characteristics of pancreatic cancer significantly affect the survival of patients with pancreatic cancer.40 On the one hand, the numbers of CD8+T cells, hemolytic CD8+ cells, regulatory T cells, mature dendritic cells, and macrophages were higher in patients with long-term survival of pancreatic cancer.41 On the other hand, a subset of PDAC showed an increase in the number of peri-tumor B lymphocytes and proliferation of CD20+ and CD3+ matrix to produce tertiary lymphoid tissue (TLT).42 TLT conveyed a strong anti-tumor impact resulting in favorable characteristics and survival advantage in PDAC.14,42 Thus we studied the infiltration rates of various immune cells (B cells, CD8+ T cells, CD4+ T cells, macrophages, neutrophils, and dendritic cells) with different levels of PLOD gene expression. Our result found that PLOD1 and PLOD2 were closely related to CD8+ T cells, neutrophils, macrophages, and dendritic cells. Previous studies had found that neutrophil adhesion to fibronectin could stimulate the release of hydroxylysine into the extracellular environment but had no effect on the secretion of other amino acids by neutrophils.43 Hydroxylysine was a product of PLOD; aberrant expression of PLOD affected the morphology and cytoskeleton of attached cells.44 In addition, the secondary and tertiary granules of mature human neutrophils contained proteins that interacted with, and degraded, the extracellular matrix (ECM). The tertiary granules were the main components of PDAC TME formation.5 In TME, neutrophils affected the activation status of other cell types, such as CAFs and T cells.5 For example, tertiary granules could release arginase-1 (ARG-1) that induced a down-regulation of CD3ζ and concomitantly, a suppression of CD3-mediated T cell activation and proliferation.45 Although we found a positive association between PLOD1-2 and CD8+T cells, pancreatic cancer exhibited the main features of a very complex and heterogeneous immune landscape. Most pancreatic cancers form an immunosuppressive microenvironment that limits the invasion of anti-tumor T cells.46 In addition, the combination of CD8+T and CD4+T intra-tumoral infiltration rather than CD4+ or CD8+T alone was a prognostic indicator in independent PDAC tissues.47
In the pathway study, we found that PLODS family genes were significantly associated with RalA. The RalA signaling pathway was overactivated in a variety of human malignancies, and RalA activation was significantly higher in cancer stem cells than in differentiated cancer cells.48 Inhibition of RalA by shRNA in pancreatic cancer reduced non-adherent growth in vitro and subcutaneous growth in vivo.49 In addition, RalA was a key determinant of integrin-dependent membrane raft transport and growth signal regulation, and RalA was preferentially activated in pancreatic cancer, playing a core role therein.50,51 Moreover, KRAS mutations could cause persistent activation of RalA through the RalGEF-Ral signaling pathway, prompting the proliferation, migration, and metastasis of pancreatic cancer cells.52 Since the enzymatic activity of PLOD1, 2, and 3 had significant effects on the composition and structure of ECM, and that RalA was positively co-expressed with PLODs in PAAD, we hypothesized that PLODs and RalA synergistically participated in the RalGEF-Ral signaling cascade to regulate the proliferation and migration of PAAD cells by modifying ECM, however, further research is warranted.
This is the first report on the prognostic value of PLOD family genes in patients with PAAD. Our study provided a complete report on the correlation between PLOD family gene expression and prognosis in pancreatic cancer, which made this study more convincing. Of course, this study has its limitations. Our prognostic study was mainly based on the PAAD patient cohort from the TCGA and GEO databases. Although laboratory experimental studies are consistent with the information in a database, more independent cohorts of PAAD patients are needed to verify our findings. In addition, PLOD3 played a role in many types of human malignant tumor, but in our study, PLOD3 was aberrantly expressed in pancreatic cancer, but was not significantly correlated with the prognosis of patients with pancreatic cancer. This needs to be verified by more clinical data and basic experiments involving pancreatic cancer patients; in addition, we had preliminarily expounded the role of PLOD family genes in the pancreatic cancer microenvironment and immune invasion, but have not yet investigated the effects of matrix structure and metabolism, such as hypoxia and glycolysis, on the pancreatic cancer immune environment.
Conclusion
The combination of PLOD family genes may be an excellent index for prognosis evaluation and diagnosis of pancreatic cancer. We predicted that PLOD family genes might promote proliferation, migration, and metastasis of pancreatic cancer through the RalGEF-Ral signaling pathway.
Abbreviations
CI, confidence interval; DAVID, Database for Annotation, Visualization and Integrated Discovery; ECM, extracellular matrix; FDR, false discovery rate; RFS, relapse free survival; PAAD, pancreatic adenocarcinoma; GO, gene ontology; HR, hazard ratio; KEGG, Kyoto Encyclopedia of Genes and Genomes; RAL, Ras-related protein Ral-A; OS, overall survival; PLOD, procollagen-lysine, 2-oxoglutarate 5-dioxygenase; CDKN2A, cyclin-dependent kinase inhibitor 2A; SMAD4, mothers against decapentaplegic homolog 4; GEO, Gene Expression Omnibus; ROC, receiver operating characteristic curve; KRAS, GTPase KRas; STRING, search tool for the retrieval of interacting genes; CGA, The Cancer Genome Atlas; TP53 EKC/KEOPS, complex subunit TP53RK; TPM, transcripts per million reads; CCLE, Cancer Cell Line Encyclopedia; TIMER, tumor immune estimation resource; STAT3, signal transducer and activator of transcription 3; TME, the tumor microenvironment.
Data Sharing Statement
The datasets presented in this study can be found in online repositories. The names of the repository/repositories and accession number(s) can be found in the article/Supplementary Materials.
Ethics Approval and Consent to Participate
This study protocol was approved by the Ethics Committee of Shanxi Bethune Hospital and Shanxi Academy of Medical Sciences (approval number: YXLL-KY-2021-009).All procedures were in accordance with the ethical standards of the responsible committee on human experimentation (institutional and national) and with the Helsinki Declaration of 1964 and later versions.
Acknowledgments
The authors wish to thank the study participants and their families.
Author Contributions
All authors made a significant contribution to the work reported, whether that is in the conception, study design, execution, acquisition of data, analysis and interpretation, or in all these areas; took part in drafting, revising or critically reviewing the article; gave final approval of the version to be published; have agreed on the journal to which the article has been submitted; and agree to be accountable for all aspects of the work.
Funding
The authors received no specific funding for this work.
Disclosure
The authors report no conflicts of interest in this work.
References
1. Siegel RL, Miller KD, Jemal A. Cancer statistics, 2020. CA Cancer J Clin. 2020;70(1):7–30. doi:10.3322/caac.21590
2. Chen W, Zheng R, Baade PD, et al. Cancer statistics in China, 2015. CA Cancer J Clin. 2016;66(2):115–132. doi:10.3322/caac.21338
3. Korc M. Pancreatic cancer-associated stroma production. Am J Surg. 2007;194(4 Suppl):S84–S86. doi:10.1016/j.amjsurg.2007.05.004
4. Whatcott CJ, Han H, Von Hoff DD. Orchestrating the tumor microenvironment to improve survival for patients with pancreatic cancer: normalization, not destruction. Cancer J. 2015;21(4):299–306. doi:10.1097/PPO.0000000000000140
5. Huber M, Brehm CU, Gress TM, et al. The immune microenvironment in pancreatic cancer. Int J Mol Sci. 2020;21(19):7307. doi:10.3390/ijms21197307
6. Hessmann E, Buchholz SM, Demir IE, et al. Microenvironmental determinants of pancreatic cancer. Physiol Rev. 2020;100(4):1707–1751. doi:10.1152/physrev.00042.2019
7. Egeblad M, Rasch MG, Weaver VM. Dynamic interplay between the collagen scaffold and tumor evolution. Curr Opin Cell Biol. 2010;22(5):697–706. doi:10.1016/j.ceb.2010.08.015
8. Chen Y, Guo H, Terajima M, et al. Lysyl hydroxylase 2 is secreted by tumor cells and can modify collagen in the extracellular space. J Biol Chem. 2016;291(50):25799–25808. doi:10.1074/jbc.M116.759803
9. Qi Y, Xu R. Roles of PLODs in collagen synthesis and cancer progression. Front Cell Dev Biol. 2018;6:66. doi:10.3389/fcell.2018.00066
10. Scietti L, Campioni M, Forneris F. SiMPLOD, a structure-integrated database of collagen lysyl hydroxylase (LH/PLOD) enzyme variants. J Bone Miner Res. 2019;34(7):1376–1382. doi:10.1002/jbmr.3692
11. Song Y, Zheng S, Wang J, et al. Hypoxia-induced PLOD2 promotes proliferation, migration and invasion via PI3K/Akt signaling in glioma. Oncotarget. 2017;8(26):41947–41962. doi:10.18632/oncotarget.16710
12. Gilkes DM, Bajpai S, Wong CC, et al. Procollagen lysyl hydroxylase 2 is essential for hypoxia-induced breast cancer metastasis. Mol Cancer Res. 2013;11(5):456–466. doi:10.1158/1541-7786.MCR-12-0629
13. Di WY, Kang XH, Zhang JH, Wang Y, Kou WZ, Su W. [Expression of PLOD2 in esophageal squamous cell carcinoma and its correlation with invasion and metastasis]. Zhonghua Bing Li Xue Za Zhi. 2019;48(2):102–107. Chinese. doi:10.3760/cma.j.issn.0529-5807.2019.02.005
14. Wartenberg M, Cibin S, Zlobec I, et al. Integrated genomic and immunophenotypic classification of pancreatic cancer reveals three distinct subtypes with prognostic/predictive significance. Clin Cancer Res. 2018;24(18):4444–4454. doi:10.1158/1078-0432.CCR-17-3401
15. Xu F, Guan Y, Xue L, et al. The effect of a novel glycolysis-related gene signature on progression, prognosis and immune microenvironment of renal cell carcinoma. BMC Cancer. 2020;20(1):1207. doi:10.1186/s12885-020-07702-7
16. Tang Z, Li C, Kang B, Gao G, Li C, Zhang Z. GEPIA: a web server for cancer and normal gene expression profiling and interactive analyses. Nucleic Acids Res. 2017;45(W1):W98–W102. doi:10.1093/nar/gkx247
17. Barrett T, Wilhite SE, Ledoux P, et al. NCBI GEO: archive for functional genomics data sets–update. Nucleic Acids Res. 2013;41:D991–D995. doi:10.1093/nar/gks1193
18. Pei H, Li L, Fridley BL, et al. FKBP51 affects cancer cell response to chemotherapy by negatively regulating Akt. Cancer Cell. 2009;16(3):259–266. doi:10.1016/j.ccr.2009.07.016
19. Badea L, Herlea V, Dima SO, Dumitrascu T, Popescu I. Combined gene expression analysis of whole-tissue and microdissected pancreatic ductal adenocarcinoma identifies genes specifically overexpressed in tumor epithelia. Hepatogastroenterology. 2008;55(88):2016–2027.
20. Uhlén M, Fagerberg L, Hallström BM, et al. Proteomics. Tissue-based map of the human proteome. Science. 2015;347(6220):1260419. doi:10.1126/science.1260419
21. Lánczky A, Nagy N, Bottai G, et al. miRpower: a web-tool to validate survival-associated miRNAs utilizing expression data from 2178 breast cancer patients. Breast Cancer Res Treat. 2016;160(3):439–446. doi:10.1007/s10549-016-4013-7
22. Barretina J, Caponigro G, Stransky N, et al. The Cancer Cell Line Encyclopedia enables predictive modelling of anticancer drug sensitivity [published correction appears in Nature. 2012 Dec 13;492(7428):290][published correction appears in Nature. 2019 Jan;565(7738):E5–E6]. Nature. 2012;483(7391):603–607. doi:10.1038/nature11003
23. Vasaikar SV, Straub P, Wang J, Zhang B. LinkedOmics: analyzing multi-omics data within and across 32 cancer types. Nucleic Acids Res. 2018;46(D1):D956–D963. doi:10.1093/nar/gkx1090
24. Gao J, Aksoy BA, Dogrusoz U, et al. Integrative analysis of complex cancer genomics and clinical profiles using the cBioPortal. Sci Signal. 2013;6(269):pl1. doi:10.1126/scisignal.2004088
25. Huang DW, Sherman BT, Lempicki RA. Systematic and integrative analysis of large gene lists using DAVID bioinformatics resources. Nat Protoc. 2009;4(1):44–57. doi:10.1038/nprot.2008.211
26. Li T, Fan J, Wang B, et al. TIMER: a web server for comprehensive analysis of tumor-infiltrating immune cells. Cancer Res. 2017;77(21):e108–e110. doi:10.1158/0008-5472.CAN-17-0307
27. Szklarczyk D, Gable AL, Lyon D, et al. STRING v11: protein-protein association networks with increased coverage, supporting functional discovery in genome-wide experimental datasets. Nucleic Acids Res. 2019;47(D1):D607–D613. doi:10.1093/nar/gky1131
28. Wang D, Zhang S, Chen F. High expression of PLOD1 drives tumorigenesis and affects clinical outcome in gastrointestinal carcinoma. Genet Test Mol Biomarkers. 2018;22(6):366–373. doi:10.1089/gtmb.2018.0009
29. Boonsongserm P, Angsuwatcharakon P, Puttipanyalears C, et al. Tumor-induced DNA methylation in the white blood cells of patients with colorectal cancer. Oncol Lett. 2019;18(3):3039–3048. doi:10.3892/ol.2019.10638
30. Jiang SS, Ke SJ, Ke ZL, Li J, Li X, Xie XW. Cell division cycle associated genes as diagnostic and prognostic biomarkers in hepatocellular carcinoma. Front Mol Biosci. 2021;8:657161. doi:10.3389/fmolb.2021.657161
31. Jiang H, Guo W, Yuan S, Song L. PLOD1 is a prognostic biomarker and mediator of proliferation and invasion in osteosarcoma. Biomed Res Int. 2020;2020:3418398. doi:10.1155/2020/3418398
32. Sada M, Ohuchida K, Horioka K, et al. Hypoxic stellate cells of pancreatic cancer stroma regulate extracellular matrix fiber organization and cancer cell motility. Cancer Lett. 2016;372(2):210–218. doi:10.1016/j.canlet.2016.01.016
33. Baek JH, Yun HS, Kwon GT, et al. PLOD3 promotes lung metastasis via regulation of STAT3. Cell Death Dis. 2018;9(12):1138. doi:10.1038/s41419-018-1186-5
34. Wang B, Xu L, Ge Y, et al. PLOD3 is upregulated in gastric cancer and correlated with clinicopathologic characteristics. Clin Lab. 2019;65(1). doi:10.7754/Clin.Lab.2018.180541
35. Aslan M, Shahbazi R, Ulubayram K, Ozpolat B. Targeted therapies for pancreatic cancer and hurdles ahead. Anticancer Res. 2018;38(12):6591–6606. doi:10.21873/anticanres.13026
36. Ying H, Dey P, Yao W, et al. Genetics and biology of pancreatic ductal adenocarcinoma. Genes Dev. 2016;30(4):355–385. doi:10.1101/gad.275776.115
37. Provenzano PP, Eliceiri KW, Campbell JM, Inman DR, White JG, Keely PJ. Collagen reorganization at the tumor-stromal interface facilitates local invasion. BMC Med. 2006;4(1):38. doi:10.1186/1741-7015-4-38
38. Provenzano PP, Inman DR, Eliceiri KW, et al. Collagen density promotes mammary tumor initiation and progression. BMC Med. 2008;6:11. doi:10.1186/1741-7015-6-11
39. Piersma B, Hayward MK, Weaver VM. Fibrosis and cancer: a strained relationship. Biochim Biophys Acta Rev Cancer. 2020;1873(2):188356. doi:10.1016/j.bbcan.2020.188356
40. Ansari D, Friess H, Bauden M, Samnegård J, Andersson R. Pancreatic cancer: disease dynamics, tumor biology and the role of the microenvironment. Oncotarget. 2018;9(5):6644–6651. doi:10.18632/oncotarget.24019
41. Balachandran VP, Łuksza M, Zhao JN, et al. Identification of unique neoantigen qualities in long-term survivors of pancreatic cancer. Nature. 2017;551(7681):512–516. doi:10.1038/nature24462
42. Castino GF, Cortese N, Capretti G, et al. Spatial distribution of B cells predicts prognosis in human pancreatic adenocarcinoma. Oncoimmunology. 2015;5(4):e1085147. doi:10.1080/2162402X.2015.1085147
43. Galkina SI, Fedorova NV, Ksenofontov AL, Stadnichuk VI, Baratova LA, Sud’Ina GF. Neutrophils as a source of branched-chain, aromatic and positively charged free amino acids. Cell Adh Migr. 2019;13(1):98–105. doi:10.1080/19336918.2018.1540903
44. Risteli M, Ruotsalainen H, Salo AM, et al. Reduction of lysyl hydroxylase 3 causes deleterious changes in the deposition and organization of extracellular matrix. J Biol Chem. 2009;284(41):28204–28211. doi:10.1074/jbc.M109.038190
45. Ardi VC, Kupriyanova TA, Deryugina EI, Quigley JP. Human neutrophils uniquely release TIMP-free MMP-9 to provide a potent catalytic stimulator of angiogenesis. Proc Natl Acad Sci U S A. 2007;104(51):20262–20267. doi:10.1073/pnas.0706438104
46. Knudsen ES, Vail P, Balaji U, et al. Stratification of pancreatic ductal adenocarcinoma: combinatorial genetic, stromal, and immunologic markers. ClinCancerRes. 2017;23(15):4429–4440. doi:10.1158/1078-0432.CCR-17-0162
47. Fukunaga A, Miyamoto M, Cho Y, et al. CD8+ tumor-infiltrating lymphocytes together with CD4+ tumor-infiltrating lymphocytes and dendritic cells improve the prognosis of patients with pancreatic adenocarcinoma. Pancreas. 2004;28(1):e26–e31. doi:10.1097/00006676-200401000-00023
48. Moghadam AR, Patrad E, Tafsiri E, et al. Ral signaling pathway in health and cancer. Cancer Med. 2017;6(12):2998–3013. doi:10.1002/cam4.1105
49. Yan C, Theodorescu D. RAL GTPases: biology and potential as therapeutic targets in cancer. Pharmacol Rev. 2018;70(1):1–11. doi:10.1124/pr.117.014415
50. Balasubramanian N, Meier JA, Scott DW, Norambuena A, White MA, Schwartz MA. RalA-exocyst complex regulates integrin-dependent membrane raft exocytosis and growth signaling. Curr Biol. 2010;20(1):75–79. doi:10.1016/j.cub.2009.11.016
51. Lim KH, Baines AT, Fiordalisi JJ, et al. Activation of RalA is critical for Ras-induced tumorigenesis of human cells. Cancer Cell. 2005;7(6):533–545. doi:10.1016/j.ccr.2005.04.030
52. Lim KH, O’Hayer K, Adam SJ, et al. Divergent roles for RalA and RalB in malignant growth of human pancreatic carcinoma cells. Curr Biol. 2006;16(24):2385–2394. doi:10.1016/j.cub.2006.10.023
 © 2022 The Author(s). This work is published and licensed by Dove Medical Press Limited. The full terms of this license are available at https://www.dovepress.com/terms.php and incorporate the Creative Commons Attribution - Non Commercial (unported, v3.0) License.
By accessing the work you hereby accept the Terms. Non-commercial uses of the work are permitted without any further permission from Dove Medical Press Limited, provided the work is properly attributed. For permission for commercial use of this work, please see paragraphs 4.2 and 5 of our Terms.
© 2022 The Author(s). This work is published and licensed by Dove Medical Press Limited. The full terms of this license are available at https://www.dovepress.com/terms.php and incorporate the Creative Commons Attribution - Non Commercial (unported, v3.0) License.
By accessing the work you hereby accept the Terms. Non-commercial uses of the work are permitted without any further permission from Dove Medical Press Limited, provided the work is properly attributed. For permission for commercial use of this work, please see paragraphs 4.2 and 5 of our Terms.