")
Back to Journals » OncoTargets and Therapy » Volume 12
Overexpressing CCT6A Contributes To Cancer Cell Growth By Affecting The G1-To-S Phase Transition And Predicts A Negative Prognosis In Hepatocellular Carcinoma
Authors Zeng G , Wang J, Huang Y, Lian Y , Chen D, Wei H , Lin C, Huang Y
Received 30 August 2019
Accepted for publication 5 November 2019
Published 29 November 2019 Volume 2019:12 Pages 10427—10439
DOI https://doi.org/10.2147/OTT.S229231
Checked for plagiarism Yes
Review by Single anonymous peer review
Peer reviewer comments 2
Editor who approved publication: Prof. Dr. Takuya Aoki
Guofen Zeng,1,* Jialiang Wang,2,* Yanlin Huang,1,* Yifan Lian,2 Dongmei Chen,2 Huan Wei,2 Chaoshuang Lin,1 Yuehua Huang1,2
1Department of Infectious Diseases, The Third Affiliated Hospital of Sun Yat-sen University, Guangzhou 510630, Guangdong, People’s Republic of China; 2Guangdong Provincial Key Laboratory of Liver Disease Research, The Third Affiliated Hospital of Sun Yat-sen University, Guangzhou 510630, Guangdong, People’s Republic of China
*These authors contributed equally to this work
Correspondence: Yuehua Huang
Department of Infectious Diseases & Guangdong Provincial Key Laboratory of Liver Disease Research, The Third Affiliated Hospital of Sun Yat-sen University, Guangzhou 510630, Guangdong, People’s Republic of China
Tel +8620-85252702
Fax +8620-85253305
Email [email protected]
Chaoshuang Lin
Department of Infectious Diseases, The Third Affiliated Hospital of Sun Yat-sen University, Guangzhou, Guangdong 510630, People’s Republic of China
Email [email protected]
Purpose: To determine the oncogenic role of the sixth subunit of chaperonin-containing tailless complex polypeptide 1 (CCT6A) in hepatocellular carcinoma (HCC) and address the correlation of CCT6A with clinicopathological characteristics and survival. Additionally, this study aimed to explore the effect of CCT6A on HCC cells and the underlying mechanisms.
Methods: We searched for levels of CCT6A expression in the Oncomine database and GEPIA database, which was then validated by analyzing cancer and adjacent non-cancerous tissues of HCC patients using quantitative PCR, Western blot, and immunohistochemistry assays. The relationship between CCT6A expression and survival was analyzed from the GEPIA database and confirmed by immunohistochemistry assays of 133 HCC tissue sections. In addition, the effect of depleting CCT6A on cell proliferation was assessed by CCK-8 and colony formation assays. Cell cycle analysis, immunofluorescence assays, GSEA analysis, and cyclin D expression analyzed by Western blot were used to explore the possible underlying mechanism how dysregulated CCT6A affect the proliferation of HCC.
Results: Both mRNA and protein levels of CCT6A were increased in HCC tissues. Higher CCT6A expression was significantly associated with reduced overall survival (P = 0.023). CCT6A depletion inhibited cell proliferation and downregulated cyclin D, hindering the G1-to-S phase arrest.
Conclusion: CCT6A may contribute to HCC cell proliferation by accelerating the G1-to-S transition, as it maintains the expression of cyclin D. CCT6A could be considered an oncogene of HCC and could be used as a prognostic biomarker for HCC.
Keywords: HCC, survival, CCT6A, cell proliferation, cyclin D
Introduction
Liver cancer, especially hepatocellular carcinoma (HCC), is one of the most prevalent and fatal cancers worldwide. In 2018, there were 841,000 new cases of liver cancer and 782,000 deaths, of which 75–85% were HCC.1 Hepatitis B or Hepatitis C virus infection, aflatoxins, alcohol ingestion, and metabolic abnormalities are high risk factors for HCC. However, the exact pathogenesis mechanisms of HCC remain unclear. Identifying new HCC oncogenes and elucidating their mechanisms would provide valuable insights for the diagnosis and treatment of liver cancer.
In eukaryotes, chaperonin-containing tailless complex polypeptide 1 (CCT) is a group II chaperonin complex, composed of eight different subunits (named of CCT1 to CCT8) that can fold actins and tubulins, indicating that it would be involved in cancer cell proliferation, migration and invasion.2,3 Additionally, a series of oncoproteins and tumor-suppressors, such as transducer and activator of transcription 3 (STAT3),4 LOX-1,5 von Hippel-Lindau (VHL),6 and p53,7 have been reported to be regulated by CCT. Hence, CCT contributes to human oncogenesis. Moreover, besides acting as a whole oligomer, CCT monomers are thought to possess protein-folding abilities and other distinct functions.8,9 CCT subunits have been reported to be dysregulated and influence the phenotypes in several tumors. For instance, CCT1 and CCT2 were essential in the survival of breast cancer patients;10 CCT2 and CCT5 were found to be overexpressed in colorectal cancer tissues;11 CCT3 was indispensable for proper mitotic progression, while CCT3 inhibition increased susceptibility in HCC patients undergoing chemotherapy;12 CCT8 was found to play a role in the development of B-cell non-Hodgkin’s lymphoma and overexpression of CCT8 could reverse cell adhesion-mediated drug resistance (CAM-DR).13 Recently, special attention has been given to CCT6A for its different roles in cancer. Ying et al14 demonstrated that CCT6A promoted cell survival and metastasis of non–small-cell lung carcinoma (NSCLC), while inhibition of CCT6A could reduce TGF-β–mediated metastasis. Zhu et al15 reported that CCT6A expression increased in patients with colorectal carcinoma (CRC) and depletion of CCT6A inhibited the growth in one type of CRC cells, but the potential mechanisms are still unknown. Likewise, the roles of CCT6A in HCC are yet to be elucidated as researches addressing such topic are scarce.
In this study, we show that CCT6A expression increased in patients with HCC and that high levels of CCT6A were negatively correlated with a positive prognosis in HCC patients. Furthermore, we demonstrated that CCT6A depletion downregulated the expression of cyclin D, thus decreasing HCC cell proliferation by preventing the G1-to-S phase transition. Our findings imply that overexpression of CCT6A is oncogenic and could be a surrogate marker and a therapeutic target for HCC.
Materials And Methods
Databases
The ONCOMINE database is a public cancer database integrated with cancer microarray information from Gene Expression Omnibus (GEO) and Array Express.16 We explored the transcription expression of CCT6A in HCC throughout the ONCOMINE database (www.oncomine.org). The search setup was as follows: gene = CCT6A; analysis type = cancer vs normal analysis; cancer type = liver cancer; p-value threshold = 0.05; fold change = 2; gene rank = top 10%.
The UALCAN database (http://ualcan.path.uab.edu) is another cancer database, but different from the Oncomine database, it is based on The Cancer Genome Atlas (TCGA).17 We analyzed the mRNA level of CCT6A in HCC in general, different grades and distinct stages respectively.
The GEPIA database (http://gepia.cancer-pku.cn) is an online tumor database that is based on the RNA sequencing expression of 9,736 tumor samples and 8,587 normal samples from the TCGA and GTEx projects.18 We explored overall survival and disease-free survival analysis with the following search setup: gene = CCT6A, group cutoff = median, and datasets = LIHC.
Patients And Tissue Specimens
To assess CCT6A expression, we collected 34 pairs of HCC and adjacent noncancerous tissues for real time PCR quantification, 7 paired tissues for Western blot (WB) and 15 paired tissues for immunohistochemistry assay. All specimens were obtained from HCC patients during their hepatectomy, which was carried out in the Third Affiliated Hospital of Sun Yat-sen University (Guangzhou, China). Paraffin-embedded HCC specimens from 133 patients with more than 8 years of follow-up data were collected from the Sun Yat-sen University Cancer Center (Guangzhou, China). The clinical information of these HCC patients is listed in Table 2. The patient consent was written informed consent, and that this was conducted in accordance with the Declaration of Helsinki. The study was approved by the institutional review board at the Sun Yat-sen University Cancer Center and the Third Affiliated Hospital of Sun Yat-sen University.
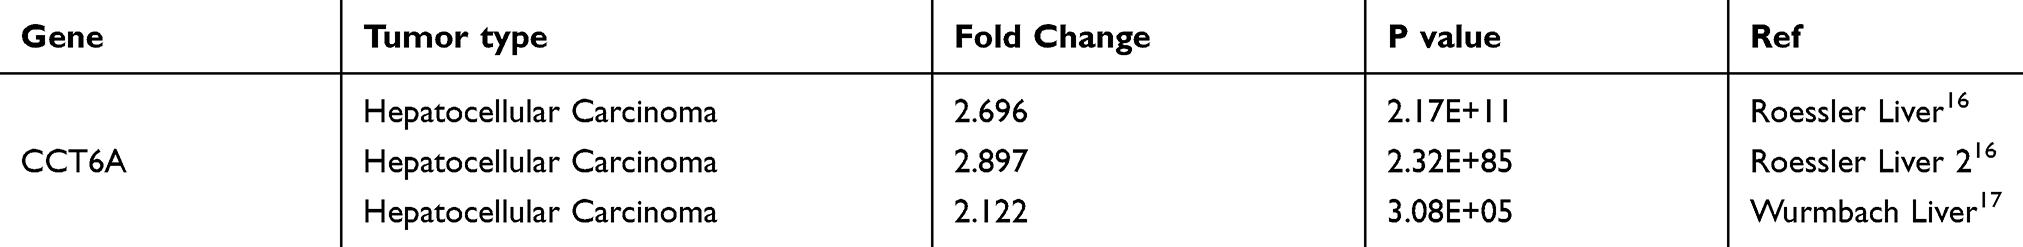 |
Table 1 Detailed Changes Of CCT6A mRNA Levels Between HCC And Normal Tissues In Distinct Datasets Of Oncomine Database |
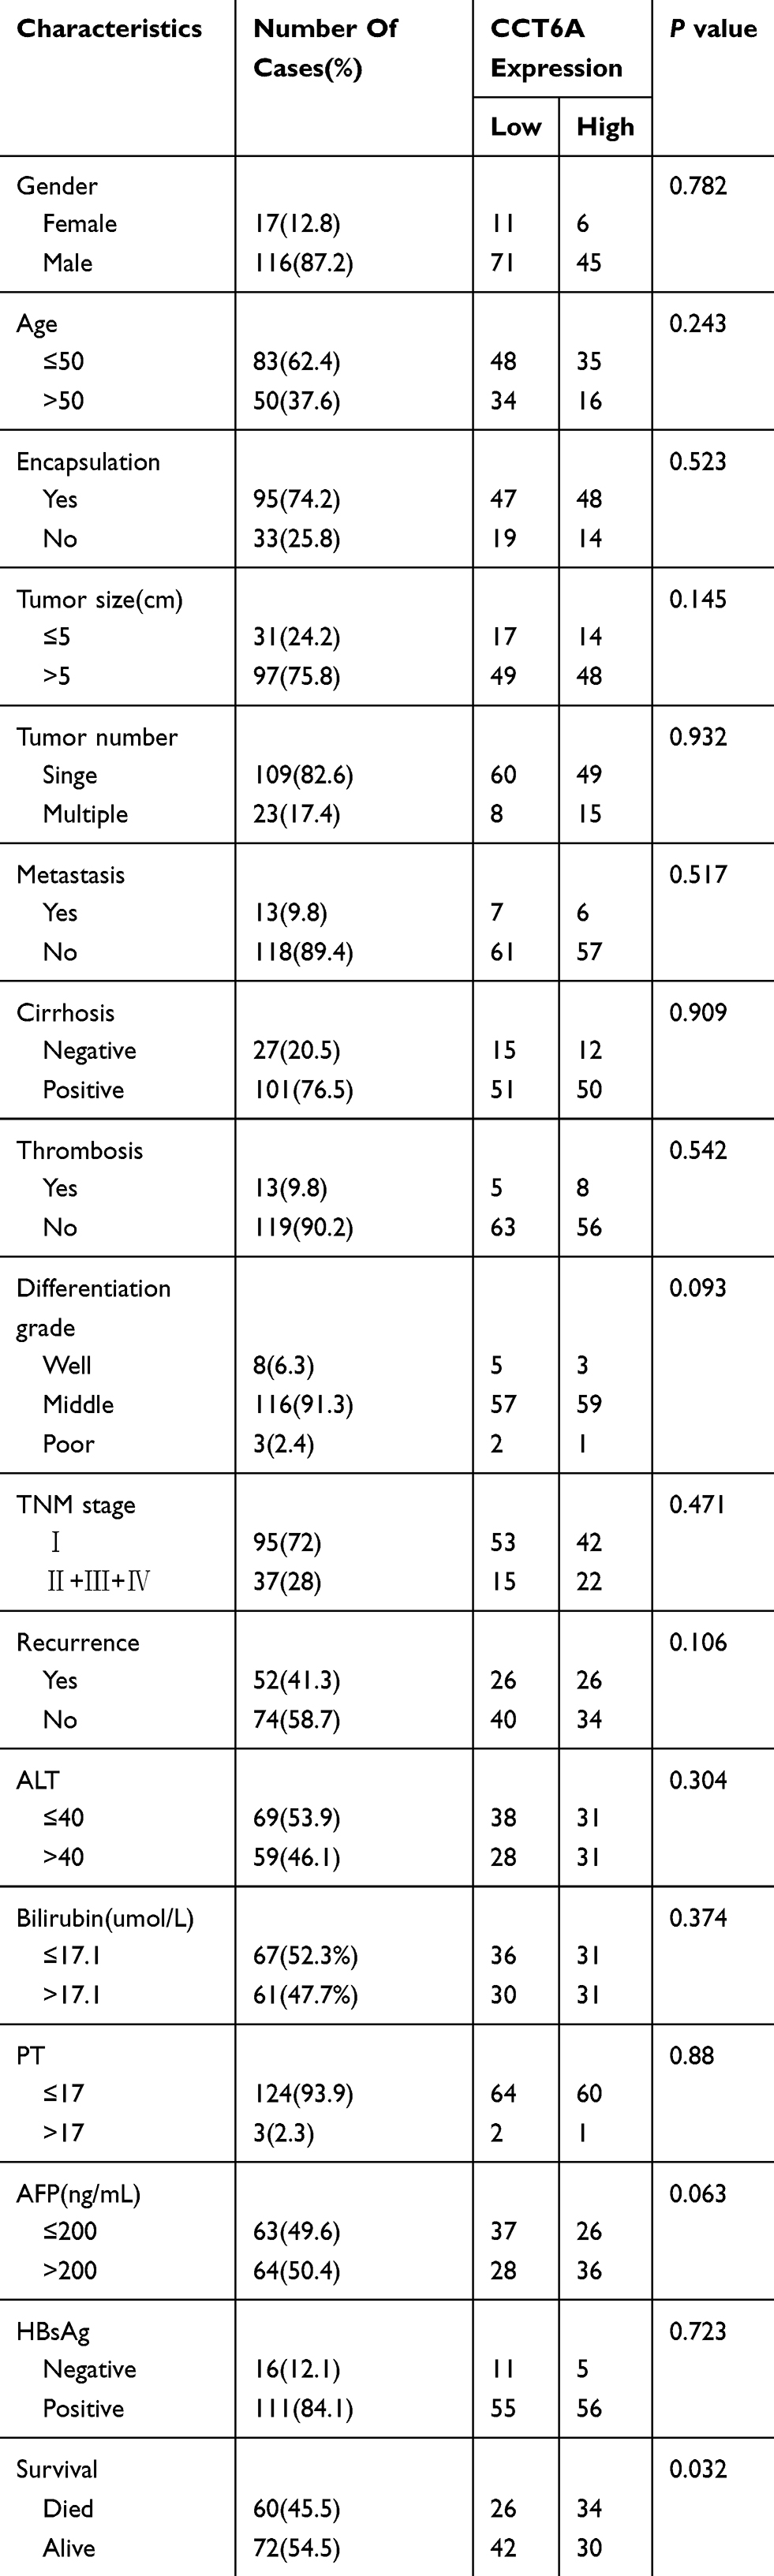 |
Table 2 Clinicopathological Characteristics Of HCC Patient Samples |
Quantitative PCR
The tissues were fully homogenized, after which total RNA extraction was carried out with the Trizol reagent (Cat. #T9424, Thermo, USA). Reverse transcription was performed using the GoScriptTM Reverse Transcription System (Cat. #A5001, Promega, USA). Quantitative PCR (qPCR) was implemented with the Roche LightCycler 480 (Roche, Switzerland) using SYBR Green (Cat. #A600a, Promega, USA). Reaction parameters were set as follows: 1 cycle of pre-denaturation at 95°C for 10minutes, followed by 40 cycles at 95°C for 10 seconds, 58°C for 10 seconds, and 72°C for 20 seconds. The sequences of primers used were: 5ʹ-TGACGACCTAAGTCCTGACTG-3ʹ (forward) and 5ʹ- ACAGAACGAGGGTTGTTACATTT-3ʹ (reverse) for CCT6A, and 5ʹ-GGAGCGAGATCCCTCCAAAAT-3ʹ (forward) and 5ʹ-GGCTGTTGTCATACTTCTCATGG-3ʹ (reverse) for GAPDH. Gene expression was calculated using the 2−∆∆Ct values. Three duplicate wells were set to carry out the qPCR.
Western Blot (WB)
Proteins from HCC tissues and cells were processed according to the standard procedure and quantified using a bicin-choninic acid (BCA) protein assay kit (Cat. #23227, Thermo, USA). We added 10 μg of proteins per well, separated them using the 8% or 10% sodium dodecyl sulfate- polyacrylamide gel electrophoresis (SDS-PAGE) and then transferred them to PVDF membranes (Bio-Rad, USA). The PVDF membranes were blocked in 5% DifcoTM Skim Milk (Cat. #232100, BD, USA) for one hour and then incubated overnight at 4°C with primary antibodies against CCT6A (Cat. #049949, 1:200, Human Protein Atlas), cyclin D (Cat. #2978, 1:1000, Cell Signaling Technology, USA), and GAPDH (Cat. #60004-1-Ig, 1:1000, Proteintech, China). The membranes were washed three times with TBST buffer at intervals of 15 mins, and were than incubated with the corresponding second antibodies conjugated with horseradish peroxidase (HRP) (Cat. #7074/#7076, Cell Signaling Technology, USA). We perfomed enhanced chemiluminescence (ECL, Pierce) to visualize the bands and used ImageJ software to carry out the quantitative analysis.
Immunohistochemistry (IHC)
Samples from 133 patients diagnosed with HCC at Sun Yat-sen University Cancer Center were subjected to an immunohistochemistry assay. After dewaxing the slides with xylene and hydrating in gradient alcoho, 3% hydrogen peroxide was used to inhibit endogenous peroxidase. Slides were then boiled in ethylenediamine tetraacetic acid (EDTA) (Cat. #ZLI-9072, Origene, China) for 3 minutes to expose the antigen, after which they were incubated with primary antibody solution against CCT6A (Cat. #049949, 1:200, Human Protein Atlas) for two hours. After washing for three times, they were covered with second antibody for 30 mins. After DAB staining (Cat. #K5007, Dako, Denmark), dehydrating, and mounting, the sections were evaluated by three independent pathologists according to staining area and intensity. The area was graded on a scale of 0–4 points and the intensity was graded on a scale of 0–3 points; the product of two values was defined as the CCT6A staining scores (0 meant no staining and 12 referred to the strongest staining).
Plasmid Construction, RNA Interference And Transfection
Two shRNA duplexes of CCT6A were subcloned to pLKO.1 (Sigma-Aldrich, USA) and transformed into DH-5α (Takara, Japan). The sequences of the shRNA were as follows: shCCT6A 1#, 5ʹ-CCGG CCAGAACATCTCTTCGTACTA CTCGAG TAGTACGAAGAGATGTTCTGG TTTTTG-3ʹ (forward); shCCT6A 2# 5ʹ-CCGG GCACACACTCACTCAGATCAA CTCGAG TTGATCTGAGTGAGTGTGTGC TTTTTG-3ʹ (forward). After confirming the sequencing, the shCCT6A plasmids were amplified and extracted with the Endofree Maxi plasmid kit (Cat. #DP117-TA, Tiangen, China). These shCCT6A plasmids and packaging plasmids were cotransfected into 293T cells with Lipofectamine 2000 (Cat. #11668019, Thermo, USA). Scrambled shRNA was used as the control (shNC) as described previously.19 Cell supernatant was collected in 24 hours and 48 hours after transfection and was then used to infect HCC cells (HepG2 and MHCC97L cells) individually. The knockdown effect of CCT6A were verified by WB one week after selection with puromycin (1 μg/mL, Sigma-Aldrich, USA). Meanwhile, two other CCT6A siRNA duplexes (CCT6A siRNA 1#, 5ʹ-GAACATCTCTTCGTACTAA-3ʹ; CCT6A siRNA 2#, 5ʹ-CATACATCCTCACTTGTAA-3ʹ) (RiboBio Company, Guangzhou, China) were transfected into HepG2 and MHCC97L cells according to the manufacturer’s instructions. We selected 50 nm of siRNA as the final concentration and confirmed the silenced effect of CCT6A by WB. All cells were purchased commercially from the Shanghai Institutes for Biological Sciences, Chinese Academy of Sciences (China).
CCK-8 Assay
HepG2 and MHCC97L cells were seeded into 96-well plates with 1000 and 500 cells/well in triplicate. Cells were then cultured in Dulbecco’s Modified Eagle Medium (DMEM; Cat. #811892, Gibco, USA) containing 10% fetal bovine serum (FBS) (Cat. #10270, Gibco, USA) at 37°C and 5% CO2. Cell viability was assessed using the CCK-8 assay (Cat. #CK04, Dojindo, Japan) according to the manufacturer’s protocol and results were read with a plate reader (ELX800, BiTek, USA) at 490 nm every day for the following five days.
Colony Formation Assay
Cells were seeded into 60 mm plates (with 1000 cells/plate for HepG2 cells and 250 cells/plate for MHCC97L cells) and cultured in DMEM containing 10% FBS. When visible colonies formed, plates were washed, fixed with methanol for 10minutes, and stained with 5% crystal violet (Cat. #C6158, Sigma-Aldrich, USA). Three replicates of the experiments were performed.
Cell Cycle Analysis
Cells were harvested after transfection with siRNA for 48hours and processed according to the manufacturer’s instructions. Briefly, the cells were washed, fixed overnight with 75% alcohol at −20°C, centrifuged, and then incubated with FxCycleTM PI/RNase staining solution (Cat. F10797, Invitrogen, USA) for 30 mins in the dark at room temperature. Cell cycles were measured with a Beckman- Coulter Flow Cytometry FC500 (USA), and analyzed using ModFit LT 4.1 software. Three replicates of the experiments were performed.
Immunofluorescence Assay
Immunofluorescence assay was conducted using the Cell-Light™ EdU Apollo®488 In Vitro Imaging kit (Cat. C10310-3, Ribobio, China). Briefly, cells in chamber dishes were incubated with medium containing 0.1% EDU buffer for two hours. After washing, fixing and staining with the Apollo buffer for 30minutes in the dark at room temperature, the slides were sealed with DAPI (Cat. #S369 63, Thermo, USA) and evaluated using a laser scanning microscope (DM4000B, Leica, Germany).
GSEA Analysis
We downloaded the RNA sequence profile of HCC from The Cancer Genome Atlas (TCGA) and adjusted the format as required. Gene set enrichment analysis (GSEA) software was used to predict the signal pathway of CCT6A.
Statistical Analysis
SPSS software version 25 and GraphPad Prism 7 were used for all statistical analyses. Paired t-tests or nonparametric tests were used to analyze the difference in the expression of CCT6A between HCC and para-carcinoma tissues. Chi-square tests were used to evaluate the relationship between the expression level of CCT6A and the clinicopathological characteristics of HCC patients. We used the Kaplan–Meier analysis and the Cox test to evaluate patient survival. Independent t-tests were performed to compare the difference between the control and the knockdown group. All statistical tests were two sided, and p < 0.05 was considered significant.
Results
CCT6A mRNA Was Overexpressed And Associated With Poor Survival In Liver Cancer
To evaluate the relationship between CCT6A and HCC, we first examined the expression of CCT6A throughout the ONCOMINE and the UALCAN databases. CCT6A expression increased significantly in HCC tissues in comparison to matched normal tissues (Figure 1A). The expression of CCT6A from different datasets is shown in Table 1.20,21 Data from the ONCOMINE and the UALCAN database showed the same trend, even though the databases use different sources (p < 0.001, Figure 1B). Due to the upregulating expression of CCT6A in HCC tissues, we evaluated if there was any relationship between the expression level of CCT6A and the clinical outcomes of HCC patients. We found that as the tumor grade and stage increased, mRNA expression of CCT6A also increased (Figure 1C). However, the trend was not consistent in grade 4 and stage 4, which may be due to the small sample size in both groups.
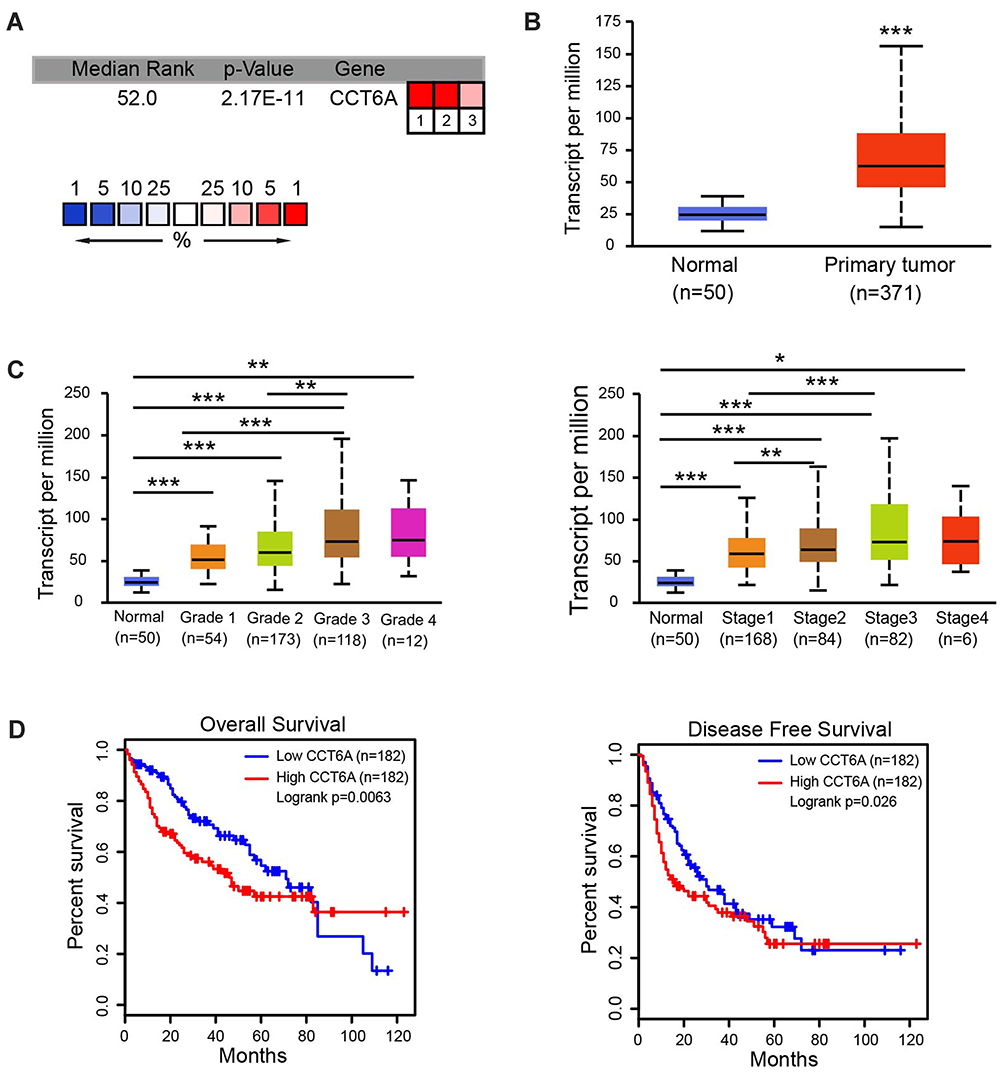 |
Figure 1 Expression levels of CCT6A mRNA and its association with survival rates in patients with liver cance. (A) Transcription levels of CCT6A in HCC tissues from the ONCOMINE database. (B) mRNA expression of CCT6A in HCC tissues in TCGA samples from the UALCAN database. (C) Transcription levels of CCT6A associated with HCC patients’ individual grades and stages based on the UALCAN database. (D) Correlation of CCT6A mRNA expression with overall survival (OS; n = 182, p = 0.0063) and disease-free survival (DFS; n = 182, p = 0.026) from the GEPIA database. *p < 0.05, **p < 0.01, ***p < 0.001. |
Additionally, we employed GEPIA database to explore the prognostic value of CCT6A expression in HCC patients. The high expression level of CCT6A mRNA was associated with reduced overall survival (HR=1.6, p = 0.0063) and disease free survival (HR=1.4, p = 0.026; Figure 1D). Based on the bioinformatics results, we believe that CCT6A may be an essential oncogene in HCC, thus exploring its role in HCC is necessary.
Upregulation Of CCT6A Was Validated In HCC Tissues
We determined the expression of CCT6A in fresh HCC tissues. The transcription analysis of 34 pairs of HCC and matched adjacent non-cancerous tissues showed an elevated expression of CCT6A mRNA in HCC tumor tissues (p = 0.0317, Figure 2A). Moreover, WB results indicated that the protein level of CCT6A increased in HCC tissues (5/7; Figure 2B). IHC analysis of 15 paired cancer and adjacent non-cancerous tissues showed that CCT6A proteins increased in cancerous tissues (p < 0.001; Figure 2C).Our results indicated that both mRNA and protein levels of CCT6A were upregulated in HCC tissues, consistent with the results from the bioinformatics analysis.
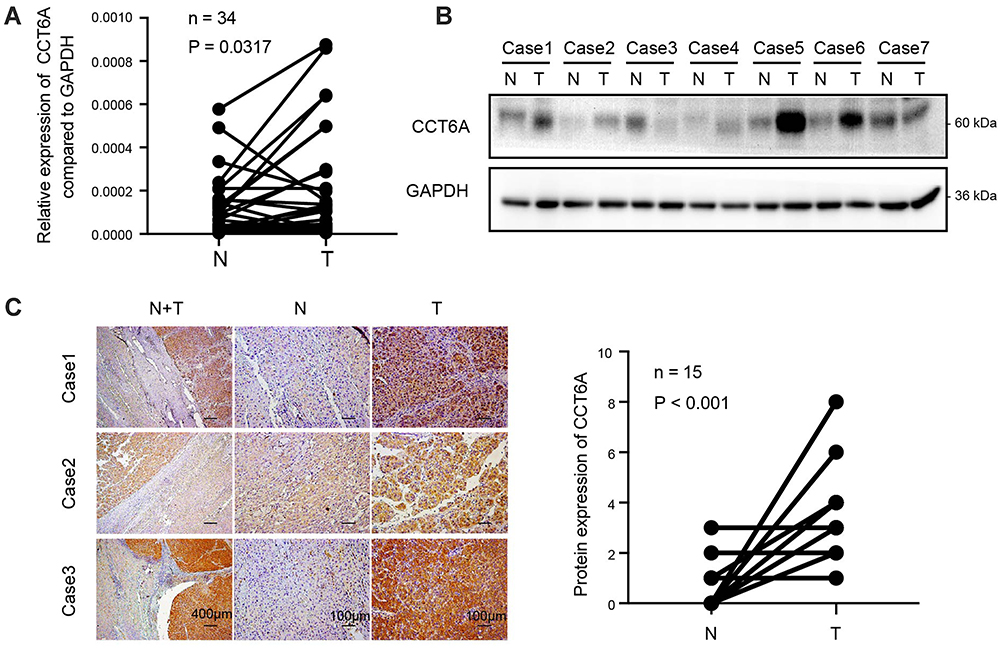 |
Figure 2 Upregulation of CCT6A validated in HCC tissues. (A) mRNA expression of CCT6A in 34 paired HCC tissues and adjacent normal tissues by qPCR. (B) Protein levels of CCT6A in 7 paired of HCC tissues and adjacent normal tissues by WB. Glyceraldehyde 3-phosphate dehydroge- nase (GAPDH) was used as a loading control. (C) Representative images of immunohistochemical staining (left) and quantification of immunohistochemical staining (n=15; right). The scale bar of the left panel is 400 μm while the scale bar of the middle and right panels is 100μm. Abbreviations: N, non-cancerous; T, tumor. |
High Level Of CCT6A Correlated With Poor Prognosis In HCC Patients
To further address the relationship between the level of CCT6A and the clinicopathological characterisitcs and check its prognostic value in HCC patients, we evaluated the expression of CCT6A by performing an IHC assay using a cohort of cancerous tissues from 133 HCC patients (Table 2), IHC staining showed that CCT6A was mainly located in the cytosol (Figure 3A); sections were evaluated according to staining intensity and area by pathologists. Kaplan–Meier survival analysis showed CCT6A expression was negatively correlated with overall survival (p = 0.023) and disease-free survival (p = 0.050) (Figure 3B). Moreover, we found that CCT6A scores (p = 0.021), tumor size (p = 0.022), tumor number (p = 0.001), encapsulation (p = 0.002), metastasis (p = 0.001), tumor thrombus (p < 0.001), TNM stage (p < 0.001) and recurrence (p = 0.01) were associated with survival in univariate analysis, while the results of multivariate analysis (Table 3) indicated that CCT6A expression would be an independent factor of HCC patient’s survival (p = 0.037) (Table 3). These results suggest that CCT6A could be a prognostic biomarker for HCC.
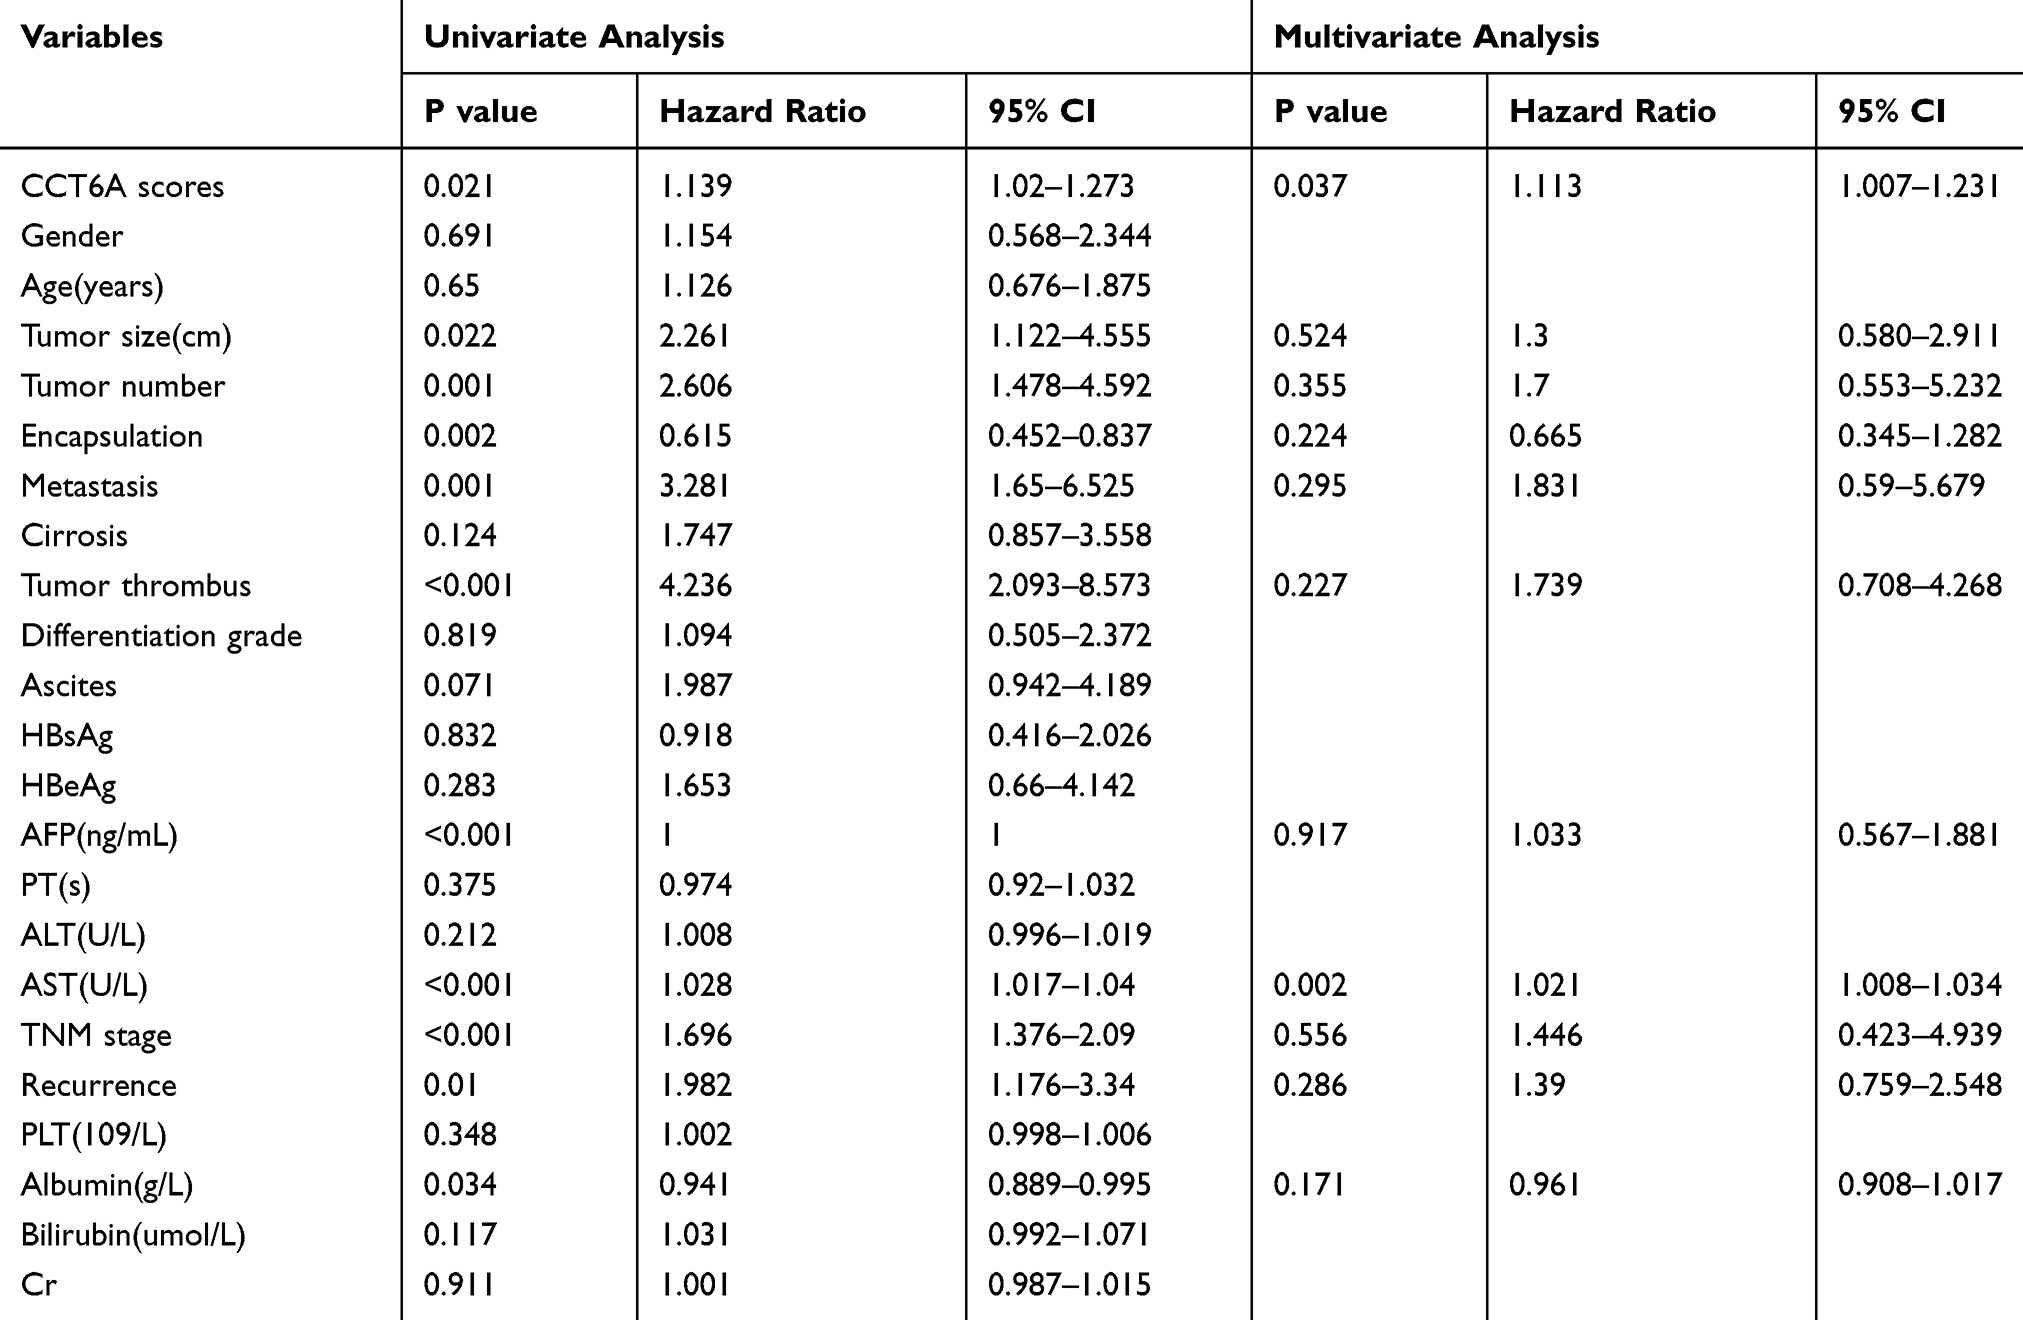 |
Table 3 Univariate And Multivariate Analysis Of Overall Survival In 133 HCC Patient Samples |
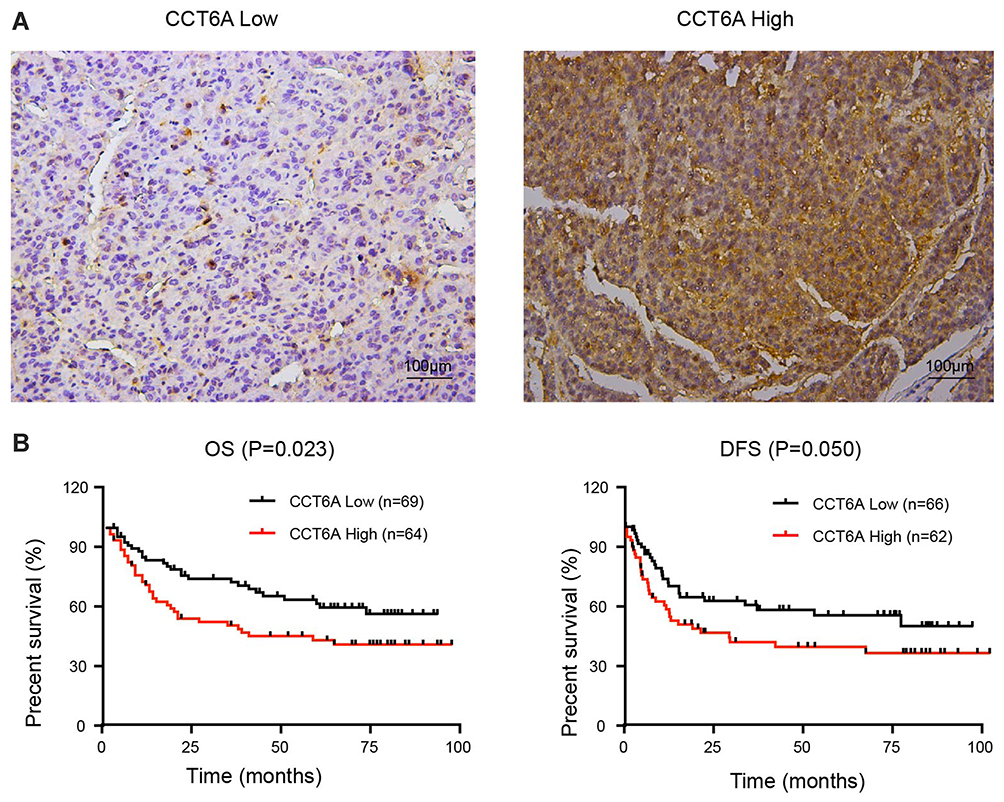 |
Figure 3 Correlation of CCT6A levels with HCC patient prognosis. (A) Representative images of immunohistochemical staining in HCC tissues. The scale of the upper panel is 100 μm. (B) Correlation of the expression level of CCT6A with overall survival (OS; n = 133, p = 0.023) and disease-free survival (DFS; n = 128, p = 0.050). |
CCT6A Involved In Proliferation And Clonogenicity Of HCC Cells
To verify the function of CCT6A expression on HCC, two HCC cell lines (HepG2 and MHCC97L) were used to construct a CCT6A knockdown cell model using two different shRNA duplexes in a lentivirus infection and the knockdown effect was confirmed by WB (Figure 4A). From the CCK8 assay, we found that CCT6A depletion decreased cell proliferation dramatically (Figure 4B). Consistent with the CCK8 assay results, knockdown of CCT6A also suppressed colony formation of HCC cells (Figure 4C). These results demonstrate that CCT6A contributes to the proliferation of HCC cells.
 |
Figure 4 Role of CCT6A in the proliferation and clonogenicity of HCC cells. (A) Knockdown effects of CCT6A after shRNAs’ transfection in HepG2 and MHCC97L cells (left). Quantification of the Western blot (right). (B) Cell viability of HepG2 (left) and MHCC97L (right) cells transfected with the negative control (NC) and CCT6A targeted shRNA. (C) Colony formation assays of the negative control (NC) and CCT6A knockdown cells (left). Quantification of colony numbers (right). *p < 0.05, **p < 0.01, ***p < 0.001. |
CCT6A Promoted G1-To-S Transition Of HCC Cells
Gene set enrichment analysis (GSEA)22 showed that CCT6A levels were positively associated with cell cycle regulating genes (NES = 1.850, p = 0.004), suggesting that CCT6A may be involved in cell cycle transition in HCC (Figure 5A). Flow cytometry results showed that the proportion of cells in G1/S phase was remarkably elevated in CCT6A knockdown cells compared to the negative control, indicating that inhibition of CCT6A could contribute to G1/S phase arrest (Figure 5B). On the other hand, the fraction of incorporated EDU cells decreased significantly in both CCT6A-silenced HepG2 and MHCC97L cells, which further reinforced the cell cycle results (Figure 5C). Cyclin D is one of the key cycle proteins responsible for triggering G1-to-S phase transition.23 Hence, we detected cyclin D expression after CCT6A depletion and found that the expression of cyclin D decreased dramatically in silenced CCT6A cells (Figure 5D) . These results indicated that CCT6A could be involved in maintaining cyclin D expression and facilitating G1-to-S phase transition in HCC cells.
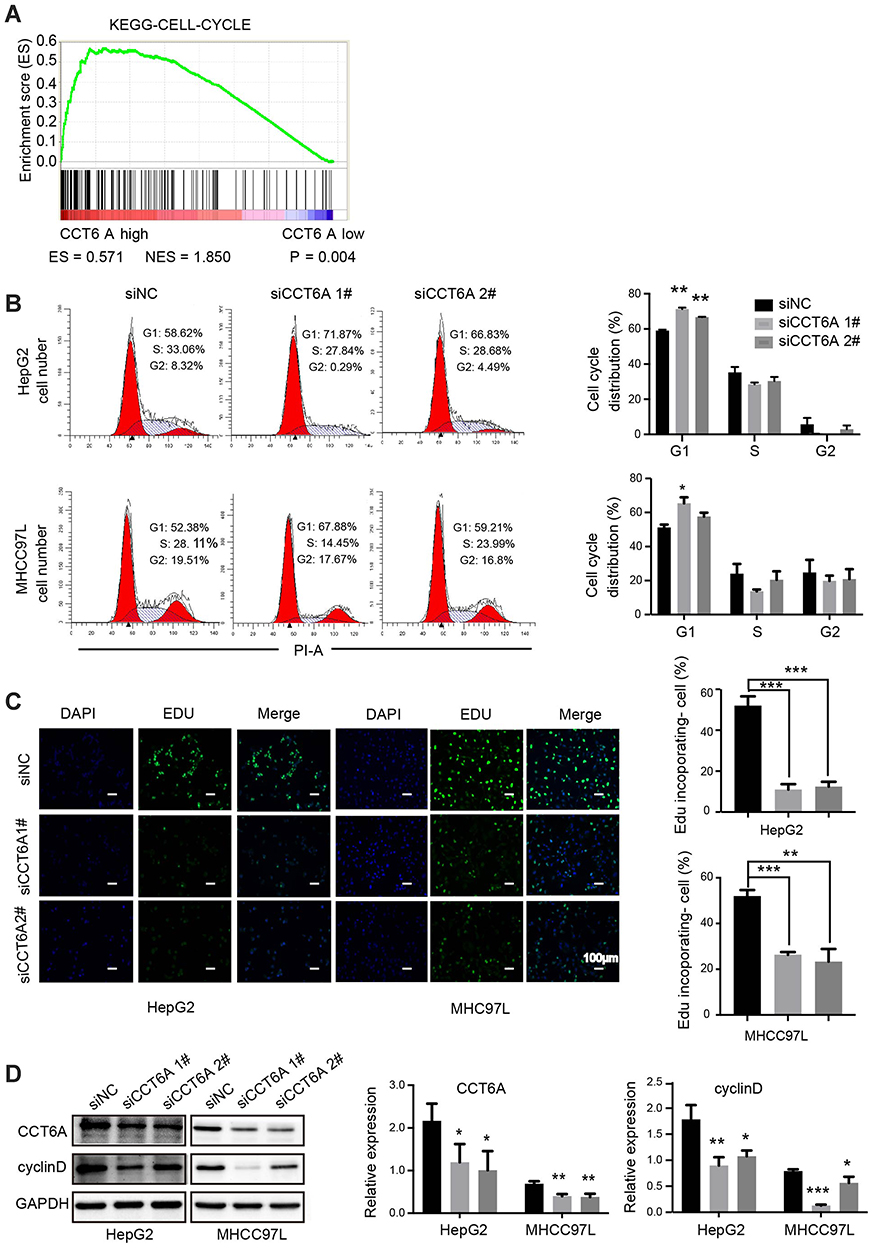 |
Figure 5 Role of CCT6A in the G1-to-S transition of HCC cells. (A) Relationship of CCT6A expression with cell cycle related gene signatures (ES = 0.571, NES = 1.850, p = 0.004). (B) Representative images of cell cycle distribution of HepG2 and MHCC97L cells by flow cytometry after transfection of NC and CCT6A targeted siRNA for 48 hrs (left). Quantification of cell cycle distribution (right). (C) Representative images of EDU in HepG2 (left) and MHCC97L cells (right) after transfection of NC and CCT6A targeted siRNA after 48 hrs (left). The green fluorescence indicated the DNA with EDU incorporated cells and the blue fluorescence (DAPI) referred to nucleus. Scale bar is 100 μm. Quantification of EDU incorporated cells (right). (D) Western blot analysis of CCT6A, cyclin D expression in HepG2 and MHCC97L cells after transfection of NC and CCT6A targeted siRNA for 48 hrs (left). Quantification of the Western blot (right). *p < 0.05, **p < 0.01, ***p < 0.001. |
Discussion
The CCT complex belongs to chaperones and about 10% of cytosolic proteins are thought to be folded by CCT.24 In 1993, Sternlicht et al2 found that CCT was responsible for actin and tubulin biogenesis, which implicated that CCT would be involved in cancer biology. In fact, a series of cancer behaviors, such as cell division, migration, and invation, are closely related to actin and tubulin. Subsequently, there are increasing evidences that the CCT complex is an essential mediator of tumorigenesis. Feldman et al6 demonstrated that CCT folded VHL while Trinidad et al7 proved that P53 was folded by CCT. In terms of carcinogenic factors, CCT was shown to bind and fold STAT3.4 In addition to tumor related proteins, a variety of regulators of cell biology, such as CDC20,25 cyclinE,26 and Polo-like kinase-1 (PLK1),27 are modulated by CCT. Despite the importance of CCT in carcionogenesis, its role in liver cancer remains unclear. Here, we demonstrated that the high expression level of CCT6A correlated with reduced survival in HCC patients. Additionally, silencing of CCT6A gene expression downregulated cyclin D production, which decreased the proliferation of HCC.
Our results demonstrated the high expression of CCT6A in HCC using bioinformatics analysis, which was further validated by evaluating mRNA and protein levels of samples from HCC patients. By analyzing 8-year retrospective follow-up data of these patients, we confirmed that higher CCT6A expression correlates with reduced overall survival. Thus, our study is the first to verify the predictive value of CCT6A in the prognosis of HCC patients. However, considering the heterogeneity of HCC, larger samples are needed to confirm the prognostic vaule of CCT6A in HCC.
Cyclin E is another positive regulator of G1-to-S phase transition.28 Won et al found that CCT accounted for the maturation of cyclin E in yeast and Yin et al found that cyclin E decreased in CCT8-depleted diffuse large B-cell lymphoma cells.13,26 However, in our study, cyclin E levels were almost the same or even increased slightly (data not shown), while the expression of cyclin D decreased dramatically in CCT6A-knocked-down HCC cells (Figure 5D). This may be due to the binding site diversity in apical domains of CCT subunits, which leads to the distinct functions.29
Nonetheless, there are still several limitations in our study. Although we explored two lines of HCC cells, different knockdown sequences and distinct experimental methods to confirm the role of CCT6A, we did not perform overexpression experiments. We also found a potential interaction between CCT6A and cyclin D, which would cause a cancer-promoting effect of CCT6A on HCC, however, further studies are needed to achieve definite conclusions.
Previous studies indicated that the overexpression of CCT2 enhanced the susceptibility of a cytotoxic peptide-CT20p in breast cancer.30 Silencing the expression of CCT2 resulted in multidrug-resistant uterine cancer cells being less susceptible to I-Trp (N-iodoacetyl-tryptophan) induced apoptotic cell death.31 Thus, CCT could be a chemotherapeutic target against tumors. In future studies, we would focus on whether CCT6A is associated with chemotherapeutic susceptibility and what would be the underlying mechanisms that could guide the chemotherapy regimen in HCC patients who are resistant to conventional drugs due to the heterogeneity.
Conclusion
In conclusion, our research indicated that CCT6A was upregulated in HCC. High levels of CCT6A could indicate a negative prognosis in HCC patients. Silencing CCT6A inhibited HCC cell proliferation by blocking the G1-to-S phase transition as it downregulates cyclin D. Hence, CCT6A could be considered an oncogene of HCC and it could be a promising prognostic biomarker and chemotherapeutic target in HCC patients.
Abbreviations
CAM-DR, cell adhesion-mediated drug resistance; CCK-8, cell counting kit-8; CCT6A, the sixth subunit of chaperonin-containing tailless complex polypeptide 1; CI, confidence interval; CRC, Colorectal Carcinoma; EDTA, ethylenediamine tetraacetic acid; GEO, Gene Expression Omnibus; GSEA, Gene set enrichment analysis; HCC, Hepatocellular carcinoma; IHC, immunohistochemistry; NSCLC, Non–small-cell lung carcinoma; NC, negative control; PLK1, Polo-like kinase-1; SDS-PAGE, sodium dodecyl sulfate- polyacrylamide gel electrophoresis; STAT3, transducer and activator of transcription 3; TCGA, The Cancer Genome Atlas; WB, Western blot.
Acknowledgments
This study was partially supported by the National Natural Science Foundation of China (grant number 81872006), the Research and Development Planned Project in key areas of Guangdong Province (No.2019B0233002), the Major Project of Collaborative Innovation of Guangzhou Science and Technology Program (No.201704020175), and the Postdoctoral Science Foundation of China (2019TQ0381).
Disclosure
The authors report no conflicts of interest in this work.
References
1. Bray F, Ferlay J, Soerjomataram I, Siegel RL, Torre LA, Jemal A. Global cancer statistics 2018: GLOBOCAN estimates of incidence and mortality worldwide for 36 cancers in 185 countries. CA Cancer J Clin. 2018;68(6):394–424. doi:10.3322/caac.21492
2. Sternlicht H, Farr GW, Sternlicht ML, Driscoll JK, Willison K, Yaffe MB. The t-complex polypeptide 1 complex is a chaperonin for tubulin and actin in vivo. Proc Natl Acad Sci U S A. 1993;90(20):9422–9426. doi:10.1073/pnas.90.20.9422
3. Vallin J, Grantham J. The role of the molecular chaperone CCT in protein folding and mediation of cytoskeleton-associated processes: implications for cancer cell biology. Cell Stress Chaperones. 2019;24(1):17–27. doi:10.1007/s12192-018-0949-3
4. Kasembeli M, Lau WC, Roh SH, et al. Modulation of STAT3 folding and function by TRiC/CCT chaperonin. PLoS Biol. 2014;12(4):e1001844. doi:10.1371/journal.pbio.1001844
5. Bakthavatsalam D, Soung RH, Tweardy DJ, Chiu W, Dixon RA, Woodside DG. Chaperonin-containing TCP-1 complex directly binds to the cytoplasmic domain of the LOX-1 receptor. FEBS Lett. 2014;588(13):2133–2140. doi:10.1016/j.febslet.2014.04.049
6. Feldman DE, Thulasiraman V, Ferreyra RG, Frydman J. Formation of the VHL-elongin BC tumor suppressor complex is mediated by the chaperonin TRiC. Mol Cell. 1999;4(6):1051–1061. doi:10.1016/S1097-2765(00)80233-6
7. Trinidad AG, Muller PA, Cuellar J, et al. Interaction of p53 with the CCT complex promotes protein folding and wild-type p53 activity. Mol Cell. 2013;50(6):805–817. doi:10.1016/j.molcel.2013.05.002
8. Sergeeva OA, Chen B, Haase-Pettingell C, Ludtke SJ, Chiu W, King JA. Human CCT4 and CCT5 chaperonin subunits expressed in Escherichia coli form biologically active homo-oligomers. J Biol Chem. 2013;288(24):17734–17744. doi:10.1074/jbc.M112.443929
9. Amit M, Weisberg SJ, Nadler-Holly M, et al. Equivalent mutations in the eight subunits of the chaperonin CCT produce dramatically different cellular and gene expression phenotypes. J Mol Biol. 2010;401(3):532–543. doi:10.1016/j.jmb.2010.06.037
10. Guest ST, Kratche ZR, Bollig-Fischer A, Haddad R, Ethier SP. Two members of the TRiC chaperonin complex, CCT2 and TCP1 are essential for survival of breast cancer cells and are linked to driving oncogenes. Exp Cell Res. 2015;332(2):223–235. doi:10.1016/j.yexcr.2015.02.005
11. Coghlin C, Carpenter B, Dundas SR, Lawrie LC, Telfer C, Murray GI. Characterization and over-expression of chaperonin t-complex proteins in colorectal cancer. J Pathol. 2006;210(3):351–357. doi:10.1002/path.2056
12. Zhang Y, Wang Y, Wei Y, et al. Molecular chaperone CCT3 supports proper mitotic progression and cell proliferation in hepatocellular carcinoma cells. Cancer Lett. 2016;372(1):101–109. doi:10.1016/j.canlet.2015.12.029
13. Yin H, Miao X, Wu Y, et al. The role of the Chaperonin containing t-complex polypeptide 1, subunit 8 (CCT8) in B-cell non-Hodgkin’s lymphoma. Leuk Res. 2016;45:59–67. doi:10.1016/j.leukres.2016.04.010
14. Ying Z, Tian H, Li Y, et al. CCT6A suppresses SMAD2 and promotes prometastatic TGF-beta signaling. J Clin Invest. 2017;127(5):1725–1740. doi:10.1172/JCI90439
15. Qian-Lin Z, Ting-Feng W, Qi-Feng C, Min-Hua Z, Ai-Guo L. Inhibition of cytosolic chaperonin CCTzeta-1 expression depletes proliferation of colorectal carcinoma in vitro. J Surg Oncol. 2010;102(5):419–423. doi:10.1002/jso.21625
16. Rhodes DR, Yu J, Shanker K, et al. ONCOMINE: a cancer microarray database and integrated data-mining platform. Neoplasia. 2004;6(1):1–6. doi:10.1016/S1476-5586(04)80047-2
17. Chandrashekar DS, Bashel B, Balasubramanya SAH, et al. UALCAN: a portal for facilitating tumor subgroup gene expression and survival analyses. Neoplasia. 2017;19(8):649–658. doi:10.1016/j.neo.2017.05.002
18. Tang Z, Li C, Kang B, Gao G, Li C, Zhang Z. GEPIA: a web server for cancer and normal gene expression profiling and interactive analyses. Nucleic Acids Res. 2017;45(W1):W98–W102. doi:10.1093/nar/gkx247
19. Wu X, Wang H, Lian Y, et al. GTSE1 promotes cell migration and invasion by regulating EMT in hepatocellular carcinoma and is associated with poor prognosis. Sci Rep. 2017;7(1):5129. doi:10.1038/s41598-017-05311-2
20. Roessler S, Jia HL, Budhu A, et al. A unique metastasis gene signature enables prediction of tumor relapse in early-stage hepatocellular carcinoma patients. Cancer Res. 2010;70(24):10202–10212. doi:10.1158/0008-5472.CAN-10-2607
21. Wurmbach E, Chen YB, Khitrov G, et al. Genome-wide molecular profiles of HCV-induced dysplasia and hepatocellular carcinoma. Hepatology. 2007;45(4):938–947. doi:10.1002/hep.21622
22. Subramanian A, Tamayo P, Mootha VK, et al. Gene set enrichment analysis: a knowledge-based approach for interpreting genome-wide expression profiles. Proc Natl Acad Sci U S A. 2005;102(43):15545–15550. doi:10.1073/pnas.0506580102
23. Sherr CJ. D-type cyclins. Trends Biochem Sci. 1995;20(5):187–190. doi:10.1016/S0968-0004(00)89005-2
24. Yam AY, Xia Y, Lin HT, Burlingame A, Gerstein M, Frydman J. Defining the TRiC/CCT interactome links chaperonin function to stabilization of newly made proteins with complex topologies. Nat Struct Mol Biol. 2008;15(12):1255–1262. doi:10.1038/nsmb.1515
25. Yokota S, Yanagi H, Yura T, Kubota H. Cytosolic chaperonin is up-regulated during cell growth. Preferential expression and binding to tubulin at G(1)/S transition through early S phase. J Biol Chem. 1999;274(52):37070–37078. doi:10.1074/jbc.274.52.37070
26. Won KA, Schumacher RJ, Farr GW, Horwich AL, Reed SI. Maturation of human cyclin E requires the function of eukaryotic chaperonin CCT. Mol Cell Biol. 1998;18(12):7584–7589. doi:10.1128/MCB.18.12.7584
27. Liu X, Lin CY, Lei M, Yan S, Zhou T, Erikson RL. CCT chaperonin complex is required for the biogenesis of functional Plk1. Mol Cell Biol. 2005;25(12):4993–5010. doi:10.1128/MCB.25.12.4993-5010.2005
28. Ohtsubo M, Theodoras AM, Schumacher J, Roberts JM, Pagano M. Human cyclin E, a nuclear protein essential for the G1-to-S phase transition. Mol Cell Biol. 1995;15(5):2612–2624. doi:10.1128/MCB.15.5.2612
29. Spiess C, Miller EJ, McClellan AJ, Frydman J. Identification of the TRiC/CCT substrate binding sites uncovers the function of subunit diversity in eukaryotic chaperonins. Mol Cell. 2006;24(1):25–37. doi:10.1016/j.molcel.2006.09.003
30. Bassiouni R, Nemec KN, Iketani A, et al. Chaperonin containing TCP-1 protein level in breast cancer cells predicts therapeutic application of a cytotoxic peptide. Clin Cancer Res. 2016;22(17):4366–4379. doi:10.1158/1078-0432.CCR-15-2502
31. Lin YF, Tsai WP, Liu HG, Liang PH. Intracellular beta-tubulin/chaperonin containing TCP1-beta complex serves as a novel chemotherapeutic target against drug-resistant tumors. Cancer Res. 2009;69(17):6879–6888. doi:10.1158/0008-5472.CAN-08-4700
 © 2019 The Author(s). This work is published and licensed by Dove Medical Press Limited. The full terms of this license are available at https://www.dovepress.com/terms.php and incorporate the Creative Commons Attribution - Non Commercial (unported, v3.0) License.
By accessing the work you hereby accept the Terms. Non-commercial uses of the work are permitted without any further permission from Dove Medical Press Limited, provided the work is properly attributed. For permission for commercial use of this work, please see paragraphs 4.2 and 5 of our Terms.
© 2019 The Author(s). This work is published and licensed by Dove Medical Press Limited. The full terms of this license are available at https://www.dovepress.com/terms.php and incorporate the Creative Commons Attribution - Non Commercial (unported, v3.0) License.
By accessing the work you hereby accept the Terms. Non-commercial uses of the work are permitted without any further permission from Dove Medical Press Limited, provided the work is properly attributed. For permission for commercial use of this work, please see paragraphs 4.2 and 5 of our Terms.