")
Back to Journals » Cancer Management and Research » Volume 11
Overexpressed pepsinogen C is associated with poor prognosis in human hepatocellular carcinoma: a tissue microarray study
Authors Chen H, Zhu HR, Yu XN, Shi X, Bilegsaikhan E, Guo HY, Huang RZ, Liu TT, Shen XZ, Zhu JM
Received 25 October 2018
Accepted for publication 7 March 2019
Published 10 April 2019 Volume 2019:11 Pages 2927—2934
DOI https://doi.org/10.2147/CMAR.S192241
Checked for plagiarism Yes
Review by Single anonymous peer review
Peer reviewer comments 2
Editor who approved publication: Dr Rituraj Purohit
Hong Chen,1 Hai-Rong Zhu,2 Xiang-Nan Yu,2 Xuan Shi,2 Enkhnaran Bilegsaikhan,2 Hong-Ying Guo,2 Ren-Zheng Huang,2 Tao-Tao Liu,2 Xi-Zhong Shen,2–4 Ji-Min Zhu2,3
1Department of Endocrinology, Zhongshan Hospital of Fudan University, Shanghai, People’s Republic of China; 2Department of Gastroenterologyand Hepatology, Zhongshan Hospital of Fudan University, Shanghai, People’s Republic of China; 3Shanghai Institute of Liver Disease, Zhongshan Hospital of Fudan University, Shanghai, People’s Republic of China; 4Key Laboratory of Medical Molecular Virology, Shanghai Medical College of Fudan University, Shanghai, People’s Republic of China
Background: Aberrant expression of pepsinogen C (PGC) has been observed in human cancers. However, its role in hepatocellular carcinoma (HCC) remains to be established. The goal of this study is to illustrate PGC expression and to evaluate its clinical relevance in HCC.
Materials and methods: PGC expression was examined in 75 pairs of HCC and adjacent non-tumor tissues using tissue microarray. The correlations between its expression and clinical parameters were also analyzed.
Results: PGC overexpression was significantly associated with larger tumor size (≥5 cm; P=0.017) and incomplete encapsulation (P<0.0001). Cox regression model demonstrated that PGC expression and tumor size were independent prognostic factors for overall survival (OS) and disease-free survival (DFS) in HCC. The subgroup analysis by Kaplan–Meier uncovered that OS and DFS were much worse in high PGC level group than in low PGC level group with large tumor size subgroup, while no difference of OS was noted between the two groups with low tumor size subgroup.
Conclusion: PGC plays a tumorigenesis role in HCC progression, which may lead to a novel insight to the potential biomarker and novel therapeutic strategies for HCC patients.
Keywords: hepatocellular carcinoma, pepsinogen C, prognostic biomarker, tumor size, tissue microarray
Introduction
Hepatocellular carcinoma (HCC), one of the most frequent liver cancers, represents the sixth most common cancer and the third leading cause of cancer-related death worldwide.1 There are multiple factors involved in the etiology of HCC, such as chronic hepatitis B or C infection, alcoholic liver disease and nonalcoholic fatty liver disease.2–4 Although surgical resection remains the mainstay for patients with HCC, the 2- and 5-year relapse rates were 50% and 75%, respectively.5,6 Thus, there is an urgent need to develop effective prognostic factor predicting survival condition of HCC patients after liver resection.
In the past decades, a variety of prognostic biomarkers have been reported to play vital roles in HCC. For instance, our previous study indicated that eukaryotic initiation factor 4E is higher in HCC specimens and cell lines as compared with corresponding controls, which demonstrates potential prognostic value and possible way for designing therapeutic strategies for HCC.7 Recently, we performed a gene microarray to identify differential expressed genes in seven pairs of HCC and adjacent non-tumor tissues (
PGC is synthesized in gastric mucosa and secreted into gastric lumen where it gets converted into active enzyme pepsin C under acidic conditions.8 Previous studies showed that as an aspartyl protease, PGC presents not only in the gastric cavity but in other tissues, such as pancreatic islets,9 prostate10 and lung,11 which lead to explore potential role of PGC in different contexts in the follow-on investigations.12 Recent studies indicated that, as a diagnostic marker, PGC was upregulated in prostate cancer,13 and downregulated in breast14 and gastric cancers.15 Particularly, increased PGC expression was identified in HCC specimens compared with matched non-tumor tissues.16
Although investigation of PGC has been conducted, the associations between PGC expression and clinical characteristics in large sample size remain unclear in HCC. In the present study, we performed immunohistochemistry (IHC) on a tissue microarray (TMA) containing 75 pairs of HCC and adjacent non-tumor tissues, and analyzed the correlations between PGC expression and clinicopathological parameters (including gender, age, HBsAg, ALT, AFP, Cirrhosis, tumor size, tumor number, encapsulation and pathologic differentiation) to unravel the diagnostic and prognostic role of PGC in HCC.
Materials and methods
Patients and tissue samples
A cohort of 75 primary HCC patients was enrolled into the study. These patients underwent hepatectomy for HCC from February 2006 through May 2007 in the Department of Liver Surgery, Zhongshan Hospital of Fudan University. They were diagnosed as HCC by pathological examination after surgery. It was confirmed that none of the patients had received chemotherapy, radiotherapy or surgical resection prior to the surgery. The present study was conducted in accordance with the Declaration of Helsinki. The approval of the study was obtained from the Institution Ethics Committee of Zhongshan Hospital of Fudan University. Written informed consents were obtained from all patients who participated in the study. Clinical follow-up was available for all patients until February 2012. The overall survival (OS) time was defined as the interval between the day of liver surgery and the deadline of the follow-up or between resection and death, while the disease-free survival (DFS) time ranged from the time of liver surgery to the time of disease relapse or the deadline of follow-up.
TMA preparation and IHC
PGC expression was tested in 75 pairs of HCC and adjacent non-tumor tissues by IHC in TMA. The human liver specimens were fixed in formalin at the moment of separation from the patients after surgery and then embedded in paraffin. The 4-μm-thick slices were prepared and stored at 4°C until use. Xylene and ethanol in graded concentrations were used to de-wax and rehydrate the section. The section was soaked in 0.6% hydrogen peroxide to erase endogenous catalase at 37°C for 30 mins. The retrieval of the antigen was proceeded in microwave in Tris-EDTA buffer for 30 mins. After blocked with normal goat serum (dilution in 1:20) for 20 mins, the section was incubated with primary rabbit anti-PGC antibody (dilution in 1:50; Cat# ab180709, Abcam, Cambridge, MA, USA) at 4°C overnight. Subsequently, the incubation of secondary anti-rabbit antibody for 45 mins at 37°C, 3,3ʹ-Diaminobenzidine and hematoxylin was finally used to stain the section. The negative control was incubated by phosphate-buffered solution in the replace of primary anti-PGC antibody.
IHC intensity evaluation
The TMA slide was scanned by Olympus VS120 Virtual Slide Microscopy to estimate PGC expression in HCC and adjacent non-tumor tissues. The presence of brown staining in the nucleus or cytoplasm was defined as positive cells according to the manufacturer’s instruction. The staining area and intensity were considered as two important components of score system for PGC expression. The evaluation procedure of the immunoreactivity was reviewed by two pathologists independently, without any of related clinical data informed.7,17
The percent positivity was scored as follows: 0 (≤30%), 1 (31–60%) and 2 (≥61%). The staining intensity of the tumor cells was classified into three categories: no staining (score=0), weakly to moderately staining (score=1) and strongly staining (score=2). The final PGC expression score was calculated by multiplying the value of percent positivity score with staining intensity score, which ranged from 0 to 4. Scores 3–4 were defined as high expression, while scores 0–2 were defined as low expression.
Statistical analysis
All statistical analyses in the study were performed by SPSS 22.0 (SPSS, Chicago, IL, USA). The statistic comparison calculation was analyzed by application of Chi-square test and Fisher’s exact test for categorical data, and Student’s t-test for continuous data. The Chi-square test and Fisher’s exact test were conducted to measure the association between PGC expression level and clinical characteristics, including gender, age, HBsAg, ALT, AFP, Cirrhosis, tumor size, tumor number, encapsulation and pathologic differentiation. Kaplan–Meier method was applied to analyze the OS and DFS. Cox proportional hazard regression was calculated to predict the OS and DFS of prognostic factors in both univariate and multivariate conditions. P<0.05 was considered to be statistically significant.
Results
PGC expression is up-regulated in HCC tissues
PGC expression was determined by IHC in 75 pairs of HCC and adjacent non-tumor tissues. The results demonstrated that PGC localizes mainly in the cytoplasm of tumor cells and exhibits various staining patterns (Figure 1A). A total of 40/75 HCC tissues (53.33%) exhibited high PGC expression, while 10/75 adjacent non-tumor tissues (13.33%) observed high PGC expression. Also, the mean expression scores of PGC expression in tumor tissues (mean ± SE, 2.63±0.14) was approximately twice as much as that in non-tumor tissues (Figure 1B; mean ± SE, 1.31±0.13; P<0.0001). When patients were divided into two groups by relapse state, mean scores in relapse group was nearly 1.5 times higher than that in the non-relapse group (Figure 1C; mean ± SE, 3.10±0.18 vs 2.03±0.17; P<0.0001).
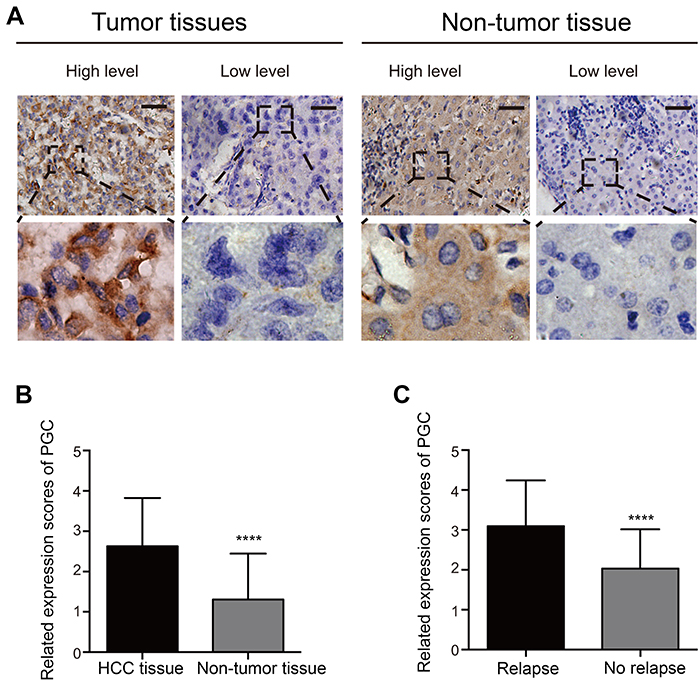 | Figure 1 Pepsinogen C (PGC) expression in HCC and adjacent non-tumor tissues. (A) Representative immunohistochemistry images of high Pepsinogen C (PGC) expression and low PGC expression in HCC and adjacent non-tumor tissues. PGC was expressed predominantly in the cytoplasm. The upper figures were 100× and the down figures were 400×. Scale bar=50 μm. (B) The staining scores of PGC expression between HCC and non-tumor tissues (****P<0.0001). (C) The staining scores of PGC expression between the relapse group and the non-relapse group (****P<0.0001). |
To establish potential clinical values of PGC, the associations between PGC expression and clinical characteristics were assessed. As shown in Table 1, high PGC expression was associated with large tumor size (≥5 cm, P=0.017) and incomplete tumor encapsulation (P<0.0001), rather than other clinical parameters.
 | Table 1 Associations between Pepsinogen C expression and clinical characteristics |
Correlation of PGC expression with OS and DFS
The prognostic role of PGC on HCC patients’ survival was compared between patients with high and low PGC expression. In the present study, the last follow-up date was set as February 29, 2012, with average follow-up interval of 42.76 months (range, 7–71 months). Firstly, 1-, 3- and 5-year OS were calculated in order to illustrate the correlation between PGC and survival in HCC. The survival rate of 1-, 3- and 5-year in high PGC group was 92.50% (37/40), 55.00% (22/40) and 10.00% (4/40), respectively; while that in low PGC expression group was 97.14% (34/35), 77.14% (27/35) and 31.43% (11/35), respectively. Secondly, Kaplan–Meier survival curve was constructed to assess the 5-year OS and DFS in both groups (Figure 2). It revealed that the OS and DFS in high PGC group are significantly lower than that in low PGC group (P=0.0004 and P<0.0001, respectively).
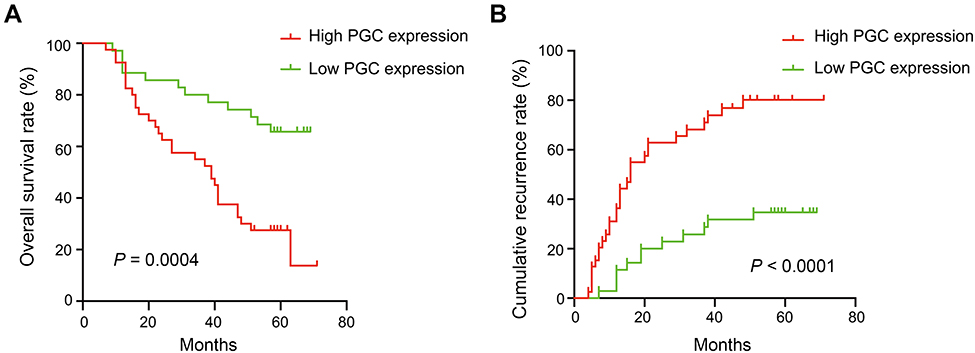 | Figure 2 Overall survival and disease-free survival times of 75 pairs of HCC and adjacent non-tumor tissues using Kaplan–Meier analysis. (A) Overall survival (OS) for Pepsinogen C (PGC) expression (P=0.0004). High PGC expression group showed poor OS than low PGC expression group. (B) Disease-free survival (DFS) for PGC expression (P<0.0001). High PGC level group showed poor DFS than low PGC expression group. |
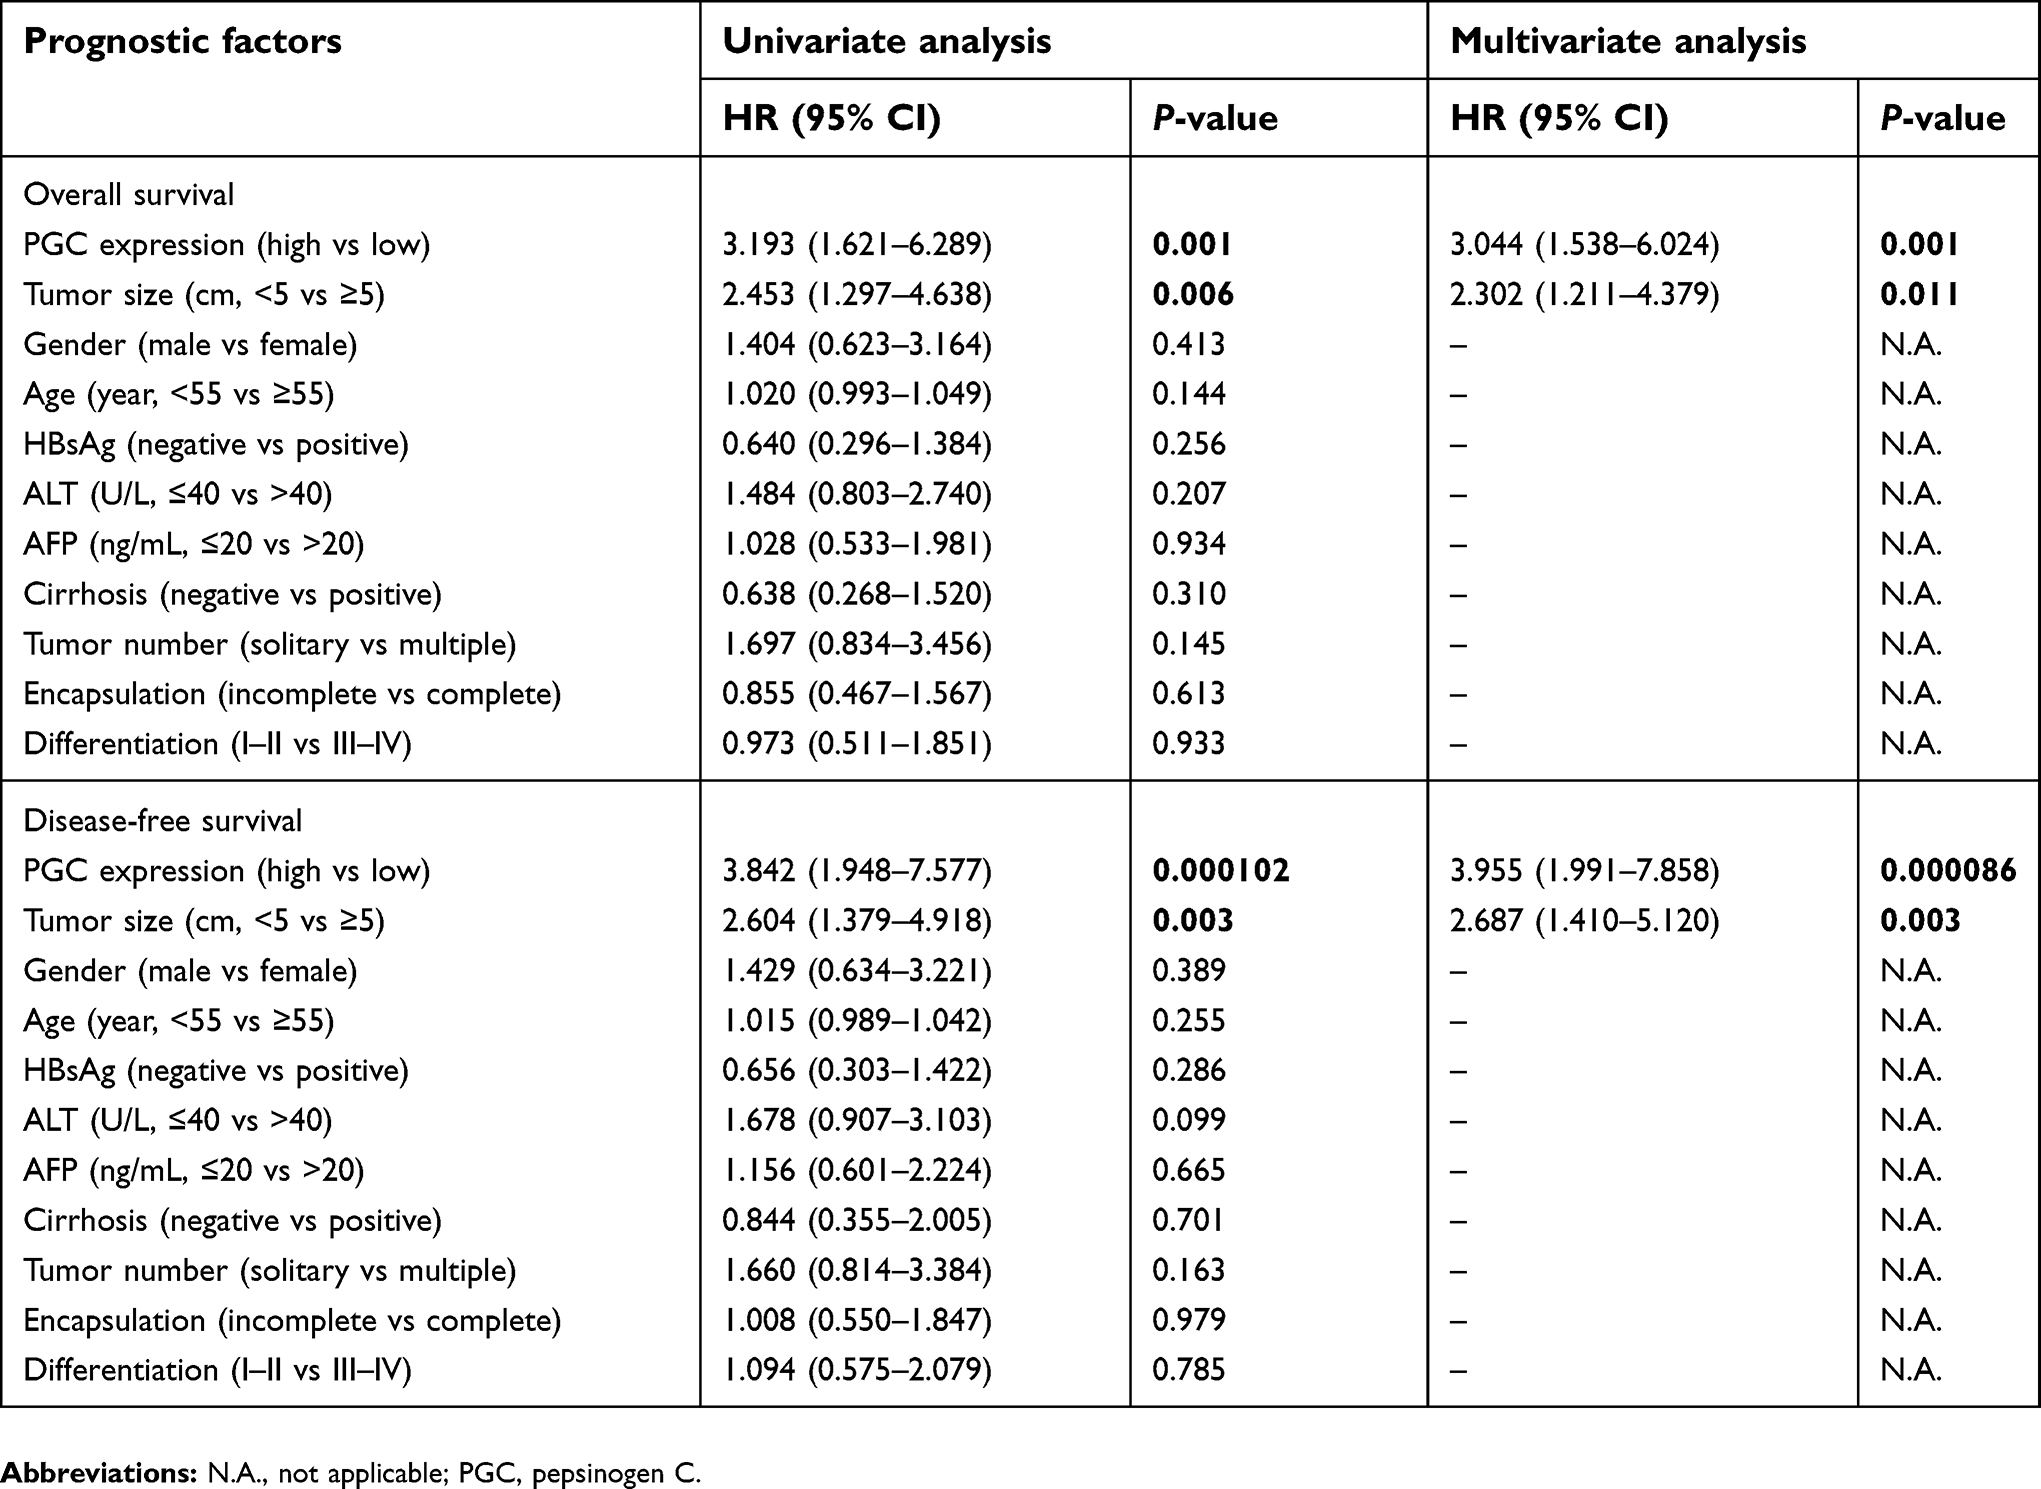
To identify potential prognostic significance in HCC patients, the Cox proportional hazard model was employed to test the prognostic factors using univariate and multivariate analysis (Table 2). The univariate analysis unraveled that PGC level (OS, HR=3.193, P=0.001; DFS, HR=3.842, P=0.000102) and tumor size (OS, HR=2.453, P=0.006; DFS, HR=2.604, P=0.003) are the crucial prognostic factors for OS and DFS. In the multivariate analysis, both PGC level (OS, HR=3.044, P=0.001; DFS, HR=3.955, P=0.000086) and tumor size (OS, HR=2.302, P=0.011; DFS, HR=2.687, P=0.003) played vital roles in the prognosis of HCC. Compared with the results of Chi-squared test (Table 1), encapsulation was shown to have no statistical differences in both univariate and multivariate analysis.
 | Table 2 Univariate and multivariate analysis of prognostic factors for overall survival and disease-free survival |
Correlations between PGC expression with prognosis in subgroup analysis
To further analyze the prognostic role of PGC, the Kaplan–Meier survival curve analysis was applied again to exam the OS and DFS in stratified analysis of subgroups. Taken together, we discovered that the survival rates of the 75 HCC patients were related with tumor size, encapsulation and gender in both high and low PGC expression groups. In the subgroup of larger tumor size (≥5 cm), HCC patients with high PGC level had markedly worse 1-, 3-, 5-year OS (88.00%, 36.00% and 4.00%, respectively) and 1-, 3-, 5-year DFS (52.00%, 12.00% and 4.00%, respectively), as compared to patients with low PGC level group (OS: 100.00%, 78.57% and 28.57%, respectively, P=0.0051; DFS: 100.00%, 71.43% and 28.57%, respectively, P=0.0001). However, for small tumor size (<5 cm) subgroup, the 1-, 3-, 5-year OS in high PGC subgroup revealed no statistical differences (100%, 86.67% and 20.00%, respectively) as compared with that in low PGC level subgroup (95.24%, 80.95% and 28.57%, respectively; P=0.0842). Also, the corresponding DFS was 86.67%, 53.33% and 6.67% in high PGC group and 95.24%, 80.95% and 23.81% in low PGC group (P=0.0660), respectively (Figure 3A and B).
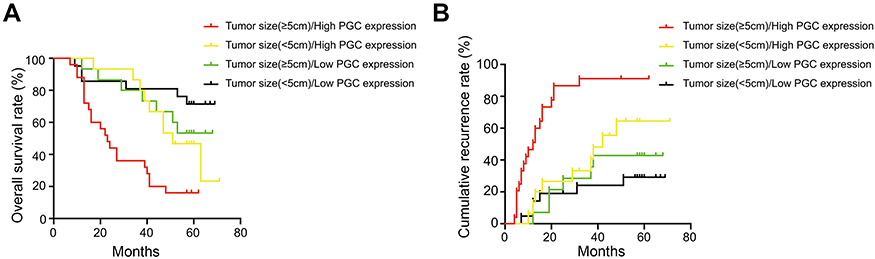 | Figure 3 Kaplan–Meier survival curves according to PGC expression in 75 pairs of HCC and adjacent non-tumor tissues stratified by different tumor size. (A) Overall survival (OS) for PGC expression in patients with large tumor size (≥5 cm) or small tumor size (<5 cm). High PGC expression group showed poor OS than low PGC expression group for large tumor size subgroup (red vs green, P=0.0051); while no significant difference was observed in OS between high PGC expression and low PGC expression group for small tumor size subgroup (yellow vs black, P=0.0842). (B) Disease-free survival (DFS) for PGC expression in patients with large tumor size (≥5 cm) or small tumor size (<5 cm). High PGC level group showed poor DFS than low PGC expression group for large tumor size subgroup (red vs green, P=0.0001); while no significant differences were observed in DFS between high PGC level and low-level group for small tumor size subgroup (yellow vs black, P=0.0660). |
In addition, it has been reported that PGC expression is associated with the level of androgen in cancers.18–20 Therefore, the role of gender was also investigated to figure out whether PGC account for high incidence of HCC in male subjects. However, our findings revealed that there were statistical differences for OS and DFS in both male and female subgroups (Figure S1).
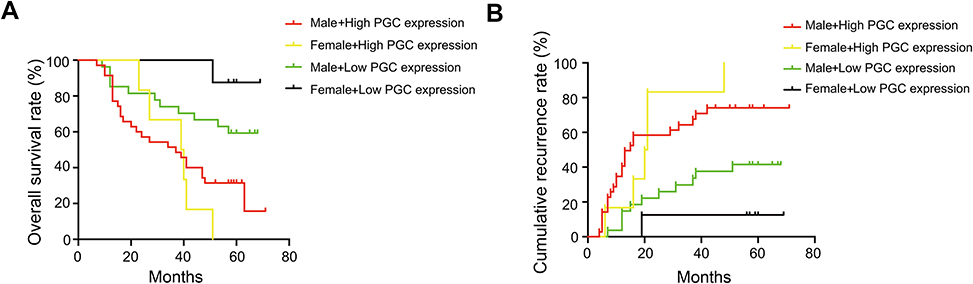 | Figure S1 The subgroup analysis of gender and PGC expression level (OS and DFS) using Kaplan–Meier test. (A) The overall survival rate: for the male subgroup, the high PGC level group showed poor OS than the low-level group (red vs green, P=0.0153); meanwhile, for the female subgroup, the similar statistically significant differences were observed in high and low PGC level (yellow vs black, P=0.0002). (B) The disease-free survival rate: for the male subgroup, the high PGC level group showed poor DFS than the low-level group (red vs green, P=0.0031); likewise, for the female subgroup, the similar statistically significant differences were observed in high and low PGC level (yellow vs black, P=0.0016). Red line: male + high PGC level, n=35; green line: male + low PGC, n=27; yellow line: female <5 cm + high PGC, n=0; black line: female, n=3. |
Discussion
HCC represents one of the deadliest malignancies. Despite it has been improved with recent advances in the early diagnosis and treatment, the prognosis of HCC remains dismal.1 Prognostic biomarkers are useful for clinicians to predict disease progression and to select appropriate therapy. PGC has been reported to be associated with various tumors, such as gastric cancer, breast cancer and prostate cancer. Particularly, Miyasaka et al. found that the mRNA and protein levels of PGC are overexpressed in HCC compared with adjacent non-tumor tissues in a small group of 10 patients.16 However, no further investigations were performed to identify underlying roles of PGC in HCC. In the present study, we conducted a TMA containing a larger group of 75 pairs of HCC specimens to detect PGC expression and to analyze the correlation between PGC expression and clinical characteristics. The TMA image findings suggested that the protein level of PGC was significantly increased in HCC, consistent with previous study.16 Meanwhile, high PGC level is associated with larger tumor size and incomplete encapsulation, and predicted poor OS and DFS after surgery. However, no statistical associations were observed between its expression with other clinical parameters (including age, HBsAg, ALT, AFP, cirrhosis, tumor number and pathologic differentiation).
Although PGC has been defined as an important stomach proenzyme, its expression spectrum was actually varied in breast, prostate, pancreas and liver. The increased PGC expression was reported to be correlated with prostate cancer and HCC.16,21 However, changes in PGC may have gender-specific connotations. For instance, elevated expression of PGC was a good prognostic indicator for female patients with ovary carcinoma whose CA125 value is under 35 U/mL.22 Diez-ltza et al. also observed that PGC is increased in well-differentiated breast cancer instead of poor-differentiated breast cancer.23 A subsequent animal study confirmed that up-regulation of PGC could be induced by androgen, glucocorticoids and progesterone in T-47D breast cancer cell line, implying a possible role of PGC in male-predominant HCC.18 In the present study, although no significant differences were observed between PGC expression and gender, further studies with enlarged samples should be performed to confirm gender disparity of PGC expression. Therefore, we believe more research on the correlation between PGC and hormone levels, such as androgen, needs to be conducted in a larger population. Furthermore, because our study only looked at Chinese patients, these findings may not translate to patients of other ethnicities. Also, molecular mechanism of PGC in HCC remains unrevealed in the present study, which needs to be explored in the future studies.
Conclusion
In summary, our study evaluated the prognostic significance of PGC expression in 75 pairs of HCC specimens at protein level by IHC. The most valuable finding of this study is that the OS of our study cohort was significantly poorer in high PGC expression group than in low PGC expression group. It indicates that PGC expression is an independent predictor for HCC patients. Therefore, its clinical value lies in that closer monitoring and more aggressive treatment should be sought for HCC patients whose tumor size exceeds 5 cm or whose PGC protein is overexpressed. Our findings also emphasize the need to conduct large studies to evaluate the potential hormonal regulation of PGC in HCC. PGC detection, in our opinion, has a high chance of becoming a useful tool in the management of patients with HCC.
Acknowledgments
This work was supported by National Nature Science Foundation of China (grant numbers 1301820, 81402273, 81472673, 81672720, and 81672334); and Shanghai Science and Technology Commission of China (grant numbers 16ZR1406100).
Disclosure
The authors report no conflicts of interest in this work.
References
1. Forner A, Reig M, Bruix J. Hepatocellular carcinoma. Lancet. 2018;391:1301–1314. doi:10.1016/S0140-6736(18)30010-2
2. El-Serag HB. Epidemiology of viral hepatitis and hepatocellular carcinoma. Gastroenterology. 2012;142(6):1264–1273.e1. doi:10.1053/j.gastro.2011.12.061
3. Morgan TR, Mandayam S, Jamal MM. Alcohol and hepatocellular carcinoma. Gastroenterology. 2004;127(5 Suppl 1):S87–S96.
4. Kanwal F, Kramer JR, Duan Z, Yu X, White D, El-Serag HB. Trends in the burden of nonalcoholic fatty liver disease in a United States cohort of veterans. Clin Gastroenterol Hepatol. 2016;14(2):
5. Maluccio M, Covey A. Recent progress in understanding, diagnosing, and treating hepatocellular carcinoma. CA Cancer J Clin. 2012;62(6):394–399. doi:10.3322/caac.21161
6. Gluer AM, Cocco N, Laurence JM, et al. Systematic review of actual 10-year survival following resection for hepatocellular carcinoma. HPB. 2012;14(5):285–290. doi:10.1111/j.1477-2574.2012.00446.x
7. Jiang XM, Yu XN, Huang RZ, et al. Prognostic significance of eukaryotic initiation factor 4E in hepatocellular carcinoma. J Cancer Res Clin Oncol. 2016;142(11):2309–2317. doi:10.1007/s00432-016-2232-2
8. Islam MR, Kim NS, Jung JW, Kim HB, Han SC, Yang MS. Spontaneous pepsin C-catalyzed activation of human pepsinogen C in transgenic rice cell suspension culture: production and characterization of human pepsin C. Enzyme Microb Technol. 2018;108:66–73. doi:10.1016/j.enzmictec.2017.09.006
9. Szecsi PB, Halgreen H, Poulsen SS, et al. Demonstration of pepsinogen C in human pancreatic islets. Gut. 1987;28(10):1208–1214.
10. Diaz M, Rodriguez JC, Sanchez J, et al. Clinical significance of pepsinogen C tumor expression in patients with stage D2 prostate carcinoma. Int J Biol Markers. 2002;17(2):125–129.
11. Foster C, Aktar A, Kopf D, Zhang P, Guttentag S. Pepsinogen C: a type 2 cell-specific protease. Am J Physiol Lung Cell Mol Physiol. 2004;286(2):L382–L387. doi:10.1152/ajplung.00310.2003
12. Kageyama T. Pepsinogens, progastricsins, and prochymosins: structure, function, evolution, and development. Cell Mol Life Sci. 2002;59(2):288–306.
13. Antunes AA, Leite KR, Sousa-Canavez JM, Camara-Lopes LH, Srougi M. The role of prostate specific membrane antigen and pepsinogen C tissue expression as an adjunctive method to prostate cancer diagnosis. J Urol. 2009;181(2):594–600. doi:10.1016/j.juro.2008.10.007
14. Vizoso F, Sanchez LM, Diez-Itza I, Merino AM, Lopez-Otin C. Pepsinogen C is a new prognostic marker in primary breast cancer. J Clin Oncol. 1995;13(1):54–61. doi:10.1200/JCO.1995.13.1.54
15. Kon OL, Yip TT, Ho MF, et al. The distinctive gastric fluid proteome in gastric cancer reveals a multi-biomarker diagnostic profile. BMC Med Genomics. 2008;1:54. doi:10.1186/1755-8794-1-54
16. Miyasaka Y, Enomoto N, Nagayama K, et al. Analysis of differentially expressed genes in human hepatocellular carcinoma using suppression subtractive hybridization. Br J Cancer. 2001;85(2):228–234. doi:10.1054/bjoc.2001.1901
17. Zhang C, Liu LX, Dong ZR, et al. Up-regulation of 14-3-3zeta expression in intrahepatic cholangiocarcinoma and its clinical implications. Tumor Biol. 2015;36(3):1781–1789. doi:10.1007/s13277-014-2780-5
18. Balbin M, Lopez-Otin C. Hormonal regulation of the human pepsinogen C gene in breast cancer cells. Identification of a cis-acting element mediating its induction by androgens, glucocorticoids, and progesterone. J Biol Chem. 1996;271(25):15175–15181.
19. Konishi N, Nakaoka S, Matsumoto K, et al. Expression of pepsinogen II with androgen and estrogen receptors in human prostate carcinoma. Pathol Int. 1999;49(3):203–207.
20. Gonzalez LO, Corte MD, Junquera S, Bongera M, Rodriguez JC, Vizoso FJ. Expression of androgen receptor and two androgen-induced proteins (apolipoprotein D and pepsinogen C) in ductal carcinoma in situ of the breast. Histopathology. 2007;50(7):866–874. doi:10.1111/j.1365-2559.2007.02687.x
21. Antunes AA, Reis ST, Leite KR, et al. PGC and PSMA in prostate cancer diagnosis: tissue analysis from biopsy samples. Int Braz J Urol. 2013;39(5):649–656. doi:10.1590/S1677-5538.IBJU.2013.05.06
22. Rojo JV, Merino AM, Gonzalez LO, Vizoso F. Expression and clinical significance of pepsinogen C in epithelial ovarian carcinomas. Eur J Obstet Gynecol Reprod Biol. 2002;104(1):58–63.
23. Diez-Itza I, Merino AM, Tolivia J, Vizoso F, Sanchez LM, Lopez-Otin C. Expression of pepsinogen C in human breast tumours and correlation with clinicopathologic parameters. Br J Cancer. 1993;68(3):637–640.
Supplementary material
 © 2019 The Author(s). This work is published and licensed by Dove Medical Press Limited. The full terms of this license are available at https://www.dovepress.com/terms.php and incorporate the Creative Commons Attribution - Non Commercial (unported, v3.0) License.
By accessing the work you hereby accept the Terms. Non-commercial uses of the work are permitted without any further permission from Dove Medical Press Limited, provided the work is properly attributed. For permission for commercial use of this work, please see paragraphs 4.2 and 5 of our Terms.
© 2019 The Author(s). This work is published and licensed by Dove Medical Press Limited. The full terms of this license are available at https://www.dovepress.com/terms.php and incorporate the Creative Commons Attribution - Non Commercial (unported, v3.0) License.
By accessing the work you hereby accept the Terms. Non-commercial uses of the work are permitted without any further permission from Dove Medical Press Limited, provided the work is properly attributed. For permission for commercial use of this work, please see paragraphs 4.2 and 5 of our Terms.