")
Back to Journals » ClinicoEconomics and Outcomes Research » Volume 11
Overall survival of glasdegib in combination with low-dose cytarabine, azacitidine, and decitabine among adult patients with previously untreated AML: comparative effectiveness using simulated treatment comparisons
Authors Tremblay G, Westley T, Cappelleri JC , Arondekar B, Chan G , Bell TJ, Briggs A
Received 30 January 2019
Accepted for publication 25 July 2019
Published 6 September 2019 Volume 2019:11 Pages 551—565
DOI https://doi.org/10.2147/CEOR.S203482
Checked for plagiarism Yes
Review by Single anonymous peer review
Peer reviewer comments 2
Editor who approved publication: Professor Giorgio Colombo
Gabriel Tremblay1, Tracy Westley1, Joseph C Cappelleri2, Bhakti Arondekar2, Geoffrey Chan2, Timothy J Bell2, Andrew Briggs3
1Purple Squirrel Economics, New York, NY, USA; 2Pfizer Inc, New York, NY, USA; 3William R Lindsay Chair of Health Economics, Health Economics and Technology Assessment, Institute of Health & Wellbeing, University of Glasgow, Glasgow, UK
Correspondence: Gabriel Tremblay
Purple Squirrel Economics, 4 Lexington Avenue, Suite 15K, New York, NY 10010, USA
Tel +1 646 478 8213
Email [email protected]
Background: Until recently, treatments for older patients with AML ineligible to receive intensive chemotherapies were limited to hypomethylating agents, low-dose cytarabine (LDAC), or clinical trials. In 2018, the FDA approved combination glasdegib (GLAS) plus LDAC based on Phase II results demonstrating improved overall survival (OS) versus LDAC alone in previously untreated AML. However, no randomized clinical trials have directly compared GLAS + LDAC with other AML treatments.
Objective: Using both indirect treatment comparison (ITC) and simulated treatment comparison (STC), which adjusts for baseline differences between trials, the comparative effectiveness of GLAS + LDAC was compared with hypomethylating agent azacitidine (AZA) or decitabine (DEC).
Methods: A systematic literature review identified published trials of AZA or DEC versus LDAC among older AML patients ineligible for high-intensity chemotherapy. In addition to standard and covariate-adjusted ITC, STC was performed following guidance from the NICE Decision Support Unit (DSU). Using individual patient data from the Phase II GLAS + LDAC study, population-specific OS hazard ratios (HR) for GLAS + LDAC versus AZA or DEC were compared. Furthermore, covariate-adjusted ITC (Cox multivariate models) and STC were repeated using GLAS + LDAC versus LDAC data propensity-weighted for within-trial mean cytogenetic risk. As this initial step was not specified in the DSU, results from this second method were compared to the first STC following DSU guidance only.
Results: Standard ITC and STC both demonstrated significantly improved OS for GLAS + LDAC versus either AZA or DEC. Adjusting for key covariates, STC stepwise exponential models demonstrated GLAS + LDAC superiority to both AZA (HR=0.424; 95% CI: 0.228, 0.789) and DEC (HR=0.505; 95% CI: 0.269, 0.949). These significant results held using full or step-wise approaches, following DSU guidance only or the weighted STC approach.
Conclusion: Using ITC and STC, GLAS + LDAC demonstrated superior OS to AZA or DEC in an adult population with previously untreated AML for whom intensive chemotherapy is not an option.
Keywords: acute myeloid leukemia, simulated treatment comparison, indirect treatment comparison, glasdegib, comparative effectiveness
Introduction
Acute myeloid leukemia (AML) is characterized by the production of high levels of immature myeloid cells in the bone marrow. Older AML patients face a much lower 5-year survival rate than their younger counterparts (8% for those aged 60–65 years vs 38% for those under 45 years) (2) and, despite increased survival rates since the 1990s for those younger than 55, survival among elderly patients has not improved.1 The differences in survival rates have been attributed to unfavorable prognostic factors associated with older age, less aggressive therapeutic options,2 and a lack of clinical trial participation, as elderly patients with poor performance status or comorbid conditions are often not well enough to receive intensive chemotherapy.3,4
Although there are limited options for treating older AML patients ineligible to receive intensive chemotherapy (NIC), lower intensity chemotherapies such as low-dose cytarabine (LDAC) or hypomethylating agents such as azacitidine (AZA) and decitabine (DEC) may be administered.3 Phase III clinical trial results have tentatively supported the use of AZA or DEC over LDAC in NIC patient populations, although primary endpoint analyses failed to find significant differences in overall survival (OS) between AZA and LDAC 20 mg twice per day (BID) or DEC and a control arm that included LDAC (20 mg/m2 daily).5,6 Recently, the FDA approved combination glasdegib and LDAC 20 mg BID (GLAS + LDAC) for NIC AML patients.7 Supportive evidence was based on Phase II trial results (BRIGHT AML 1003) in which GLAS + LDAC showed a clinically meaningful and statistically significant improvement in OS relative to LDAC alone.8,9
For treatments that have not been directly compared in head-to-head clinical trials, such as between GLAS + LDAC, AZA, and DEC, indirect treatment comparison (ITC) is a robust method used to estimate relative efficacy including OS hazard ratios (HR). Standard (Bucher) ITC accounts for within-trial differences in efficacy between active treatment and control prior to comparing active treatment efficacy across trials.10 However, standard ITC methods in and of themselves do not adjust for between-trial differences in patient baseline characteristics. Consequently, the resultant unadjusted relative treatment effects can generate biased results if there is large variation in patient populations and trial designs that modify or affect the treatment effect.11
While standard ITC approaches compare published aggregate trial data, a recently popularized method, simulated treatment comparison (STC), adjusts for covariates within the available individual patient data (IPD).11,12 First, different models using the IPD are explored to best estimate within-trial treatment effects. Second, population differences relative to comparator trials are accounted for through covariate adjustment. In this study, IPD were extracted from the GLAS + LDAC versus LDAC trial for adult patients with previously untreated AML. Two different STCs, first of GLAS + LDAC versus AZA and then GLAS + LDAC versus DEC, were performed to provide population-specific estimates of OS. As a last step in STC, a final (standard) ITC was performed to finalize the comparative effectiveness between trials.
Materials and methods
Overview of final study selection and simulated treatment comparison
The initial ITCs of unadjusted GLAS + LDAC versus published AZA or DEC results were conducted. ITCs and STCs were performed following general guidance published by the Decision Support Unit (DSU) of the National Institute for Health and Care Excellence.11 Published trials of DEC or AZA with comparable AML high-risk patient populations to the GLAS + LDAC study were identified through a systematic literature review (SLR). Details of the SLR are provided in the Appendix, Table S1 and Figure S1.
Final study inclusion in the ITC and STC was limited to trials with sufficient reporting on patient and trial characteristics to determine comparable patient eligibility and AML disease characteristics across studies, and to inform of potential prognostic factors and effect modifiers (Table S2). While standard ITC does not adjust for population differences across trials, the results generated with this robust method were also presented for comparison. Justification for STC, as discussed by the DSU (Figure S2), requires the presence of within-trial effect modification and different distributions of effect modifiers across studies.11 In this context, effect modifiers are defined as covariates that modify the effect of treatment, so that estimates of treatment efficacy vary across strata of the effect modifier. Additionally, the DSU encourages adjustment for additional effect modifiers and prognostic factors (affecting survival outcomes directly) to produce more precise estimates of relative treatment effects. These effect modifiers and prognostic variables can be identified in the IPD, relevant disease literature, and by clinician expertise.
In addition to BRIGHT AML 1003 reporting on GLAS + LDAC versus LDAC results from the available IPD, two studies met the final selection criteria: Dombret et al (2015) comparing AZA to LDAC, and Kantarjian et al (2012) comparing DEC to LDAC.5,6 The baseline characteristics of each study’s participants are summarized in Table 1. To limit heterogeneity and to make appropriate population comparisons, subgroups from each of the three studies were extracted. As Cortes et al (2016) pooled both AML (n=116) and myelodysplastic syndrome patients (MDS) (n=16) when reporting baseline characteristics and outcomes, the available IPD were restricted to AML patients only.
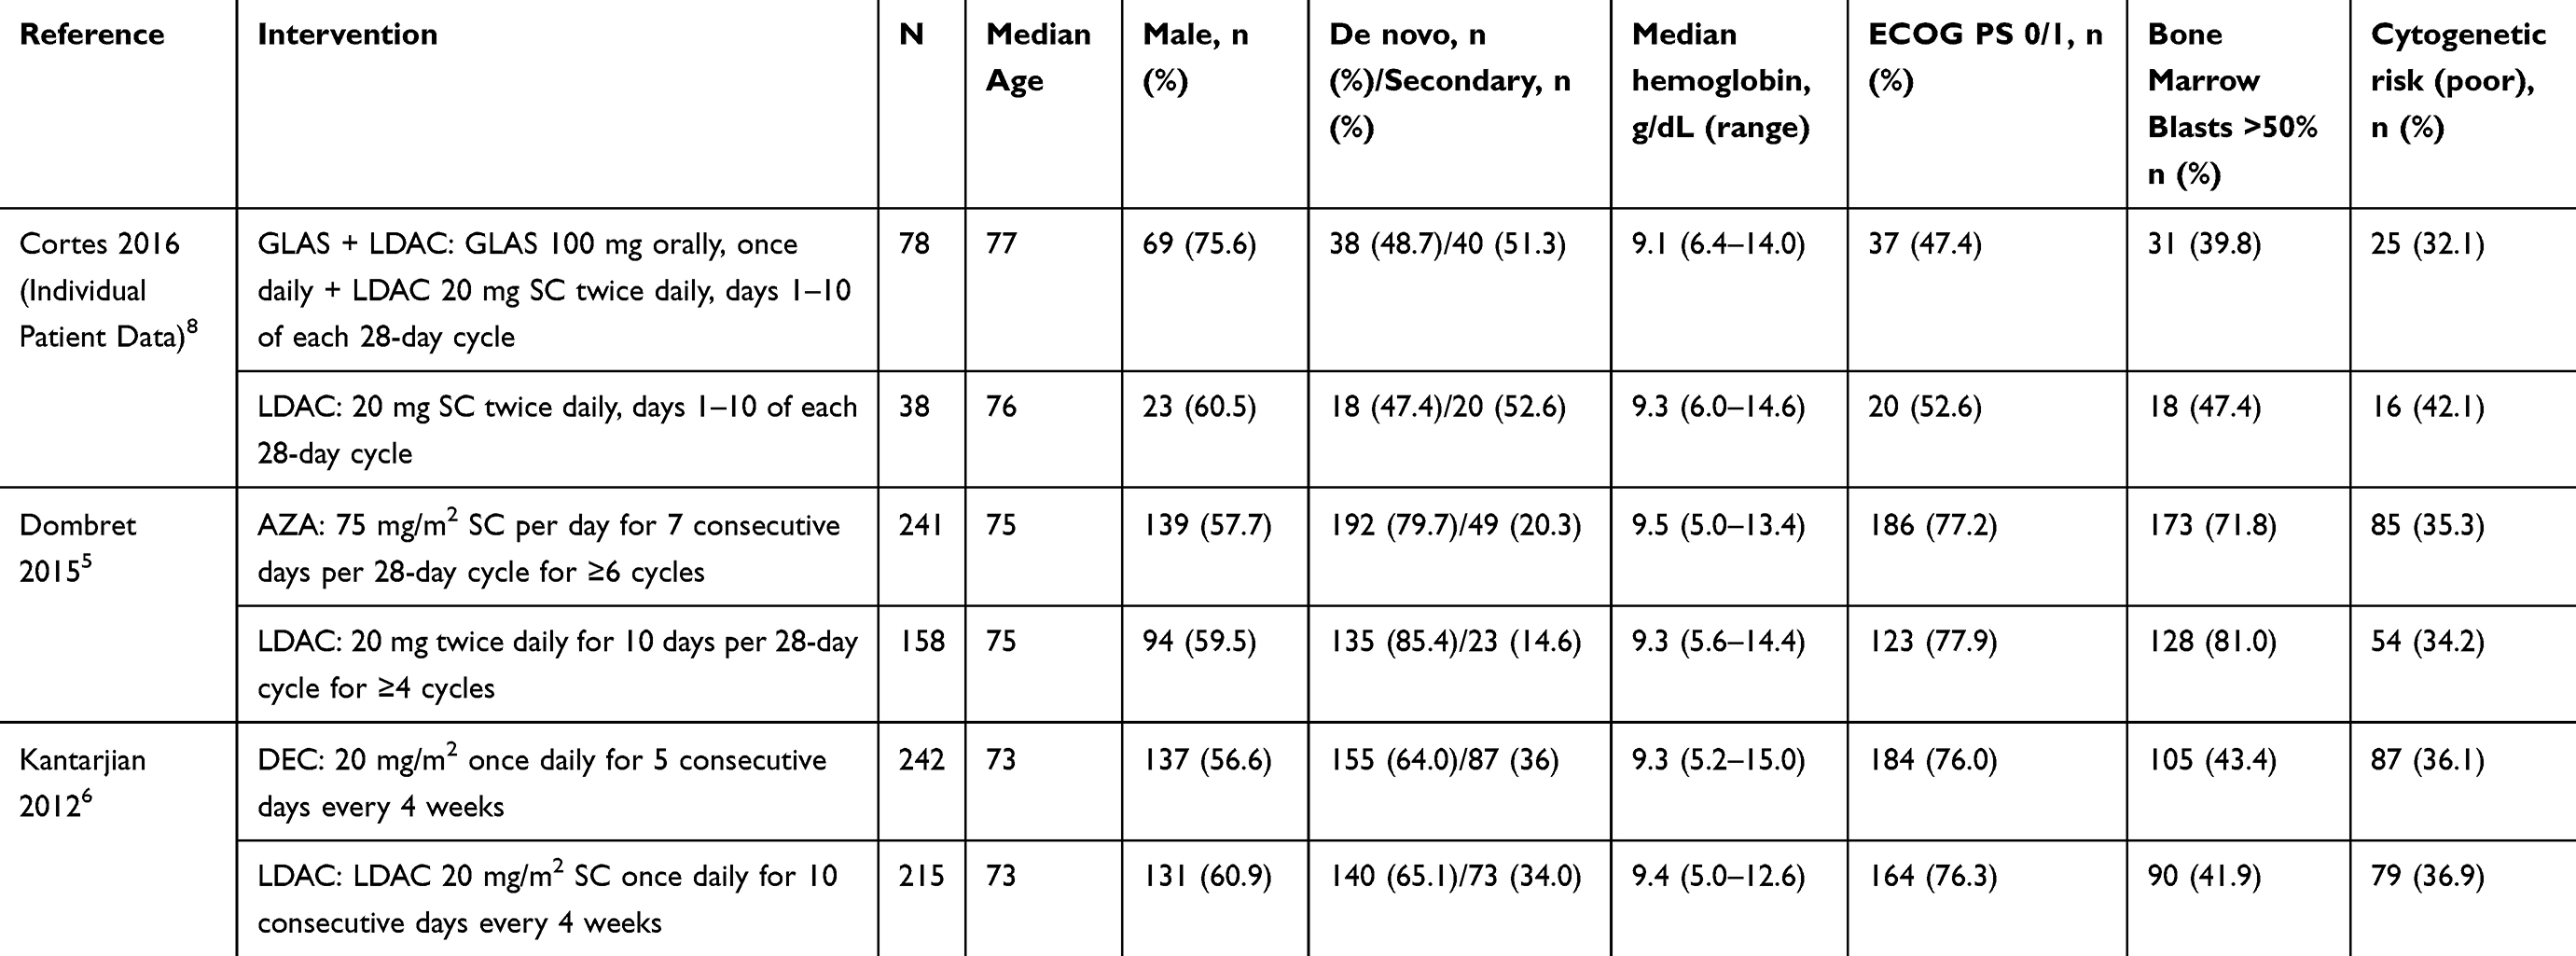 |
Table 1 Baseline characteristics of selected studies |
Even though Kantarjian et al (2012) reported baseline characteristics for multiple comparator arms, only DEC (n=242) and LDAC alone (n=215) covariate values were extracted. However, the published OS HR comparing DEC to LDAC pooled the 28 patients from the supportive care arm with the LDAC arm. In the Dombret et al (2015) study, investigators determined the most appropriate AZA comparator between best supportive care (BSC), LDAC or intensive chemotherapy (IC) prior to randomization. Patients were then randomly assigned to receive AZA or the investigator’s predetermined choice of treatment. While the reported AZA population (n=241) baseline characteristics included patients suitable for BSC, LDAC or IC, the published OS HR extracted for ITC and STC compared the subgroup of AZA patients pre-selected for LDAC suitability (n=158) against the LDAC arm (n=154). With the selected studies, a network of randomized controlled trials (RCTs) was established that applied the LDAC treatment arm as the common comparator (Figure 1).
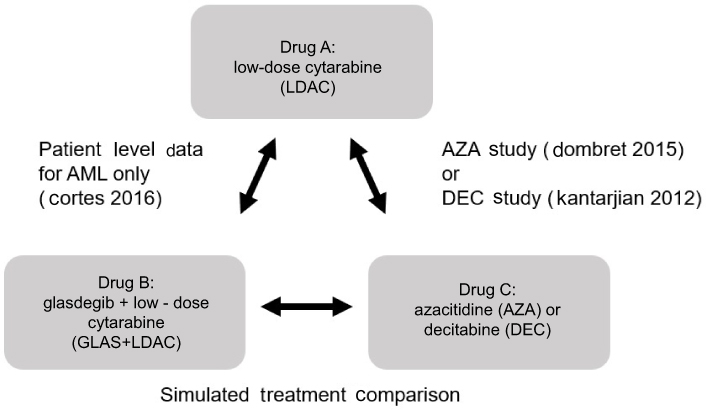 |
Figure 1 Comparison network. Notes: In the above comparison network, LDAC alone is the common comparator between trials. In the GLAS + LDAC versus LDAC (Cortes 2016) trial and AZA versus LDAC (Dombret 2015) trial, LDAC was administered as 20 mg twice per day . In the DEC vs LDAC (Kantarjian 2012) trial, LDAC was administered as 20 mg/m2 once daily . Either dose schedule is considered to have comparable drug concentration over time (area under the curve) which includes any associated cytotoxic effects.13Abbreviation: AML, acute myeloid leukemia. |
Overview of STC approach
Based on the general guidance provided by the DSU for conducting STC as a starting point, further specific multi-stepped criteria were developed using the GLAS + LDAC STCs as a case study. The criteria were guided by the publication Tremblay et al (2015), and are summarized in Figure 2.14 First, exploration of parametric models (including proportional and non-proportional hazards models) was conducted to determine the optimal modelling of efficacy for GLAS + LDAC versus LDAC. Variable selection to develop the optimal models explored mutually available covariates first between the GLAS + LDAC IPD and the AZA trial, and second between the same GLAS + LDAC IPD and the DEC trial. After including key covariates as described in criterion 1 (Figure 2), the resultant fit statistics (criterion 2), graphs of the survival curves (criterion 3) and survival estimates (criterion 4) for GLAS + LDAC versus LDAC were compared between models for comparability and predictive ability using the unadjusted Cox regression and Kaplan-Meier (KM) estimates as references. These unadjusted analyses replicated intent-to-treat protocol estimates.
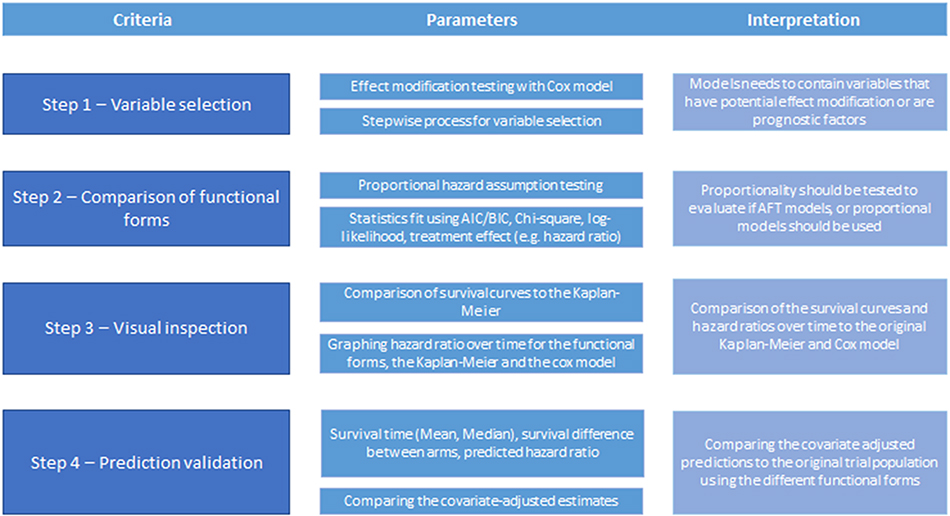 |
Figure 2 Multi-stepped criteria to conduct and evaluate simulated treatment comparisons. Abbreviations: AFT, accelerated failure time; AIC, Akaike’s information criterion; BIC, Bayesian information criterion. |
Once an optimal model was selected from the GLAS + LDAC trial with IPD, the published mean (aggregate) covariate values from each of the comparator study populations were substituted into that model. Covariate adjustment of the optimal models allowed estimation of efficacy between GLAS + LDAC versus LDAC in each of the comparator (AZA or DEC) populations. Visual inspection (criterion 3) and prediction validation (criterion 4) were repeated for the covariate-adjusted results. New, adjusted OS HRs estimating GLAS + LDAC versus LDAC were obtained for each of the comparator populations AZA and DEC. These OS HRs with simulated AZA or DEC populations were compared against adjusted Cox models, which included the same set of covariates. As a last step in STC, the new, covariate-adjusted HRs for OS were entered into ITC against the published HRs for AZA versus LDAC, and DEC versus LDAC. These final ITCs separately estimated indirect OS HRs for GLAS + LDAC versus AZA and GLAS + LDAC versus DEC. All standard ITCs utilized the Bucher (1997) method with 95% CIs.10
All analyses were performed using Microsoft Excel 2016 and Stata (version 15.1; StataCorp LLC, College Station, TX, USA).
Variable selection (criterion 1)
Based on DSU guidance, the decision to retain a variable for covariate adjustment was based on the variable meeting four criteria: 1) availability in studies being compared, 2) imbalance in distribution across trials, 3) demonstration of potential effect modification, and 4) impact on results estimating GLAS + LDAC versus LDAC OS HR. STC full covariate adjustments created more similar populations between trials. Additionally, to increase model precision as per DSU guidance, exploration was repeated with reduced models, including variables that met at least one “stepwise” criterion: the presence of a statistically significant covariate from both the full and reduced models, identification as an effect modifier in at least one of the trials, or being retained as a stratification factor (eg, cytogenetic risk factor) from the original three trials. Of note, the set of stepwise variables could be different for GLAS + LDAC versus AZA and GLAS + LDAC versus DEC comparisons, based on each trial’s design and reporting of results.
Model exploration and comparison of functional forms (criterion 2)
In order to first determine the optimal regression model to estimate treatment effects of GLAS + LDAC versus LDAC, both full models and reduced (stepwise) models were explored, following recommendations by Tremblay et al (2015).14 Exploration used Cox regression estimation to compare with parametric modelling of proportional hazards (PHs; exponential, Weibull, Gompertz) and non-proportional, accelerated failure time (AFT) models (loglogistic, lognormal, gamma). Appropriate use of Cox regression modelling was tested by visual assessment of the log-cumulative hazard plots, as well as the Schoenfeld global test of proportionality.15,16,17 Unadjusted Cox regression models only included the treatment covariate. Model fit statistics, including Akaike’s information criterion (AIC), Bayesian information criterion (BIC), the log-likelihood, and chi-square, were compared between all models, to inform of optimal stepwise and full adjustments. To obtain HRs at the median OS (duration) for the AFT models, the hazard rates within each trial arm were constructed from the difference in the natural log of the survival between each month. These hazard rates were then summed and divided between trial arms to obtain the HR for each month. Exploration of the six models (PH: exponential, Weibull, Gompertz; AFT: loglogistic, lognormal, gamma) was performed for each of the two STCs.
Visual inspection and prediction validation (criteria 3 and 4)
In order to assess the comparability of each model’s predictive ability, continuous survival outcomes were estimated with each of the six models, which were compared with original KM estimates for GLAS + LDAC versus LDAC. Post-regression predictions in Stata were performed to estimate average survival (proportion alive), median OS (months) and extended mean OS (months) for both GLAS + LDAC and LDAC alone. Additionally, OS HRs derived from Cox unadjusted and fully adjusted multivariate models were compared against OS HRs estimated from the three PH and three AFT models. Survival curves graphed separately for GLAS + LDAC and LDAC arms were visually compared with the original trial’s (unadjusted) KM curves. To further evaluate visual evidence for selecting the optimal model, each model’s HR, including the proportional models producing static HRs, was plotted over 20 months (maximum duration of survival in the LDAC treatment group). While an exact match of adjusted and unadjusted estimates was not expected, reasonably similar results were desired.
Covariate adjustment
Once an optimal model was selected (eg, from the mutual set of covariates between the GLAS + LDAC and AZA trials), the mean covariate values of the AZA treatment arm were entered into the optimal model to simulate the GLAS + LDAC versus LDAC comparison being performed among the AZA patients. New predictions including covariate-adjusted survival curves (criterion 3), survival times (criterion 4) and OS HR (criterion 4) were generated and compared with the original IPD population estimates. The same covariate adjustment was performed substituting the DEC population to simulate the GLAS + LDAC versus LDAC comparison among DEC patients.
Indirect treatment comparisons
ITCs were separately conducted for GLAS + LDAC versus AZA and GLAS + LDAC versus DEC. First, standard (Bucher) ITC compared unadjusted OS HRs from original publications. The second ITC approach applied Cox multivariate regression of GLAS + LDAC versus LDAC IPD against AZA or DEC published OS HRs. Finally, as the last step in STC, the STC-derived estimates of GLAS + LDAC versus LDAC efficacy entered final ITC against AZA or DEC. Optimal models from the STC model exploration were selected into the final ITC, which included full and stepwise adjustments.
Results
Glasdegib + LDAC versus azacitidine: estimating indirect overall survival hazard ratios
All full covariate models applied in GLAS + LDAC versus AZA comparisons included all of the baseline characteristics mutually available between studies: age, sex, AML type, proportion of bone marrow blasts <50%, Eastern Cooperative Oncology performance status (ECOG PS), cytogenetic risk, and hemoglobin level. Decisions for variable selection for the stepwise model are summarized in Table 2, based on the criteria described above. All stepwise models included age, sex, and poor cytogenetic risk.
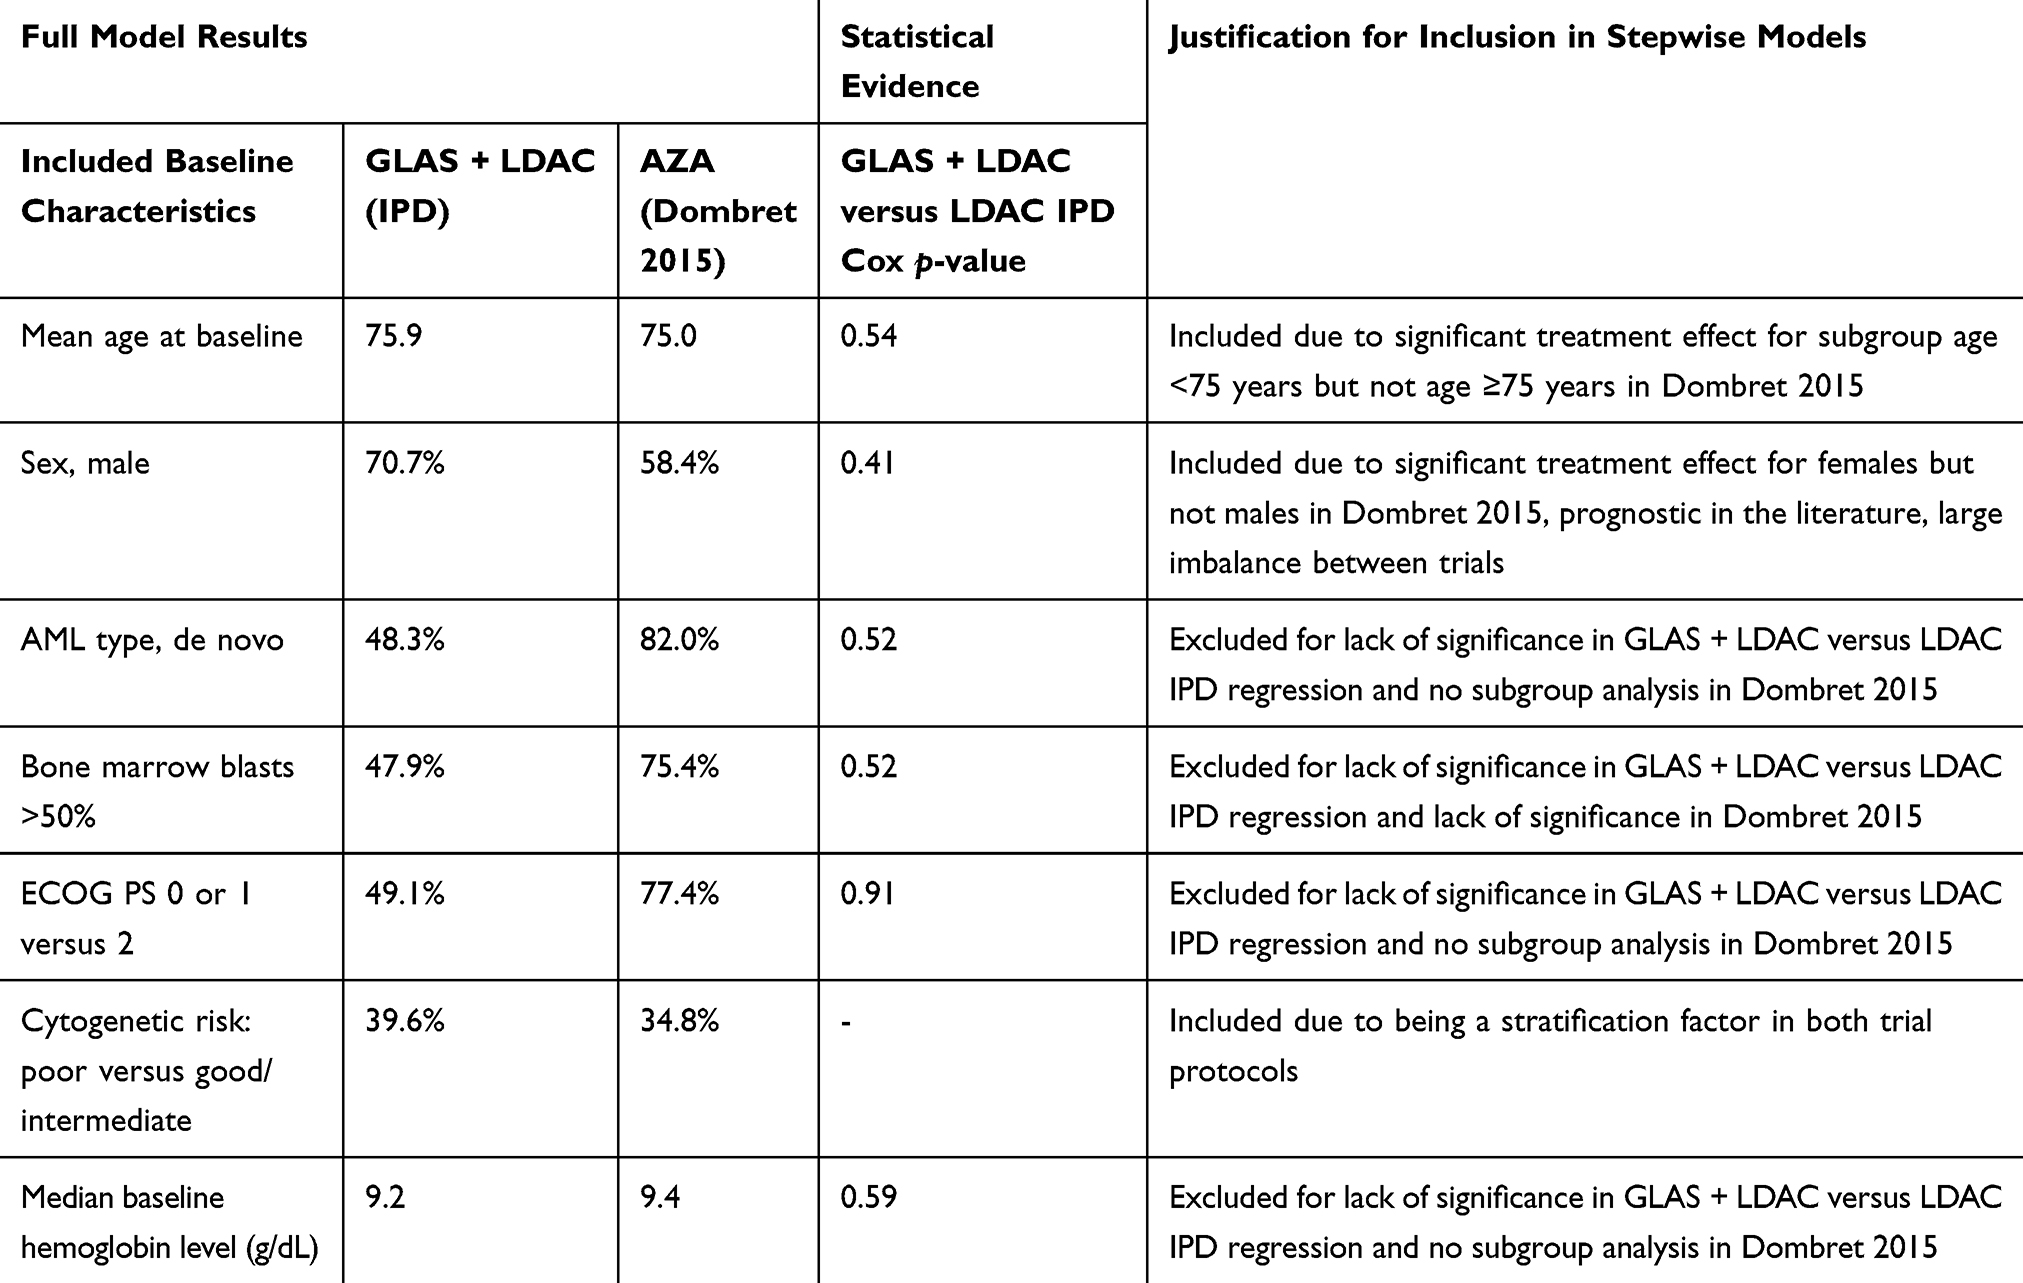 |
Table 2 Variable selection: GLAS + LDAC vs AZA |
Comparison of functional forms and model fit statistics
Visual assessment of the hazard plots and the Schoenfeld test of proportionality for the full (p=0.27) and stepwise (p=0.97) Cox models indicated no statistically significant deviation from the PH assumption. Fit statistics AIC and BIC were similar between full (615/637) and stepwise (617/628) Cox models, with the next best fit statistics resulting from the stepwise exponential model (343/359). For all full and stepwise model parametrizations, the Chi-square tests for the log likelihood demonstrated significance for at least one of the included variables in the OS HR regression, and the exponential and Weibull stepwise models had the smallest associated p-values (p=0.0002 and p=0.0001, respectively).
Visual inspection
The graph of HRs over time demonstrated that all parametric estimates were comparable to the Cox model (not shown), with strong areas of overlap between all models (including AFT) occurring around their similar median OS durations in the GLAS + LDAC arm (8–9 months). The graphs of the survival curves separated by treatment group (GLAS + LDAC or LDAC alone) were generated twice using slightly different approaches. First, STC models (parametric) were developed by applying the IPD of the subgroup of AML patients from GLAS + LDAC versus LDAC and following DSU guidance (Figure 3A and B). Second, to improve visual fit of the parametric survival curves with respect to the KM, GLAS + LDAC versus LDAC IPD were propensity- weighted for trial-level cytogenetic risk. Cytogenetic risk was the trial stratification factor during randomization of the original AML + MDS population to each treatment arm. After weighting, all STC steps were repeated to generate a second set of results (Figure 4A and B). From the first set of results applying GLAS + LDAC versus LDAC IPD, the exponential curves had the closest fit to the KM curves compared with other distributions, but potentially did not convey an ideal visual fit. From the second set of results applying weighted trial data, all parametric extrapolations improved their visual fit to the KM. Among stepwise models, the Weibull distribution had the closest visual fit to the KM. Of the full covariate models, the exponential distribution demonstrated the closest visual fit to the KM. All visual evidence for the full and stepwise adjusted survival curves conveyed a significant treatment effect for GLAS + LDAC compared with LDAC alone, with stepwise models showing somewhat greater magnitude of treatment effect compared with full models.
 |
Figure 3 Overlay of Kaplan-Meier with exponential parametrization adjusting trial IPD (A) AZA and (B) DEC populations. Notes: In Figure 3A (AZA) and 3B (DEC), the gray (KM) and both blue (exponential) curves represent OS in the LDAC alone treatment arm. The orange and green lines estimate survival time in the GLAS + LDAC arm. The solid curves apply the average covariate values from the IPD population, while the dashed curves model the mean covariates from the comparator trials (AZA or DEC).Abbreviations: AZA, azacitidine; DEC, decitabine; GLAS, glasdegib; K-M, Kaplan-Meier; LDAC, low-dose cytarabine; IPD, individual patient data; OS, overall survival. |
Prediction validation
In estimating OS with GLAS + LDAC versus LDAC IPD, among the PH models, exponential and Gompertz distributions produced the most similar OS HR, OS median, and OS estimates to Cox regression estimates, for both stepwise and full model comparisons. The exponential model, over Gompertz, had slightly better model fit statistics; therefore, exponential was considered the optimal PH model. When applying propensity- weighted trial data of GLAS + LDAC versus LDAC, exponential and Weibull models generated highly similar survival predictions and model fit statistics. For optimal model selection, exponential was chosen again for full covariate modelling. Among stepwise models, Weibull was slightly favored over exponential due to visual fit criteria. Among the AFT models using either the unweighted or propensity-weighted trial data, gamma had the most reasonable survival estimates, although AIC and BIC were somewhat higher due to a more complex model than PH. All model results (PH and AFT) demonstrated GLAS + LDAC superiority over LDAC.
Covariate adjustment
Results from applying the mean covariate values from the AZA population to the GLAS + LDAC versus LDAC comparison continued to demonstrate significant treatment effects among the simulated AZA population. As the chosen optimal model from following DSU guidance (Table 3), the stepwise exponential approach estimated slightly improved GLAS + LDAC efficacy versus LDAC (HR=0.382; 95% CI: 0.217, 0.673) compared with estimates from the Cox stepwise covariate model (HR=0.395; 95% CI: 0.219, 0.712). Likewise, in the weighted trial data for GLAS + LDAC versus LDAC (Table 4), the stepwise Weibull model estimated a slightly lower OS HR (HR=0.371; 95% CI: 0.203, 0.677) compared with the Cox stepwise model (HR=0.395; 95% CI: 223, 0.702).
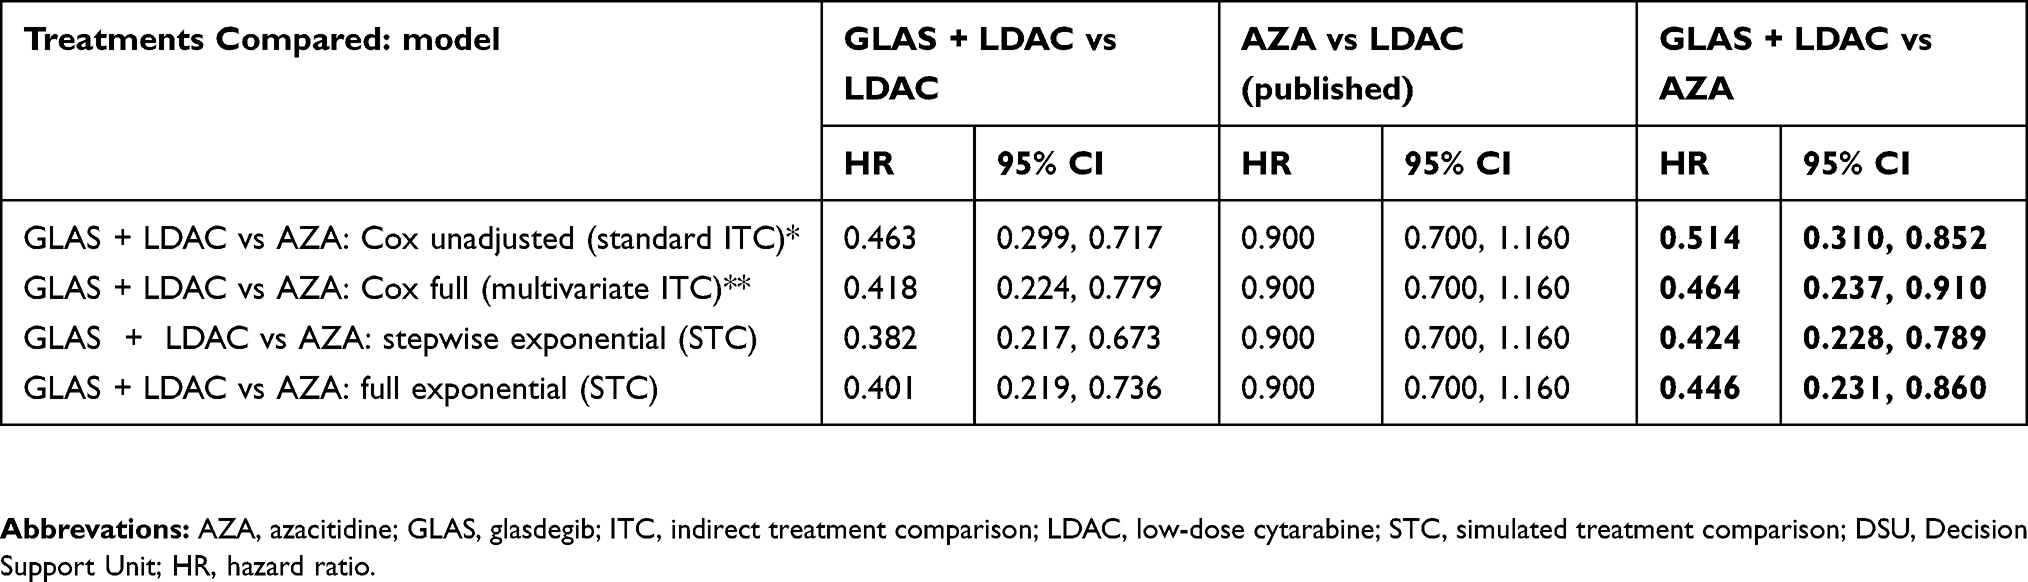 |
Table 3 ITC Cox and STC exponential model results: AZA comparison, DSU guidance |
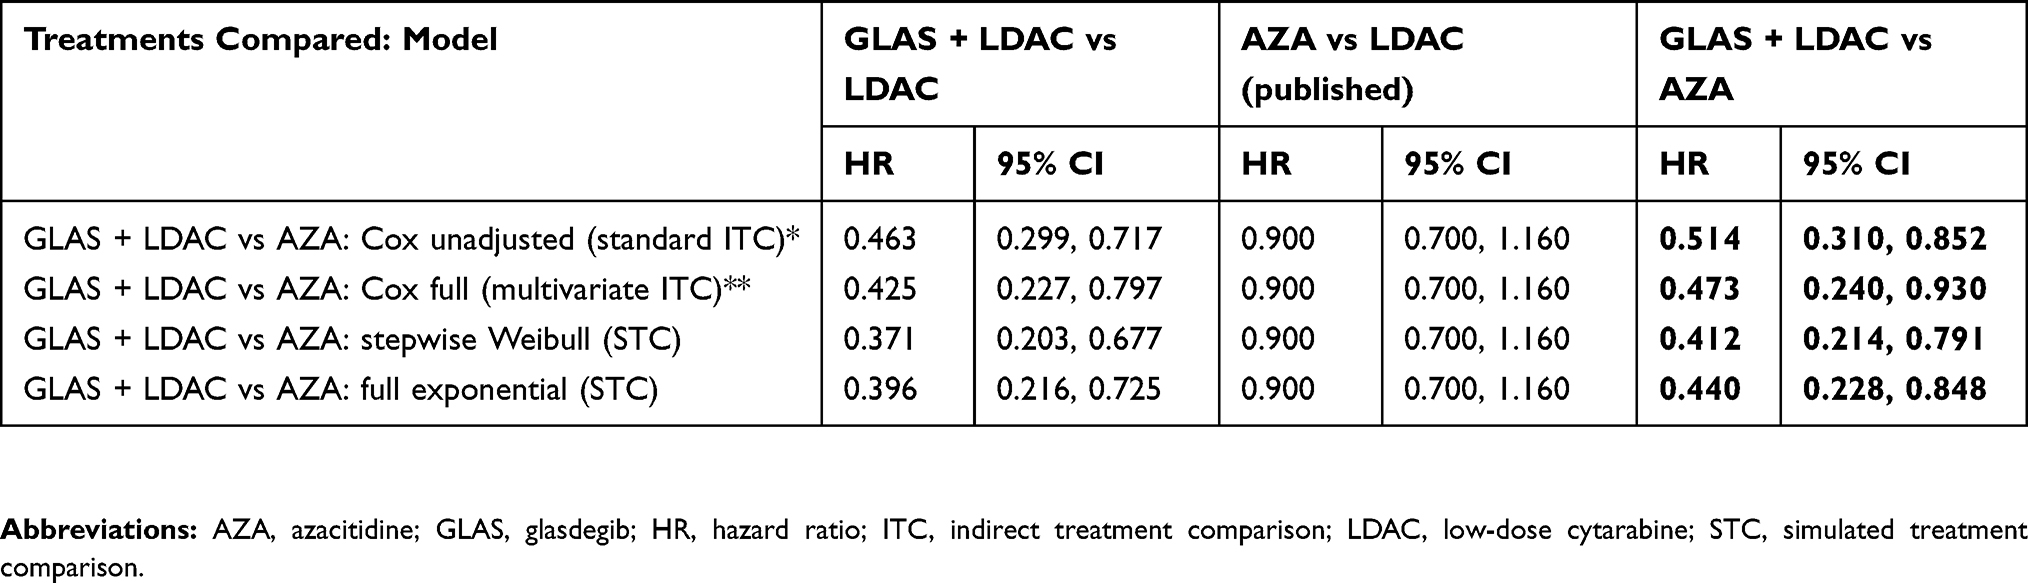 |
Table 4 ITC Cox and STC exponential model results: AZA comparison, weighted STC approach |
An overlay (see Figures 3A and 4A) of the original KM and stepwise exponential survival curves applying either the GLAS + LDAC versus LDAC IPD population (solid lines) or simulated AZA population (dashed lines) demonstrates similarity between the populations when graphing GLAS + LDAC versus LDAC.
 |
Figure 4 Overlay of Kaplan-Meier with Weibull parametrization for the weighted STC approach (A) AZA and (B) DEC populations. Notes: In Figure 4A (AZA) and 4B (DEC), the gray (KM) and both blue (Weibull) curves represent OS in the LDAC alone treatment arm. The orange and green lines estimate survival in the GLAS + LDAC arm. The solid curves apply the average covariate values from the IPD population, while the dashed curves model the mean covariates from the comparator trials (AZA or DEC).Abbreviations: AZA, azacitidine; DEC, decitabine; GLAS, glasdegib; K-M, Kaplan-Meier; LDAC, low-dose cytarabine; IPD, individual patient data; OS, overall survival; STC, simulated treatment comparison. |
Indirect treatment comparisons
Table 3 summarizes results from the standard (initial) ITC (row 1) and covariate-adjusted ITC (row 2). The DSU-guided STC-generated HRs entered final ITC (rows 3 and 4). Table 4 presents the results from the weighted STC approach (rows 3 and 4). The first row is repeated in Tables 3 and 4, as standard ITC did not apply weighting or covariate adjustment.
The full Cox model (adjusted with mutually available covariates between GLAS + LDAC and AZA studies) is also included in a separate ITC against the AZA published HR (row 2).
The third and fourth rows present the final ITC results (the STC models) derived from the stepwise and full exponential STC adjustments, respectively. All models, following DSU guidance (Table 3) or the weighted STC approach (Table 4), found that GLAS + LDAC was significantly associated with improved OS when compared with AZA (two rightmost columns). Compared with the result using only the standard ITC (HR=0.514; 95% CI: 0.310, 0.852), adjusting for population covariates resulted in slightly stronger treatment effects of GLAS + LDAC in comparison to AZA.
A forest plot of the GLAS + LDAC versus AZA DSU-guided comparisons (Fig 5A, AZA comparison), based on average-adjusted standard errors, illustrates the slight narrowing of the CIs between the stepwise and full exponentially derived results. In Figure 6A, (AZA comparison) weighted GLAS + LDAC versus published AZA also demonstrated statistically significant favor of GLAS + LDAC over AZA.
Glasdegib + LDAC versus decitabine: estimating indirect overall survival hazard ratios
The second STC compared GLAS + LDAC to DEC (Kantarjian, 2012).6 Of the mutually available variables between the GLAS + LDAC and DEC studies that were all used in the full models, those selected for the stepwise models included age, AML type, proportion bone marrow blasts >50%, ECOG PS, and cytogenetic risk, as summarized in Table 5.
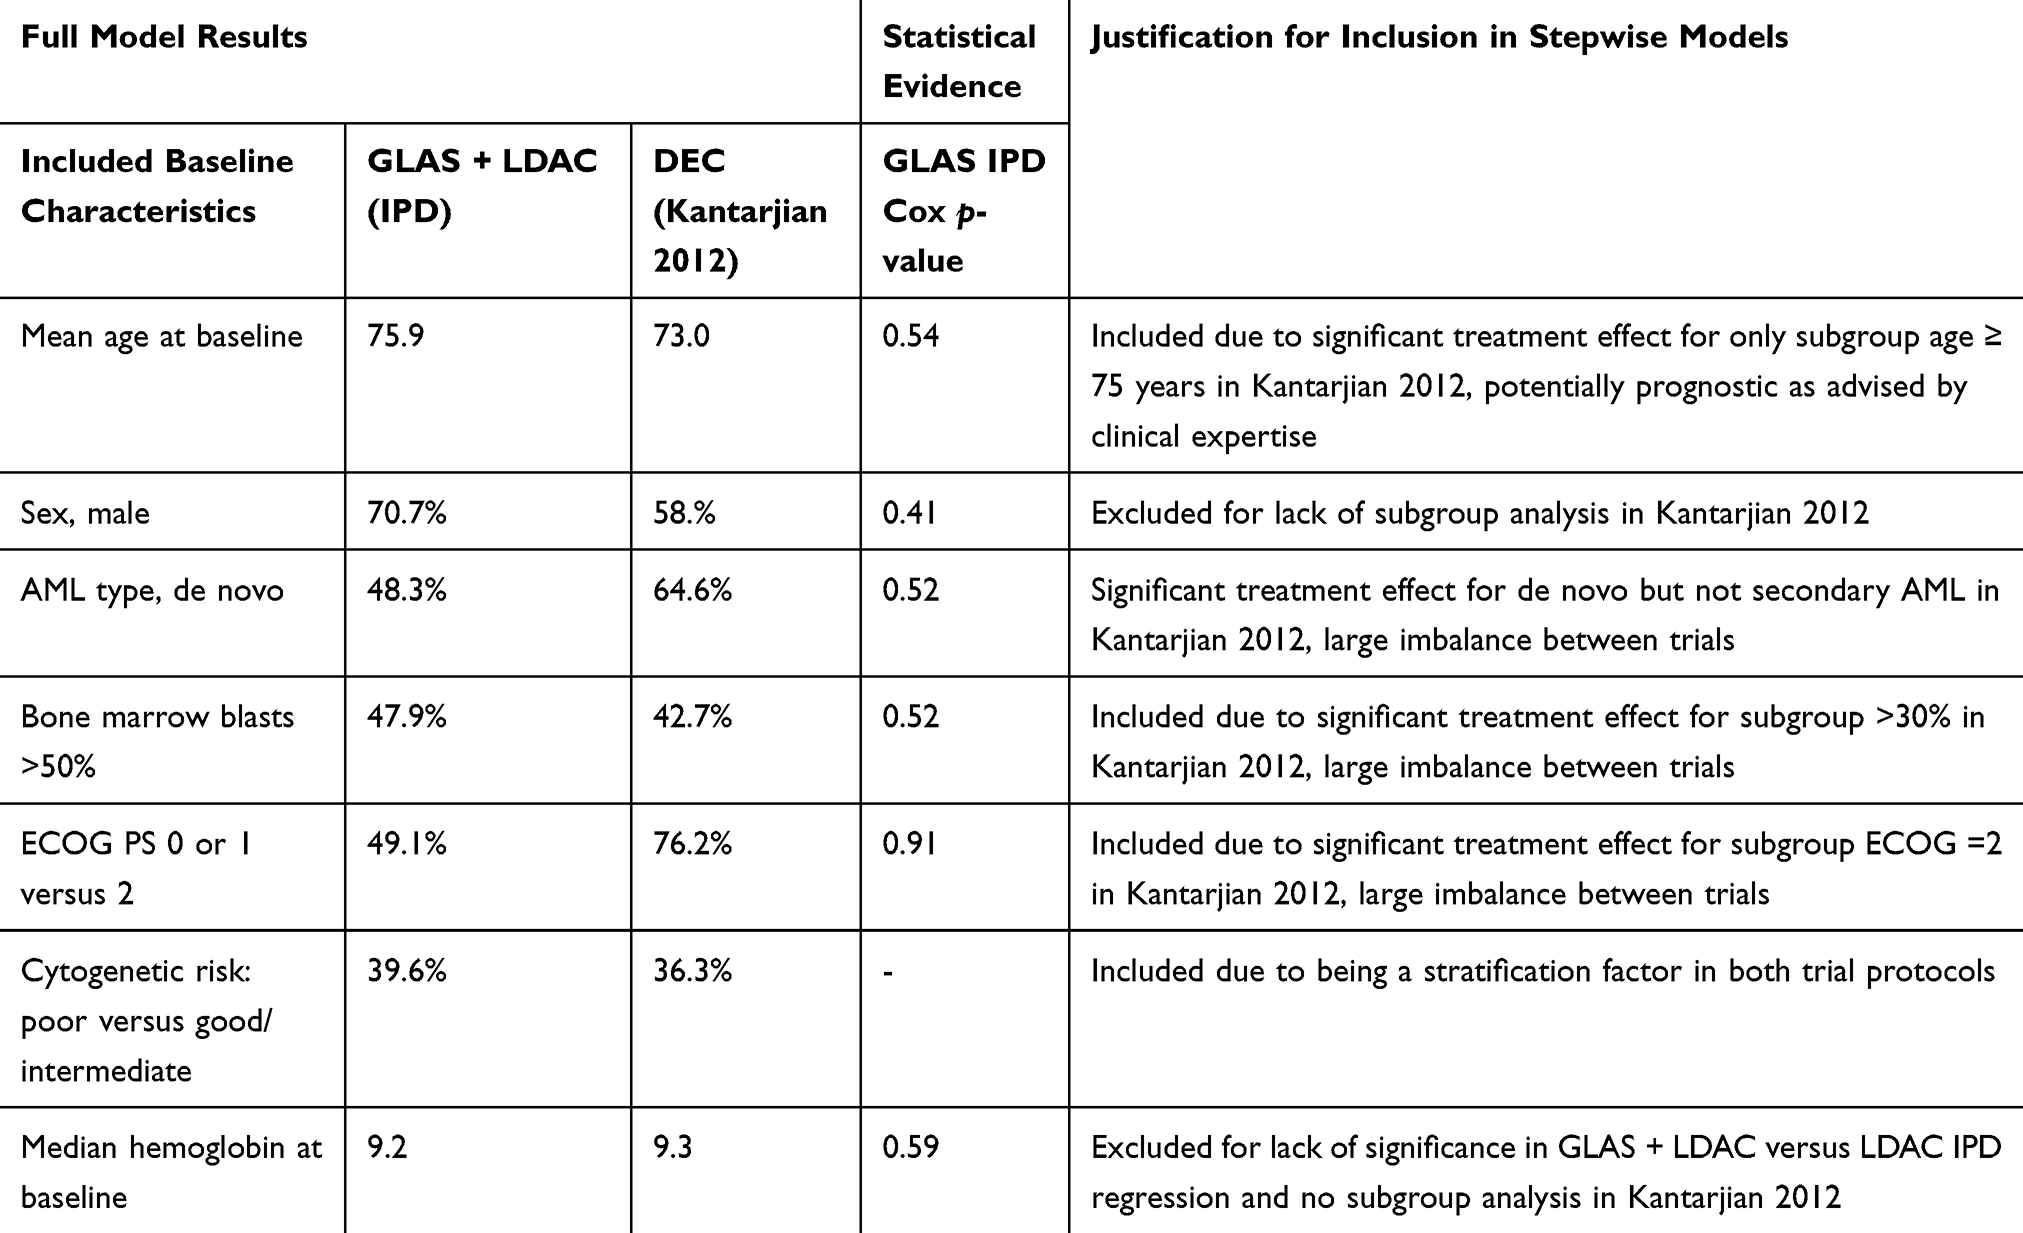 |
Table 5 Inclusion of covariates, GLAS + LDAC vs DEC |
Comparison of functional forms and model fit statistics
The second STC also involved visual assessment of the hazard plots and the Schoenfeld test for the Cox stepwise model. As in the first STC, no significant deviations from the PH assumption was found (p=0.65). The stepwise approach for both Cox and parametric models demonstrated improved AIC/BIC values compared with the full models, resulting in a more robust model measuring greater significance in treatment effects. Across all parametrizations (PH and AFT models), the Chi-square tests for the log likelihood demonstrated significance for at least one of the included variables, and the exponential and Weibull models had the smallest associated p-values (p=0.0008 for both). Again, while the exponential, stepwise parametrization demonstrated numerically superior AIC/BIC fit statistics (345/367), all of the tested stepwise model forms demonstrated comparable fit.
Visual inspection
Following DSU guidance with GLAS + LDAC versus LDAC IPD, lognormal and loglogistic appeared to have the strongest visual fits early in the analysis time. However, over all trial time, the exponential model showed strong visual fit. After applying weighted trial data, the exponential model continued to demonstrate close visual comparison to the KM. However, among the stepwise models, the Weibull distribution demonstrated a somewhat stronger visual fit. With either approach, the graphs of the HRs over 20 months (maximum survival in the LDAC alone arm) all had comparable estimates of GLAS + LDAC superiority over LDAC, with strong overlap between parametrizations and the Cox regression estimate.
Prediction validation
Relative to the unadjusted Cox OS HR and KM survival outcomes, exponential and Gompertz stepwise models adjusting original trial IPD (following DSU guidance) had the closest HR estimates to those of the Cox regression model. With full models adjusting original trial IPD or weighted data for GLAS + LDAC versus LDAC, exponential (PH) and gamma (AFT) models provided the most comparable values for average survival rates and median and mean OS. With weighted trial data, exponential and Weibull stepwise models generated similar survival predictions. All models applying either original IPD or weighted trial data demonstrated significantly higher survival with GLAS + LDAC over LDAC alone.
After applying the three criteria for determining the optimal model (statistical fit, visual inspection, prediction estimation), it was determined that the exponential stepwise parametrization provided the optimal fit for estimating GLAS + LDAC versus LDAC efficacy in the DEC population when using the GLAS + LDAC versus LDAC IPD. With propensity-weighted trial data for GLAS + LDAC versus LDAC, the Weibull distribution among the stepwise models was considered optimal.
Covariate adjustment
Following DSU guidance, after covariate adjustment to the GLAS + LDAC versus LDAC IPD to simulate the DEC population, GLAS + LDAC continued to demonstrate significantly improved survival gains relative to LDAC (HR=0.414; 95% CI: 0.227, 0.757) for the stepwise exponential model (Table 6, first two columns). Applying weighted GLAS + LDAC versus LDAC trial data in the DEC covariate adjustment, the stepwise Weibull model (Table 7) generated similar results (HR=0.397; 95% CI: 0.204, 0.772).
 |
Table 6 ITC Cox and STC exponential model results: DEC comparison, DSU guidance |
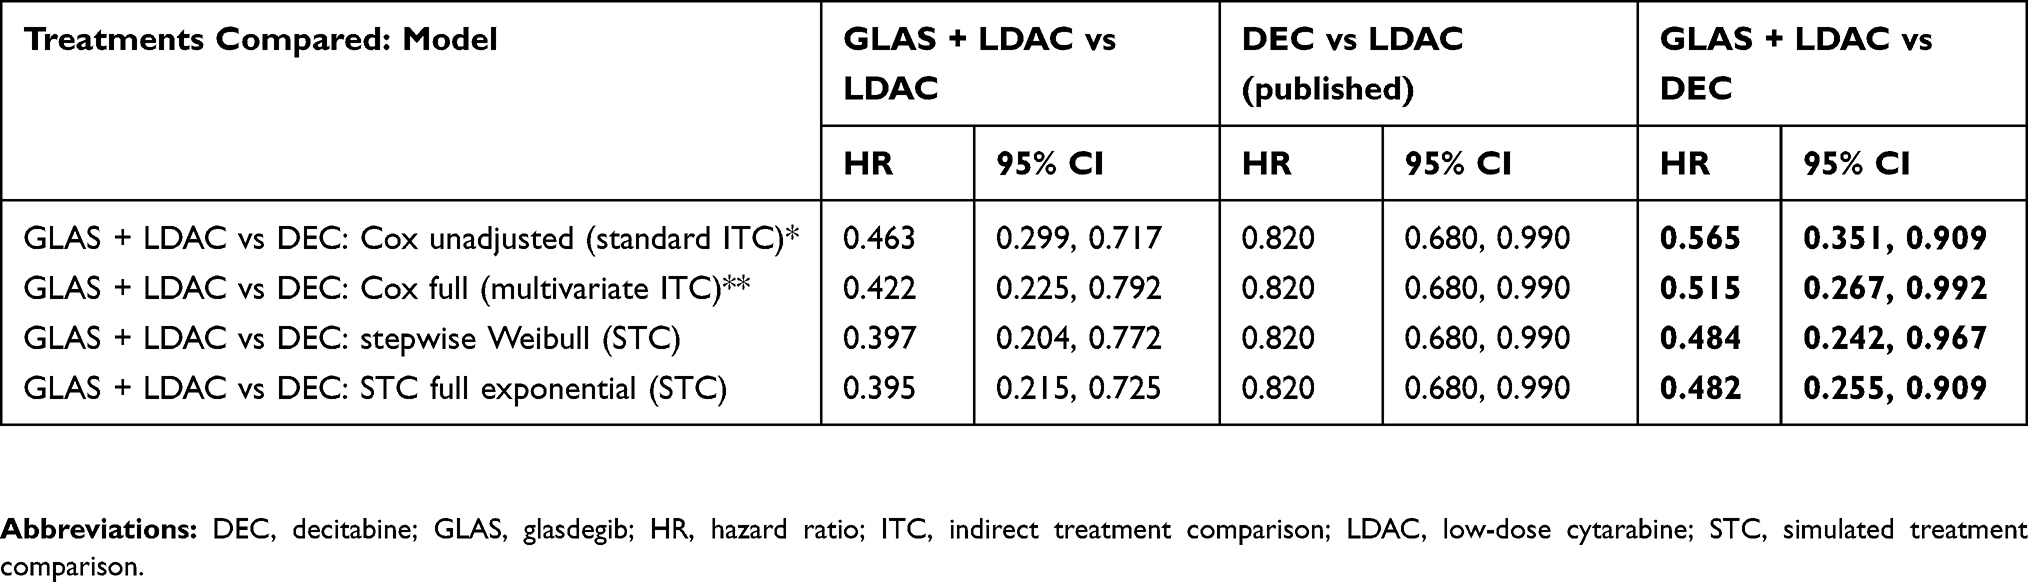 |
Table 7 ITC Cox and STC exponential model results: DEC comparison, weighted STC approach |
Indirect treatment comparisons
Results in Table 6 summarize the standard ITC (row 1), covariate-adjusted ITC (row 2), and STC (rows 3 and 4) which compared HRs from DSU-guided STC against the published OS HR from Kantarjian et al 2012. Results derived from the stepwise and full exponential models are shown in rows three and four. Results in Table 7, presenting final indirect comparisons from the weighted STC approach (rows 3 and 4), demonstrate highly consistent estimates from Table 6.
All ITC and STC approaches found GLAS + LDAC to have significantly superior OS relative to DEC. Compared with the result only using standard ITC (HR=0.565; 95% CI: 0.351, 0.909), overall trends found that adjustment for population covariates resulted in slightly stronger treatment effects of GLAS + LDAC versus DEC. The forest plots in Figures 5 and 6 (DEC comparison) provide a visual comparison of Tables 6 and 7, respectively.
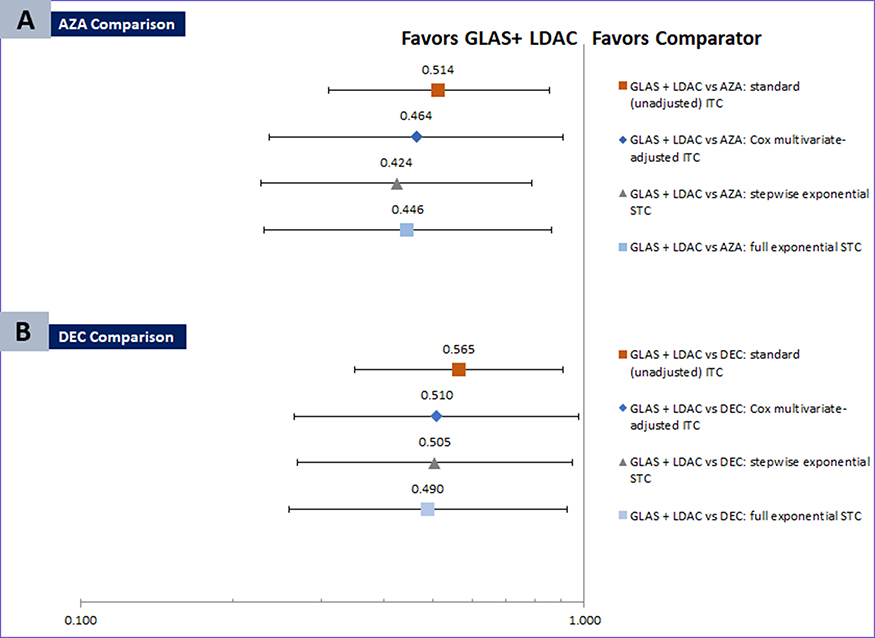 |
Figure 5 Forest plots of exponential and Cox model estimates for (A) GLAS + LDAC versus AZA and (B) GLAS + LDAC versus DEC, DSU guidance. Notes: The forest plots (95% confidence intervals) demonstrate GLAS + LDAC superiority vs (A) AZA and (B) DEC, and provide a simple visualization of the comparable HR results among each set of models. The x-axis is presented on the log scale. Abbreviations: AZA, azacitidine; DEC, decitabine; GLAS, glasdegib; ITC, indirect treatment comparison; LDAC, low-dose cytarabine; STC, simulated treatment comparison. |
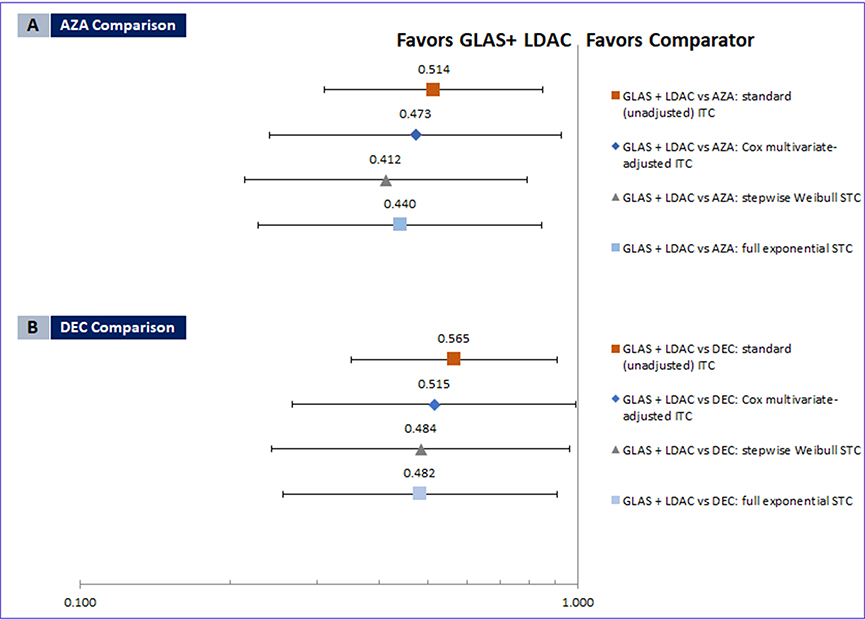 |
Figure 6 Forest plots of exponential and Cox model estimates for (A) GLAS + LDAC versus AZA and (B) GLAS + LDAC versus DEC, weighted STC approach. Notes: The forest plots (95% confidence intervals) demonstrate GLAS + LDAC superiority vs (A) AZA and (B) DEC, and provide a simple visualization of the comparable HR results among each set of models. The x-axis is presented on the log scale.Abbreviations: AZA, azacitidine; DEC, decitabine; GLAS, glasdegib; HR, hazard ratio; ITC, indirect treatment comparison; LDAC, low-dose cytarabine; STC, simulated treatment comparison. |
Discussion
In this study, standard ITC and STC methodology developed from the DSU guidance were applied as a case study to estimate the OS comparative effectiveness of GLAS + LDAC versus AZA or DEC. The OS HR was selected as an estimator of a robust outcome, given that survival is a key patient relevant outcome, and was the primary endpoint in the included trials. Because naïve comparisons across published trial results do not adjust for within-study differences in treatment survival gains, such comparisons are inappropriate and subject to multiple biases. Standard ITC is a robust methodology adjusting for trial differences in survival gains, and STC adjusts for biases due to patient population differences across trials.
Our STC modelling approach explored full and stepwise parametric models, as well as comparisons to Cox regression and unadjusted KM estimates. Additionally, STC modelling approaches were repeated for propensity-weighted, within-trial data. Independent of which models and GLAS + LDAC versus LDAC data were used to derive final HRs, standard ITC and STC results consistently demonstrated GLAS + LDAC numeric and statistical superiority over AZA and over DEC. Thus, in the absence of direct, head-to-head trials, results from robust indirect comparisons can be more appropriate than naïve comparisons to support clinical decision-making.
The primary limitation of this STC analysis is a general lack of precedence in the published literature and the lack of specific guidance from the DSU for estimating hazard ratios and selecting optimal models such as through stepwise processes. Furthermore, while the DSU advises adjusting for population differences when substantial imbalances exist between trials11, some population differences may remain unadjusted if these data were not available in the published comparator trials. Similarly, summary statistics for some of the covariates in the Kantarjian and Dombret trials were published as medians, and in those instances, a weighted mean between the comparator trial arms (divided by total patients) was estimated.
In ITC, and therefore in both the standard ITC and the last calculation of STC, the 95% CIs around the final OS HRs widen as they are estimated by summing the variance of the treatment effect estimate from both trials. This can contribute to less precise estimates compared with the results of the published, intent-to-treat analyses. Another population-adjustment ITC method, matching-adjusted indirect treatment comparison (MAIC), draws inferences on a subgroup with matching baseline characteristics across trials.18 However, MAIC can significantly reduce effective sample size, increase uncertainty around point estimates, and limit population-level interpretation of the results.11 In the original GLAS + LDAC versus LDAC AML patient data set, there was a relatively small sample size (n=116). Thus, a strength of STC is that the full patient dataset is retained, potentially improving the robustness of the estimates and enabling greater generalizability to broader patient populations.
As a last, conceptual step of STC, inference of the final results to a broader, target population, such as patients a clinician would treat, is supported by its demographic and clinical protocol similarities to the comparator population (here AZA or DEC). The results of this study can be generalized to older patients with previously untreated AML for whom intensive chemotherapy is not an option. We present a robust methodologically comprehensive comparison of population-specific OS HR results that consistently favored GLAS + LDAC over either AZA or DEC. While STC may serve as an important comparison methodology to inform payers’ decision-making and support clinical inferences by accounting for differences in the patient populations of published trials, evidence from robust RCT methodology should be prioritized over naïve comparisons.
Conclusion
In summary, STC methodology explored several modelling approaches to best estimate GLAS + LDAC versus LDAC outcomes. The stepwise, exponential and Weibull STC models adjusting for key covariates resulted in the optimal model fit and the lowest HRs, which demonstrated GLAS + LDAC superiority to AZA and to DEC. Regardless of the modelling technique used, both ITC and STC consistently demonstrated significantly improved OS for GLAS + LDAC relative to AZA or DEC.
Abbreviations
AFT, accelerated failure time; AIC, Akaike’s information criterion; AML, acute myeloid leukemia; AZA, azacitidine; BIC, Bayesian information criterion; BID, bis in die, twice per day; BSC, best supportive care; CI, confidence interval; DEC, decitabine; DSU, Decision Support Unit; ECOG, Eastern Cooperative Oncology Group; FDA, US Food and Drug administration; GLAS, glasdegib; HR, hazard ratio; IC, intensive chemotherapy; IPD, individual patient data; ITC, indirect treatment comparison; KM, Kaplan-Meier; LDAC, low-dose cytarabine; MAIC, matching-adjusted indirect treatment comparison; MDS, myelodysplastic syndrome; NIC, not eligible for intensive chemotherapy; NICE, National Institute for Health and Care Excellence; OS, overall survival; PH, proportional hazards; PS, performance status; RCT, randomized controlled trial; SLR, systematic literature review; STC, simulated treatment comparison.
Acknowledgment
A preliminary version of the abstract of this paper was presented at the 2019 Annual Scientific Meeting of the British Haematology Association, as a poster presentation with interim findings. The poster’s abstract was published in “Poster Abstracts” in HemaSphere: https://journals.lww.com/hemasphere/fulltext/2019/06001/INDIRECT_NUMBER_NEEDED_TO_TREAT__COMPARATIVE.935.aspx. This study was sponsored by Pfizer Inc.
Author contributions
GT and TW made substantial contributions to the conception and design of the study, analyzed and interpreted the data, and critically revised the article. TJB and JCC analyzed and interpreted the data and critically revised the article for important content. BA contributed to data interpretation and drafting of the article. All authors contributed to data analysis, drafting and revising the article, gave final approval of the version to be published, and agree to be accountable for all aspects of the work.
Disclosure
JCC, BA, GC, and TJB are employees of, and own stock in Pfizer. AB reports consulting fees from Pfizer. GT and TW are employees of Purple Squirrel Economics, who were paid consultants to Pfizer in connection with the development of this manuscript. The authors report no other conflicts of interest in this work.
References
1. Deschler B, Lubbert M. Acute myeloid leukemia: epidemiology and etiology. Cancer. 2006;107(9):2099–2107. doi:10.1002/cncr.22233
2. Ossenkoppele G, Lowenberg B. How I treat the older patient with acute myeloid leukemia. Blood. 2015;125(5):767–774. doi:10.1182/blood-2014-08-551499
3. NCCN (National Comprehensive Cancer Network) Clinical Practice Guidelines in Oncology (NCCN Guidelines): Acute Myeloid Leukemia. Version 2 [Online]. Available from: http://www.nccn.org/professionals/physician_gls/f_guidelines.asp. Accessed October, 2018.
4. Walter RB, Estey EH. Management of older or unfit patients with acute myeloid leukemia. Leukemia. 2015;29(4):770–775. doi:10.1038/leu.2014.216
5. Dombret H, Seymour JF, Butrym A, et al. International phase 3 study of azacitidine vs conventional care regimens in older patients with newly diagnosed AML with >30% blasts. Blood. 2015;126(3):291–299. doi:10.1182/blood-2015-01-621664
6. Kantarjian HM, Thomas XG, Dmoszynska A, et al. Multicenter, randomized, open-label, phase III trial of decitabine versus patient choice, with physician advice, of either supportive care or low-dose cytarabine for the treatment of older patients with newly diagnosed acute myeloid leukemia. J Clin Oncol. 2012;30(21):2670–2677. doi:10.1200/JCO.2011.38.9429
7. DAURISMO™ (glasdegib) tablets, for oral use. Full Prescribing Information. U.S. Food and Drug Administration. Available from: https://www.accessdata.fda.gov/drugsatfda_docs/label/2018/210656s000lbl.pdf. Accessed October, 2018.
8. Cortes JE, Heidel FH, Heuser M, et al. A Phase 2 randomized study of low dose Ara-C with or without glasdegib (PF-04449913) in untreated patients with acute myeloid leukemia or high-risk myelodysplastic syndrome. Blood. 2016;128(22):99.
9. Cortes JE, Douglas Smith B, Wang ES, et al. Glasdegib in combination with cytarabine and daunorubicin in patients with AML or high-risk MDS: Phase 2 study results. Am J Hematol. 2018;93(11):1301–1310. doi:10.1002/ajh.25238
10. Bucher HC, Guyatt GH, Griffith LE, Walter SD. The results of direct and indirect treatment comparisons in meta-analysis of randomized controlled trials. J Clin Epidemiol. 1997;50(6):683–691.
11. Phillippo DM, Ades AE, Dias S, et al. NICE DSU Technical Support Document 18: Methods for Population-adjusted Indirect Comparisons in Submissions to NICE. National Institute for Health and Care Excellence (NICE). Available from: http://nicedsu.org.uk/wp-content/uploads/2018/08/Population-adjustment-TSD-FINAL-ref-rerun.pdf. Accessed August 19, 2019.
12. Caro JJ, Ishak KJ. No head-to-head trial? Simulate the missing arms. PharmacoEconomics. 2010;28(10):957–967. doi:10.2165/11537420-000000000-00000
13. Spriggs D, Griffin J, Wisch J, Kufe D. Clinical pharmacology of low-dose cytosine arabinoside. Blood. 1985;65(5):1087–1089.
14. Tremblay G, Haines P, Briggs A. A criterion-based approach for the systematic and transparent extrapolation of clinical trial survival data. JHEOR. 2015;2(2):147–160.
15. Collett D. Modelling Survival Data in Medical Research.
16. Kleinbaum DG, Klein M. Survival Analysis: A Self-Learning Text. New York (NY): Springer-Verlag; 2005.
17. Schoenfeld D. Chi-squared goodness-of-fit tests for the proportional hazards regression model. Biometrika. 1980;67(1):145–153. doi:10.1093/biomet/67.1.145
18. Signorovitch JE, Sikirica V, Erder MH, et al. Matching-adjusted indirect comparisons: a new tool for timely comparative effectiveness research. Value Health. 2012;15(6):940–947. doi:10.1016/j.jval.2012.05.004
 © 2019 The Author(s). This work is published and licensed by Dove Medical Press Limited. The full terms of this license are available at https://www.dovepress.com/terms.php and incorporate the Creative Commons Attribution - Non Commercial (unported, v3.0) License.
By accessing the work you hereby accept the Terms. Non-commercial uses of the work are permitted without any further permission from Dove Medical Press Limited, provided the work is properly attributed. For permission for commercial use of this work, please see paragraphs 4.2 and 5 of our Terms.
© 2019 The Author(s). This work is published and licensed by Dove Medical Press Limited. The full terms of this license are available at https://www.dovepress.com/terms.php and incorporate the Creative Commons Attribution - Non Commercial (unported, v3.0) License.
By accessing the work you hereby accept the Terms. Non-commercial uses of the work are permitted without any further permission from Dove Medical Press Limited, provided the work is properly attributed. For permission for commercial use of this work, please see paragraphs 4.2 and 5 of our Terms.