")
Back to Journals » Drug, Healthcare and Patient Safety » Volume 12
Over-the-Counter Medicine Utilization by Beneficiaries Under Medical Schemes in South Africa
Authors Padayachee N, Rothberg A, Butkow N, Truter I
Received 26 October 2019
Accepted for publication 8 February 2020
Published 24 April 2020 Volume 2020:12 Pages 61—69
DOI https://doi.org/10.2147/DHPS.S236139
Checked for plagiarism Yes
Review by Single anonymous peer review
Peer reviewer comments 2
Editor who approved publication: Professor Siew Siang Chua
N Padayachee,1 A Rothberg,2 N Butkow,1 I Truter3
1Department of Pharmacy and Pharmacology, Faculty of Health Sciences, University of the Witwatersrand, Johannesburg, South Africa; 2School of Therapeutic Sciences, Faculty of Health Sciences, University of the Witwatersrand, Johannesburg, South Africa; 3Department of Pharmacy and Pharmacology, Nelson Mandela University, Port Elizabeth, South Africa
Correspondence: N Padayachee 7 York Road, Parktown, Johannesburg 2193, South Africa
Tel +27 842 302364
Email [email protected]
Background: South African medical insurance schemes (known as medical schemes) cover about 17% of the population. Within these schemes, access to medicines for a defined set of chronic diseases is mandated by legislation. However, much of the responsibility for treatment of minor conditions with non-prescription over-the-counter (OTC) medicines has been transferred to the individuals within the medical schemes. The overall expenditure on pharmacist-assisted therapy (PAT)/OTC medicines in South Africa is considerable and medical schemes endeavor to limit amounts paid out by devising strategies that will limit their financial exposure.
Aim: To investigate how benefit design and other factors within two medical schemes influenced access to and payment for OTC medicines and to explore whether access to OTC medicines by individuals impacted on utilization of other health-care services.
Methods: Medical scheme data were obtained from a leading administrator for two health plans: one with comprehensive benefits covering 4593 beneficiaries (designated HI) and the other with lower benefits covering 54,374 beneficiaries (LO). Extracted data included beneficiary demographics, OTC medicines prescribed by doctors and/or dispensed by pharmacists, and monetary amounts claimed by individuals and paid by the medical schemes. Doctor consultations, costs and payments were also extracted, as were beneficiaries’ records of their chronic disease(s) and any episode(s) requiring hospitalization.
Results: Some 60– 70% of beneficiaries submitted claims for OTC medicines accessed directly or recommended by a pharmacist, and 80– 90% claimed OTC medicines that were prescribed by a doctor during a consultation. Amounts claimed and percentages of original products prescribed were substantially higher when accessed directly by beneficiaries or recommended by pharmacists than when doctors prescribed the medicines. In multivariate analysis, there was no clear advantage of offering access to OTC medicines in order to reduce visits to general practitioners, although in the LO plan it appeared that beneficiaries with chronic diseases made less use of the OTC benefit and more use of medical specialists.
Conclusion: Within these two plans, there were higher costs and greater use of original products when beneficiaries or pharmacies accessed OTC medicines than when these medicines were prescribed by doctors. A key question is whether access to these medicines and the costs thereof would be managed better if paid for directly by individuals and not as insured benefits through the medical scheme.
Keywords: medical schemes, over-the-counter benefit, acute medicines, pharmacist-assisted benefit, over-the-counter medicines
Introduction
Health-care services for most South Africans are provided by the public sector while the private sector services about 17% of the population. Currently, some 8.78 million lives are covered by medical insurance schemes which are tax-exempt, not-for-profit entities, in principle owned by their members.1,2 All such schemes are formally registered as Medical Schemes with the legislated national regulator (Council for Medical Schemes) and will, therefore, be referred to as medical schemes in this article. The value of medical scheme cover arises from the benefits that are provided.3 Benefit design is therefore crucial to a scheme’s affordability, marketability and competitiveness. These elements are determined by the extent of risk pooling within the scheme, and the rationing of and access to health-care services as determined by each medical scheme.4 Further explanation of these and other terms used in this article is provided in Table 1.
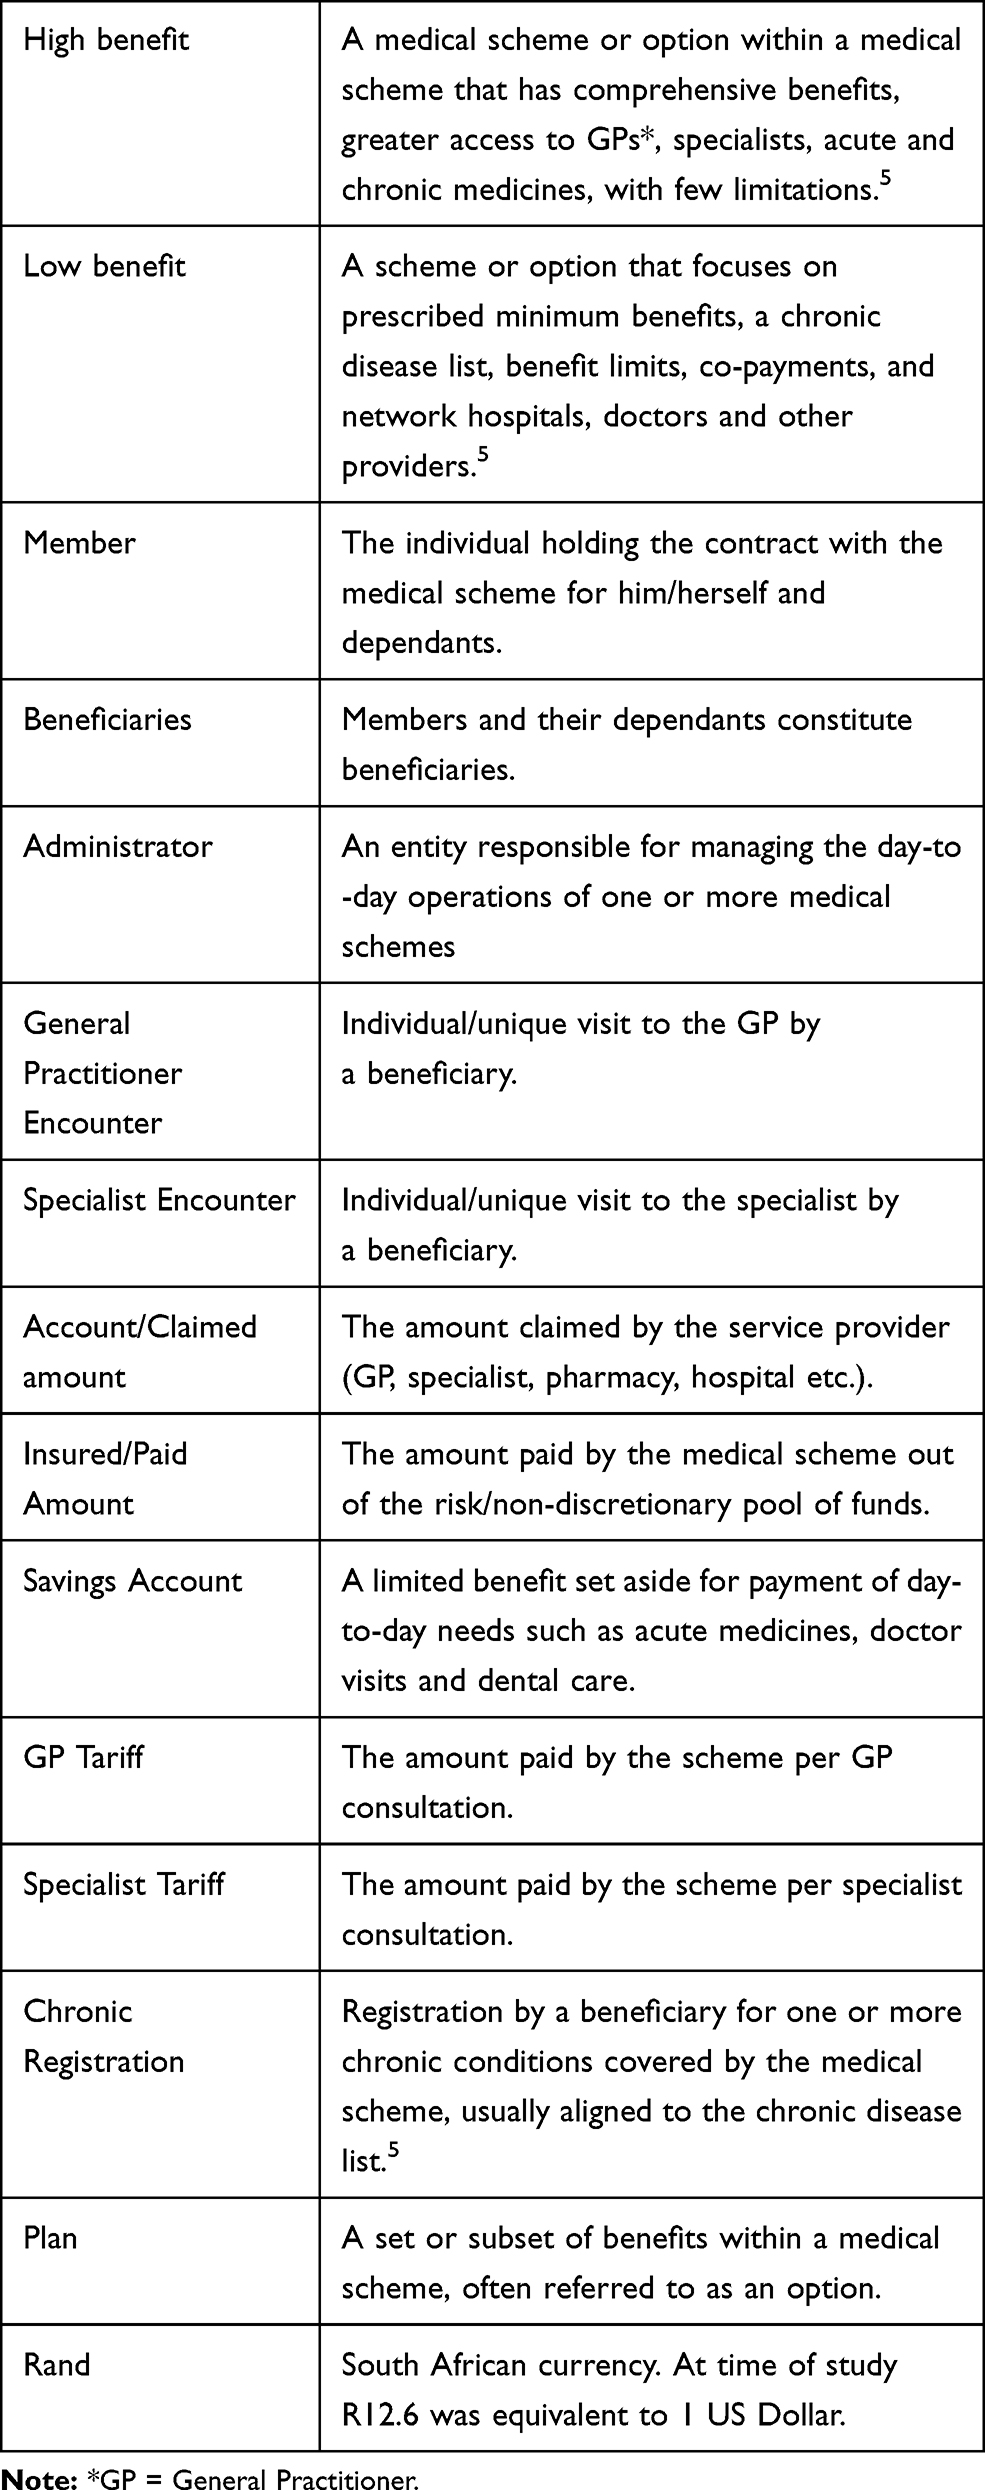 |
Table 1 Terminology |
One element of benefit design is the day-to-day benefit category which typically covers out-of-hospital expenses such as GP and specialist consultations and services, dentistry and acute medicines. The latter are typically required to treat minor conditions, e.g., antibiotics for an infection. Acute medicine coverage is dependent on a medical scheme’s design and may be covered by the general risk pool or by a discretionary pool of funds which is capped in terms of annual maxima, and often involves a savings component. This is essentially regarded as “member’s money,” is available from day 1 of a benefit year, and covers a limited number of services that are not regarded by medical schemes as being required by law.5 The acute medicines component covers “non-chronic” medicines prescribed by GPs and specialists, and commonly also includes a sub-category or sub-benefit covering pharmacist-assisted therapy (PAT) which allows a pharmacist to recommend treatment, and an over-the-counter (OTC) benefit which is available to beneficiaries without input from a pharmacist. The goal of the latter is the self-treatment of minor acute conditions. The benefit provides access to Schedule 0–2 (S0-S2) medicines as determined by the national medicines regulatory body.6 These medicines do not require a doctor’s prescription but are often included in a prescription after a consultation for dispensing by a pharmacist. Detail of the scheduling is provided in Table 2. Within the S0-S2 categories, the amounts available to beneficiaries vary from medical scheme to medical scheme. Most do not provide much in the way of education on these benefits, even though the rationale for the PAT/OTC benefit is to allow access to immediate care, obviate the need to see a doctor for a prescription, and reduce overall costs of care.
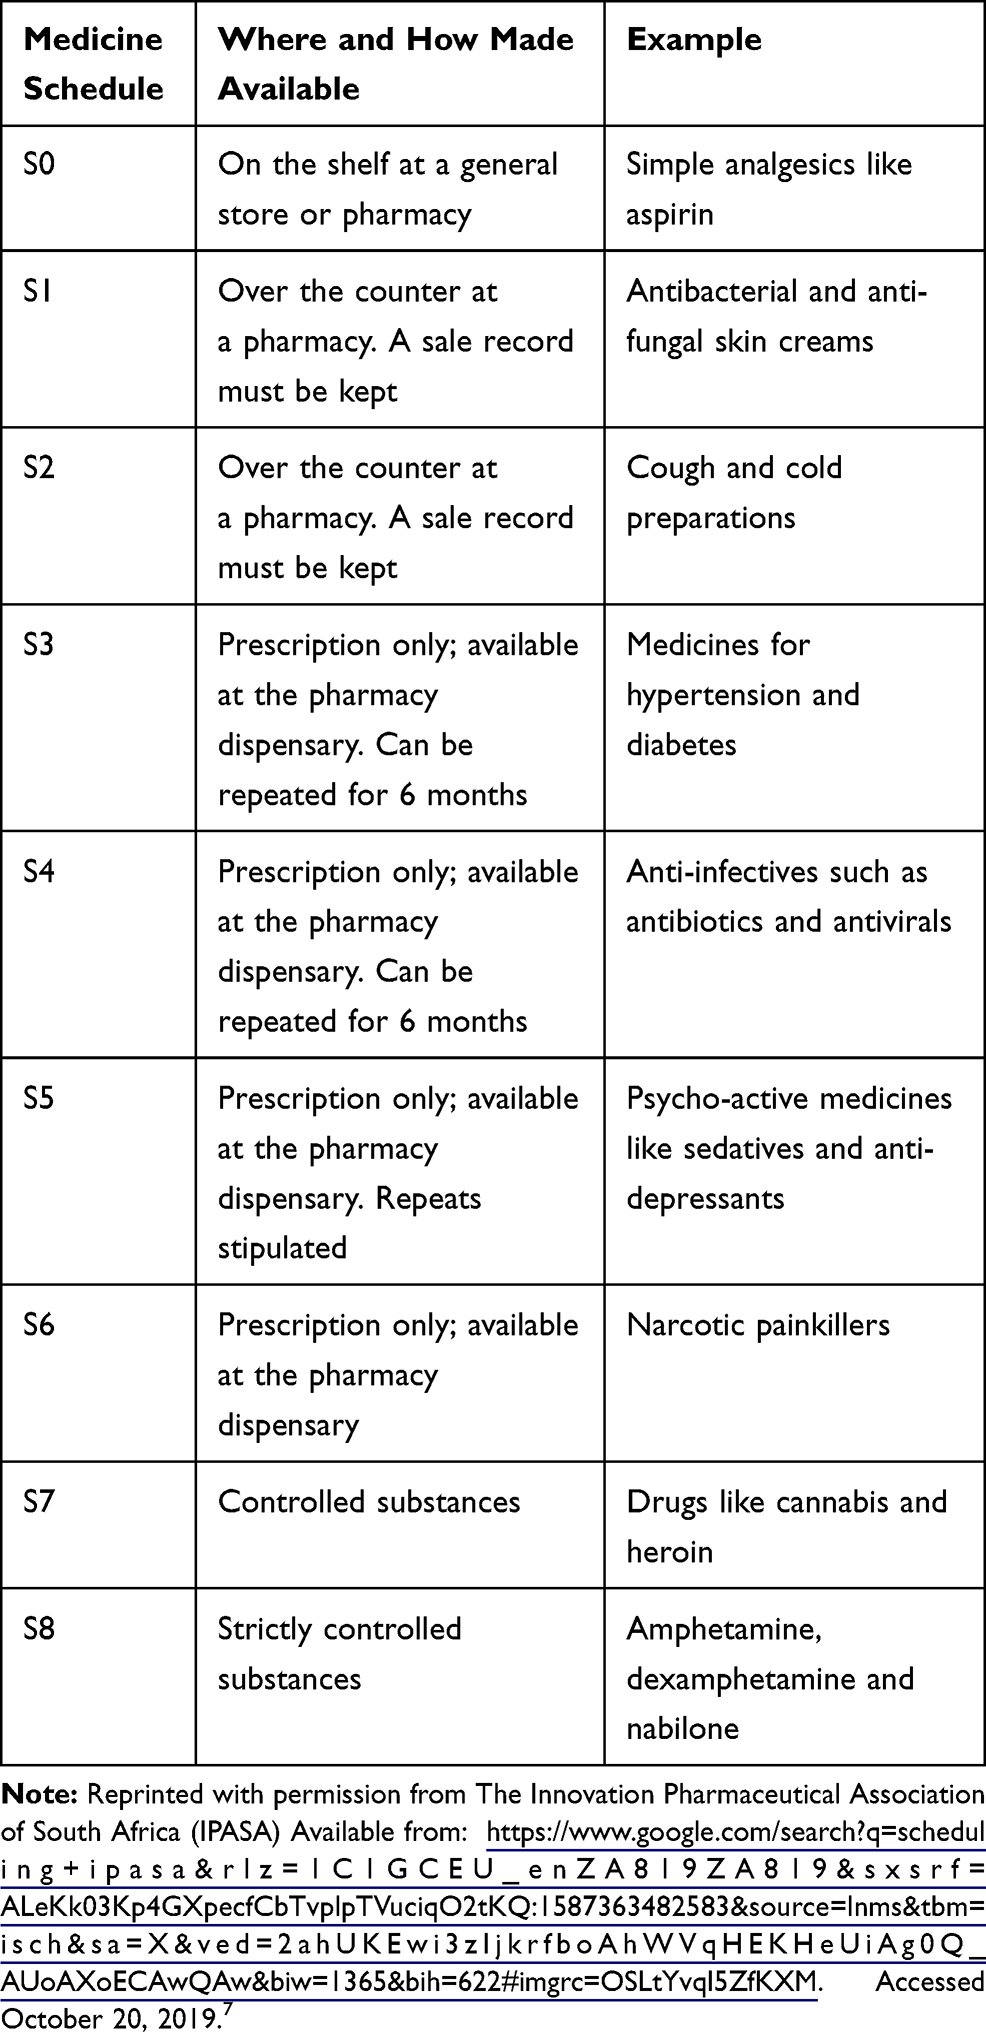 |
Table 2 Explanation of South African Medicine Schedules |
How the PAT/OTC benefits are managed by beneficiaries and pharmacists, and their impact on overall health care and costs have been reported to a limited extent in South Africa. In a recent study of S1-2 medicines utilization by beneficiaries, we focused on a range of commonly used analgesic products and found that costs were higher when medicines were accessed via pharmacies than when prescribed by doctors. Furthermore, the cost of products dispensed by doctors who dispensed directly to patients was lower than when doctors wrote prescriptions that were filled by pharmacies.8 In contrast to that study, this one focused on utilization at a beneficiary level rather than the product level. Consequently, the purpose was to determine how, within the S0-S2 categories, the acute medicines benefit and the sub-category of PAT/OTC medicines were utilized by beneficiaries and then paid for by the medical scheme. Two types of medical schemes were selected, one offering beneficiaries a “rich” or comprehensive set of benefits, the other operating at the lower and more-restricted end of benefit designs. The impact of the PAT/OTC benefit on the utilization of other benefit categories such as access to doctors and hospitals was also assessed.
Methodology
Beneficiaries were selected from a database provided by a large medical scheme administrator. This administrator services over 3 million individuals and has been in existence for over 4 decades. This cross-sectional study used a subset of 1 year’s data (1 January to 31 December 2015) covering 12 medical scheme plans/options with 641 525 beneficiaries in total. The medical schemes, plans, members and beneficiaries were not identifiable from the data provided. Only two plans were selected for this study, one which from the review of the data was a high benefit scheme with no savings account, i.e., a comprehensive set of benefits paid out of a single insured/risk pool (designated HI). The other was identifiable from the claiming pattern as a low benefit plan with restricted benefits and a savings account for discretionary use up to specified limits (designated LO).
All beneficiaries were identified only by a unique study number. Background information provided for each beneficiary included gender, age and ethnicity. Medicines data extracted for this study included only S0-S2 medicines, irrespective of whether paid from the acute benefit or PAT/OTC sub-benefit. For the purpose of this study, S0-S2 medicines prescribed by a doctor from the acute medicines benefit are referred to as doctor-prescribed (DP) medicines, while the PAT/OTC medicines accessed directly by the beneficiary or on the recommendation of the pharmacist are referred to as beneficiary/pharmacist (BP) medicines. Each medicine claimed, whether originator or generic product, was coded according to the World Health Organization’s Anatomical Therapeutic Classification (ATC) system. This system is used in drug utilization management to analyze and improve dispensing and prescribing practice, and ultimately enhance the quality of drug use.9
The Rand amount purchased and claimed by beneficiaries (account amount) and the amount paid by the medical scheme (insured amount) for the S0-S2 medicines were captured, whether a DP medicine paid from the acute benefit or a BP medicine paid from the PAT/OTC sub-benefit. The latter also included whether the amount paid was derived from a savings account or paid out-of-pocket if there was a shortfall in payment. General practitioner and specialist encounters (i.e., consultations) were also recorded, as were costs and payments for such encounters. Each beneficiary’s record of medical scheme registration for treatment and management of one or more chronic conditions was captured, as was the cost of episodes requiring hospitalization.
Analysis was carried out on the individual plans using descriptive statistics, t-tests, frequency analysis by means of chi-square (x2) test, and multivariate regression analysis (Statistica Version 13.2; TIBCO Software Inc, Palo Alto, CA, USA).
Ethics
Ethics approval was obtained from the Human Ethics Committee of the University of the Witwatersrand (certificate M160141).
Results
Descriptive Statistics
As shown in Table 3, the study covered 59,327 beneficiaries distributed between the HI and LO plans. Demographics within the plans were similar, with a slight preponderance of females. Approximately half of the beneficiaries were African and one-third were Caucasian. Percentages of Mixed race and Asians were also similar. Beneficiaries within the HI group were significantly older than in LO and were registered for a greater number of chronic diseases.
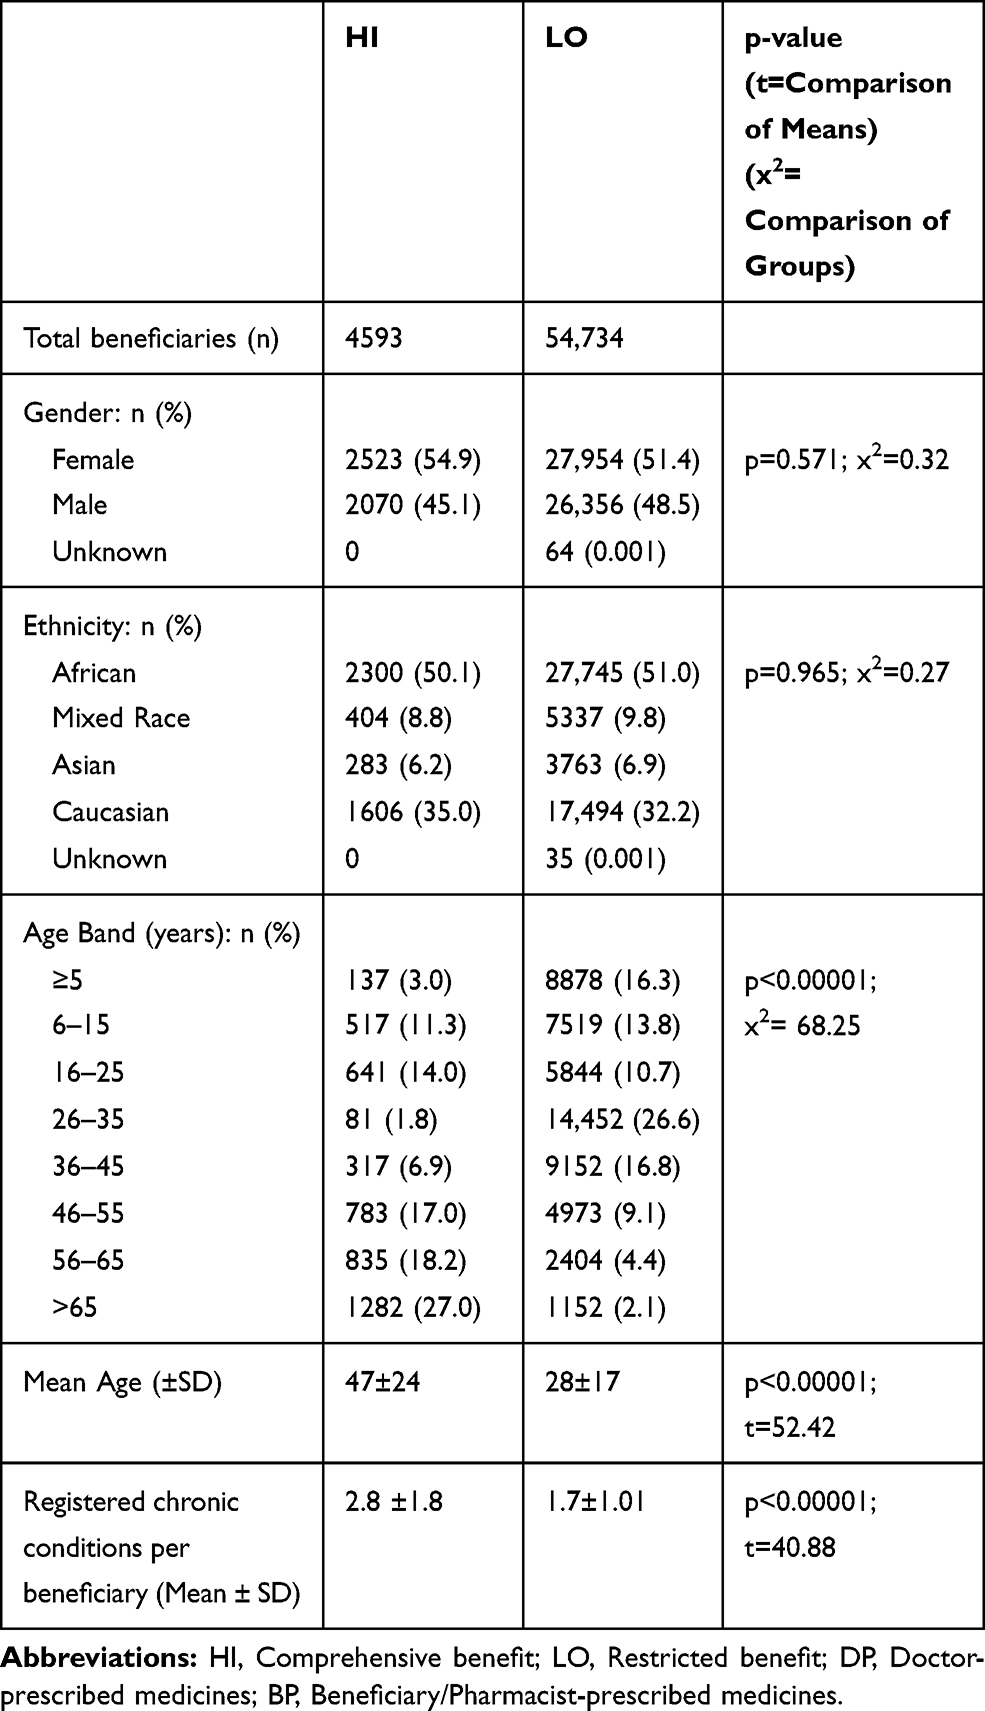 |
Table 3 Demographic Profiles of Beneficiaries with Claims for S0-S2 Medicines Paid from DP or BP Medicine Benefit Pools |
Beneficiaries were categorized in age bands for each plan. This categorization separated out infancy/early childhood, childhood/adolescence, and various stages of adulthood, and was particularly useful for the logistic regression analysis.
While the large sample sizes resulted in very significant differences in percentages of beneficiaries in the HI and LO plans accessing BP and DP medicines, overall the ranges show the high number of beneficiaries making use of the benefit: in the 80–90% range for DP medicines, and in the 58–68% range for the BP medicines. Differences were found in the area of costs. For both the DP and BP categories, over the 1-year period, HI beneficiaries submitted claims that were substantially higher than for LO. Table 4 also shows that in the HI group the amounts claimed were largely paid out of the insured/risk pool. In both the DP and BP categories, there was a short-payment of around R40 (derived from the difference between account amounts and paid amounts) that would have been for the member to pay out-of-pocket. In LO, both DP and BP medicines were paid via the savings benefit. However, it is important to note that whereas in the DP category there was a short payment of some R30, in the BP category the medical scheme appears to have paid in full. The latter falsely suggests that the LO scheme was more generous, but in fact, for such schemes, the electronic claims system is set up for automatic rejection if the beneficiary has exhausted her/his annual capped benefits. This results in the beneficiary paying in full, with no payment expected from the medical scheme. Across the board, amounts reflected for BP medicines were substantially higher than for DP medicines. In other words, S0-S2 medicines prescribed by doctors cost the plans substantially less than S0-S2 medicines recommended by pharmacists or accessed directly by a beneficiary.
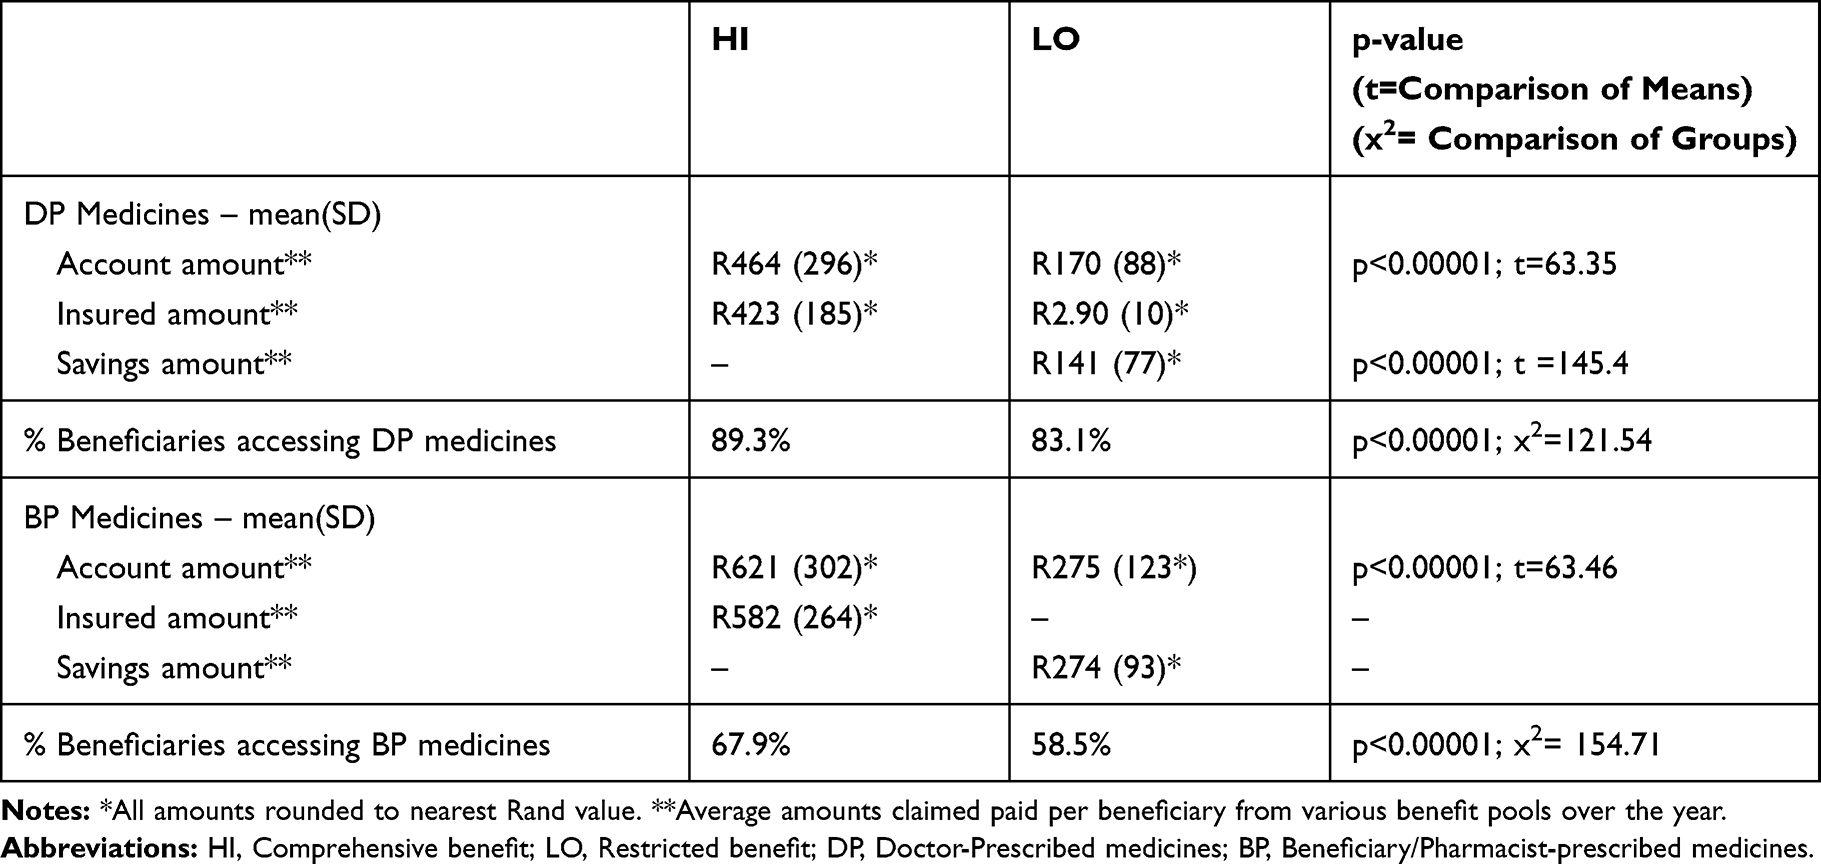 |
Table 4 DP and BP Medicine Cost, Payment and Utilization Patterns |
To explore possible reasons for the differences in medicine costs between the plans, the data were interrogated specifically for cost and utilization patterns in one of the commonest S0-S2 claiming categories viz. the respiratory category which relates to treatment for coughs and colds (ATC category RO5X). Table 5 shows that whether HI or LO, doctors prescribed generic medicines to a greater extent than original products (60–70% generics vs 40–30% original products). In contrast, in the BP category, the generic:original ratio was reversed and there was greater use of higher-priced original products. Table 5 also shows that whether medicines were in the DP or BP category or original vs generic, the average costs of these medicines were always higher in HI.
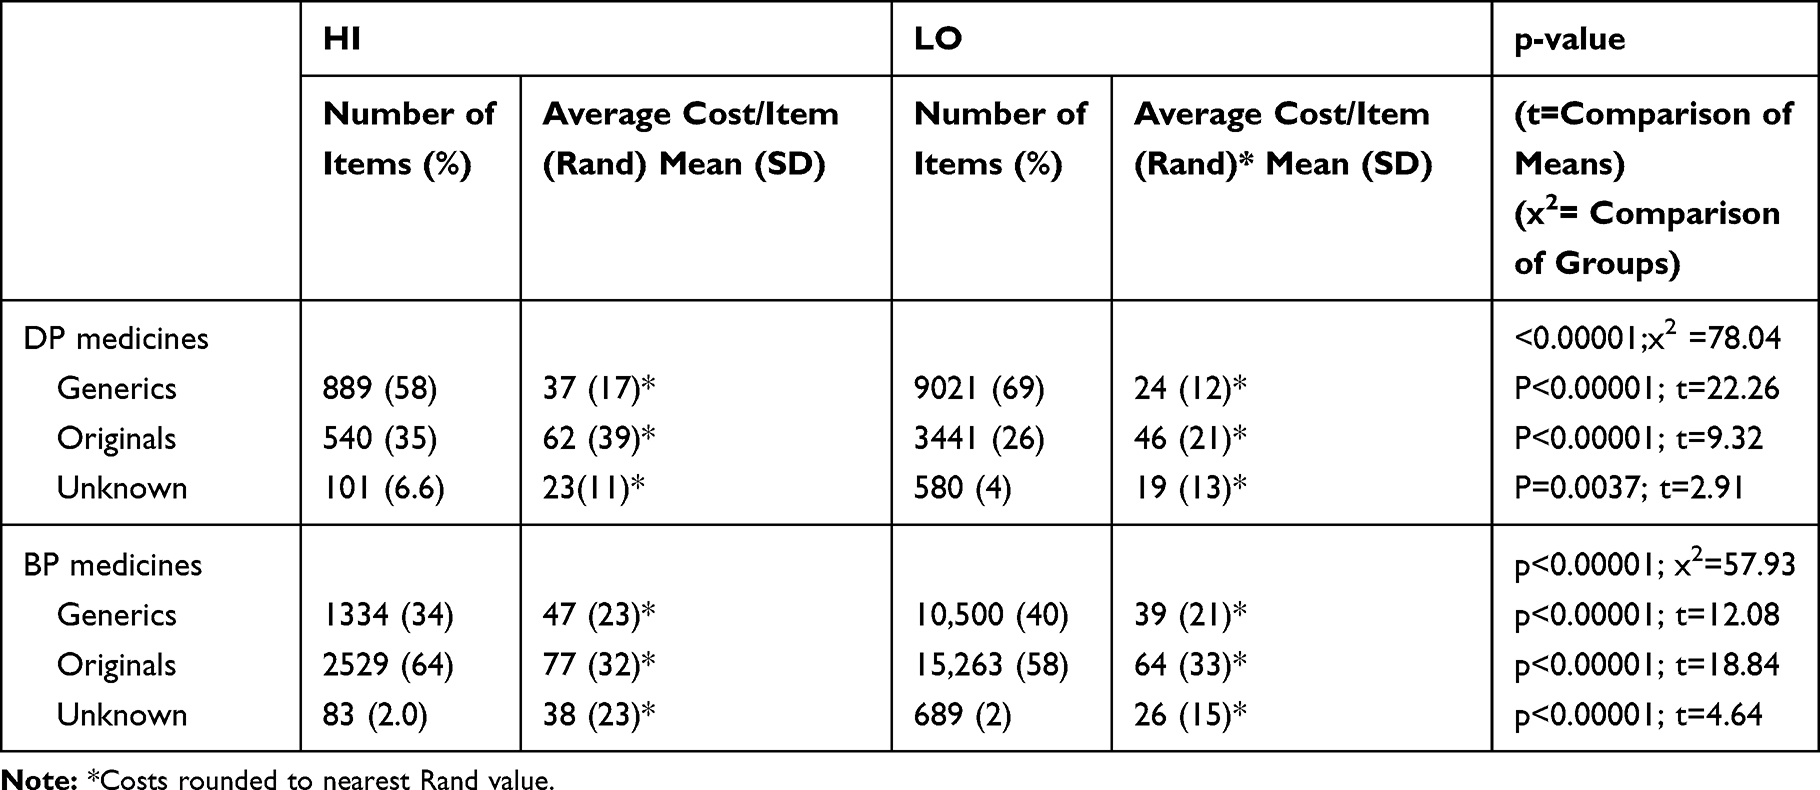 |
Table 5 Comparison of Frequency and Cost of Generic vs Original Products According to Claims for DP vs BP Medicines in ATC Category RO5X |
In Table 6 results of multivariate regression analysis are shown for both plans, with PAT/OTC claimed amount as the dependent variable and a number of independent variables (age, gender, number of GP and specialist encounters, cost of DP medicines, number of chronic diseases and per-beneficiary hospital costs). Univariate analysis was first carried out for the latter variables and all with p<0.02 were entered into the multivariate analysis. Results showed that in both HI and LO, higher PAT/OTC costs were related to advancing age. Neither plan showed that there was less use of GPs or GP-prescribed medicines if beneficiaries accessed the PAT/OTC benefit. In the LO plan there was less use of the PAT/OTC benefit by beneficiaries who had more registered chronic diseases and/or who consulted specialists to a greater extent.
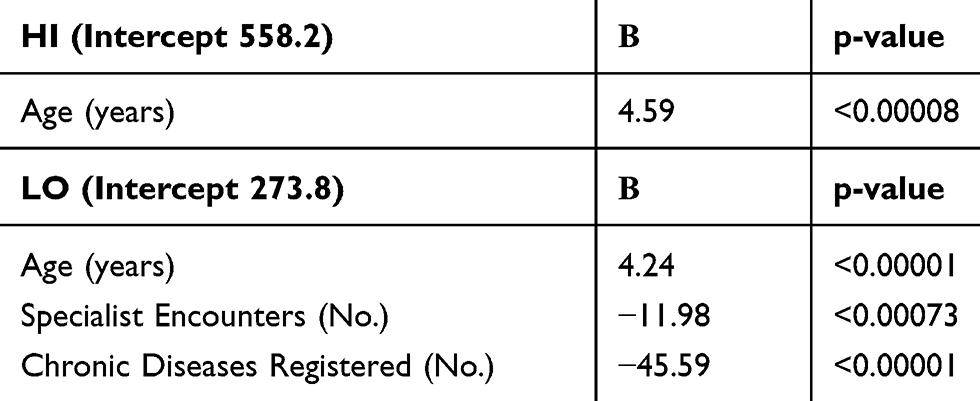 |
Table 6 Multivariate Linear Regression Results for HI and LO Plans with PAT/OTC Costs as Dependent Variable |
Discussion
Prior to legislative changes in 1998, medical scheme contributions/premiums were based on the risk profile of beneficiaries.10 Thus, elderly and/or chronically ill patients paid higher contributions, were given life-long exclusions for pre-existing conditions or were denied membership completely. This resulted in medical scheme membership often becoming unaffordable to those who needed it most. Furthermore, medical schemes were empowered to impose monetary limits on benefit categories. This discriminatory scenario resulted in the drafting and promulgation of a new Act, ensuring that medical schemes could not discriminate based on risk profiles, and making it compulsory for every medical scheme to accept all eligible applicants, irrespective of age and/or ill-health. The legislation also mandated a comprehensive package of “hospitalizable” and chronic medical conditions, identified in the Act and Regulations as Prescribed Minimum Benefits (PMBs) and the Chronic Disease List (CDL).5 In addition, amendments to the Medicines and Related Substances Act prevented pharmacies and dispensing doctors from profiting from the production and distribution of medicines.11 These legislative changes have impacted positively on medical schemes’ expenditure.12 However, the costly nature of the mandatory services for PMBs and the CDL has resulted in significant cost shifting towards medical scheme beneficiaries in the area of primary health care (PHC). As more money was required for funding of the prescribed (and costly) chronic conditions and services, less and less of each Rand spent on health-care benefits went towards services provided by PHC providers such as GPs and pharmacies.13 In addition to being allowed to place much of the burden of PHC costs on their beneficiaries, medical schemes were permitted to implement strategies for cost containment. In the case of OTC medicines, these included monetary limits, co-payments at the point of service, and savings accounts in order to create incentives for beneficiaries to manage their own utilization. These so-called demand-side initiatives may deter beneficiaries from accessing services unnecessarily. Medical schemes may also add supply-side initiatives, for example, contract with designated dispensing doctors and/or pharmacies in order to obtain medicines at preferential prices. Formularies of “approved medicines” or “recommended price lists” may also be devised that will only cover full costs if adhered to, exposing beneficiaries to the risk of out-of-pocket payments.14
As reported by others, there is a complex inter-relationship between medical scheme benefit richness, demographic profile and cost of the cover.3 This is illustrated in Table 3 which shows demographics of the HI and LO plans. Gender and ethnicity were similar for the two, but comment is necessary in respect of the latter. Whereas ethnicity is usually extremely important in South Africa as a marker of historical socioeconomic status, it is less relevant in the context of medical scheme membership because all beneficiaries are required to pay the same contributions. As such, most beneficiaries would be within similar socioeconomic categories, with those in the HI plan able to afford the higher contributions and vice versa.15 The higher average age of 47yrs in the HI plan vs 28yrs in LO no doubt had an impact on medicines utilization. Multivariate analysis showed that age was a significant determinant of PAT/OTC utilization, and because there were more older beneficiaries in HI, one would expect this to impact on overall utilization in HI. This can be seen in Table 4 which shows that for both BP and DP medicines a significantly higher percentage of beneficiaries in the HI plan submitted claims vs those in LO. Along similar lines, given the younger age profile in LO and the known relationship between a medical scheme’s benefit richness and its costs of membership, it is probable that the LO plan would have been selected by beneficiaries not only on the basis of affordability, but also because they were younger and healthier. This was confirmed in Table 3 by the significantly lower average number of chronic diseases registered by members in the LO plan.
Tables 4 and 5 show clearly that beneficiaries in HI consistently had higher average costs for S0-S2 medicines than those in LO, whether in the DP or BP category. There are three main reasons for this. The first is that the benefit design in a HI plan operates on a “use or lose” basis. Beneficiaries pay a higher annual contribution in HI and have fairly generous health-care benefits. However, if benefits such as those for acute and/or PAT/OTC medicines are not used by the end of the year they are forfeited and the cycle repeats the following year. Consequently, beneficiaries may opt for higher-cost products rather than lose funds they could use. Doctors, pharmacists and beneficiaries are aware of the differences between HI and LO plans and as such there may be a tendency to utilize higher-priced products in HI. This leads to the second reason for the medicines cost variation between HI and LO. Table 5 shows clearly that generic products cost less than originals, and also that beneficiaries and the pharmacists who assisted them utilized original products to a greater extent than when doctors prescribed these S0-S2 medicines. Pharmacies are for-profit entities and their business strategies may include opportunities to maximize profit. Regarding the third possible reason for higher costs, our previous study showed clearly the extent to which profit can be made on the S0-S2 category medicines.8 Whether analgesics, anti-inflammatories, cough medicines or other OTC products, the marketplace abounds with large numbers of products that have similar chemical compositions but are priced very differently. Legislation exists that requires manufacturers to declare a fixed “exit price,” but how that price is actually determined by a manufacturer is not a requirement of the law.16 Whether the OTC products are prescribed by a doctor, selected by the beneficiary or recommended by a pharmacist, it is frequently in the pharmacist’s control as to which products are actually dispensed.
The purpose of the multivariate analysis shown in Table 6 was a) to explore variables related to BP costs and b) to ascertain whether there was evidence of reduction in costs of other health-care services. Already mentioned is that for both plans it was the older beneficiaries who accessed the PAT/OTC benefit to a greater extent. The unexpected finding that PAT/OTC costs were lower for beneficiaries in the LO plan who had more chronic diseases registered with the plan and/or consulted specialists to a greater extent requires further study, but suggests that sicker beneficiaries did not “indulge” in this benefit. Perhaps they were treated more-appropriately by specialists and received care (including chronic medicines) that would have been fully funded via the risk pool. Notably, giving beneficiaries access to an OTC/PAT benefit did not appear to reduce visits to a GP, to reduce prescriptions for S0-S2 medicines, or to be associated with lower hospital costs, i.e., there was no apparent beneficial impact on so-called downstream costs.
According to the literature, direct patient access to pharmacist and/or self-prescribed medication is becoming increasingly important within health-care systems, promoting empowerment and potentially reducing costs.17–19 It is also stated that partnerships between stakeholders who provide education and information may maximize the value of benefits and minimize risk.19 The present study suggested a limited ability of this PAT/OTC benefit to reduce costs. Some 60–70% of the beneficiaries accessed the BP benefit. If one multiplies the average amount paid by each beneficiary by the number of claiming beneficiaries in the HI and LO plans then overall amounts paid out for S0-S2 BP medicines over the year were substantial: R1.94m for HI and R8.74m for LO. Expressed as the cost to the plans in terms of total cost/total number of scheme beneficiaries, this then translates to about R394 per beneficiary per annum (pbpa) in HI and about R164 pbpa in LO. This derivation of a pbpa cost is routinely used by actuaries in costing annual premiums for the range of benefits offered by each medical scheme. Putting this into perspective, the Council for Medical Schemes Annual Report for the same year as this study showed that for the total population of covered lives in the medical schemes industry, the average cost of obstetricians/gynecologists services was R189 pbpa, and for physicians was R257 pbpa.20 These figures show that this study’s widely used BP benefit was within the range of total beneficiary access to some essential and expensive medical specialist services. The greater use of S0-S2 original vs generic products in both plans (64% in HI and 58% in LO) and the higher average cost of the BP medicines in comparison to the DP medicines point to the cost ineffectiveness of the BP benefit when left to pharmacists and/or beneficiaries to manage. In addition, in HI there were short payments of ±R40 for BP medicines for the beneficiary to pay out-of-pocket. Not even this additional cost at the point-of-service appears to have led beneficiaries to question whether equivalent products were available at a lower price. Consequently, it would not be unreasonable for medical schemes to consider reducing annual medical scheme premiums/contributions by the relevant amounts, leaving beneficiaries completely responsible for self-medication. This could lead to greater vigilance on the part of beneficiaries and pharmacists, particularly when it comes to the type of product provided and the costs thereof.
Limitations
In addition to the abovementioned reasons for cost differences between benefit plans and BP and DP categories, one should ideally also consider cost-reducing strategies such as the “managed care” initiatives via contracted network doctors and pharmacists in the lower benefit plan. Such initiatives, which were not explored in the present study, imply contractual obligations to prescribe and dispense lower-cost product equivalents.21 There is also the possibility that costs were impacted by geographic distribution or purchasing behavior of LO vs HI beneficiaries. For example, pharmacies servicing LO beneficiaries might have been situated in areas that operated off a lower cost base and perhaps charged lower dispensing and administration fees. Alternatively, LO beneficiaries might have made more use of corporate/chain pharmacies that were able to secure medicines at lower prices vs HI plan beneficiaries who might have preferred to use their “personal” community pharmacies.22 It was not possible from the dataset to identify which OTC products were entirely selected by beneficiaries and which recommended by pharmacists.
Conclusion
Within these two medical scheme benefit plans, there were higher costs and greater use of original products when beneficiaries or pharmacies accessed S0-S2 medicines via the PAT/OTC benefit than when these medicines were prescribed by doctors. In an era in which there is much criticism of the private sector and the role of doctors in driving health-care costs up doctors appeared to be more cost-effective in providing access to S0-S2 medicines when compared to the same range of medicines bought by beneficiaries or recommended by a pharmacist. In this study, it was not possible to determine the extent to which pharmacists were driving costs in comparison to beneficiaries. This is an issue worth pursuing in the future. The richness of a benefit plan was also a factor driving costs, with S0-S2 medicines costing more when provided by the high-benefit plan compared to the lower plan. The higher cost of S0-S2 medicines in the higher benefit plan was most likely not related to better or more-effective medicines because within these schedules one is essentially dealing with similar chemical compounds, often combined in differing concentrations, but priced differently. Results of this study indicate that access to a PAT/OTC benefit did not impact doctor encounters or hospitalization. Given that the annual expenditure by medical schemes on OTC medicines runs into the billions of Rands one must ask whether cost savings and cost-effectiveness could be improved by eliminating the benefit. This would encourage individuals to pay greater attention to the value proposition of the products they are purchasing. An alternative would be education of beneficiaries by medical schemes on the subject of OTC medicines, more in the way of supply- and demand-side interventions, and careful monitoring of benefit utilization, but medical schemes might argue that the return would not be worth the investment.
Acknowledgment
We thank Mrs Sandra Benn, University of Witwatersrand, Faculty of Health Sciences registrar (symbol A A-level in English and a BA (Hons)) for the language editing.
Disclosure
The authors report no conflicts of interest in this work.
References
1. Ncube NBQ, Solanki GC, Kredo T, Lalloo R. Antibiotic prescription patterns of South African general medical practitioners for treatment of acute bronchitis. S Afr Med J. 2017;107:119–122. doi:10.7196/SAMJ.2017.v107i2.11276
2. Ramjee S, Vieyra T Neither here nor there: the South African medical scheme industry in limbo.
3. Kaplan J, Ranchod S. Analysing the structure and nature of medical scheme benefit design in South Africa. In: padarath A, King J, English R, editors. S Afr Health Rev. 2014/15;1:165–178.
4. McLeod H, Ramjee S. Medical schemes. In: Harrison S, Bhana R, Ntuli A, editors. Available from: http://www.hst.org.za/publications/South%20African%20Health%20Reviews/SAHR2007.pdf.
5. Medical Schemes Act 131 of 1998, regulations. Available from: https://www.gov.za/sites/default/files/a131-98.pdf.
6. South African Health Products Regulatory Authority. Consolidated Schedules. Available from: https://www.sahpra.org.za/?s=consolidated+schedules.
7. The Innovation Pharmaceutical Association of South Africa (IPASA) Available from: https://www.google.com/search?q=scheduling+ipasa&rlz=1C1GCEU_enZA819ZA819&sxsrf=ALeKk03Kp4GXpecfCbTvplpTVuciqO2tKQ:1587363482583&source=lnms&tbm=isch&sa=X&ved=2ahUKEwi3zIjkrfboAhWVqHEKHeUiAg0Q_AUoAXoECAwQAw&biw=1365&bih=622#imgrc=OSLtYvqI5ZfKXM.
8. Padayachee N, Rothberg AD, Truter I, Butkow N. Utilization of over-the-counter analgesics in two private medical insurance schemes in South Africa. Drug, Healthc Patient Saf. 2019;11:37. doi:10.2147/DHPS.S194347
9. World Health Organisation. The Anatomical Therapeutic Chemical Classification System with defined daily doses. Available from: http://www.who.int/classifications/atcddd/en/.
10. Wayburne L, Bradley E Maintaining a balance: the impacts of ageing on the age cross-subsidy in medical scheme contributions.
11. Medicines and Related Substances Act 101 of 1965. Available from: https://www.gov.za/sites/default/files/41762_gon703.pdf.
12. Council for Medical Schemes. Available from: http://www.compcom.co.za/wp-content/uploads/2020/02/CMS-PMB-Review-consultative-doc.pdf.
13. Doherty J, McLeod H. Medical Schemes. S Afr Health Rev. 2002;1:41–66.
14. Kaplan J, Ranchod S An actuarial perspective on medical scheme benefit design. Actuarial Society of South Africa 2015. Available from: https://actuarialsociety.org.za/convention/convention2015/wp-content/uploads/2015/10/2015-KaplanRanchod.pdf.
15. Edwards T Socio-demographic determinants of health-seeking behaviour among the South African population: an analysis of NIDS. Masters’ Thesis; 2016. Available from: https://www.datafirst.uct.ac.za/dataportal/index.php/citations/6022.
16. Bangalee V, Suleman F. Towards a transparent pricing system in South Africa: trends in pharmaceutical logistics fees. S Afr Health Rev. 2016;1:221–231.
17. Saba H, Shivananda KS, Jayan M, Hussain CA. Prevalence of self-medication practices and its associated factors in rural Bengaluru, Karnataka, India. Int J Commun Med Pub Health. 2017;3:1481–1486.
18. Bennadi D. Self-medication: A current challenge. J Basic Clin Pharm. 2014;5:19–23. doi:10.4103/0976-0105.128253
19. Hughes CM, McElnay JC, Fleming GF. Benefits and risks of self-medication. Drug Saf. 2001;24:1027–1037. doi:10.2165/00002018-200124140-00002
20. Council for medical schemes, annual report 2013–2014 Available from: https://www.medicalschemes.com/files/Annual%20Reports/AR2013_2014LR.pdf.
21. Making health insurance work for the low-income market in South Africa. Cost drivers and strategies Available from: https://cenfri.org/wp-content/uploads/2009/08/Making-health-insurance-work-for-the-low-income-market-in-South-Africa_Cenfri-FinMark-Trust-Elixir-Fifth-Quadrant_August-2009.pdf.
22. Capetalk. Available from: http://www.capetalk.co.za/articles/12197/independent-community-pharmacies-unite-to-fight-bulling-by-medical-aids.
 © 2020 The Author(s). This work is published and licensed by Dove Medical Press Limited. The full terms of this license are available at https://www.dovepress.com/terms.php and incorporate the Creative Commons Attribution - Non Commercial (unported, v3.0) License.
By accessing the work you hereby accept the Terms. Non-commercial uses of the work are permitted without any further permission from Dove Medical Press Limited, provided the work is properly attributed. For permission for commercial use of this work, please see paragraphs 4.2 and 5 of our Terms.
© 2020 The Author(s). This work is published and licensed by Dove Medical Press Limited. The full terms of this license are available at https://www.dovepress.com/terms.php and incorporate the Creative Commons Attribution - Non Commercial (unported, v3.0) License.
By accessing the work you hereby accept the Terms. Non-commercial uses of the work are permitted without any further permission from Dove Medical Press Limited, provided the work is properly attributed. For permission for commercial use of this work, please see paragraphs 4.2 and 5 of our Terms.