")
Back to Journals » ClinicoEconomics and Outcomes Research » Volume 6
Out-of-pocket cost of managing sick newborns in Enugu, southeast Nigeria
Authors Ekwochi U, Osuorah DC , Ndu IK, Ezenwosu OU, Amadi OF, Nwokoye IC, Odetunde OI, Ulasi OT, Orjioke CJ
Received 18 September 2013
Accepted for publication 16 October 2013
Published 16 January 2014 Volume 2014:6 Pages 29—35
DOI https://doi.org/10.2147/CEOR.S54674
Checked for plagiarism Yes
Review by Single anonymous peer review
Peer reviewer comments 3
Uchenna Ekwochi,1 D Chidiebere Osuorah,3 Ikenna K Ndu,1 Osita U Ezenwosu,2 Ogechukwu F Amadi,1 Ikenna C Nwokoye,1 O Israel Odetunde2
1Department of Pediatrics, Enugu State University Teaching Hospital, Parklane, Nigeria; 2Department of Pediatrics, University of Nigeria Teaching Hospital, Enugu, Nigeria; 3Child Survival Unit, Medical Research Council (UK), The Gambia unit, Fajara, The Gambia
Background: Neonatal illnesses usually require long hospital stays and specialized care and/or facilities, which usually results in huge medical bills. With more than 70% of people in Nigeria living on less than US$2 per day, these bills are not affordable to many families' livelihoods.
Aim: This study aims to determine the average cost of managing neonatal illnesses in Enugu in southeast Nigeria and the proportion of family income spent on these illnesses. It further seeks to ascertain the cost of various components in the management of neonatal diseases.
Methods: This is a longitudinal and descriptive study involving 106 newborns admitted to the sick baby unit of the Enugu State University Teaching Hospital and the out-of-pocket medical expenditure in the management of their illnesses.
Results: A hundred and six newborns participated in the study. All (100%) medical bills were out-of-pocket payments, and 103 (97.2%) of these were catastrophic health expenditure (more than 10% of total family monthly income). The average duration of hospital stay and cost of managing a neonatal illness was 12.86±8.81 days and ₦36,382±19,389.72 (US$223±119), respectively. This expenditure amounted to 157%, 71%, and 25% of total monthly family income for the low, middle, and upper socioeconomic class families, respectively, with a mean percentage of 85%. Families with a total monthly income of less than ₦10,000 (US$61), ₦10,000–49,999 (US$61–306), and ₦50,000–100,000 (US$306–612) and more than ₦100,000 (US$612) on average spent 683%, 108%, 54%, and 20% of their monthly income on their newborn's illness. Hospital and utility bills compared with bills accruing from drug and laboratory investigations account for a significantly larger proportion of total cost incurred in neonatal sepsis (₦23,499±14,987 [US$144±92], P=0.001), low birth weight (₦39,863±24,003 [US$224±147], P=0.001), severe anemia (₦40,504±13,923 [US$248±85], P=0.001), transient tachypnea of the newborn (₦10,083±1,078 [US$62±7], P=0.001), birth asphyxia (₦24,398±14,096 [US$149±86], P=0.001), and meningitis (₦26,731±7,675 [US$164±47], P=0.001), whereas cost for laboratory investigations was significantly higher for neonatal jaundice (₦11,690±3,169 [US$72±19], P=0.001). There was a strong positive correlation between duration of hospital stay and total medical cost incurred (r=0.897, P=0.001).
Conclusion: Health expenditure on neonatal illness is high and leads to catastrophic expenditure for the majority of households in the state. There is a need for effective health insurance schemes to help subsidize and cushion this disastrous and impoverishing health expenditure on families for improved neonatal survival in Nigeria.
Keywords: neonatal illness, out of pocket, health expenditure, Enugu State
Introduction
The newborn period (first 28 days of life) represents a critical period in the survival of an infant. There is high morbidity and mortality risk as the newborn, with its inherent immunological deficits, adapts to extrauterine life. Common causes of morbidity and mortality in our environment include perinatal asphyxia, prematurity/low birth weight (LBW), and infections.1,2 Neonatal mortality in Nigeria is unacceptably high. A recent report in 2010 put it at 40/1,000 live births,3 making it the highest in Africa and the second highest globally, and contributing about 8% of the annual global neonatal deaths.3 Reducing the neonatal mortality rate in Nigeria is critical to attainment of Millennium Development Goal 4.
Illness in this period of life usually requires a higher level of specialized care, longer duration of hospital stay, especially for the preterm infant, and use of specialized facilities, resulting in huge medical bills. These bills are usually out of pocket (OOP), as government spending on health in sub-Saharan Africa (including Nigeria) is inadequate, insufficient, inequitable, and unsustainable.4 The private expenditure on health in Nigeria is high and is at least 79%,5 indicating that OOP expenditure is a major source of health care financing in Nigeria.
OOP expenditure on health is defined as direct and indirect expenses incurred by an individual and/or household to secure or maintain their health. It is part of the private health expenditure and it includes service user fees, consultation fees, health insurance contributions, medical equipment, drug costs (traditional/spiritual healers and medicine costs), and laboratory tests. Additional costs may include costs for nutritional supplements, transport costs, and care and support costs. There are some associated opportunity (indirect) costs, such as loss of production cost and loss of earnings incurred during neonatal illness. These indirect costs may be difficult to measure, especially among casual and semiskilled workers. According to the 2010 World Health Statistics, OOP cost as a percentage of private health expenditure in Nigeria is 95.9%, indicating that governments at all levels are not making adequate investment in health and that there are few insurance payment mechanisms for health care.
Some households are tipped into financial catastrophe when the OOP expenditure exceeds a threshold of household expenditure.6 The commonly accepted generic threshold level is 10% of the total household expenditure.7 This threshold represents an approximate level beyond which the household is forced to sacrifice other basic needs and sell productive assets, incur debt, or become impoverished.8 In a setting in Nigeria, OOP spending on newborn health care has been shown to consume 133.4% of the combined family income.9 Most of the time, families are ill-prepared for such huge OOP expenditure, due to limited income and lack of prior knowledge of the average financial implications of newborn health care.
In our environment, data on OOP expenditure for common newborn diseases are limited, and the available data are out of date due to inflation rates in the economy. This study therefore seeks to determine the current OOP cost of managing sick newborns in Enugu, which will also be a reflection of similar cost in Nigeria. It is hoped that the findings of this study will strengthen provision of health insurance and other health policies in Nigeria that will help lessen the financial burden for neonatal care on families, which will, in turn, help improve newborn survival in Nigeria.
Methodology
Study design and setting
This is a cross-sectional descriptive and analytical study of neonates hospitalized in the neonatal unit of Enugu State University Teaching Hospital (ESUTH), Enugu, which is the capital city of Enugu State, Nigeria. This study was carried out over a 1-year period (June 2012 to May 2013). ESUTH is one of the two tertiary health institutions in the state providing health services to a catchment population of about 2,125,068 people as at 2005, with an average annual growth rate of 3%.10 It draws clientele from families of different socioeconomic classes from the entire state and also the neighboring communities from the surrounding states of Anambra, Delta, Abia, Ebonyi, Kogi, and Imo.
Enugu, the host town of ESUTH, is located on latitude 6° 27´N and longitude 7° 30´E.11 It was nicknamed the coal city because coalmining activities were the driving force to the city’s growth in the 20th century. Today its economy is dependent mainly on industry, manufacturing, and commerce. The industries include brewing and soft drink manufacture and merchandise, steel, cement and pharmaceutical manufacture, and palm oil production. The majority of the inhabitants are Igbo by tribe, and Christianity is by far the dominant religion.
The minimum monthly income, similar to the national average, is  18,000 (US$111).9 Literacy rate is 66%, which is higher than the national literacy rate of 45%, and there are 955 males per 1,000 females.10 The fertility rate and neonatal mortality rate, similar to the national mean, are 5.5 births per woman10 and 40 per 1,000 live births,3,13 respectively.
Study variables
Following informed consent from parents and/or caregivers, a proforma was opened for all newborns on admission by the resident doctors on duty at the neonatal unit, who were trained in how to complete the proforma. Information on age, sex, and gestation week at birth were collected. The antenatal cards were used where mothers could not recall their last menstrual period and/or birth date, and approximate estimation based on landmark events done in other cases where the antenatal card was not available. Weight at birth, mother’s and father’s income, and highest educational attainment were also recorded.
During hospitalization of sick neonates, a compulsory and initial deposit of 1,500 (US$9) is paid to the hospital account department and a receipt is issued. This payment is recorded in the patient’s folder and subtracted from the final bill to be paid to the hospital on discharge. With the receipt issued, the hospitalized neonate is then given a cot in the neonatal unit and care/management of the patient commenced.
When drugs are prescribed, if the hospital has the prescribed drugs in stock, they are supplied to the patients, who pay at that point and collect a purchasing receipt, which is submitted to the doctor on duty for documentation in the newborn’s profoma. If, however, the drug is not available in the hospital pharmacy, the patient’s relatives are required to purchase the drugs from privately owned pharmacies or drug stores located outside the hospital and still submit the purchasing receipt to the doctor on duty for documentation. The same trend is also observed for laboratory investigations. Where drug prescriptions or laboratory requests are made but parents cannot afford to pay for them, the actual cost of these is obtained from the hospital billing list and recorded in the baby’s proforma but marked “unpaid for.” After the neonate is discharged, the hospital folder is sent to the accounts department, where the hospital and utility bills are calculated, and the parents pay the hospital, collect a receipt, and submit it to the doctor on duty for documentation in the proforma. The total OOP cost is then computed by the investigators from the records in the proforma, and this comprises the cost of drugs purchased, laboratory investigations carried out, and the hospital and utility bill.
The hospital and utility bill includes admission fee (handling and service charges), ward bills (nursing, ward orderly service, water, electricity, and hospital bed charges), incubator bills, phototherapy bills, oxygen bills, and other consumables. It consists in large part of nonrecurrent items used during hospitalization. The drug and laboratory-related bills are fees that accrue from drugs and laboratory services used in the patient’s management. Due to inconsistencies, and because receipts are usually not issued for travel (money spent on travel to and from the hospital during index illness of their child) and food (money spent on food and related expenses for caregivers), these expenses were excluded from the calculation of the final cost incurred during index admission of their neonates.
Diagnosis of neonatal illness was made using clinical information and, where necessary, laboratory reports by a specialist pediatrician and confirmed by a second specialist. Where there was a disagreement in diagnosis, a neonatologist was consulted to evaluate the neonate and make an independent assessment and diagnosis. There was concordance of diagnosis in 98% of cases between the two initial assessors.
Duration of hospital stay was calculated from admission to hospital discharge. Additional days stayed in the hospital due to inability to settle the hospital bill immediately after discharge by some families was not included in duration of hospital stay during neonatal illness.
Total family monthly income was created by summing the monthly income of the father and mother of the neonate with, where applicable, the monthly income of any relative in the household who contributed to the household expenses. The families were then stratified into five income groups based on the combined monthly earning of the household into no earning (for households that had none or no reliable monthly income), less than 10,000 (US$62), 10,000–49,999 (US$62–310), 50,000–100,000 (US$310–620), and more than 100,000 (>US$620). Using Olusanya et al’s14 classification scale, validated for developing countries, families were also grouped into three socioeconomic classes (upper, middle, and lower) based on the highest education attainment of the mother and the father’s occupation.
Participant selection
Two hundred and one newborns were hospitalized during the review period. Thirty-seven of them (18%) died while in hospital, and 164 (82%) were discharged alive. Of these 164 neonates, 24 (15%) were excluded because the parents declined consent, whereas 34 (21%) were excluded because of failure of parent and/or caregiver to comply with the requirements set out during the obtaining of consent: eg, producing all receipts of hospitalization-related expenses. A final sample size of 106 neonates were found to be eligible and were enrolled in the study (Figure 1).
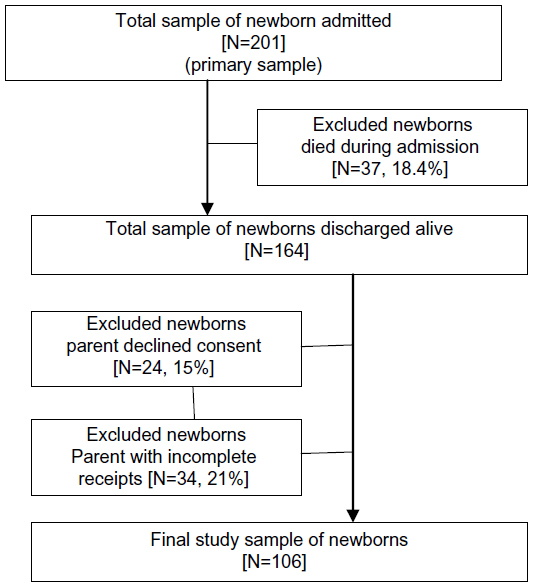 | Figure 1 Selection procedure. |
Results
One hundred and six newborns were enrolled in this study. Table 1 shows the descriptive characteristics of neonates enrolled in the study. Sixty-one (58%) of the hospitalized newborns were male and 45 (43%) were females. Seventy-two (68%) were born in the hospital, and the remaining 34 (32%) were noninstitutional births. The majority (103 [97%]) of the newborns’ households spent more than 10% of their total monthly income on the index illness of their newborn (catastrophic health expenditure), whereas only three (3%), all from the upper socioeconomic class, spent less than 10% of their total monthly incomes. Most (72 [68%]) of the newborns were hospitalized for 2 weeks or less, whereas 34 (32%) stayed for more than 2 weeks from admission. The mean duration of hospital stay and mean total hospital expenditure were 12.86±8.81 days and 36,382.24±19,389.27, respectively.
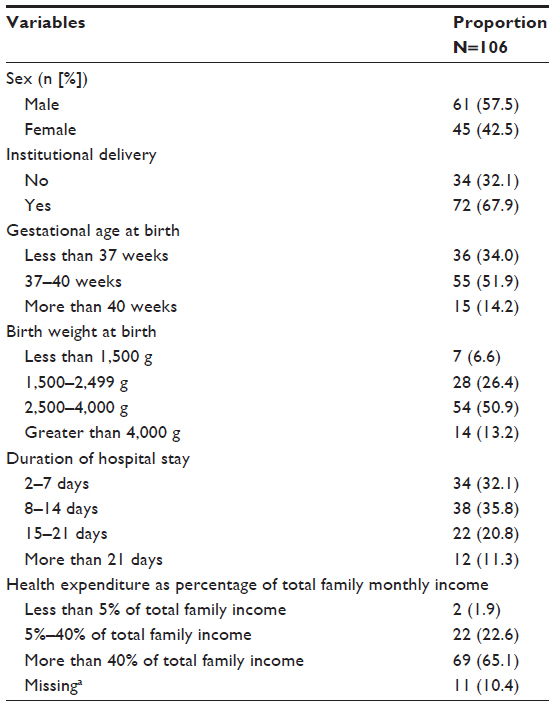 | Table 1 Characteristics of hospitalized neonates |
Table 2 shows the various neonatal illnesses encountered during the study, the mean hospital stay due to the illnesses, and the mean cost accrued from managing them. Neonatal sepsis (NNS) caused the highest number of admissions, accounting for 65 (61%) of all neonatal admissions during the period under review, with a mean duration of hospital stay of 15.3±9.6 days and a wide range of 4–50 days. The mean expenditure for treatment of NNS was 42,611 (US$265), with hospital and utility bills accounting for significantly more (23,499 [54%]) of this expenditure (P=0.001). LBW and necrotizing enterocolitis (NEC) required the longest hospital stay. LBW, which was responsible for 18 (17%) hospitalizations, resulted in a mean hospital stay of 23.6±13.5 days (range 6–55 days) and was third only to severe anaemia and necrotizing enterocolitis in terms of cost required for management. Analysis shows that, on average, it costs families 54,969 (US$340) for the management of this condition. Likewise, families part, on average, with 56,755 (US$352) for treatment of the relatively uncommon cases of NEC, which accounted for only two (2%) of the cases seen in this study. Just like for NNS, hospital and utility bills accounted for the largest proportion of the total expenditure in the management of this condition, at 39,863 (US$248, 66%), compared with drugs at 9,267 (US$58, 15%) and laboratory tests at 11,472 (US$71, 19%) for LBW (P=0.001), and hospital and utility bills accounted for 40,340 (US$251, 65%) compared with drugs at 9,115 (US$57, 15%) and laboratory tests at 12,950 (US$80, 21%) for NEC (P=0.978).
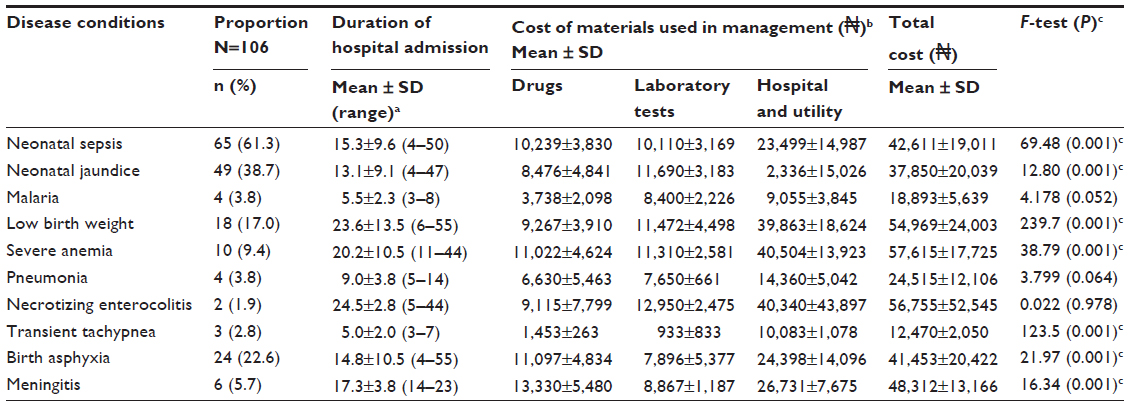 | Table 2 Statistics of proportions, duration of hospital stay, and comparative expenditure incurred in treatment of neonatal illnesses |
Similar trends were also seen in anemia, birth asphyxia, and meningitis, where hospital and utility bills accounted for a significant proportion of the total hospital bill: ie, 40,504 (US$252, 64.5%), 24,398 (US$152, 56.2%), and 26,731 (US$166, 54.6%), respectively (P=0.001). Exception to this was seen in management of neonatal jaundice (NNJ), which accounted for 49 (38.7%) recorded hospital admissions and an average hospital stay of 13.1±9.1 days with a range of 4–47 days. Here, expenditure due to laboratory tests accounted for 11,690 (US$73, 52.0%) of the mean total expenditure compared with 8,476 (US$53, 37.7%) and 2,336 (US$15, 10%) for drugs and hospital and utility bills (P=0.001). There was a strong positive correlation seen between length of hospital stay and total hospital bill (r=0.898, P=0.001).
Due to financial constraints, parents could not buy all drugs and/or pay for all laboratory investigations required for proper treatment of their sick newborns. The most affected were the low and middle income families that spent 157% and 71%, respectively, of their total monthly income on the index illness. Twenty-four (60%) and 24 (59%) low and middle income families, respectively, compared with ten (40.0%) in the upper socioeconomic class could not provide all drugs and/or tests needed for optimal management of their sick newborn (P=0.240).
Similarly, eight (73%), four (40%), 27 (66%), twelve (49%), and seven (37%) households with no earnings, less than 10,000 (US$62), 10,000–49,999 (US$62–310), 50,000–100,000 (US$310–620), and more than 100,000 (US$620), respectively, were not able to completely cope with the financial demands associated with drug and/or laboratory tests for proper management of their newborns (P=0.120) (see Table 3). This however did not attain statistical significance.
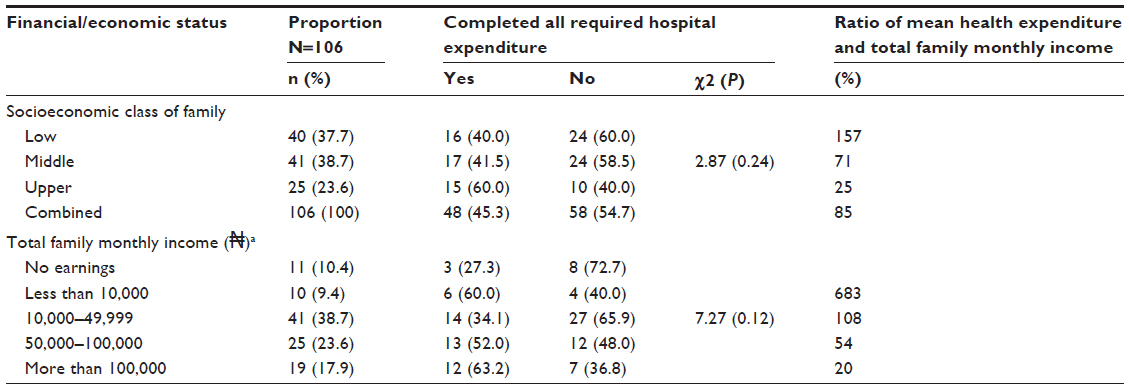 | Table 3 Implications of hospital expenditure on family income |
Discussion
We found from this study that, on average, medical expenditure for the management of neonatal illness in Enugu was high (36,383 [US$223], about twice the average minimum wage in Nigeria) and that 100% of this expenditure was OOP private health expenditure. The overall medical expenditure for LBW seen in this study (54,969 [US$341]) was 1.7 times the cost of managing a similar illness in the same age group in a similar analysis done in Ibadan, western Nigeria, 5 years ago14 (31,641 [US$247]: exchange rate US$1 = 128.1 at the time of the study). This increase in the cost of care could be attributed to a high rate of inflation. This is because as the purchasing power of the country’s currency depreciates (evident by a wide difference between the dollar rate 5 years ago, US$1 =128.1, and now, US$1 =161.1) with time, the cost of goods and services, including that of hospital services, increases.
The OOP health expenditure seen in this study further corroborates the 2010 World Health Statistics, which put the mean private health expenditure in Nigeria at 96%.15 This proportion of health cost from private expenditure is alarming, unacceptably high, and mostly catastrophic to many families across socioeconomic and income strata, as was also seen in this study, in a country where a majority of people live on less than US$2 per day.
Infants with LBW, severe anemia, and NEC not surprisingly had the longest hospital stay and largest average total medical bill seen in this study. This could be attributed to the long observation period, rigorous and repeated investigations, and sometimes slow progress usually associated with these conditions. This long hospital stay not only exposes the neonates to hospital-acquired and iatrogenic infections but also proportionately increases hospital and utility bills, which, in turn, increase the total hospital bill. The relationship between these two variables (ie, length of admission and total hospital bill) was seen from the findings of this study as strong, positive, and highly and significantly correlated.
The hospital and utility bills that consisted largely of fees from use of nonrecurrent items significantly accounted for a higher percentage of the total medical costs for all of the neonatal illnesses encountered in this study except for NNJ. Here, bills accruing from laboratory investigation accounted for a significantly larger portion of the total medical bill. It is fair to say that for a country as rich as Nigeria, with the second-largest economy in Africa and as the fifth-largest oil exporter in the world, this bill should be subsidized by the government, as is the policy in countries like Gambia, which is poorer than Nigeria.
Because of the problem of affordability and poorly equipped laboratories in resource-poor settings like ours, most doctors and specialists usually try to reach clinical diagnosis using history, clinical signs, and symptoms. Unlike the hospital and utility bills that are mandatory and must be paid for by families of all hospitalized neonates, the laboratory fee is not compulsory for management of all neonatal illnesses except in diagnostic dilemmas. Experienced doctors may decide to skip some laboratory investigations and treat based on tentative diagnosis. The relatively higher cost of the laboratory bill in the management of NNJ seen in this study is easily explainable in our setting. This is because in the management of NNJ (using either phototherapy or exchange blood transfusion in more severe cases), parents and/or caregivers are required to pay for several serum bilirubin (SB) tests (ranging from five to ten, depending on the expertise of the managing doctor and the severity of the case). This test (SB) in our setting is the gold standard for assessing progress made in reducing the serum levels of bilirubin for any form of treatment given. The cost for a single SB test varies depending on whether it is done within or outside the hospital. All these challenges put parents and/or caregivers in a very difficult position in paying for laboratory tests, thus adding to the financial burden of their hospitalized neonates.
Because of the exorbitant cost in managing neonatal illness, no socioeconomic class or income category was able to completely afford all required investigations or drugs in the proper management of their newborns. The worst affected were families lower down the socioeconomic class and income strata. One could speculate that this trend may partly explain why Nigeria still ranks top among countries with the highest neonatal and child mortality in Africa, despite been one of the largest economies and richest countries in Africa.16
The Nigerian Government, through relevant health ministries and relevant parastatals, should implement free medical treatment for vulnerable groups in our society (including children aged under 5 years and childbearing women) such as is done in South Africa and other relatively poorer countries in Africa where health care is provided free of charge for these vulnerable groups. Also, there is a need for a sound universal health insurance coverage system that covers all families and individuals no matter what their employment or socioeconomic status is.
Limitation
The total family monthly income of families whose neonates were hospitalized was based on parental recall. There was no objective proof like a pay slip or check requested by the authors to confirm this information. Participants were assured only of confidentiality and that what they earned would not affect the final medical bill or care of their neonates. Recall bias or lie bias might have led to inaccuracies, leading to misclassification of income and socioeconomic class. It is therefore recommended that the findings of this study be interpreted with caution in the light of this limitation.
Conclusion
Despite this limitation, the OOP expenditure for neonatal diseases in Enugu, Nigeria, is catastrophic for most families. There is an urgent need for changes in health policy and funding for vulnerable newborns in the region.
Acknowledgment
We thank the hospital management for the ethical clearance to carry out this study. Special thanks to the newborns and their families for consent to participate in this study. We are also very grateful to Dr Ani and Dr Agwu for their contribution in proforma filling and data collection.
Authors’ contributions
U Ekwochi developed the study and wrote the introduction with IK Ndu. IK Ndu, OU Ezenwosu, OF Amadi, IC Nwokoye, and OI Odetunde supervised the data collection and contributed to the writing and review of the final draft of the manuscript. The methodology was done by U Ekwochi and DIC Osuorah. Statistical analysis of the data, the results sections, and the abstract were written by DIC Osuorah. Discussion and conclusion was written with equal contributions from all authors.
Disclosure
The authors report no conflicts of interest in this work.
References
Mukhtar-Yola M, Iliyasu Z. A review of neonatal morbidity and mortality in Aminu Kano Teaching Hospital, Northern Nigeria. Trop Doctor. 2007;37(3):130–132. | |
Okechukwu A, Achonwa A. Morbidity and mortality patterns of admissions into the special care baby unit of university of Abuja Teaching Hospital Gwagwalada Nigeria. Niger J Clin Prat. 2009;12(4):389–394. | |
Federal Ministry of Health. Saving Newborn Lives in Nigeria: Neonatal Health in the Context of Integrated Maternal, Neonatal and Child Health Survey. 2nd ed. Abuja, Nigeria: Federal Ministry of Health. 2011. | |
Hoare G. Policies for financing the health sector. Health Policy Plan. 1987;2(1):1–16. | |
Hsiao W. Why Africa needs a new approach to financing health services for the poor. African flagship course on health sector reform and sustainable financing, South Africa, 2003. | |
Xu K, Evans DB, Kawabata K, Zeramdini R, Klavus J, Murray CJ. Household catastrophic health expenditure: a multicountry analysis. Lancet. 2003;362:111–117. | |
Pradham M. Social risk management: options for medical care in Indonesia. Health Economics J. 2002;11:431–446. | |
Russell S. The economic burden of illness for household in developing country. A review of studies focusing on malaria, TB and HIV/AIDS. Am J Trop Med Hyg. 2004;71(2):147–155. | |
National Minimum Wage Act 2011. Explanatory Memorandum. | |
Nigerian Population Commission. State and local government demographic profile:1991–2010, Abuja, Nigeria. | |
Wikipedia. Enugu Available from: http://en.wikipedia.org/wiki/Enugu. Accessed November 1, 2013. | |
UNICEF. At a glance: Nigeria. Available from: http://www.unicef.org/infobycountry/nigeria_statistics.html. Accessed November 1, 2013. | |
The World Bank. Country data and summary statistics. Available from: http://data.worldbank.org/indicator/SP.DYN.TFRT.IN/countries. Accessed November 1, 2013. | |
Olusanya O, Okpere E, Ezimokhai M. The importance of social class in voluntary fertility control in a developing country. West Afr J Med. 1985;4:205–212. | |
Tongo OO, Orimadegun AE, Ajayi SO, Akinyinka OO. The economic burden of preterm/very low birth weight care in Nigeria. J Trop Pediatr. 2009;55:262–264. | |
World Health Organization Report. World Health Statistics 2010. Available from: http://www.who.int/gho/publications/world_health_statistics/2010/. Accessed November 1, 2013. |
 © 2014 The Author(s). This work is published and licensed by Dove Medical Press Limited. The full terms of this license are available at https://www.dovepress.com/terms.php and incorporate the Creative Commons Attribution - Non Commercial (unported, v3.0) License.
By accessing the work you hereby accept the Terms. Non-commercial uses of the work are permitted without any further permission from Dove Medical Press Limited, provided the work is properly attributed. For permission for commercial use of this work, please see paragraphs 4.2 and 5 of our Terms.
© 2014 The Author(s). This work is published and licensed by Dove Medical Press Limited. The full terms of this license are available at https://www.dovepress.com/terms.php and incorporate the Creative Commons Attribution - Non Commercial (unported, v3.0) License.
By accessing the work you hereby accept the Terms. Non-commercial uses of the work are permitted without any further permission from Dove Medical Press Limited, provided the work is properly attributed. For permission for commercial use of this work, please see paragraphs 4.2 and 5 of our Terms.