")
Back to Journals » OncoTargets and Therapy » Volume 12
Osteoglycin (OGN) Inhibits Cell Proliferation and Invasiveness in Breast Cancer via PI3K/Akt/mTOR Signaling Pathway
Authors Xu T, Zhang R, Dong M, Zhang Z, Li H, Zhan C, Li X
Received 12 July 2019
Accepted for publication 18 November 2019
Published 4 December 2019 Volume 2019:12 Pages 10639—10650
DOI https://doi.org/10.2147/OTT.S222967
Checked for plagiarism Yes
Review by Single anonymous peer review
Peer reviewer comments 2
Editor who approved publication: Dr Jianmin Xu
Tao Xu,1 Rui Zhang,1 Menglu Dong,1 Zeyu Zhang,2 Hanning Li,1 Chenao Zhan,3 Xingrui Li1
1Department of Thyroid and Breast Surgery, Tongji Hospital, Tongji Medical College of Huazhong University of Science and Technology, Wuhan, Hubei 430030, People’s Republic of China; 2Department of Obstetrics and Gynecology, Tongji Hospital, Tongji Medical College, Huazhong University of Science and Technology, Wuhan, Hubei 430030, People’s Republic of China; 3Department of Radiology, Tongji Hospital, Tongji Medical College, Huazhong University of Science and Technology, Wuhan, Hubei 430030, People’s Republic of China
Correspondence: Xingrui Li
Department of Thyroid and Breast Surgery, Tongji Hospital, Tongji Medical College of Huazhong University of Science and Technology, Wuhan, Hubei 430030, People’s Republic of China
Tel +86-27-8366 5317
Email [email protected]
Introduction: Previous studies have indicated that the small leucine-rich proteoglycan (SLR) osteoglycin (OGN) is downregulated in various cancers, including squamous cervical carcinoma, gastric cancer, and colorectal adenoma, indicating that OGN is a putative tumor suppressor. However, its exact role in the pathology of human cancers, especially breast cancer (BC), is not clear.
Methods: The expression of OGN in BC tissues was examined using qRT-PCR. Online databases were employed to analyze the correlation between OGN expression and clinicopathological characteristics. CCK-8 assay, colony formation assay, transwell migration and invasion assays were applied to detect cell proliferation, colony formation, migration and invasion of BC cells, respectively. Xenograft tumor models were constructed to explore the role of OGN on tumor growth in vivo.
Results: OGN expression was reduced in 24 paired BC samples compared with normal tissue. Decreased expression of OGN was correlated with greater pathological grade, a more aggressive tumor subtype, and poor overall survival. In vitro experiments showed that OGN overexpressed by plasmid transfection significantly inhibited cell proliferation, colony formation, migration, and invasion of BC cell lines. In xenograft tumor models, overexpression of OGN repressed the growth of MCF-7 cells in vivo and alleviated the compression of the tumor on surrounding structures. We also observed that OGN expression reversed EMT via repressing the PI3K/Akt/mTOR pathway.
Conclusion: This study revealed that OGN could function as a tumor suppressor during breast carcinogenesis, and we contribute new evidence to the body of research on the SLRP family.
Keywords: breast cancer, osteoglycin, small leucine-rich proteoglycans, epithelial to mesenchymal transition, PI3K/Akt/mTOR signaling pathway
Introduction
Breast Cancer (BC) is one of the most common cancers in the world. In 2018, there were 2.1 million new cases of breast cancer worldwide and 0.63 million BC-related deaths.1 Due to the heterogeneity of the tumor, the emergence of drug resistance, and tumor metastasis in some patients, breast cancer is still a major public health problem and economic drain.2
Small leucine-rich proteoglycans (SLRPs) are, as their name suggests, a family of extracellular proteoglycans with several leucine-rich repeats.3 The SLRPs are mainly localized in the extracellular matrix (ECM) and regulate ECM assembly and cell signal transduction.4,5 They can bind and communicate with other proteins such as insulin growth factor receptors,6 epidermal growth factor receptors,6 Toll-like receptors,7 and various cytokines.8 Recent research has shown that SLRPs have significant effects on the regulation of cancer proliferation and progression. Some members of the SLRPs are well studied. Decorin, as an example, has oncosuppressive properties, such as regulating the innate immune response,9 inducing endogenous p21 synthesis,10 growth inhibition, and inhibition of metastasis.11 Lumican, another SLRP, can provoke EMT reprogramming,12 affect major MMPs expression, and inhibit tumor invasion ability.13 It has also been shown to act as a tumor suppressor.14–16
The vital biological role of Osteoglycin (OGN), a SLRP family member with seven leucine-rich repeats, in tumorigenesis is being uncovered. Decreased expression of OGN compared with normal tissue was found in various types of cancer, such as squamous cervical carcinoma, vaginal cancer,17 gastric cancer,18 colorectal adenoma,19 and laryngeal carcinoma.20 In colorectal cancer, higher OGN expression is an indicator of increased survival and decreased cancer recurrence. OGN can also reverse epithelial to mesenchymal transition (EMT) by suppressing the EGFR/AKT/Zeb-1 axis.21 In murine hepatocarcinoma, overexpression of OGN in Hca-F cells by plasmid DNA transfection decreased the cells’ lymphatic metastatic potential both in vitro and in vivo.22 Meanwhile, tumor-suppressor activity was observed in mouse melanoma cell lines as overexpression of OGN increased stress-triggered cell death while reduction of OGN attenuated cell death.23 Despite these studies indicating that OGN expression is reduced in tumors, further research is necessary to elucidate the nature of OGN’s function in the pathology of cancer, especially breast cancer.
Based on results from previous research, we believe that OGN plays an important role in the tumorigenesis and progression of BC. In this study, we develop an in-depth understanding of the function of osteoglycin in breast cancer and provide a potential therapeutic target for the treatment of BC.24
Materials and Methods
Tissue Samples
A total of 24 pairs of cancerous and adjacent normal breast tissue were obtained from patients who underwent surgery at the Department of Thyroid and Breast Surgery, Tongji Hospital, Tongji Medical College of Huazhong University of Science and Technology. All samples were immersed in RNAlater solution at 4 °C overnight and then stored at −80 °C. All patients signed informed consent forms, and the ethics committee of Tongji Hospital approved the experiments on the tumor tissue.
Cell Culture
Breast cancer cell lines MCF-7 and MDA-MB-231 were obtained from the Chinese Academy of Science cell bank (Wuhan, China). The cell lines were authenticated by using short tandem repeat (STR) DNA profiling (ABI 3730XL Genetic Analyzer, Life Technologies, Waltham, MA, USA). MDA-MB-231 cells were cultured in L-15 (HyClone, Logan, UT, USA) supplemented with 100 U/mL penicillin/streptomycin (Invitrogen) and 10% FBS (Gibco) at 37 °C. MCF-7 cells were cultured in DMEM (Invitrogen) at 37 °C with 5% CO2. All cells used in experiments were within 30 passages.
Transfection and Pharmacological Treatment
The MCF-7 and MDA-MB-231 cells were grown in six-well plates to almost 50%-60% or 70%-80% confluence, respectively, and transfected with 2.0 µg empty vector (pENTER) or OGN plasmid using X-tremeGENE HP DNA Transfection Reagent (Roche) according to the manufacturer’s instructions. After transfection for 48 h, the cells were harvested and used for subsequent experiments. The expression of OGN was assessed using quantitative real-time polymerase chain reaction (qRT-PCR) and Western blot analysis (WB).To investigate the PI3K/Akt/mTOR pathway, OGN overexpression cells were incubated with PI3K/AKT activator 740Y-P (50ug/mL, MCE, China) for 90 min.25
qRT-PCR
Total RNA was extracted from the tissues or cells using TRIzol reagent (Invitrogen). OGN expression was then measured in triplicate using SYBR Green qPCR Mix (Toyobo, Shanghai, China). Primer sequences were as follows: OGN Forward: 5´- TCTACACTTCTCCTGTTACTGCT −3´, OGN Reverse: 5´- GAGGTAATGGTGTTATTGCCTCA −3´; GAPDH Forward: 5´- CTCACCGGATGCACCAATGTT −3´, GAPDH Reverse: 5´- CGCGTTGCTCACAATGTTCAT −3´. Relative mRNA expression was calculated using the 2−ΔΔCT method and GAPDH was used as an internal control.
Western Blot Analysis
Western blotting was performed as previously described.26 The following antibodies were used: anti-GAPDH, anti-α-Tubulin, anti-OGN, anti-E-cadherin, anti-N-cadherin, anti-Vimentin, anti-Snail1, anti-ZEB1, anti-p-Akt, anti-p-mTOR, anti-AKT, and anti-mTOR. Anti-GAPDH, anti-α-Tubulin, and anti-OGN were purchased from Proteintech (Wuhan, China). The rest were bought from Cell Signaling Technology (Danvers, MA, USA). Membranes were incubated with a species-matched HRP-conjugated secondary antibody for 1 h. GAPDH and α-Tubulin were used as loading controls to quantify the results.
Cell Counting Kit-8 (CCK-8) Assay and Clone Formation assay
For the CCK-8 assay (CK04, Dojindo Kumamoto, Japan), after transfection for 48 h, about 3,000 MCF-7 or MDA-MB-231 cells were resuspended in 100 µL DMEM or L-15 and placed into 96-well plates. The optical density (OD) at 450 nm was measured from 24 h to 96 h using a microplate reader, and each experiment was performed≧3 times. For the clone formation assay, 1,000 cells were plated in six-well plates and cultured for approximately two weeks. The cells were fixed in 4% paraformaldehyde solution at room temperature for 10–15 min and then stained with 0.5% crystal violet (Servicebio, Wuhan, China) at room temperature for 10–15 min. The number of colonies was counted for statistical analysis.
Transwell Invasion and Migration Assay
The transwell invasion and migration assays were performed as described previously.27 In brief, after transfection for 48 h, about 5 × 10⁴ MDA-MB-231 cells in 200 µL L-15 with 10% FBS were plated onto the upper chamber coated with 50 µL Matrigel. In the lower chamber, 500 µL medium with 40% FBS was used as a chemotactic agent. The cells were then incubated for about 36 h. Cells in the upper filters were removed by cotton swab under flowing water, and invaded cells were fixed in 4% paraformaldehyde at room temperature for 10–15 min and then stained with 0.5% crystal violet at room temperature for 10–15 min. For the migration assay, the upper chamber was not coated with Matrigel, and the incubation time was about 19 h. Cells that passed the membrane were counted in five random fields per chamber. Experiments were conducted more than two times.
In vivo Xenograft Tumor Model
Four- to six-week old BALB/c nude mice (female) were purchased from the Beijing HFK Bio-Technology Co., Ltd and fed under standard pathogen-free conditions, with five mice in each group. A sample of 1 × 10⁶ MCF-7 cells with OGN overexpression or 100 µL of cell-free PBS and Matrigel mixture (1:1) was injected into the right axilla of the mice with “Z-shaped” needle insertion method. Tumor size was measured every three days with a vernier caliper using the following formula: 0.5*L*W2, where “L” is long axis and “W” is the minor axis of the tumor. Before the nude mice were sacrificed, magnetic resonance imaging examination (plain scan and enhanced) was conducted to check the growth of tumors in the body. At the end of the experiment, tumor tissues were harvested and photographed. Immunohistochemistry (IHC) was conducted to verify the expression of OGN. All animal experiments were conducted in accordance with the Guide for the Care and Treatment of Laboratory Animals of Tongji Hospital and approved by the Ethics Committees of Tongji Hospital.
Immunohistochemistry (IHC)
In brief, paraffin tissue sections were incubated at 60 °C for 2 h and then dehydrated through an ethanol gradient. Tissue slides were sequentially incubated with 3% H2O2 and 10% goat serum blocking for 30 min at room temperature. Sections were then incubated in a 1:150 dilution of polyclonal rabbit anti-OGN at 4 °C overnight. 3,3-diaminobenzidine (DAB) was added for 1 min at room temperature in the dark. Protein expression was visualized under a microscope (Olympus Corp. Tokyo, Japan), and photos were taken for subsequent analyses. Histopathological evaluations were performed as described previously.28
Online Database Extraction
The GEPIA (http://gepia.cancer-pku.cn/index.html) online database was used to analyze the expression of OGN in an expanded sample size.29 A Kaplan–Meier plot (http://kmplot.com/) was used to analyze the relationship between the expression of OGN and the survival rate of patients with breast cancer. The online tool GOBO (http://co.bmc.lu.se/gobo/) was applied to find the genes that co-expressed with OGN as well as to analyze the correlation between OGN expression and clinicopathological characteristics.30 To explore potential functions of OGN, Gene Ontology (GO) enrichment and Kyoto Encyclopedia of Genes and Genomes (KEGG) pathway analyses were conducted by applying the DAVID program.
Statistics
Statistical analysis in this experimental study was completed by SPSS 22.0 and GraphPad 8.0. Comparisons between groups were analyzed using two-tailed Student’s t-tests and chi-square tests. The data are expressed as mean ± standard deviation. P < 0.05 is considered statistically significant, and “ns” represents P ≥ 0.05; “*” represents P < 0.05, “**” represents P < 0.01, and “***” represents P < 0.001.
Results
OGN is Downregulated in Breast Cancer Tissues and Associated with Poor Outcomes
Examination of OGN expression in breast cancer tissue showed that OGN expression was downregulated compared with adjacent normal tissue (Figure 1A). We verified the expression of OGN in an expanded sample size with 1,085 tumor samples and 291 normal tissue samples using the GEPIA online database (Figure 1B). We then examined possible correlations between OGN expression and clinicopathological characteristics by analyzing the GOBO database. As shown in Figure 1D–F, we found that OGN expression was significantly negatively associated with pathological grade (Figure 1D) and ER status (Figure 1E), and that decreased expression is correlated with a more aggressive tumor subtype (Figure 1F), suggesting that OGN plays a vital role in breast tissue health. Meanwhile, Kaplan–Meier analysis showed that low expression of OGN in BC patients had poor overall survival (OS) (Figure 1C).
 |
Figure 1 OGN is downregulated in breast cancer tissue and associated with poor outcomes. Notes: (A) OGN expression in tumor and normal breast tissue samples was detected by qRT-PCR. (B) Expression of OGN in the GEPIA database. (C) Overall survival analysis of BC patients with low and high OGN expression using the Kaplan-Meier Plotter. (D–F) Expression associated with OGN in the GOBO database in patients with breast cancer. *P <0.05 and ***P <0.001 vs normal tissue. Abbreviations: OGN, osteoglycin; qRT-PCR, quantitative real-time polymerase chain reaction; GEPIA, Gene Expression Profiling Interaction Analysis; OS, overall survive; BC, breast cancer. |
To further detect the potential role of OGN in breast cancer, GO and KEGG enrichment analyses were conducted. We found that OGN is mainly involved in the biological processes associated with extracellular matrix organization, cell adhesion, negative regulation of the JAK-STAT cascade, extracellular fibril organization, and cell division (Figure 2A). Moreover, ten KEGG pathways were overrepresented, including the PI3K-Akt signaling pathway, focal adhesion, pathways in cancer, ECM-receptor interaction, and the p53 signaling pathway (Figure 2B). The above results suggest that OGN may play an important role in the tumorigenesis and the progress of breast cancer. The level of OGN expression may be closely associated with the PI3K-Akt signaling pathway in breast cancer.
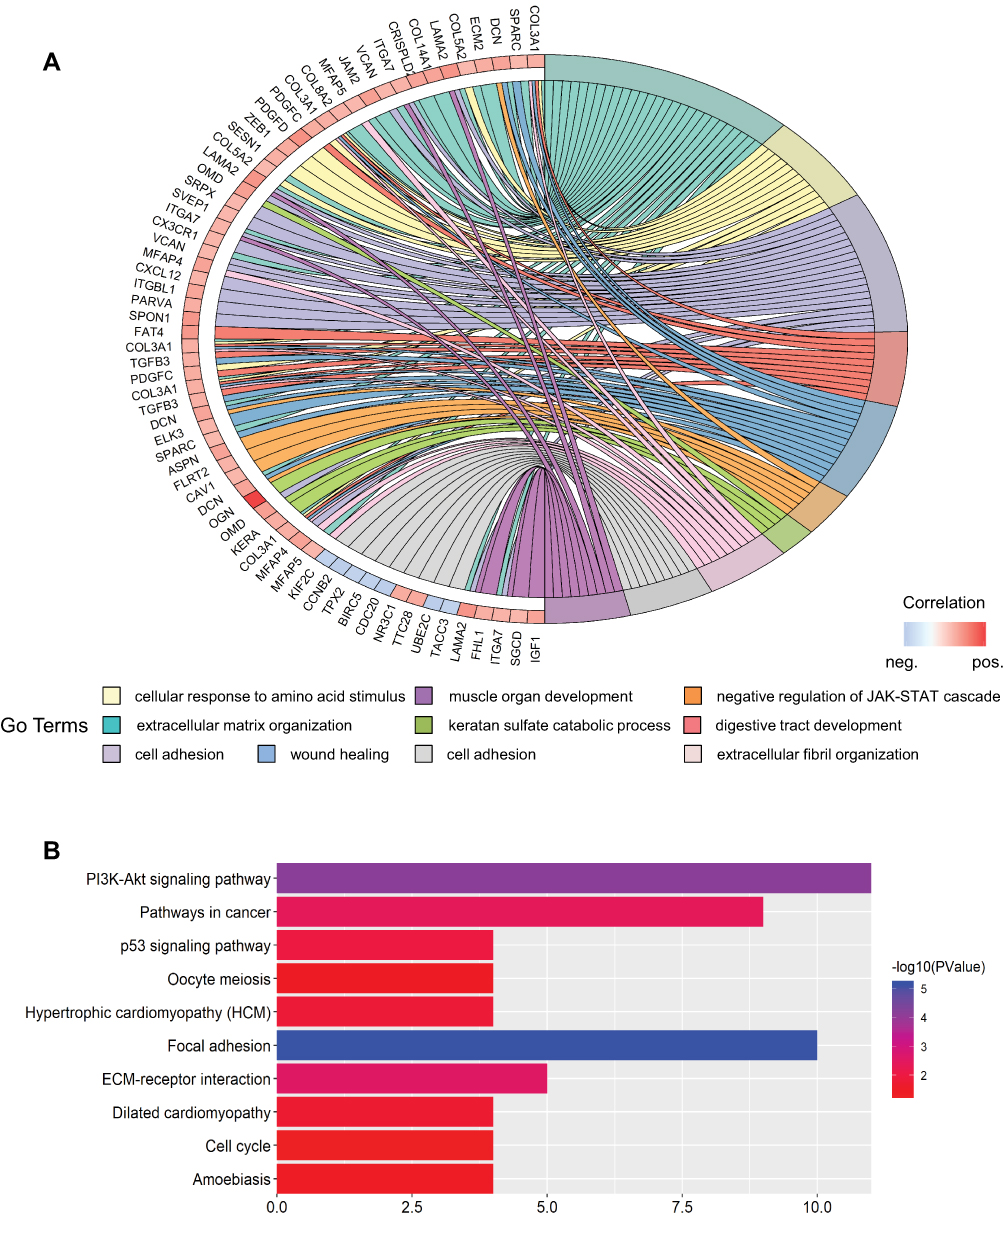 |
Figure 2 GO and KEGG enrichment analysis of genes co-expressed with OGN. Notes: (A) Top ten GO terms of genes co-expressed with OGN. (B) Top ten KEGG pathways enriched for these co-expressed genes. Abbreviations: GO, Gene Ontology; KEGG, Kyoto Encyclopedia of Genes and Genomes; OGN, osteoglycin. |
OGN Inhibits the Migration and Invasion of Breast Cancer Cells
Based on the expression pattern of OGN in breast cancer tissue and its significant correlation with the poor overall survival of breast cancer patients, further in vivo and in vitro study were conducted to get an in-depth understanding of the role of OGN in tumorigenicity. OGN-overexpressing cells were generated by plasmid transfection into MCF-7 and MDA-MB-231 cell lines. qRT-PCR and Western Blot were used to confirm OGN expression in the transfected cells (Figure 3A and B).
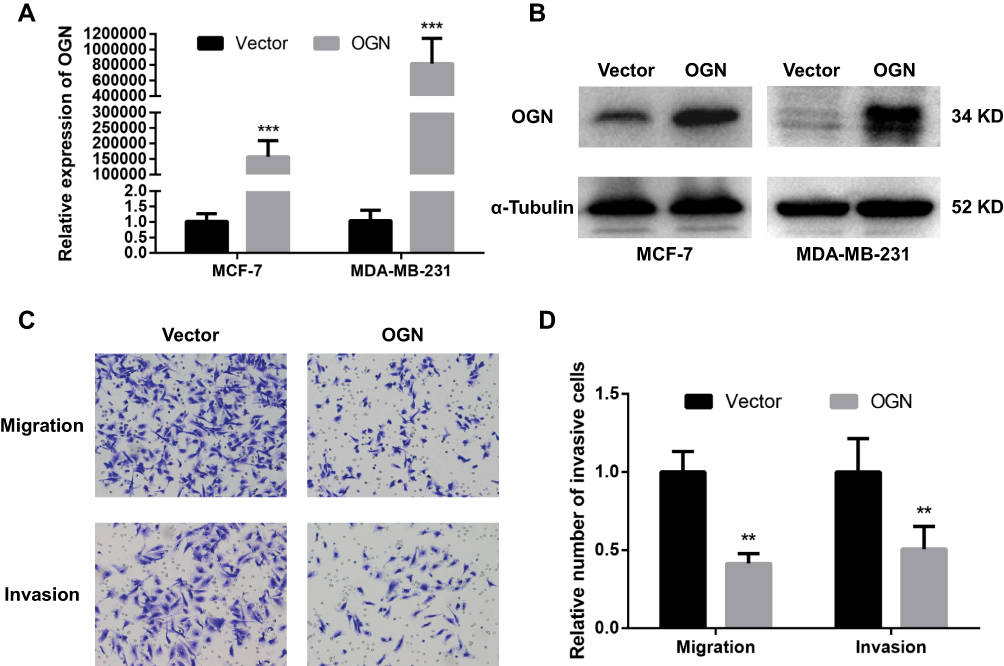 |
Figure 3 OGN overexpression inhibits the migration and invasion of breast cancer cells. Notes: The expression of OGN in MCF-7 and MDA-MB-231 cells transfected with the empty vector or OGN was determined by qRT-PCR (A) and Western blot (B) analysis after transfection for 48 h. (C and D) The effect of OGN on cell migration and invasion detected by Transwell assay (crystal violet stain; magnification, ×200). **P <0.01 and ***P <0.001 vs empty vector group. Abbreviations: OGN, osteoglycin; qRT-PCR, quantitative real-time polymerase chain reaction. |
To further investigate the effect of OGN on the migration and invasion of breast cancer cells, a Transwell migration assay was performed using the more invasive cell line MDA-MB-231 overexpressing OGN. After 19 h of incubation, cell migration was dramatically suppressed following OGN overexpression. The same results were obtained in the Transwell invasion assay (Figure 3C and D). Our findings indicate that OGN can inhibit the migration and invasion of breast cancer cells.
OGN Inhibits the Proliferation of Breast Cancer Cells
CCK-8 and colony formation assays were performed to assess the effect of OGN in cell proliferation. The CCK-8 assay showed that overexpression of OGN could impair the proliferation rate of MCF-7 and MDA-MB-231 cells compared with control cells (Figure 4C and D). Meanwhile, fewer colonies were found in the overexpression group in the colony formation assay (Figure 4A and B). These results imply that OGN expression inhibits the proliferation of breast cancer cells.
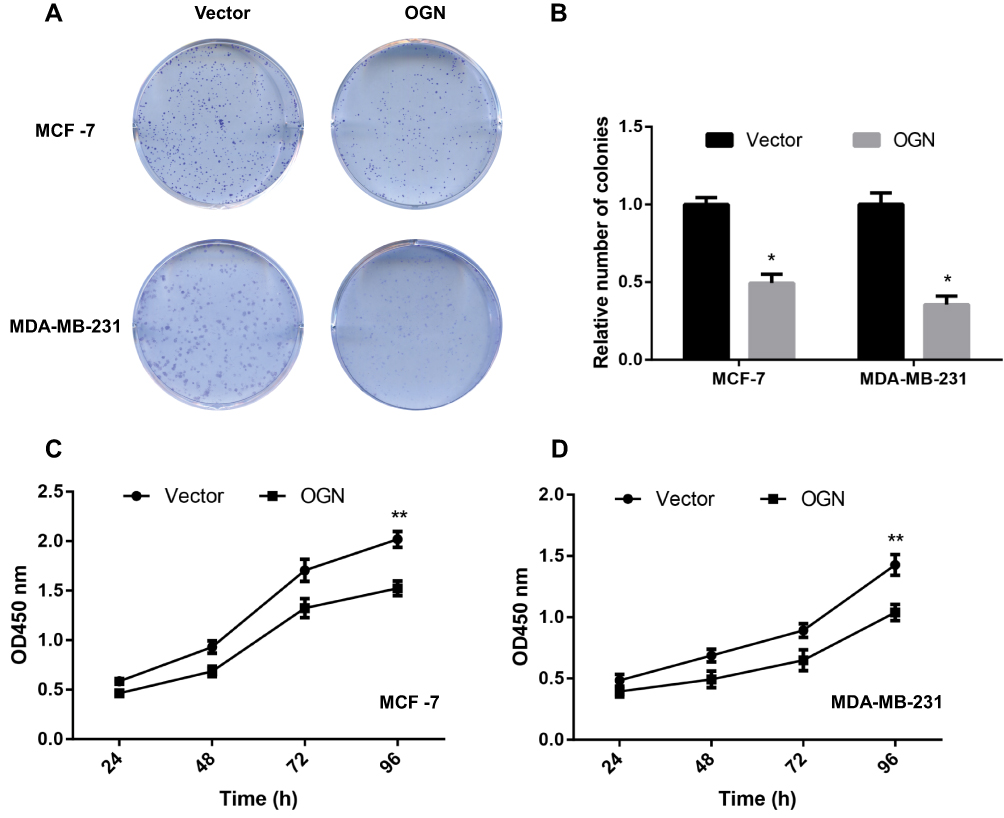 |
Figure 4 OGN overexpression inhibits breast cancer cell proliferation. Notes: MCF-7 and MDA-MB-231 cells were transfected with empty vector or OGN. (A and B) Colony formation assay was conducted to detect the effect of OGN on cell proliferation. (C and D) CCK-8 assay was used to detect the effect of OGN on cell proliferation in MCF-7 and MDA-MB-231 cells, respectively. *P <0.05 and **P <0.01 vs empty vector group. Abbreviations: OGN, osteoglycin; CCK-8, Cell Counting Kit-8. |
OGN Suppresses Epithelial-Mesenchymal Transition (EMT) in Breast Cancer Cells
Based on the bioinformatic analysis, we suspected that OGN represses the invasion and metastasis of breast cancer cells by inhibiting EMT, therefore, we performed Western blot to examine the expression of EMT-related proteins E-cadherin, a characteristic epithelial protein; interstitial characteristic protein Vimentin and N-cadherin; and transcription factors Snail1 and ZEB1. The epithelial-specific protein E-cadherin was upregulated in OGN-overexpressing cells compared with controls, while the interstitial proteins Vimentin and N-cadherin were downregulated, and the transcription factors Snail1 and ZEB1, which facilitate interstitial transformation, were also downregulated (Figure 5A–C). Our findings indicate that OGN likely inhibits the migration and invasion of breast cancer cells through the inhibition or reversion of EMT.
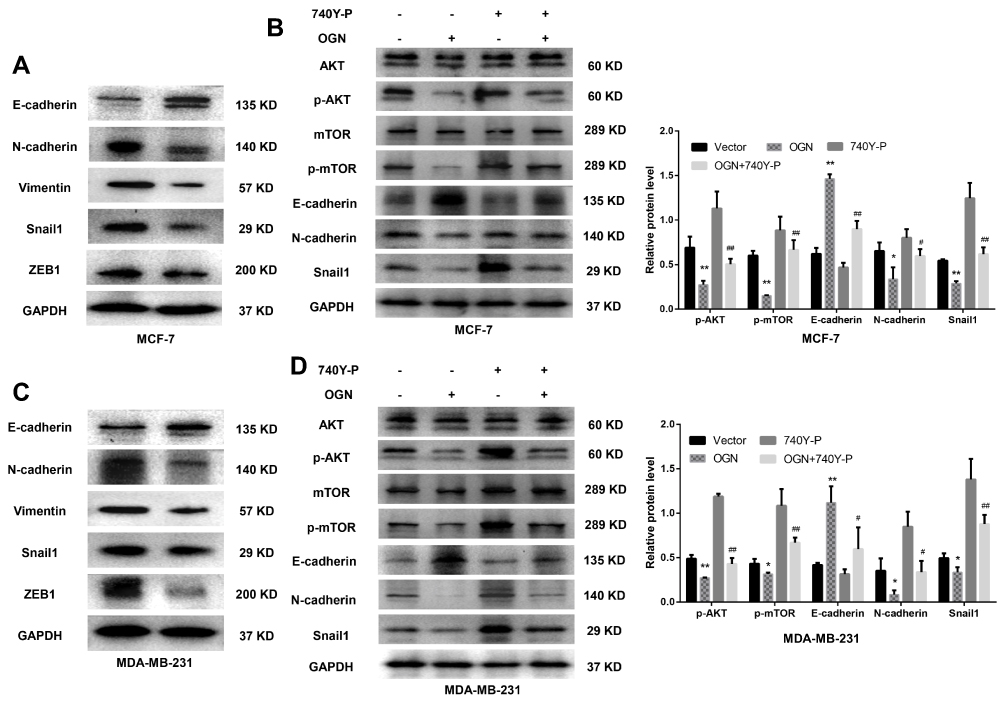 |
Figure 5 OGN overexpression inhibits EMT via the PI3K/Akt/mTOR pathway. Notes: (A) and (C) The expression levels of EMT-related proteins E-cadherin, N-cadherin, Vimentin, Snail1, and ZEB1 were detected by Western blot analysis in MCF-7 and MDA-MB-231 cells overexpressing OGN. (B) and (D) Following OGN over-expression, re-activation of the PI3K/Akt/mTOR pathway using 740Y-P partially reversed the increase in E-cadherin protein level and reversed the decrease in p-Akt, p-mTOR, N-cadherin, Snail1. *P <0.05 vs empty vector group, **P <0.01 vs empty vector group, #P < 0.05 vs OGN group, and ##P < 0.01 vs OGN group. Abbreviations: OGN, osteoglycin; EMT, epithelial-mesenchymal transition; PI3K, phosphatidylinositol 3ʹ kinase; Akt, serine/threonine kinase 1; mTOR, mechanistic target of rapamycin kinase; ZEB1, zinc finger E-box binding homeobox 1; Snail1, snail family transcriptional repressor 1. |
OGN Inhibited EMT via PI3K/Akt/mTOR Pathway
KEGG pathway enrichment analysis showed that the genes co-expressed with OGN may play a role in the PI3K/Akt/mTOR pathway (Figure 2B). Many studies have shown that activation of this pathway can promote EMT conversion.31–33 To explore the mechanism of OGN’s effect on EMT, we examined the expression of PI3K/Akt/mTOR pathway members in OGN-overexpressing cells. Western blot assay revealed that p-Akt, p-mTOR, and EMT-associated molecular biomarkers, such as N-cadherin and Snail1, were downregulated, whereas E-cadherin was upregulated.
Following activation of the PI3K/Akt pathway by activator 740Y-P (50 ug/mL, MCE, China) (Figure 5B–D), p-Akt, p-mTOR, N-cadherin, and Snail1 were upregulated compared with the untreated group, and E-cadherin was downregulated (Figure 5B–D). Further, we conducted a remediation experiment. After OGN overexpression, the re-activation of PI3K/Akt/mTOR pathway partially reversed the increase in E-cadherin protein levels (Figure 5B–D). Levels of other EMT-related molecular biomarkers, such as Snail1 and N-cadherin (Figure 5B–D), were influenced similarly. Taken together, the above results revealed that OGN reduces EMT by suppressing the PI3K/Akt/mTOR pathway.
OGN Inhibits the Proliferation of Breast Cancer Cells in vivo
To determine the effect of OGN on breast cancer cell proliferation in vivo, xenograft mouse models were established by injecting MCF-7 cells stably transfected with the pENTER empty vector or an OGN-overexpression plasmid into nude mice. Overexpression of OGN dramatically suppressed the growth rate of xenograft tumor, and the volume of the tumor was significantly reduced compared with the empty vector control (Figure 6B and C). MRIs were performed to observe the relationship between the tumor and the surrounding tissue. The tumors in both groups showed bulging growth, and overexpression of OGN resulted in tumors with reduced compression on surrounding structures such as the thoracic and upper limb joints (Figure 6A). Immunohistochemistry confirmed OGN overexpression in the xenograft tumors (Figure 6D and E). These results indicated that OGN inhibits the proliferation of breast cancer cells in vitro, as well as in vivo.
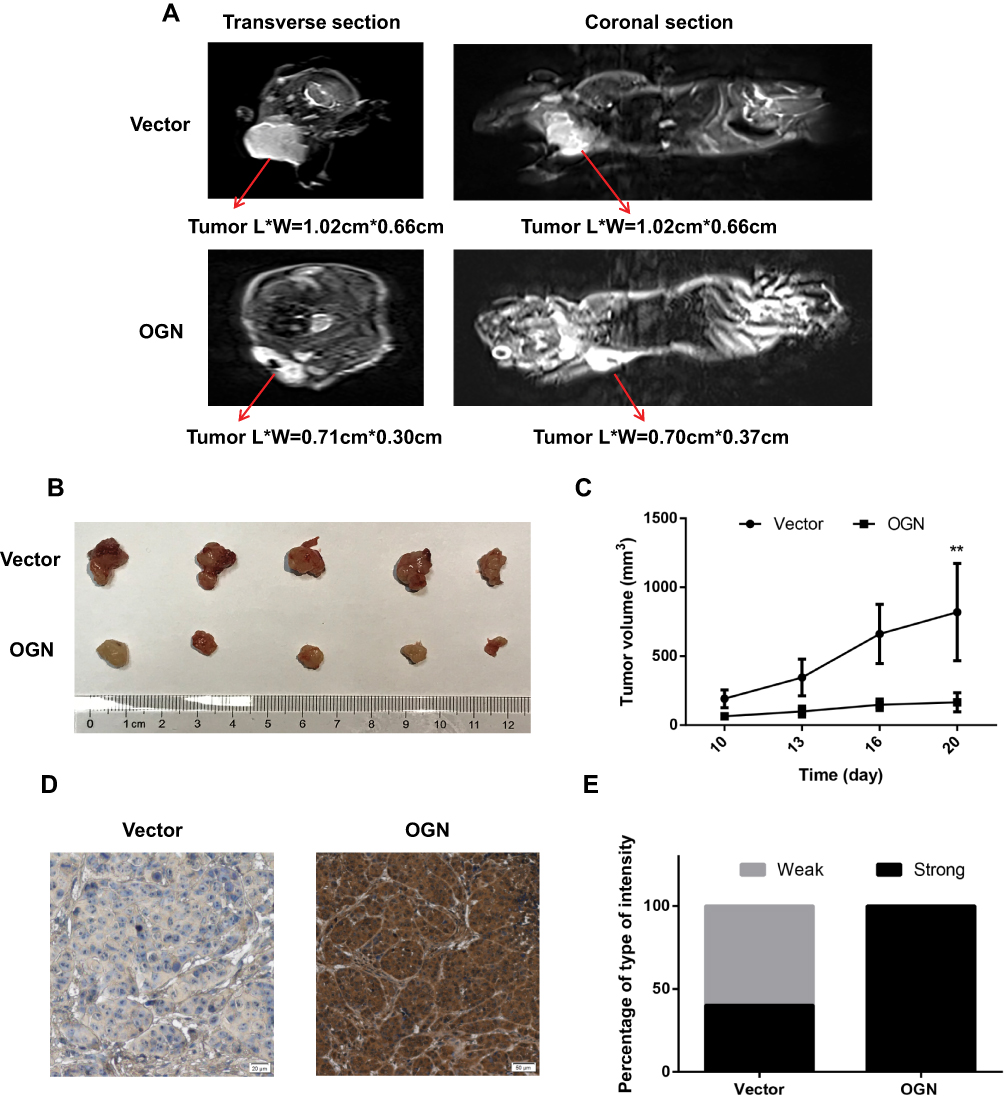 |
Figure 6 OGN expression inhibits the proliferation of breast cancer cells in vivo. Notes: (A) Representative images of enhanced MRI in transverse and coronal sections. “L” represents the long axis and “W” represents the minor axis of the tumor. (B) Images of typical tumors are shown. Xenografts of OGN can significantly repress the growth of MCF-7 cells in vivo. (C) Tumor size over time. (D) Immunohistochemistry of OGN expression in xenograft tumors. (E) Staining intensity of OGN in empty vector or OGN groups. Gray color represents weak intensity, and black color represents strong intensity. **P <0.01 vs empty vector group. Abbreviations: OGN, osteoglycin; MRI, magnetic resonance imaging; IHC, immunohistochemistry. |
Discussion
Breast cancer is a heterogeneous disease with multiple pathogenic factors, and the five-year survival prognosis improves significantly if it is diagnosed at an early stage. However, due to the late diagnosis of some patients, the prognosis of 15% of BC patients is still very poor. To improve both our understanding of the prognosis for patients with breast cancer, high-throughput data (including the GEO, ArrayExpress, Oncomine, and TCGA databases) were used to find centrally-acting hub genes that may play vital roles in its tumorigenesis and development.34 Such analyses could predict the risk of tumor recurrence through integration analysis of non-coding RNA characteristics35 and analyze mRNA expression to find genes that are critical for breast cancer.
Based on a previous integrated analysis of the GEO data, we identified a series of hub genes and potential biological processes that may play important roles in the development of breast cancer, which included OGN. Upon further analysis, it was found that the abnormal expression of OGN was closely tied to breast cancer prognosis. Expression of OGN showed significant difference between different subtypes with lower expression in basal subtypes than other subtypes. It was also significantly negatively associated with ER status and pathological grade in breast cancer, indicating that expression of OGN is closely linked to progression of breast cancer. Through KEGG pathway enrichment analysis and PPI network construction, it was found that OGN may affect breast cancer cells by influencing the PI3K/AKT signaling pathway and may greatly affect epithelial-mesenchymal transition. To date, there have been few reports examining the role and mechanism of OGN in breast cancer. Therefore, in this study, we attempted to understand the relationship between osteoglycin and breast cancer.
After generating breast cancer cell lines that overexpressed OGN through plasmid transfection, we found that clonal formation of MDA-MB-231 and MCF-7 cells was attenuated and the migration and invasion abilities of MDA-MB-231 were weakened. In colon cancer, OGN can inhibit the Akt pathway and affect EMT, which plays a crucial role in the migration and invasion of cancer cells. EMT inhibition can be reversed in colon cancer cells with high expression of OGN due to subsequent Zeb-1 overexpression, indicating that Zeb-1 is required for EMT inhibition and is induced by OGN.14 To find out whether OGN affects EMT in breast cancer cells in a similar manner, EMT-associated molecular biomarkers were examined via Western blot. Snail1 and ZEB1 were downregulated upon OGN overexpression. We also found that OGN overexpression inhibited EMT in breast cancer cells by suppressing the PI3K/Akt/mTOR pathway, thereby reducing the cells’ migration and invasion ability. A xenograft tumor model assay showed that tumor growth significantly slowed following OGN overexpression in the non-invasive breast cancer cell line MCF-7, confirming in vivo OGN’s inhibitory effect on breast cancer cells.
OGN is a member of the small SLRP family that contains seven leucine-rich repeats and whose role in cell biology has not been well-determined. A number of studies have shown loss of OGN in cancer cell lines and tumors, suggesting it is a potential tumor suppressor.17–20,36 However, the exact role of OGN in the development of breast cancer had not been elucidated. In this study, we observed that, upon OGN overexpression, E-cadherin was elevated, N-cadherin was decreased, and the invasion and migration ability of tumor cells was significantly inhibited, indicating that OGN plays a vital role in the EMT of breast cancer cells. Epithelial-mesenchymal transition, the conversion of stationary epithelial cells into motile mesenchymal cells, is often the initial step in tumor cell migration, invasion, and metastasis. EMT is molecularly characterized by the loss of E-cadherin expression coupled with an increase in Vimentin and N-cadherin expression. Studies have shown that E-cadherin’s adhesiveness on cell surface keeps the cells together, promotes cell to cell interactions, and physically blocks cell movement.37 The deletion of E-cadherin causes primary tumors to invade surrounding tissues and migrate to distant locations and establish metastatic tumors.38 Our study showed that the overexpression of OGN could significantly reverse this process and, therefore, reduce the malignancy of breast cancer.
We also corroborated that the upregulation of OGN suppresses ZEB1, as previously shown.21 The ZEB transcription factor family acts by binding to the cadherin promoter region.39,40 ZEB1 promotes the formation of angiogenesis and induces EMT in bladder cancer.41 The transformation of epithelial cells into mesenchymal cells is accompanied by an increase in cancer stemness, metastatic ability, and drug resistance.42 The Transforming Growth Factor Beta (TGF-β),43 Notch,44,45 Wnt/β-cadherin,46 and PI3K/Akt/mTOR31,47 pathways all affect this process. In this study, we confirmed the relationship between PI3K/Akt/mTOR and EMT. We also found that OGN suppresses the PI3K/Akt/mTOR pathway in BC cells, and treatment with the PI3K/AKT/mTOR pathway activator (740Y-P) reverses the antitumor effects of OGN on BC cells.
Conclusion
Based on the above results, the present study shows that osteoglycin is decreased in breast cancer tissues. Overexpression of OGN significantly inhibits cell proliferation and migration/invasion and reverses EMT phenotypes in BC cells. Also, for the first time, we demonstrate that OGN’s tumor suppressor activity manifests through its effects on the PI3K/AKT/mTOR pathway in BC.
Acknowledgment
This work was supported by the National Natural Science Foundation of China (81802676) and the Wuhan Youth Cadre Project (2017zqnlxr01 and 2017zqnlxr02).
Disclosure
The authors report no conflicts of interest in this work.
References
1. Bray F, Ferlay J, Soerjomataram I, Siegel RL, Torre LA, Jemal A. Global cancer statistics 2018: GLOBOCAN estimates of incidence and mortality worldwide for 36 cancers in 185 countries. CA Cancer J Clin. 2018;68(6):394–424. doi:10.3322/caac.v68.6
2. Cutress RI, McIntosh SA, Potter S, et al. Opportunities and priorities for breast surgical research. Lancet Oncol. 2018;19(10):e521–e533. doi:10.1016/S1470-2045(18)30511-4
3. Kalamajski S, Oldberg Å. The role of small leucine-rich proteoglycans in collagen fibrillogenesis. Matrix Biol. 2010;29(4):248–253. doi:10.1016/j.matbio.2010.01.001
4. Iozzo RV. Matrix proteoglycans: from molecular design to cellular function. Annu Rev Biochem. 1998;67(1):609–652. doi:10.1146/annurev.biochem.67.1.609
5. Iozzo RV. The family of the small leucine-rich proteoglycans: key regulators of matrix assembly and cellular growth. Crit Rev Biochem Mol Biol. 1997;32(2):141–174. doi:10.3109/10409239709108551
6. Iozzo RV, Schaefer L. Proteoglycans in health and disease: novel regulatory signaling mechanisms evoked by the small leucine-rich proteoglycans. FEBS J. 2010;277(19):3864–3875. doi:10.1111/j.1742-4658.2010.07797.x
7. Schaefer L, Iozzo RV. Small leucine-rich proteoglycans, at the crossroad of cancer growth and inflammation. Curr Opin Genet Dev. 2012;22(1):56–57. doi:10.1016/j.gde.2011.12.002
8. Inkson CA, Ono M, Bi Y, Kuznetsov SA, Fisher LW, Young MF. The potential functional interaction of biglycan and wisp-1 in controlling differentiation and proliferation of osteogenic cells. Cells Tissues Organs. 2009;189(1–4):153–157. doi:10.1159/000151377
9. Brandan E, Retamal C, Cabello-Verrugio C, Marzolo M-P. The low density lipoprotein receptor-related protein functions as an endocytic receptor for decorin. J Biol Chem. 2006;281(42):31562–31571. doi:10.1074/jbc.M602919200
10. Goldoni S, Iozzo RV. Tumor microenvironment: modulation by decorin and related molecules harboring leucine-rich tandem motifs. Int J Cancer. 2008;123(11):2473–2479. doi:10.1002/ijc.v123:11
11. Reed CC, Waterhouse A, Kirby S, et al. Decorin prevents metastatic spreading of breast cancer. Oncogene. 2005;24(6):1104–1110. doi:10.1038/sj.onc.1208329
12. Karamanou K, Franchi M, Piperigkou Z, et al. Lumican effectively regulates the estrogen receptors-associated functional properties of breast cancer cells, expression of matrix effectors and epithelial-to-mesenchymal transition. Sci Rep. 2017;7(1):45138. doi:10.1038/srep45138
13. Yamamoto T, Matsuda Y, Kawahara K, Ishiwata T, Naito Z. Secreted 70kDa lumican stimulates growth and inhibits invasion of human pancreatic cancer. Cancer Lett. 2012;320(1):31–39. doi:10.1016/j.canlet.2012.01.023
14. Yoshioka N, Inoue H, Nakanishi K, et al. Isolation of transformation suppressor genes by cDNA subtraction: lumican suppresses transformation induced by v-src and v-K-ras. J Virol. 2000;74(2):1008–1013. doi:10.1128/JVI.74.2.1008-1013.2000
15. Niewiarowska J, Brézillon S, Sacewicz-Hofman I, et al. Lumican inhibits angiogenesis by interfering with α2β1 receptor activity and downregulating MMP-14 expression. Thromb Res. 2011;128(5):452–457. doi:10.1016/j.thromres.2011.06.011
16. Albig AR, Roy TG, Becenti DJ, Schiemann WP. Transcriptome analysis of endothelial cell gene expression induced by growth on matrigel matrices: identification and characterization of MAGP-2 and lumican as novel regulators of angiogenesis. Angiogenesis. 2007;10(3):197–216. doi:10.1007/s10456-007-9075-z
17. Lomnytska MI, Becker S, Hellman K, et al. Diagnostic protein marker patterns in squamous cervical cancer. Proteomics Clin Appl. 2010;4(1):17–31. doi:10.1002/prca.200900086
18. Lee J-Y, Eom E-M, Kim D-S, Ha-Lee YM, Lee D-H. Analysis of gene expression profiles of gastric normal and cancer tissues by SAGE. Genomics. 2003;82(1):78–85. doi:10.1016/S0888-7543(03)00098-3
19. Wang Y, Ma Y, Lü B, Xu E, Huang Q, Lai M. Differential expression of mimecan and thioredoxin domain–containing protein 5 in colorectal adenoma and cancer: a proteomic study. Exp Biol Med. 2007;232(9):1152–1159. doi:10.3181/0701-RM-8
20. Li L, Zhang Z, Wang C, et al. Quantitative proteomics approach to screening of potential diagnostic and therapeutic targets for laryngeal carcinoma, Thomas T. ed. PLoS One. 2014;9(2):e90181. doi:10.1371/journal.pone.0090181
21. Hu X, Li Y-Q, Li Q-G, Ma Y-L, Peng -J-J, Cai S-J. Osteoglycin (OGN) reverses epithelial to mesenchymal transition and invasiveness in colorectal cancer via EGFR/Akt pathway. J Exp Clin Cancer Res. 2018;37(1):41. doi:10.1186/s13046-018-0718-2
22. Cui X-N, Tang J-W, Song B, Wang B, Chen S-Y, Hou L. High expression of osteoglycin decreases gelatinase activityof murine hepatocarcinoma Hca-F cells. World J Gastroenterol. 2009;15(48):6117. doi:10.3748/wjg.15.6117
23. Wassermann-Dozorets R, Rubinstein M. C/EBPβ LIP augments cell death by inducing osteoglycin. Cell Death Dis. 2017;8(4):e2733–e2733. doi:10.1038/cddis.2017.155
24. Sarkar S, Moorehead C, Prudnikova K, Schauer CL, Penn LS, Marcolongo M. Synthesis of macromolecular mimics of small leucine-rich proteoglycans with a poly(ethylene glycol) core and chondroitin sulphate bristles. Carbohydr Polym. 2017;166:338–347. doi:10.1016/j.carbpol.2017.02.083
25. Sun C, Zhang Z, He P, Zhou Y, Xie X. Involvement of PI3K/Akt pathway in the inhibition of hepatocarcinoma cell invasion and metastasis induced by SASH1 through downregulating Shh-Gli1 signaling. Int J Biochem Cell Biol. 2017;89:
26. Hu R, Wang M, Niu W, et al. SKA3 promotes cell proliferation and migration in cervical cancer by activating the PI3K/Akt signaling pathway. Cancer Cell Int. 2018;18(1):183. doi:10.1186/s12935-018-0670-4
27. Zhang J, Du Y, Zhang X, Li M, Li X. Downregulation of BANCR promotes aggressiveness in papillary thyroid cancer via the MAPK and PI3K pathways. J Cancer. 2018;9(7):1318–1328. doi:10.7150/jca.20150
28. Zhou X, Jia L, Sun Y, Xu L, Wang X, Tang Q. Sperm‑associated antigen 5 is a potential biomarker for poor prognosis in breast cancer. Oncol Lett. 2018;17(1):1146–1152. doi:10.3892/ol.2018.9729
29. Tang Z, Li C, Kang B, Gao G, Li C, Zhang Z. GEPIA: a web server for cancer and normal gene expression profiling and interactive analyses. Nucleic Acids Res. 2017;45(W1):W98–W102. doi:10.1093/nar/gkx247
30. Györffy B, Lanczky A, Eklund AC, et al. An online survival analysis tool to rapidly assess the effect of 22,277 genes on breast cancer prognosis using microarray data of 1,809 patients. Breast Cancer Res Treat. 2010;123(3):725–731. doi:10.1007/s10549-009-0674-9
31. Wu D, Zhang T, Liu Y, et al. The PAX6-ZEB2 axis promotes metastasis and cisplatin resistance in non-small cell lung cancer through PI3K/AKT signaling. Cell Death Dis. 2019;10(5):349. doi:10.1038/s41419-019-1591-4
32. Yan S, Chu D, Qiu H, et al. LncRNA LINC01305 silencing inhibits cell epithelial‐mesenchymal transition in cervical cancer by inhibiting TNXB‐mediated PI3K/Akt signalling pathway. J Cell Mol Med. 2019;23(4):2656–2666. doi:10.1111/jcmm.2019.23.issue-4
33. Pearlman RL, Montes de Oca MK, Pal HC, Afaq F. Potential therapeutic targets of epithelial–mesenchymal transition in melanoma. Cancer Lett. 2017;391:125–140. doi:10.1016/j.canlet.2017.01.029
34. Honkela A, Peltonen J, Topa H, et al. Genome-wide modeling of transcription kinetics reveals patterns of RNA production delays. Proc Natl Acad Sci. 2015;112(42):13115–13120. doi:10.1073/pnas.1420404112
35. Li J, Wang W, Xia P, et al. Identification of a five-lncRNA signature for predicting the risk of tumor recurrence in patients with breast cancer. Int J Cancer. 2018;143(9):2150–2160. doi:10.1002/ijc.v143.9
36. Tasheva ES, Maki CG, Conrad AH, Conrad GW. Transcriptional activation of bovine mimecan by p53 through an intronic DNA-binding site. Biochim Biophys Acta - Gene Struct Expr. 2001;1517(3):333–338. doi:10.1016/S0167-4781(00)00288-8
37. Perl A-K, Wilgenbus P, Dahl U, Semb H, Christofori G. A causal role for E-cadherin in the transition from adenoma to carcinoma. Nature. 1998;392(6672):190–193. doi:10.1038/32433
38. Yang J, Weinberg RA. Epithelial-mesenchymal transition: at the crossroads of development and tumor metastasis. Dev Cell. 2008;14(6):818–829. doi:10.1016/j.devcel.2008.05.009
39. Postigo AA, Dean DC. Differential expression and function of members of the zfh-1 family of zinc finger/homeodomain repressors. Proc Natl Acad Sci. 2000;97(12):6391–6396. doi:10.1073/pnas.97.12.6391
40. Shargh SA, Sakizli M, Khalaj V, et al. Downregulation of E-cadherin expression in breast cancer by promoter hypermethylation and its relation with progression and prognosis of tumor. Med Oncol. 2014;31(11):250. doi:10.1007/s12032-014-0250-y
41. Li B, Mao X, Wang H, et al. Vasculogenic mimicry in bladder cancer and its association with the aberrant expression of ZEB1. Oncol Lett. 2018;15(4):5193–5200. doi:10.3892/ol.2018.7975
42. Das V, Bhattacharya S, Chikkaputtaiah C, Hazra S, Pal M. The basics of epithelial–mesenchymal transition (EMT): a study from a structure, dynamics, and functional perspective. J Cell Physiol. 2019;234(9):14535–14555. doi:10.1002/jcp.v234.9
43. Suriyamurthy S, Baker D, Ten Dijke P, Iyengar PV. Epigenetic reprogramming of TGF-β signaling in breast cancer. Cancers (Basel). 2019;11(5):726. doi:10.3390/cancers11050726
44. Bocci F, Gearhart-Serna L, Boareto M, et al. Toward understanding cancer stem cell heterogeneity in the tumor microenvironment. Proc Natl Acad Sci. 2019;116(1):148–157. doi:10.1073/pnas.1815345116
45. Fukusumi T, Guo TW, Sakai A, et al. The NOTCH4 – HEY1 pathway induces epithelial–mesenchymal transition in head and neck squamous cell carcinoma. Clin Cancer Res. 2018;24(3):619–633. doi:10.1158/1078-0432.CCR-17-1366
46. Jin Y, Wang J, Han J, Luo D, Sun Z. MiR-122 inhibits epithelial-mesenchymal transition in hepatocellular carcinoma by targeting Snail1 and Snail2 and suppressing WNT/β-cadherin signaling pathway. Exp Cell Res. 2017;360(2):210–217. doi:10.1016/j.yexcr.2017.09.010
47. Huang JL, Cao SW, Ou QS, et al. The long non-coding RNA PTTG3P promotes cell growth and metastasis via up-regulating PTTG1 and activating PI3K/AKT signaling in hepatocellular carcinoma. Mol Cancer. 2018;17(1):1–16. doi:10.1186/s12943-018-0841-x
 © 2019 The Author(s). This work is published and licensed by Dove Medical Press Limited. The full terms of this license are available at https://www.dovepress.com/terms.php and incorporate the Creative Commons Attribution - Non Commercial (unported, v3.0) License.
By accessing the work you hereby accept the Terms. Non-commercial uses of the work are permitted without any further permission from Dove Medical Press Limited, provided the work is properly attributed. For permission for commercial use of this work, please see paragraphs 4.2 and 5 of our Terms.
© 2019 The Author(s). This work is published and licensed by Dove Medical Press Limited. The full terms of this license are available at https://www.dovepress.com/terms.php and incorporate the Creative Commons Attribution - Non Commercial (unported, v3.0) License.
By accessing the work you hereby accept the Terms. Non-commercial uses of the work are permitted without any further permission from Dove Medical Press Limited, provided the work is properly attributed. For permission for commercial use of this work, please see paragraphs 4.2 and 5 of our Terms.