")
Back to Journals » International Journal of Nanomedicine » Volume 9 » Issue 1
Osteogenic response of human mesenchymal stem cells to well-defined nanoscale topography in vitro
Authors de Peppo GM, Agheli H, Karlsson C, Ekström K, Brisby H, Lennerås M, Gustafsson S, Sjövall P, Johansson A, Olsson E, Lausmaa J, Thomsen P, Petronis S
Received 6 December 2013
Accepted for publication 15 February 2014
Published 22 May 2014 Volume 2014:9(1) Pages 2499—2515
DOI https://doi.org/10.2147/IJN.S58805
Checked for plagiarism Yes
Review by Single anonymous peer review
Peer reviewer comments 4
Giuseppe Maria de Peppo,1–3 Hossein Agheli,2,3 Camilla Karlsson,2,3 Karin Ekström,2,3 Helena Brisby,3,4 Maria Lennerås,2,3 Stefan Gustafsson,3,5 Peter Sjövall,3,5,6 Anna Johansson,2,3 Eva Olsson,3,5 Jukka Lausmaa,3,6 Peter Thomsen,2,3 Sarunas Petronis3,6
1The New York Stem Cell Foundation Research Institute, New York, NY, USA; 2Department of Biomaterials, Sahlgrenska Academy, University of Gothenburg, 3BIOMATCELL VINN Excellence Center of Biomaterials and Cell Therapy, 4Department of Orthopaedics, Sahlgrenska Academy, University of Gothenburg, 5Applied Physics, Chalmers University of Technology, Göteborg, Sweden; 6Chemistry, Materials and Surfaces, SP Technical Research Institute of Sweden, Borås, Sweden
Background: Patterning medical devices at the nanoscale level enables the manipulation of cell behavior and tissue regeneration, with topographic features recognized as playing a significant role in the osseointegration of implantable devices.
Methods: In this study, we assessed the ability of titanium-coated hemisphere-like topographic nanostructures of different sizes (approximately 50, 100, and 200 nm) to influence the morphology, proliferation, and osteogenic differentiation of human mesenchymal stem cells (hMSCs).
Results: We found that the proliferation and osteogenic differentiation of hMSCs was influenced by the size of the underlying structures, suggesting that size variations in topographic features at the nanoscale level, independently of chemistry, can be exploited to control hMSC behavior in a size-dependent fashion.
Conclusion: Our studies demonstrate that colloidal lithography, in combination with coating technologies, can be exploited to investigate the cell response to well defined nanoscale topography and to develop next-generation surfaces that guide tissue regeneration and promote implant integration.
Keywords: colloidal lithography, nanotopography, human mesenchymal stem cells, cell proliferation, osteogenic differentiation, mineralization, implantable materials
Introduction
When a medical device is implanted into a bone cavity or defect, a sequence of biological events takes place at the bone-implant interface, which, under favorable conditions, leads to a situation in which the implant surface is covered with newly formed bone tissue.1 Tissue regeneration, and eventually implant integration, is dependent on the surface properties of the medical device, the implantation and treatment procedure, and the health status of the patient.2 The emerging field of nanotechnology makes it possible to alter the surface properties of medical devices at nanoscale and to control the interaction of the material with cell components and biological fluids specifically to manipulate cell behavior and improve tissue growth after implantation.3–5
Among the implant properties that are recognized as influencing cell behavior, chemical and topographic surface characteristics are acknowledged as playing a critical role.6–8 Cells are inherently sensitive to mesoscale, microscale, and nanoscale patterns of chemistry and topography.9 The topographic features, independently of substrate biochemistry,10 play an important role in guiding adhesion11 and affect cell morphology,12,13 proliferation,14,15 and differentiation.16 Surface topography is believed to influence cell behavior in several ways, ie, by exerting mechanical forces,17 reorganizing cytoskeleton ultrastructure and cell geometry, and directing focal adhesion formation,18 thereby influencing cell signaling and metabolism.19 As a result, numerous coatings and surface modifications have been developed in an attempt to improve implant integration and reduce the risks of relevant clinical complications. The latest trends include topographic surface modifications comprising nanosize structures and patterns, mostly due to the potential for precisely controlling biological responses by surface features in the same size range as biological recognition and signaling system components.7,8 However, there is a lack of knowledge about the very basic mechanisms underlying the cellular sensitivity to substrate nanotopography, as well as the topographic parameters (eg, shape, size, distribution density) that are most relevant in this context.
One significant challenge in the study of biological system interaction with nanoscale structures is the shortage of suitable nanofabrication approaches to create large areas of systematically variable nanostructures. While most conventional nanofabrication approaches suffer from low fabrication speed, high cost, and the need for sophisticated processes,20–22 one promising approach is the use of self-assembling systems to create nanoscale patterns on implant surfaces. Of the self-assembling fabrication techniques, colloidal lithography23–25 represents a rapid, inexpensive, and versatile fabrication method with the capability to fabricate large area (over cm2) surfaces, even on three-dimensional implants and scaffolds.26,27 The use of colloidal lithography thus creates an opportunity to investigate cell-topography interactions and better understand the processes behind cell-surface sensing and surface-induced cellular responses, with the final aim of superimposing these geometric cues onto scaffolds and implants, in order to control tissue regeneration and implant integration.
Several studies investigating the effects of nanofeatures, such as nanopits and nanoprotrusions, on epithelial cells, human fibroblasts, human neural stem cells, human osteoblasts, and human mesenchymal stem cells (hMSCs), with respect to cell morphology, proliferation, and differentiation, have been published.16,28–34 However, no studies specifically exploring the size effects of chemically homogeneous nanotopographic protrusions in promoting the osteogenic differentiation of hMSCs have been reported.
Human MSCs residing in bone marrow35 and other adult tissues36–39 are able to differentiate into several cell types in the mesenchymal lineage.40 After a medical device is implanted into a bone cavity or defect, circulating hMSCs migrate to the implant site where they adhere and differentiate into functional osteoblasts, eventually supporting tissue remodeling and healing. Cell recruitment and differentiation are highly dependent on the surface properties of the implanted device,41 with surface topography likely playing a major role during the initial phase of the biological response to the implant. Nevertheless, because synergistic effects of surface chemistry and surface texture have been revealed in some model systems, eg, those reported by Liao et al,42 it is essential to control these surface properties.
The objective of the present study was to evaluate the in vitro biological response of hMSCs cultured on topographically nanopatterned titanium model surfaces. Each model surface contains patterns of semispherical protrusions of different sizes but with a fixed density (same average center-to-center distance). Both the flat reference surfaces and the nanopatterned surfaces were sputter-coated with a thin film of titanium in order to ensure exactly the same surface chemical composition in all model surfaces. This simple system allowed us to investigate and compare the effect of nanoparticle size in directing hMSC behavior, in terms of cell morphology, proliferation, and osteogenic differentiation.
Materials and methods
Preparation of nanostructured model surfaces
Coverglass disks (15 mm in diameter and 0.13–0.16 mm thick, VWR International, Stockholm, Sweden) were used as substrates of model surfaces due to their optical transparency, thereby enabling light microscopy. The substrates were cleaned by ultrasonic agitation in acetone, isopropyl alcohol, and Milli-Q water (EMD Millipore, Billerica, MA, USA) and treated in oxygen plasma (PlasmaTherm Batchtop V II RIE/PE, 200 watt; 250 mTorr; 1 minute) prior to nanostructuring. The nanostructuring was performed using colloidal lithography. First, the clean surfaces were positively charged by adsorption of a monolayer of aluminum chloride hydroxide (ACH, Reheis Chemical Company, Dublin, Ireland). The monolayer was deposited by applying ACH solution (5% weight/weight [w/w] in water) to the substrate surface for 30 seconds, then rinsing with Milli-Q water and drying with N2 blow. In the next step, the positively charged surfaces were exposed to a 0.2% w/w colloidal solution of 200 nm negatively charged polystyrene particles (surfactant-free white polystyrene latex, Invitrogen, Carlsbad, CA, USA) for one minute to enable the electrostatic self-assembly of particles on the surfaces. Finally, the surfaces were washed by rinsing in Milli-Q water and dried with N2 blow. This procedure results in a monolayer of short range-ordered 200 nm polymeric particles attached to the substrate surface.
In order to create the desired structure sizes, the adsorbed original 200 nm polymeric particles were symmetrically shrunk by etching in oxygen plasma (150 W, TePla 300 PC). The samples were etched for 30 minutes or 40 minutes to shrink the polymeric particles by approximately 45% or 65% in volume, respectively. The nanostructured surfaces were further heat-treated in a 118°C furnace (ie, above the glass-transition temperature of polystyrene) for 2 minutes in order to transform the shape of the nanoparticles from spherical to semispheroidal and to increase attachment of the particles to the substrate surface.
In the final step, a 15 nm titanium layer was sputtered (MS 150, 5 × 10⁻⁵ mbar, 1 kW; Anlagenbau GmbH, Ottendorf-Okrilla, Germany) on all the nanostructured substrates, as well as on nonstructured glass disks used as flat reference surfaces in order to achieve homogeneous chemistry on the model surfaces.
The described method was used to fabricate four types of titanium-coated model surface, ie, a flat reference surface and three kinds of nanostructured surface with varying nanoprotrusion sizes (one original and two shrunk) but identical protrusion density.
Characterization of model surfaces
The morphology of the nanostructured and flat surfaces was investigated using complementary scanning probe microscopies. Atomic force microscopy (AFM, Digital Instruments Dimension 3000/Nanoscope IIIa scanning probe microscope, Veeco Instruments, Inc., Plainview, NJ, USA), in combination with Gwiddion 2.9 (Czech Metrology Institute, Prague, Czech Republic) and SPIP 5.1.3 (Image Metrology A/S, Hørsholm, Denmark) image analysis software, was used to characterize the height of the patterned nanoprotrusions and induced surface roughness parameters. Scanning electron microscopy (SEM, Supra 60 VP, Zeiss, Oberkochen, Germany, and JSM-6301F, JEOL Ltd, Tokyo, Japan), in combination with an ImageJ 1.43u code (National Institutes of Health, Bethesda, MD, USA), was used to measure nanoprotrusion diameter, distribution density, and average nearest-neighbor distance.
The chemical composition of the prepared model surfaces was investigated using time-of-flight secondary ion mass spectroscopy (TOF-SIMS), transmission electron microscopy (TEM) with electron energy filtration (EFTEM), and X-ray photoelectron spectroscopy. TOF-SIMS and EFTEM are described in detail in the dedicated sections below. X-ray photoelectron spectroscopy was performed using a PHI 5500C ESCA System (Perkin-Elmer, Minneapolis, MN, USA) equipped with a monochromatic Al K-alpha X-ray source (1,486.6 eV, 1 mm beam diameter) and a hemispherical electrostatic analyzer. The survey spectra were recorded at a 45° take-off angle and 187.85 eV pass energy. Based on the recorded spectra, the atomic concentrations of the detected elements were calculated using MultiPack version 6.0a (Physical Electronics Inc., Chanhassen, MN, USA) software. The surface chemical composition was probed before and after sputter-cleaning the surfaces by Ar+ ion bombardment which removed less than 3 nm of the outermost surface layer.
The wettability of the model surfaces was characterized by static water contact angle measurements (DSA100 Mk2 drop shape analysis system, Kruss GmbH, Hamburg, Germany) performed in the sessile drop mode. The data were collected and averaged from three measurements on each type of titanium-coated model surface.
TEM analysis
Thin cross-section foils for TEM were prepared by the in situ liftout method using a Strata 235 DualBeam ion milling system (FEI Europe, Eindhoven, the Netherlands). Milling was performed by 30 kV Ga+ ions and currents ranging from 0.1 nA to 20 nA. In order to protect the nanostructures and the coating, a thin platinum strip was deposited on the sample surface using the electron beam followed by the ion beam. The nanostructure shape and coverage by the titanium oxide coating was investigated by EFTEM using a Titan 80-300 system (FEI Europe) operating at 300 kV.
TOF-SIMS analysis
TOF-SIMS was used to characterize the fabricated nanostructured substrate surfaces before cell culture and to characterize and quantify the mineralized material produced by the cells on the various surfaces after 4 weeks of culture (see next section). The TOF-SIMS analyses were conducted with a TOF-SIMS IV instrument (ION-TOF Technologies GmbH, Münster, Germany) using 25 keV Bi3+ primary ions for analysis and 10 keV C60+ ions for sputtering. The analysis was conducted with the instrument optimized for high mass resolution (m/Δm ~5,000, beam diameter 3.5 μm) at a pulsed Bi3+ current of 0.1 pA.
Cell-induced mineralization was evaluated by TOF-SIMS for one sample of each titanium-coated surface, ie, flat reference and nanopatterned surfaces. After 4 weeks of culture in osteogenic medium, the samples were rinsed twice with low-glucose Dulbecco’s Modified Eagle’s Medium (DMEM-LG, PAA Laboratories, Linz, Austria) and subsequently treated with ethanol (95%) in order to dissolve membranes and fix the samples. The ethanol treatment effectively extracts the lipid content in the samples but preserves mineral deposition and other cell-related material (proteins, salts) for examination.
Depth profiles and three-dimensional maps were recorded by repeated sputtering of the surface (10 keV C60+ ions, 300 × 300 μm, 1.9 nA) and analysis (25 keV Bi3+ primary ions, 200 × 200 μm, 128 × 128 pixels) in an alternating mode. For each sample, three depth profiles were acquired in the positive secondary ion mode. The data file acquired during the analysis contains an entire mass spectrum in each of the 128 × 128 pixels and after each sputtering cycle, allowing for the retrospective reconstruction of the data in different forms, such as: depth profiles showing the signal intensity of selected ion peaks, from a selected area of interest or over the entire analysis area, as a function of sputtering time or sputter dose (number of applied sputter ions per surface area); two-dimensional images showing the signal intensity of selected ion peaks on the analyzed area of the surface, in which the signal is accumulated either over the entire depth profile or over a selected sputtering time interval; cross-sectional images showing the signal intensity of selected ion peaks in vertical cuts through the sample (here the vertical dimension is represented by the sputtering time and not the “real” sample geometry); or mass spectra from selected three-dimensional regions of the sample obtained by selecting a region of interest on the sample surface and a selected range of sputtering times.
In order to facilitate the assignment of peaks originating from the mineral phase and the cell/extracellular matrix (ECM) phase, reference spectra were acquired during C60+ depth profiling of a pure hydroxyapatite reference sample and a cell sample without induced mineralization.
Cell isolation and culture
Human MSCs were isolated from bone marrow aspirates taken from the iliac crest of a 14-year-old patient undergoing scoliosis surgery. The study was approved by the local human ethics committee and the samples were collected with the informed consent of the patient. Five milliliters of fresh bone marrow were transferred into 5 mL of phosphate buffer containing Heparin E500 (Heparin LEO, Apoteket AB, Sweden) to prevent coagulation. Adipose tissue was removed by centrifugation at 1,800 rpm for 5 minutes. The hMSCs were then isolated by gradient centrifugation using CPT Vacutainer® tubes prefilled with Ficoll (Pharmacia, Uppsala, Sweden), according to the manufacturer’s instructions. Cells were expanded in DMEM-LG, supplemented with 1% penicillin-streptomycin (PAA Laboratories), L-glutamine (2 mM, Gibco, Paisley, UK), 10% fetal bovine serum (Gibco), and 10 ng/mL basic fibroblast growth factor (Life Technologies, Stockholm, Sweden). The isolation and enrichment of hMSCs were verified by flow cytometry, as described previously.43 Three separate sets of experiments were performed for different biological evaluations: a 2-day culture for cell morphology evaluations (SEM, TEM, and fluorescence microscopy of phalloidin-stained cytoskeleton); a 2-week culture for cell proliferation, polymerase chain reaction (PCR) analysis of gene expression and alkaline phosphatase (ALP) activity evaluations; and a 4-week culture for TOF-SIMS analysis of cell-induced mineralization. In short, the samples were placed in cell culture wells (Falcon? CultureSlide 24-well, BD Biosciences, Franklin Lakes, NJ, USA) so that they completely covered the bottom area of the culture wells. The samples were sterilized by washing them twice with ethanol (95%) and then rinsing with distilled H2O. The rinsed samples were left to dry in a sterile environment. The hMSCs were seeded onto the surfaces at a density of 10,000 cells per well and cultured in DMEM-LG supplemented with 1% penicillin-streptomycin, L-glutamine 2 mM, 10% fetal calf serum, L-ascorbic acid (4.5 × 10⁻⁵ M; Sigma-Aldrich, St Louis, MO, USA), dexamethasone (10−6 M; Sigma-Aldrich), and β-glycerophosphate (2 × 10⁻² M; Calbiochem, EMD Millipore). All the cells were incubated at 37°C in 5% CO2. The medium was changed every 3–4 days, and cells were harvested at different time points to examine cellular morphology, proliferation, differentiation, and mineralization. For each experimental test, cells were plated in triplicate.
SEM analysis of cells
Cells were investigated by SEM 2 days after seeding. One sample of each modified titanium surface was rinsed twice in phosphate-buffered saline before adding 1 mL of a modified solution of Karnovsky fixative, consisting of a solution of sodium azide (0.02%; Fluka Biochemika GmbH, Buchs, Switzerland), paraformaldehyde (2%; VWR International) and glutaraldehyde (2.5%; Agar Scientific, Stansted, UK) in sodium cacodylate buffer (0.05 M; Agar Scientific). The samples were then treated with a solution of OsO4 (1%; Agar Scientific) in sodium cacodylate buffer and stored at 4°C for 4 hours. After rinsing five times with distilled H2O, the samples were treated with hexamethyldisilazane (1%; Fluka, Sigma-Aldrich) before once again adding a solution of OsO4 (1%) in sodium-cacodylate buffer (0.1 M). After dehydration with increasingly concentrated solutions of ethanol (70%, 80%, 95%, and 99.5%), the samples were treated twice (5 minutes each) with a solution of hexamethyldisilazane (1%) and left to dry overnight. A 10 nm gold layer was sputtered (FHR MS150) onto all the sample surfaces before imaging by SEM (JSM-6301F and Supra 60 VP).
Phalloidin staining
After 2 days of culture in osteogenic conditions, cells seeded onto all the investigated surfaces were stained with phalloidin to examine actin filament disposition. The cells were washed three times with phosphate-buffered saline before fixation (Histofix™; Histolab Products AB, Gothenburg, Sweden) for 10 minutes. After rinsing twice with phosphate-buffered saline and incubating them with a solution of phosphate-buffered saline containing 1% bovine serum albumin (Sigma-Aldrich), the cells were stained with 5 μL of methanolic solution containing Alexa Fluor® 532 phalloidin (6.6 μM; Molecular Probes™, Invitrogen) in 200 μL of phosphate-buffered saline, containing 1% bovine serum albumin (Sigma-Aldrich) at room temperature for 20 minutes. The samples were rinsed three times with phosphate-buffered saline, air-dried, and then mounted in ProLong® Gold antifade reagent (Molecular Probes) to resist photobleaching. All the samples were left to dry overnight and visualized using a Nikon Eclipse 90i microscope (Nikon Instruments Inc., Melville, NY, USA).
Quantitative real-time PCR
After 2 weeks of culture in osteogenic medium, the cells were harvested for gene expression analysis. The cells were lysed in 350 μL of RLT buffer with addition of 1% β-mercaptoethanol and vortexed for one minute. The lysate was transferred directly into a QIAshredder spin column and centrifuged for 2 minutes. Total RNA from the samples was extracted using an RNeasy® Minikit (Qiagen GmbH, Hilden, Germany) according to the manufacturer’s instructions. DNAse treatment was performed in order to eliminate any contamination from genomic DNA. Reverse transcription was carried out using an iScript cDNA synthesis kit (Bio-Rad, Hercules, CA, USA) in a 10 μL reaction, according to the manufacturer’s instructions. The design of primers for RUNX2 was made using Primer3 web-based software.44 Design parameters were adjusted to minimize the formation of artifact products and to enable an annealing temperature in the PCR of about 60°C. Primers were designed to yield short amplicons (preferably shorter than 200 base pairs) and to function well with SYBR Green I fluorescent dye for the detection of PCR products in real time. Primer sequences are available at TATAA Biocenter AB (http://www.tataa.com). Real-time PCR was performed in duplicate using the Mastercycler® ep realplex (Eppendorf, Hamburg, Germany) in 20 μL reactions. The cycling conditions were 95°C for 10 minutes, followed by 45 cycles of 95°C for 20 seconds, 60°C for 20 seconds, and 72°C for 20 seconds. The fluorescence was read at the end of the 72°C step. Melting curves were recorded after the run by stepwise temperature increase (1°C per 5 seconds) from 65°C to 95°C. Quantities of target gene were presented as normalized to the number of cells using the expression of an 18S ribosomal subunit. Normalized relative quantities were calculated using the delta Ct method and 90% PCR efficiency (k*1.9Δct).
Alkaline phosphatase activity
After 2 weeks in osteogenic conditions, cells seeded onto all the investigated surfaces were lysed using mammalian protein extraction reagent (Fisher Scientific, Gothenburg, Sweden) in order to measure the intracellular ALP activity. ALP activity was assayed using p-nitrophenylphosphate as the substrate, which is converted to p-nitrophenol when interacting with ALP. The quantity (in alkaline solution) of p-nitrophenol produced was measured by light absorbance intensity at 405 nm and was considered directly proportional to the ALP activity. The analysis was performed at the accredited laboratory at Sahlgrenska University Hospital.
Statistical analysis
The results are expressed as the means and standard errors. Differences were determined by the Student’s independent t-test, where a P-value<0.05 was considered to be statistically significant. All the data were analyzed using the Statistical Package for the Social Sciences version 17.0 software (SPSS Inc., Chicago, IL, USA).
Results
Nanostructured model surfaces
The morphology of the fabricated model surfaces was investigated using combined AFM and SEM techniques. AFM measurements revealed that the roughness level of the titanium coating was Sa=0.3 nm, as determined from the scans of the flat reference sample or the area between the nanoparticles (Figure 1A–D). AFM was also used to estimate particle height, distribution density, and overall surface roughness parameters, which are summarized in Table 1. Similarly, SEM imaging (Figure 2A–C) was used to estimate particle diameter and distribution densities. Furthermore, observations of the particle cross-section shape by TEM (Figure 2D) and diameter-to-height ratios (d/h) in AFM/SEM images revealed that the particles had a semispherical shape, with d > h due to both thermal deformation and particle shrinkage by oxygen plasma. The observed particle shape can be mathematically modeled using truncated sphere approximation. Based on this model, the induced surface area was calculated for each type of nanostructured surface (Table 1) using the geometric formula Sdr = πnh2, where n is the particle distribution density (number of particles per surface area unit) and h is the measured particle height. It emerged that the calculated developed interfacial surface area ratio (S in Table 1) was smaller than that measured directly by AFM (Sdr in Table 1), probably due to the avoidance of tip convolution effects.
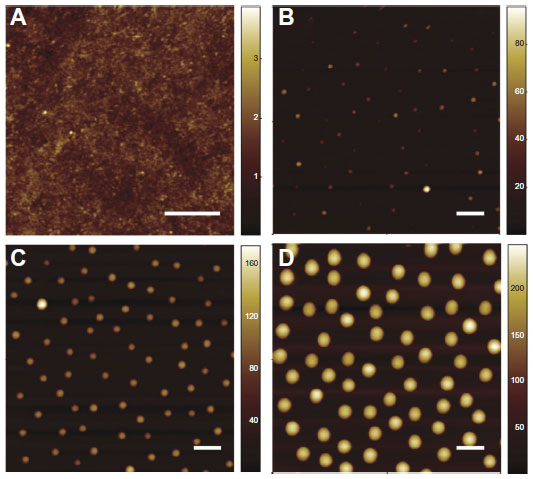 | Figure 1 Atomic force microscopy characterization of the height of the patterned nanoprotrusions and induced surface roughness parameters for flat (A), 50 nm (B), 100 nm (C), and 200 nm (D) surfaces. Scale, 500 nm. |
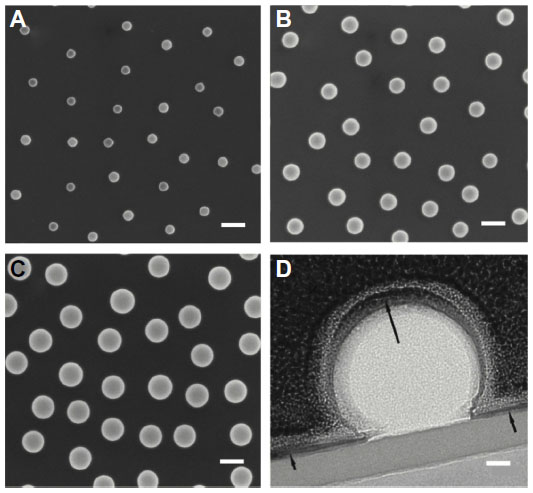 | Figure 2 Scanning electron microscopic images (A–C) showing particle diameter and distribution densities for 50 nm (A), 100 nm (B), and 200 nm (C) surfaces. Scale, 200 nm. Transmission electron microscopic bright field images showing a cross-section of a nanobump on the substrate surface (D). The titanium oxide coating appears to be continuous over the nanobump (black arrows). Scale bar, 20 nm. |
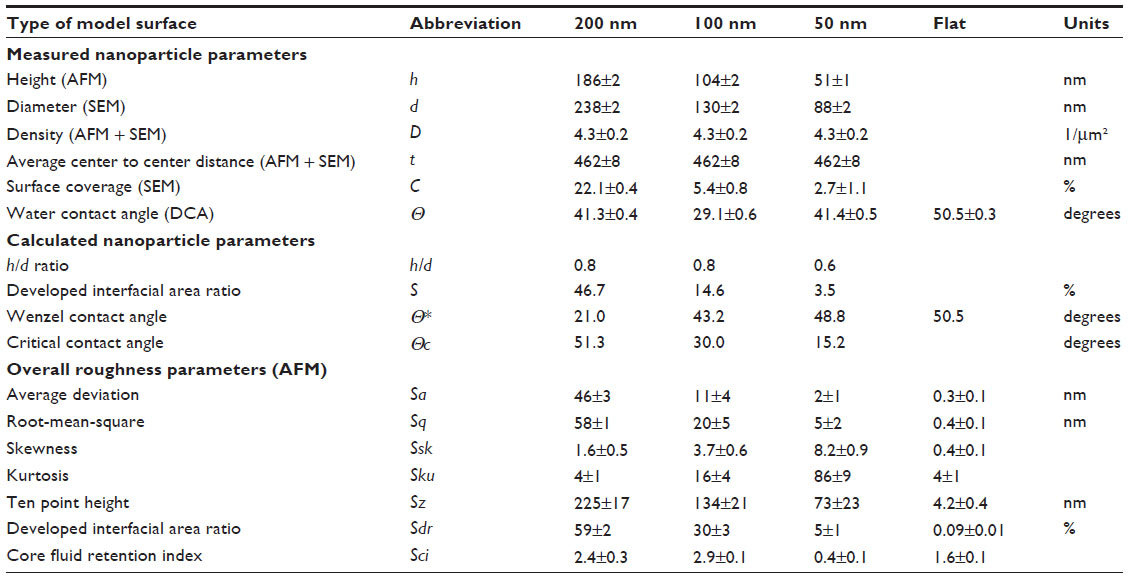 | Table 1 Surface morphology, roughness, and wettability parameters |
The chemical composition and homogeneity of the prepared model surfaces were investigated by TEM, TOF-SIMS, and X-ray photoelectron spectroscopy. The TEM image of the nanoparticle in cross-section (Figure 2D) demonstrates that the titanium coating covers the entire nanoparticle and is continuous both on the particle and on the surrounding flat surface. The thickness of the titanium film, however, varies from a nominal value of 10 nm on the flat area and on the top of the nanoparticle down to only a couple of nanometers around the base of the nanoparticle. Similarly, TOF-SIMS and X-ray photoelectron spectroscopy analysis and comparison of the flat reference surface (no polystyrene nanoparticles at all) with the nanostructured surface (polystyrene nanoparticles covered by titanium) showed no sign of polystyrene exposed on the sample surfaces, confirming complete coverage of the titanium layer over the surfaces (Tables 2 and 3, Supplementary Figures S1 and S2). The C7H7+ ion at m/z =91, taken as a marker of polystyrene, was observed at similar intensities for both the flat and nanostructured surfaces in the TOF-SIMS analyses and is most likely due to aromatic groups present in adsorbed spurious contaminants, rather than polystyrene.
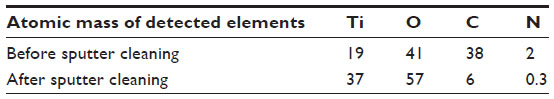 | Table 2 X-ray photoelectron spectroscopy of surface chemical composition |
 | Table 3 TOF-SIMS analysis of polystyrene in the model surfaces |
Water contact angles measured on the nanopatterned and reference surfaces (Figure 3) revealed that the titanium surfaces are hydrophilic (contact angle of 50.5±0.5 degrees on the reference surface) and that surface hydrophilicity is further enhanced by the nanostructures (41.4±0.9, 29.2±1.1, and 41.3±0.7 degrees on the surfaces patterned by the 50 nm, 100 nm, and 200 nm features, respectively), although all the surfaces had an identical chemical composition (titanium coating). The reduction in contact angles on the nanostructured surfaces might be expected due to the increase in surface area by nanostructures (up to 57%, Table 1), as predicted by the Wenzel model45 and the relationship cos θ* = S cos θ, where S is the developed surface area and θ* and θ are the effective and Young contact angles on rough and ideally flat surfaces, respectively. However, the Wenzel model does not explain the results reported in this study when comparing the measured contact angles on the surfaces with nanoparticles of different sizes. Most likely, a hemiwicking phenomenon occurs for 200 nm protrusions, where a thin water film impregnates the solid surface between the nanoparticles around the liquid drop due to capillary forces and reduced Wenzel wetting, as described by Quéré and Ishino et al.46,47 This hypothesis is confirmed by estimating the critical angles defined as cos θc =(1 – φ)/(S – φ), where φ is the nonimpregnated surface fraction (tops of the nanoparticles). By making a rough estimate where φ is equal to particle surface coverage C tabulated in Table 1, the critical angles are calculated as 15.2, 30.0, and 51.3 degrees, corresponding to 50, 100, and 200 nm particles, respectively. As the last θc value is higher than the actually measured θ, it is very likely that, for this particle size, Wenzel wetting is replaced by the hemiwicking.
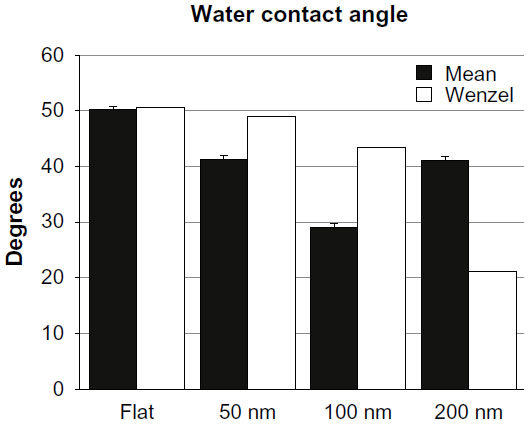 | Figure 3 Histogram showing the water contact angles of the titanium-coated investigated surfaces in relation to values predicted by the Wenzel model. |
Cell morphology
Cell morphology was investigated after 2 days using phalloidin staining and SEM. In Figure 4, representative micrographs of phalloidin-stained cells cultured on flat (Figure 4A), 50 nm (Figure 4B), 100 nm (Figure 4C), and 200 nm (Figure 4D) surfaces are shown. No major differences in microfilament disposition were observed between the investigated samples. However, SEM investigation revealed significant variations in cell morphology between cells cultured on different surfaces (Figure 5), with cells cultured on flat (Figure 5A), 100 nm (Figure 5C), and 200 nm (Figure 5D) surfaces displaying a large polygonal morphology compared with cells cultured on 50 nm surfaces (Figure 5B), which exhibited a more elongated, spindle-like morphology. In addition to morphological variations, Figure 6 shows that the number of filopodia was higher when cells were cultured on flat surfaces (Figure 6A and B) compared with nanopatterned surfaces (Figure 6C–H). On the other hand, marginal differences were observed between the nanopatterned surfaces. Interestingly, differences could also be observed in filopodia length and curvature, with cells cultured on flat surfaces (Figure 6A and B) displaying straight, longer filopodia compared with cells cultured on nanostructured surfaces (Figure 6C–H). Higher magnification SEM and TEM images revealed filopodia–nanobump interactions (Figure 6I and J, respectively).
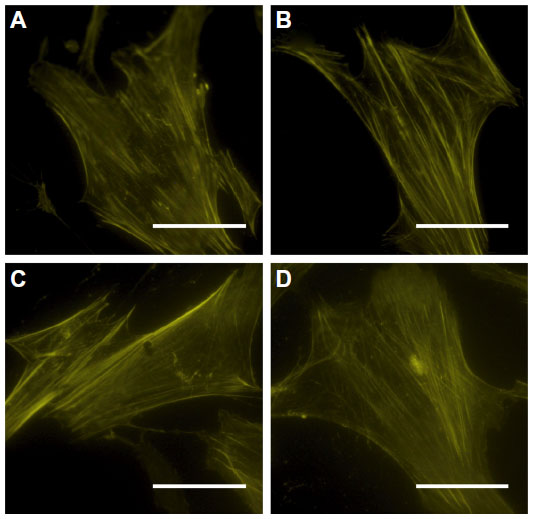 | Figure 4 Light micrographs showing phalloidin-stained human mesenchymal stem cells seeded on flat (A), 50 nm (B), 100 nm (C), and 200 nm (D) surfaces after 2 days of culture in osteogenic conditions. Scale bar, 50 μm. |
 | Figure 5 Scanning electron microscopic images showing human mesenchymal stem cell density after 2 days of culture on flat (A), 50 nm (B), 100 nm (C), and 200 nm (D) surfaces. Scale bar, 100 μm. Graph showing the number of cells after 2 weeks of culture for all the different investigated surfaces (E). A value of P<0.05 (*) was taken as a statistically significant difference. |
 | Figure 6 Scanning electron microscopic images showing human mesenchymal stem cells seeded on flat (A and B), 50 nm (C and D), 100 nm (E and F), and 200 nm (G and H) surfaces at two different magnifications. Scale bar, 10 μm and 1 μm, respectively. Higher magnification scanning electron microscopic image of cells seeded on the 200 nm surface showing filopodia–nanobump interactions (I) Scale bar, 1 μm. Transmission electron microscopic bright field images showing filopodia–nanobump interactions (J) Scale bar, 200 nm. |
Cell proliferation
SEM of the investigated samples revealed differences in the number of cells as early as after 2 days of culture in osteogenic conditions, as shown in Figure 5. The highest number of cells was observed on flat surfaces (Figure 5A), while the lowest number of cells was observed on 50 nm surfaces (Figure 5B). No notable differences in the number of cells were observed on the 100 nm and 200 nm surfaces (Figure 5C and D, respectively). After 2 weeks in osteogenic conditions, cells were counted to estimate cell proliferation. In Figure 5E, the number of cells cultured on flat, 50 nm, 100 nm, and 200 nm surfaces is shown. The number of cells was significantly higher on flat and 200 nm surfaces compared with 50 nm surfaces, while no significant differences were observed between flat, 100 nm, and 200 nm surfaces.
Osteogenic differentiation
In Figure 7, the expression of RUNX2 and ALP activity data is shown. Gene expression results are shown as relative values, with the higher expression value used as the baseline. The results demonstrate that, after 2 weeks in osteogenic conditions, RUNX2 displayed a significantly increased expression in cells cultured on flat and 200 nm surfaces compared with cells cultured on 50 nm surfaces. Although a slight difference in expression of RUNX2 was observed for cells cultured on 100 nm and 50 nm surfaces, the result was not significant. No significant differences in RUNX2 expression were observed between cells cultured on flat, 100 nm, and 200 nm surfaces. At the same time point, cells cultured on flat, 100 nm, and 200 nm surfaces displayed higher ALP activity per unit area compared with cells cultured on 50 nm surfaces. However, no significant differences were found if the ALP activity was normalized for the number of cells (data not shown).
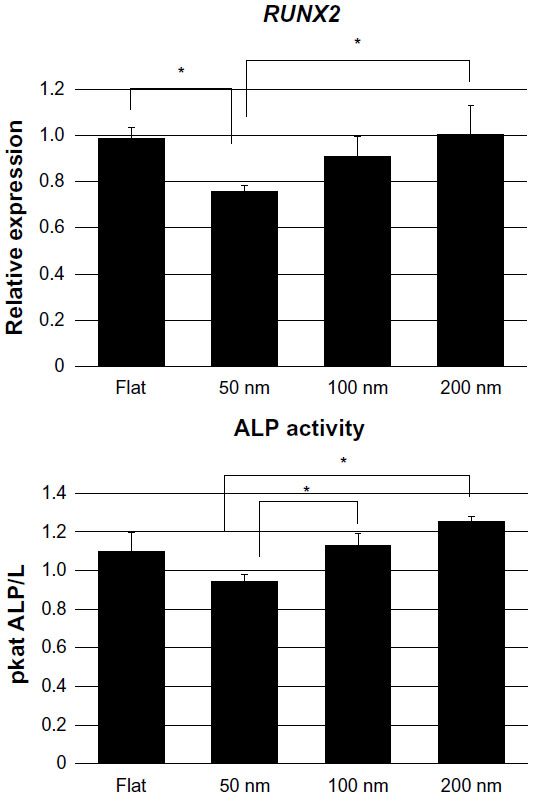 | Figure 7 Histograms showing the expression of RUNX2 and alkaline phosphatase activity of human mesenchymal stem cells seeded on all the investigated surfaces. Both analyses were performed after 2 weeks of culture in osteogenic conditions. RUNX2 data are presented as relative expression values. A value of P<0.05 (*) was taken as a statistically significant difference. |
TOF-SIMS
The results of the depth profile measurements of cells cultured on flat, 50 nm, 100 nm, and 200 nm surfaces for 4 weeks are shown in Figure 8. The different profiles in each measurement represent contributions from the titanium substrate (49Ti+ and TiO+), calcium phosphate (Ca2PO3+), and cell and ECM material (Na3SO4+). The horizontal axis of the depth profiles is related to the depth below the original sample surface, and the profiles thus show the depth distribution of each monitored component. The results for all surfaces apart from the 50 nm surface clearly indicate the presence of a calcium phosphate layer on top of the titanium oxide substrate but below a layer of cell/ECM material at the sample surface.
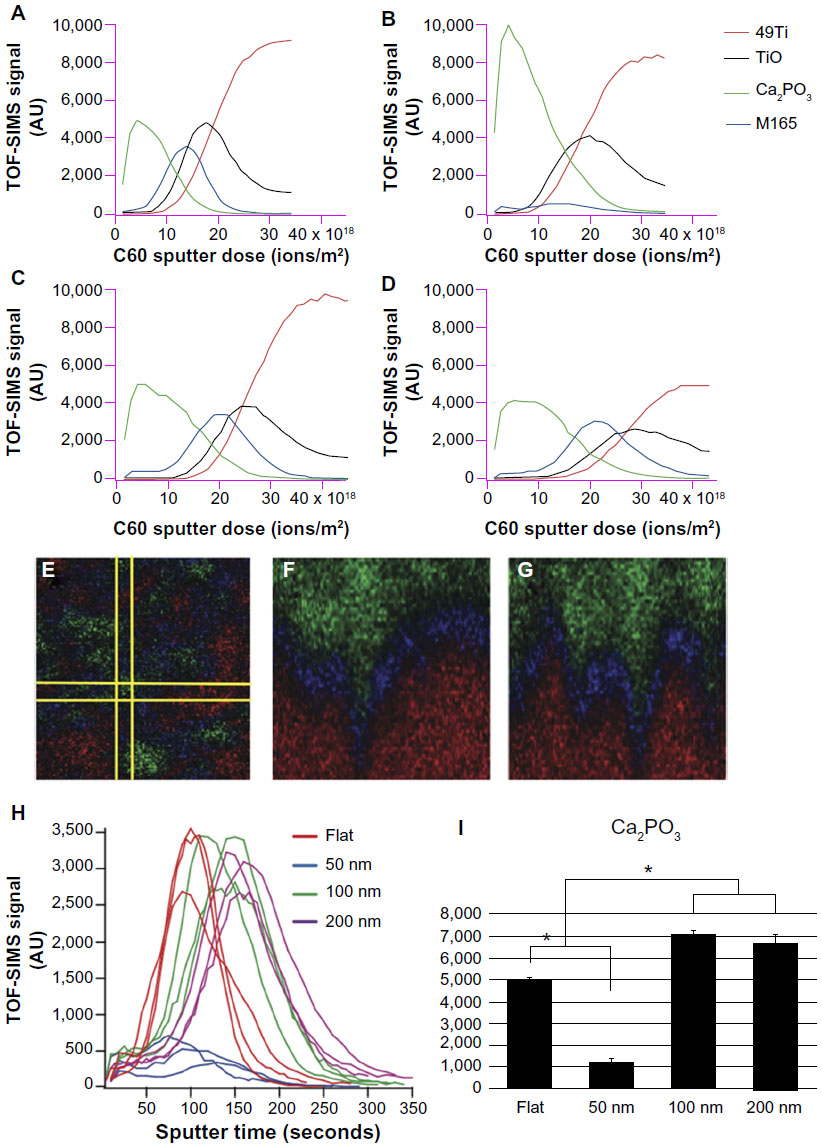 | Figure 8 Time-of-flight secondary ion mass spectroscopy depth profiles showing the signal intensities of secondary ions representing titanium (red, 49Ti+), titanium oxide (black, TiO+), cell/extracellular matrix material (green, Na3SO4+) and calcium phosphate (blue, Ca2PO3+) from human mesenchymal stem cells cultured on flat (A), 50 nm (B), 100 nm (C), and 200 nm (D) surfaces. Three-color overlay images, obtained from human mesenchymal stem cells cultured on the 100 nm surface, showing the signal intensities of cell/extracellular matrix material, calcium phosphate, and the titanium substrate (color codes and recorded signals as in A–D). Two-dimensional image of the sample surface after partial sputtering through the mineralized cell layer (E). Vertical cuts through the sample, as indicated in (E), in which the vertical dimension is represented by the sputtering time (F and G). Time-of-flight secondary ion mass spectroscopy depth profiles showing the signal intensities from Ca2PO3+ ions versus sputter time (depth) obtained from human mesenchymal stem cells cultured for 4 weeks on flat (red lines), 50 nm (blue lines), 100 nm (green lines), and 200 nm (pink lines) (H) surfaces. (I) Histograms displaying the amounts of deposited calcium phosphate as measured by integrated depth profiles shown in (H). |
The assignment to cell and/or ECM material was based on the observation of identical depth profiles (and three-dimensional distributions) for several ions, including Na2CN+ (m/z 71.98), Na2CNO+ (m/z 87.88), both of which can be associated with proteins, Na2Cl+ (m/z 80.95), and Na3SO4+ (m/z 164.92). Furthermore, the depth profiles and three-dimensional distributions of these ions were similar to those of protein-characteristic nitrogen-containing organic fragments, such as CH4N+ (m/z 30.03) and C4H8N+ (m/z 70.06), except for an initial drop observed for organic fragments owing to the molecular damage in organic structures caused by the C60+ sputtering,48,49 strongly indicating that these ions represent proteins and salts present in cells and/or ECM structures on the surface. In addition, the peaks assigned to cell/ECM material were also observed, with similar intensities in samples without induced mineralization.
Several peaks in the mass spectra could be assigned to calcium phosphate, based on comparisons with a reference spectrum recorded on a pure hydroxyapatite sample, including the Ca2PO3+ peak shown in Figure 8. All major ions present in an hydroxyapatite reference spectrum, including Ca+, CaOH+, Ca2O+, Ca2O2+, CaPO2+, Ca2PO+ and Ca2PO4+, showed very similar depth profile distributions. Regarding the titanium substrate, a peak in the TiO+ profile was always observed just before the maximum in the 49Ti+ signal was reached, indicating the presence of a thin titanium oxide layer on top of a metallic titanium coating.
Figure 8E–G shows three-color ion images of the three-dimensional distribution of the cell/ECM material (green), calcium phosphate (blue), and titanium substrate (red). Figure 8E shows a two-dimensional image of the sample surface after partial sputtering through the mineralized cell layer of the 100 nm sample. The spatial distribution of the different components is highly inhomogeneous, with some areas exposing the titanium substrate and some areas with cell/ECM material still remaining. Between areas of the titanium substrate and cell/ECM material, there is always a thin layer of calcium phosphate. These observations indicate that the cell/ECM layer on top of the sample is highly inhomogeneous and that the amount of sputtering needed to reach the titanium substrate therefore varies considerably depending on the exact position on the surface. This conclusion is confirmed in Figure 8F and G, which show the signal intensities of the three different components in two vertical cuts through the sample (as indicated in Figure 8E), where the vertical direction is represented by the sputtering time. The inhomogeneous thickness of the cell/ECM layer is evident in these images from the varying sputter time (vertical distance) needed to reach the titanium substrate. Interestingly, the images also show that the calcium phosphate layer below the cell/ECM material is highly homogeneous and covers the entire titanium oxide surface. This observation was made for all recorded depth profiles on all samples.
Figure 8H shows all the recorded depth profiles representing the calcium phosphate layer, while Figure 8I shows the relative amount of calcium phosphate in the different samples, obtained by integrating the Ca2PO3+ signal intensity as a function of C60+ sputter dose through the entire depth profile. The results indicate very low mineralization for the 50 nm sample compared with the other three surfaces and significantly higher matrix mineralization for the 100 nm and 200 nm surfaces compared with the flat surface. Interestingly, the low mineral signal for the 50 nm surface correlates with a stronger cell/ECM signal, while no overall differences were observed for the other surfaces.
Discussion
When inserting a permanent prosthetic device into a bone cavity, the ultimate goal for a successful outcome of the intervention is to achieve osseointegration of the implanted material. Osseointegration is the result of a cascade of various cellular and extracellular events, in which inflammation, regeneration, and remodeling overlap until the implant surface finally appears covered with newly formed bone.50 One crucial factor leading to osseointegration of the implanted device is recruitment of hMSCs and their eventual maturation into osteoblasts, ie, the cells responsible for bone formation.51 Cell recruitment and differentiation are highly dependent on the surface properties of the implanted device,29 with surface nanoscale topography expected to play an important role during the initial phase of the biological response to the implant.52 The development of nanomaterials with tailored surface topography opens up new potential for bone repair and regeneration by improving the biocompatibility of prosthetic devices and accelerating tissue growth after implantation.
In the present study, we assessed the ability of hemisphere-like particles of different sizes (50, 100, and 200 nm), independently of surface chemistry, to influence hMSC morphology, proliferation, and osteogenic differentiation. Despite the equivalent chemical composition, differences in surface nanotopography were associated with variations in the induced surface area, nanoparticle curvature, nanoparticle height over the surface plane, and wettability of the investigated surfaces.
Among other things, differences in surface wettability are recognized as influencing the adsorption of serum proteins quantitatively and qualitatively,52 resulting in unequal patterns of chemical cues, which may affect cell attachment and behavior. Cell adhesion to several material surfaces is dependent on the prior adsorption of specific serum proteins, including fibronectin and vitronectin,53 which support cell attachment to the surface and influence cell morphology.54–56 In this study, we demonstrated that hMSC morphology was affected by the underlying surface topography, specifically in terms of cell spread and the number of filopodia. Differences in the amount of serum proteins deposited on the investigated surfaces may account for the observed variation in cell morphology. For example, Sela et al found that the rate of serum protein deposition on titanium surfaces was directly proportional to the surface roughness, which can be explained to some extent by the increased surface area.52 On the other hand, a reasonable explanation for the observed differences in cell morphology may be that variations in surface topography affect the type and coverage ratios of adsorbed proteins,52 as well as protein conformation, orientation, and arrangement.57
Despite the finding that the wettability was highest for the 100 nm surface, cells cultured on 50 nm surfaces were the most affected, excluding the major role played by this surface parameter in controlling cell behavior. On the other hand, if only the nanostructured surfaces are compared, the strongest observed cellular response seems to correspond to the induced surface area S, particle curvature c ≈ d, particle height h, particle diameter d, and particle coverage C (all lowest for the 50 nm surface). Nevertheless, the surface area of the flat surface is even smaller than that of the 50 nm particles, but, if it is assumed that the cellular body rests mainly on the tips of the nanoparticles, as demonstrated by TEM, it becomes more relevant to consider the nanoparticle coverage C than the induced surface as the area available for cell attachment. This would clearly make the 50 nm surfaces the least favorable for cell attachment and spread. However, due to the shallowness of the 50 nm hemispheres, the adhered cells are also able to establish contact between the nanoparticles and we may therefore be observing a combined effect of nanoparticles and flat surface in between, which is impossible to separate in this case. For this reason, in order to investigate the cellular effects that are purely due to the reduced attachment area at nanoscale level, a new model system, in which not only nanostructure density but also its height would be kept constant, allowing only the nanostructure diameter to vary, would be needed. Similarly, as the particle curvature, diameter, height, and coverage are related to one another in the present study, it is only possible to speculate about the cell response to a complete set of these parameters. Separate experimental models are required to elucidate individual topographic factors and their influence on cells.
Filopodia are thin, actin-filled, cylindrical extensions of a cell membrane, known to be used by most cell types as a sensing organ to explore the surrounding environment in search of guidance cues and cell contacts (for a review, see Wood and Martin).58 In the present study, we demonstrate that the number of filopodia per cell, as well as their length and curvature, were affected by the underlying surface topography, with cells cultured on the nanopatterned topographies displaying fewer filopodia compared with cells on flat surfaces. Filopodia have recently been observed to interact with topographic features at the nanoscale level.16,59–62 In a similar fashion, we observed that hMSCs seeded on the nanopatterned surfaces appeared to show filopodia–nanobump interactions, with bends and distinct offshoots interacting directly with single nanobumps. There is evidence that incipient focal adhesions form at the filopodia tips, thus directing cell sensing and a cellular response (for a review, see Geiger et al).63 Individual nanobumps may be regarded as surface hot spots, resulting from a different adsorption pattern for serum proteins, which may present cells with chemical cues able to affect cellular behavior. Differences of this kind may, at least partially, explain the variations in cell morphology observed in this study. The expression analysis of genes involved in cell adhesion and responsible for signal transduction might significantly contribute to our understanding of cell sensing and biological response to the investigated nanostructured surfaces.
The differences in cell morphology might be associated with differences in the number of cells observed by SEM as early as 2 days after seeding. Cells displaying a well spread morphology were found to be more numerous. Similar findings were recently reported by Malmstrom et al, studying the effect of protein nanopatterning on cell behavior.64 In line with the early time-point observations, we found that, after 2 weeks, the average number of cells cultured on 50 nm surfaces was lower compared with those cultured on flat, 100 nm, and 200 nm surfaces, indicating a topographic effect on cell proliferation. However, it is unclear whether the lower proliferation rate observed for cells cultured on 50 nm surfaces is related to a lower cell doubling time or is associated with reduced cell viability, and further studies are needed to assess fully the basis of this finding.
In order to study the topographic effect on hMSC differentiation, we examined the expression of RUNX2, which is a transcriptional activator of osteoblastic differentiation.65 Human MSCs cultured on flat and 200 nm surfaces displayed a significantly higher expression of RUNX2 compared with hMSCs cultured on 50 nm surfaces. Interestingly, the trend observed in the expression level of RUNX2 correlates with the cell proliferation results. Cell-cell interaction and communication are essential events for tissue formation,66 and this applies particularly to cell–cell interactions mediated by specific cadherins, while gap junctions have been shown to play an important role in the osteogenic differentiation of MSCs.67,68 Tang et al recently demonstrated that there is a linear relationship between osteogenic differentiation potential and the number of cell–cell contacts.69 As a result, nanostructured surfaces, which are able to support cell proliferation, may indirectly favor cell differentiation by promoting cell–cell contact.
When analyzing the ALP activity of the different samples, we found that cells cultured on 100 nm and 200 nm surfaces displayed significantly higher ALP activity compared with cells cultured on 50 nm surfaces. ALP is an early marker of osteogenic differentiation70 and its activity is thought to play a central role in mineralization of the ECM of hard tissues.71 However, no significant differences were found if the ALP activity was normalized for the number of cells (data not shown). Despite this, the higher ALP activity observed per unit area may represent a beneficial condition when it comes to promoting mineralization and osseointegration of the implanted device in clinical applications. It is noteworthy that the increase in the level of ALP activity detected here correlates with the higher expression of RUNX2 observed for cells seeded on 100 nm and 200 nm surfaces.
In order to study the matrix mineralization ability of hMSCs cultured on all the investigated surfaces, a TOF-SIMS analysis of samples was performed. TOF-SIMS has recently been used for examination of matrix mineralization following osteogenic differentiation.72–75 In line with the observed increase in RUNX2 expression and ALP activity, we found that cells cultured on 100 nm and 200 nm surfaces displayed a significantly larger amount of calcium phosphate deposited in the matrix, which may be advantageous for in vivo applications of these surface modifications. The in vivo biological response to the investigated surfaces is a major focus of ongoing studies. Interestingly, the results obtained from depth-profile measurements of all samples revealed a downward localization of the calcium phosphate minerals in the samples, indicating that mineral deposition occurs beneath a layer of synthesized ECM. The surface-induced precipitation of calcium and phosphate, which is an indication of surface bioactivity, may result in spontaneous formation of hydroxyapatite crystals,76 and it is therefore important to explore the mineralization properties of the surfaces under investigation following immersion in simulated body fluids.
One major question is how nanoscale implant-surface features influence bone formation and osseointegration in vivo. Although relatively few experimental studies in the complex in vivo environment have been performed, recent observations demonstrate positive effects of titanium nanotopography on osseointegration (histology, ultrastructure, and removal torque).27,77–79
Taken together, the present results demonstrate that size variations in topographic features at the nanoscale level, independently of chemistry, can be exploited in order to systematically analyze the impact of nanoscale features on cell behavior. The opportunity to control cell behavior opens up important potential when it comes to the design of next-generation implant surfaces for biomedical applications.
Conclusion
The topographic nanostructuring of materials enables control of the morphology, proliferation, and osteogenic differentiation of hMSCs in a size-dependent fashion and offers great opportunities for elaboration of specific nanoscale surface topographies that will guide tissue regeneration and implant integration. In this paper, we report that colloidal lithography, in combination with coating technologies, represents a versatile approach to generating well defined two-dimensional experimental models for investigation of surface-induced cellular responses and has potential in the fabrication of large area surfaces on three-dimensional implants and scaffolds for a diverse set of biomedical applications.
Acknowledgments
We sincerely thank Katarina Junevik for performing the fluorescence-activated cell sorting analysis of isolated hMSCs. We acknowledge the BIOMATCELL VINN Excellence Center of Biomaterials and Cell Therapy, the Västra Götaland Region, the Swedish Research Council (K2012-52X-09495-25-3), an LUA/ALF research grant, the IngaBritt and Arne Lundberg Foundation, the Handlanden Hjalmar Svensson Foundation, the Area of Advance Materials Chalmers and GU Biomaterials, and JOIN(ed)T Marie Curie Action for financially supporting the study.
Disclosure
The authors report no conflicts of interest in this work.
References
Puleo DA, Nanci A. Understanding and controlling the bone-implant interface. Biomaterials. 1999;20(23–24):2311–2321. | |
Albrektsson T, Johansson C. Osteoinduction, osteoconduction and osseointegration. Eur Spine J. 2001;10 Suppl 2:S96–S101. | |
Hosseinkhani H, Hosseinkhani M, Hattori S, Matsuoka R, Kawaguchi N. Micro and nanoscale in vitro 3D culture system for cardiac stem cells. J Biomed Mater Res Part A. 2010;94:1–8. | |
Ou SF, Chen CS, Hosseinkhani H, et al. Surface properties of nano-structural silicon-doped carbon films for biomedical applications. Int J Nanotechnol. 2013;10:945–958. | |
Hosseinkhani H, Hosseinkhani M, Tian F, Kobayashi H, Tabata Y. Osteogenic differentiation of mesenchymal stem cells in self assembled-peptide amphiphile nanofibers. Biomaterials. 2006;27:4079–4086. | |
Kasemo B, Lausmaa J. Material-tissue interfaces: the role of surface properties and processes. Environ Health Perspect. 1994;102 Suppl 5:41–45. | |
Jäger M, Zilkens C, Zanger K, Krauspe R. Significance of nano- and microtopography for cell-surface interactions in orthopaedic implants. J Biomed Biotechnol. 2007;2007(8):69036. | |
Bettinger CJ, Langer R, Borenstein JT. Engineering substrate micro- and nanotopography to control cell function. Angew Chem Int Ed Engl. 2009;48(30):5406–5415. | |
Stevens MM, George JH. Exploring and engineering the cell surface interface. Science. 2005;310(5751):1135–1138. | |
Curtis A. Small is beautiful but smaller is the aim: review of a life of research. Eur Cell Mater. 2004;8:27–36. | |
Patel AA, Thakar RG, Chown M, Ayala P, Desai TA, Kumar S. Biophysical mechanisms of single-cell interactions with microtopographical cues. Biomed Microdevices. 2010;12(2):287–296. | |
Hsu SH, Chen CY, Lu PS, Lai CS, Chen CJ. Oriented Schwann cell growth on microgrooved surfaces. Biotechnol Bioeng. 2005;92(5):579–588. | |
Rovensky Yu A, Samoilov VI. Morphogenetic response of cultured normal and transformed fibroblasts, and epitheliocytes, to a cylindrical substratum surface. Possible role for the actin filament bundle pattern. J Cell Sci. 1994;107 Pt 5:1255–1263. | |
Rebollar E, Frischauf I, Olbrich M, et al. Proliferation of aligned mammalian cells on laser-nanostructured polystyrene. Biomaterials. 2008;29(12):1796–1806. | |
Gerecht S, Bettinger CJ, Zhang Z, Borenstein JT, Vunjak-Novakovic G, Langer R. The effect of actin disrupting agents on contact guidance of human embryonic stem cells. Biomaterials. 2007;28(28):4068–4077. | |
Dalby MJ, McCloy D, Robertson M, et al. Osteoprogenitor response to semi-ordered and random nanotopographies. Biomaterials. 2006;27(15):2980–2987. | |
Curtis AS, Seehar GM. The control of cell division by tension or diffusion. Nature. 1978;274(5666):52–53. | |
Galbraith CG, Yamada KM, Galbraith JA. Polymerizing actin fibers position integrins primed to probe for adhesion sites. Science. 2007; 315(5814):992–995. | |
Giancotti FG, Ruoslahti E. Integrin signaling. Science. 1999; 285(5430):1028–1032. | |
Blattler T, Huwiler C, Ochsner M, et al. Nanopatterns with biological functions. J Nanosci Nanotechnol. 2006;6(8):2237–2264. | |
Sniadecki NJ, Desai RA, Ruiz SA, et al. Nanotechnology for cell-substrate interactions. Ann Biomed Eng. 2006;34(1):59–74. | |
Voldman J, Gray ML, Schmidt MA. Microfabrication in biology and medicine. Annu Rev Biomed Eng. 1999;1:401–425. | |
Hanarp P, Sutherland D, Gold J, et al. Nanostructured model biomaterial surfaces prepared by colloidal lithography. Nanostruct Mater. 1999;12:429–432. | |
Agheli H, Malmström J, Hanarp P. Nanostructured biointerfaces. Mater Sci Eng C. 2006;26(5–7):911–917. | |
Yang SM, Jang SG, Choi DG. Nanomachining by colloidal lithography. Small. 2006;2(4):458–475. | |
Wood MA. Colloidal lithography and current fabrication techniques producing in-plane nanotopography for biological applications. J R Soc Interface. 2007;4(12):1–17. | |
Ballo A, Agheli H, Lausmaa J, Thomsen P, Petronis S. Nanostructured model implants for in vivo studies: influence of well-defined nanotopography on de novo bone formation on titanium implants. Int J Nanomedicine. 2011;6:3415–3428. | |
Andersson AS, Brink J, Lidberg U, Sutherland DS. Influence of systematically varied nanoscale topography on the morphology of epithelial cells. IEEE Trans Nanobioscience. 2003;2(2):49–57. | |
Giavaresi G, Tschon M, Daly JH, et al. In vitro and in vivo response to nanotopographically-modified surfaces of poly(3-hydroxybutyrate-co-3-hydroxyvalerate) and polycaprolactone. J Biomater Sci Polym Ed. 2006;17(12):1405–1423. | |
Dalby MJ, Gadegaard N, Herzyk P, et al. Group analysis of regulation of fibroblast genome on low-adhesion nanostructures. Biomaterials. 2007;28(10):1761–1769. | |
Rice JM, Hunt JA, Gallagher JA, Hanarp P, Sutherland DS, Gold J. Quantitative assessment of the response of primary derived human osteoblasts and macrophages to a range of nanotopography surfaces in a single culture model in vitro. Biomaterials. 2003;24(26):4799–4818. | |
Yang K, Jung K, Ko E, et al. Nanotopographical manipulation of focal adhesion formation for enhanced differentiation of human neural stem cells. ACS Appl Mater Interfaces. 2013;5(21):10529–10540. | |
Hempel U, Hefti T, Dieter P, Schlottig F. Response of human bone marrow stromal cells, MG-63, and SaOS-2 to titanium-based dental implant surfaces with different topography and surface energy. Clin Oral Implants Res. 2013;24(2):174–182. | |
Fiedler J, Ozdemir B, Bartholomä J, Plettl A, Brenner RE, Ziemann P. The effect of substrate surface nanotopography on the behavior of multipotent mesenchymal stromal cells and osteoblasts. Biomaterials. 2013;34(35):8851–8859. | |
Caplan AI. Mesenchymal stem cells. J Orthop Res. 1991;9(5):641–650. | |
Tapp H, Hanley EN Jr, Patt JC, Gruber HE. Adipose-derived stem cells: characterization and current application in orthopaedic tissue repair. Exp Biol Med. 2009;234(1):1–9. | |
Matsumoto T, Kuroda R, Mifune Y, et al. Circulating endothelial/skeletal progenitor cells for bone regeneration and healing. Bone. 2008;43(3):434–439. | |
Jager M, Zilkens C, Bittersohl B, Krauspe R. Cord blood – an alternative source for bone regeneration. Stem Cell Rev. 2009;5(3):266–277. | |
Danisovic L, Varga I, Polak S, Ulicna M, Bohmer D, Vojtassak J. Morphology of in vitro expanded human muscle-derived stem cells. Biomed Pap Med Fac Univ Palacky Olomouc Czech Repub. 2008;152(2):235–238. | |
Pittenger MF, Mackay AM, Beck SC, et al. Multilineage potential of adult human mesenchymal stem cells. Science. 1999;284(5411):143–147. | |
Kieswetter K, Schwartz Z, Dean DD, Boyan BD. The role of implant surface characteristics in the healing of bone. Crit Rev Oral Biol Med. 1996;7(4):329–345. | |
Liao H, Andersson AS, Sutherland D, Petronis S, Kasemo B, Thomsen P. Response of rat osteoblast-like cells to microstructured model surfaces in vitro. Biomaterials. 2003;24(4):649–654. | |
de Peppo GM, Svensson S, Lenneras M, et al. Human embryonic mesodermal progenitors highly resemble human mesenchymal stem cells and display high potential for tissue engineering applications. Tissue Eng Part A. 2010;16(7):2161–2182. | |
Rozen S, Skaletsky H. Primer3 on the WWW for general users and for biologist programmers. Methods Mol Biol. 2000;132:365–386. | |
Wenzel RN. Resistance of solid surfaces to wetting by water. Ind Eng Chem. 1936;28:988–994. | |
Quéré D. Rough ideas on wetting. Physica A. 2002;313(1–2):32–46. | |
Ishino C, Okumura K. Wetting transitions on textured hydrophilic surfaces. Eur Phys J E. 2008;25(4):415–424. | |
Winograd N, Garrison BJ. Biological cluster mass spectrometry. Annu Rev Phys Chem. 2010;61:305–322. | |
Wucher A. Molecular secondary ion formation under cluster bombardment: a fundamental review. Appl Surf Sci. 2006;252(19):6482–6489. | |
Palmquist A, Omar O, Esposito M, Lausmaa J, Thomsen P. Titanium oral implants: surface characteristics, interface biology and clinical outcome. J R Soc Interface. 2010;7(5):515–527. | |
Bilezikian JP, Raisz LG, Rodan GA. Principles of Bone Biology. San Diego, CA, USA: Academic Press; 1996. | |
Sela MN, Badihi L, Rosen G, Steinberg D, Kohavi D. Adsorption of human plasma proteins to modified titanium surfaces. Clin Oral Implants Res. 2007;18(5):630–638. | |
Sousa SR, Brás MM, Moradas-Ferreira P, Barbosa MA. Dynamics of fibronectin adsorption on TiO2 surfaces. Langmuir. 2007;23(13):7046–7054. | |
Howlett CR, Evans MD, Walsh WR, Johnson G, Steele JG. Mechanism of initial attachment of cells derived from human bone to commonly used prosthetic materials during cell culture. Biomaterials. 1994;15(3):213–222. | |
Berrier AL, Yamada KM. Cell-matrix adhesion. J Cell Physiol. 2007;213(3):565–573. | |
Steele JG, Dalton BA, Johnson G, Underwood PA. Polystyrene chemistry affects vitronectin activity: an explanation for cell attachment to tissue culture polystyrene but not to unmodified polystyrene. J Biomed Mater Res. 1993;27(7):927–940. | |
Sutherland DS, Broberg M, Håkan Nygren H, et al. Influence of nanoscale surface topography and chemistry on the functional behaviour of an adsorbed model macromolecule. Macromol Biosci. 2001;1(6):270–273. | |
Wood W, Martin P. Structures in focus – filopodia. Int J Biochem Cell Biol. 2002;34(7):726–730. | |
Lim JY, Hansen JC, Siedlecki CA, Runt J, Donahue HJ. Human foetal osteoblastic cell response to polymer-demixed nanotopographic interfaces. J R Soc Interface. 2005;2(2):97–108. | |
Yang L, Sheldon BW, Webster TJ. The impact of diamond nanocrystallinity on osteoblast functions. Biomaterials. 2009;30(20):3458–3465. | |
Dalby MJ, Riehle MO, Sutherland DS, et al. Changes in fibroblast morphology in response to nano-columns produced by colloidal lithography. Biomaterials. 2004;25(23):5415–5422. | |
Dalby MJ, Riehle MO, Johnstone H, Affrossman S, Curtis AS. Investigating the limits of filopodial sensing: a brief report using SEM to image the interaction between 10 nm high nano-topography and fibroblast filopodia. Cell Biol Int. 2004;28(3):229–236. | |
Geiger B, Spatz JP, Bershadsky AD. Environmental sensing through focal adhesions. Nat Rev Mol Cell Biol. 2009;10(1):21–33. | |
Malmstrom J, Christensen B, Jakobsen HP, et al. Large area protein patterning reveals nanoscale control of focal adhesion development. Nano Lett. 2010;10(2):686–694. | |
Ducy P, Zhang R, Geoffroy V, Ridall AL, Karsenty G. Osf2/Cbfa1: a transcriptional activator of osteoblast differentiation. Cell. 1997; 89(5):747–754. | |
Vleminckx K, Kemler R. Cadherins and tissue formation: integrating adhesion and signaling. Bioessays. 1999;21(3):211–220. | |
Kawaguchi J, Kii I, Sugiyama Y, Takeshita S, Kudo A. The transition of cadherin expression in osteoblast differentiation from mesenchymal cells: consistent expression of cadherin-11 in osteoblast lineage. J Bone Miner Res. 2001;16(2):260–269. | |
Donahue HJ, McLeod KJ, Rubin CT, et al. Cell-to-cell communication in osteoblastic networks: cell line-dependent hormonal regulation of gap junction function. J Bone Miner Res. 1995;10(6):881–889. | |
Tang J, Peng R, Ding J. The regulation of stem cell differentiation by cell-cell contact on micropatterned material surfaces. Biomaterials. 2010;31(9):2470–2476. | |
Siffert RS. The role of alkaline phosphatase in osteogenesis. J Exp Med. 1951;93(5):415–426. | |
Salomon CD. A fine structural study on the extracellular activity of alkaline phosphatase and its role in calcification. Calcif Tissue Res. 1974;15(3):201–212. | |
Malmberg P, Nygren H. Methods for the analysis of the composition of bone tissue, with a focus on imaging mass spectrometry (TOF-SIMS). Proteomics. 2008;8(18):3755–3762. | |
Eriksson C, Malmberg P, Nygren H. Time-of-flight secondary ion mass spectrometric analysis of the interface between bone and titanium implants. Rapid Commun Mass Spectrom. 2008;22(7):943–949. | |
de Peppo GM, Sjovall P, Lennerås M, et al. Osteogenic potential of human mesenchymal stem cells and human embryonic-derived mesodermal progenitors: a tissue engineering perspective. Tissue Eng Part A. 2013;19(1–2):175–187. | |
Bigdeli N, de Peppo GM, Lenneras M, et al. Superior osteogenic capacity of human embryonic stem cells adapted to matrix-free growth compared to human mesenchymal stem cells. Tissue Eng Part A. 2010;16(11):3427–3240. | |
Kokubo T, Takadama H. How useful is SBF in predicting in vivo bone bioactivity? Biomaterials. 2006;27(15):2907–2915. | |
Brånemark R, Emanuelsson L, Palmquist A, et al. Bone response to laser-induced micro- and nano-size titanium surface features. Nanomedicine. 2011;7(2):220–227. | |
Palmquist A, Emanuelsson L, Brånemark R, et al. Biomechanical, histological and ultrastructural analyses of laser micro- and nano- structured titanium implant after 6 months in rabbit. J Biomed Mater Res B Appl Biomater. 2011;97(2):289–298. | |
Lavenus S, Trichet V, Le Chevalier S, Hoornaert A, Louarn G, Layrolle P. Cell differentiation and osseointegration influenced by nanoscale anodized titanium surfaces. Nanomedicine (Lond). 2012;7(7):967–980. |
Supplementary figures
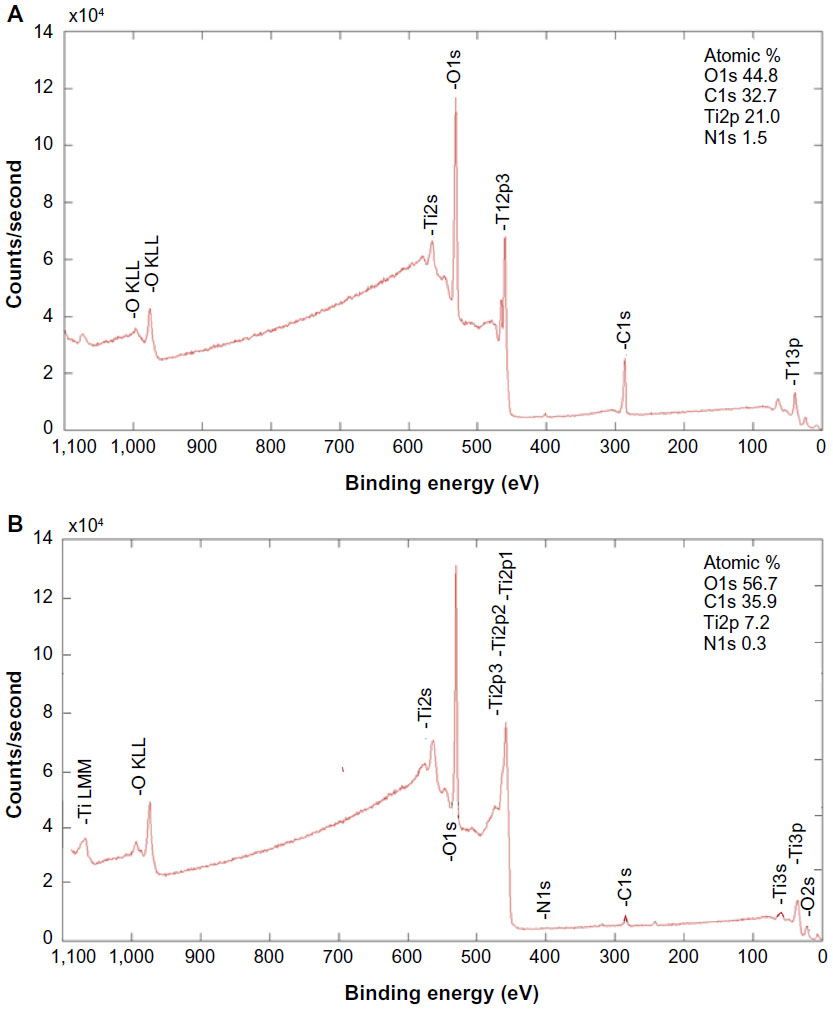 | Figure S1 X-ray photoelectron spectra of nanostructured surfaces before (A) and after (B) surface cleaning by Ar+ ion bombardment. The cleaning reduced both carbon and nitrogen peaks, which indicates that these peaks are due to surface contamination and not to exposure of underlying polystyrene particles. |
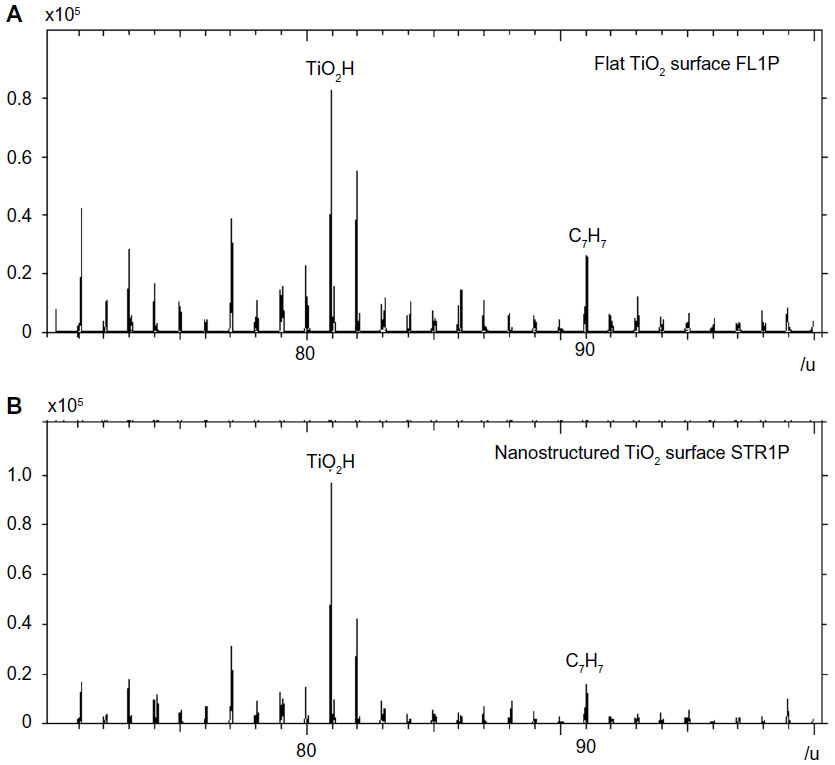 | Figure S2 Time-of-flight secondary ion mass spectroscopy positive ion spectra with indicated characteristic peaks of titanium (TiO2H+) and polystyrene (C7H7+) recorded on the reference flat surface (A) and nanostructured surface (B). The reference surface does not contain any polystyrene nanoparticles, so the C7H7+ peak in both cases appears due to general surface contamination at the trace detection level and not due to polystyrene particles used for nanopatterning. |
 © 2014 The Author(s). This work is published and licensed by Dove Medical Press Limited. The full terms of this license are available at https://www.dovepress.com/terms.php and incorporate the Creative Commons Attribution - Non Commercial (unported, v3.0) License.
By accessing the work you hereby accept the Terms. Non-commercial uses of the work are permitted without any further permission from Dove Medical Press Limited, provided the work is properly attributed. For permission for commercial use of this work, please see paragraphs 4.2 and 5 of our Terms.
© 2014 The Author(s). This work is published and licensed by Dove Medical Press Limited. The full terms of this license are available at https://www.dovepress.com/terms.php and incorporate the Creative Commons Attribution - Non Commercial (unported, v3.0) License.
By accessing the work you hereby accept the Terms. Non-commercial uses of the work are permitted without any further permission from Dove Medical Press Limited, provided the work is properly attributed. For permission for commercial use of this work, please see paragraphs 4.2 and 5 of our Terms.