")
Back to Journals » International Journal of Nanomedicine » Volume 12
Osteogenic activity of titanium surfaces with hierarchical micro/nano-structures obtained by hydrofluoric acid treatment
Authors Liang J, Xu S, Shen M, Cheng B, Li Y, Liu X, Qin D, Bellare A, Kong L
Received 5 October 2016
Accepted for publication 29 December 2016
Published 16 February 2017 Volume 2017:12 Pages 1317—1328
DOI https://doi.org/10.2147/IJN.S123930
Checked for plagiarism Yes
Review by Single anonymous peer review
Peer reviewer comments 4
Editor who approved publication: Professor Lei Yang
Jianfei Liang,1,* Shanshan Xu,1,* Mingming Shen,2,* Bingkun Cheng,3 Yongfeng Li,4 Xiangwei Liu,1 Dongze Qin,1 Anuj Bellare,5 Liang Kong1
1State Key Laboratory of Military Stomatology & National Clinical Research Center for Oral Disease & Shaanxi Key Laboratory of Oral Diseases, Department of Oral and Maxillofacial Surgery, School of Stomatology, The Fourth Military Medical University, Xi’an, 2Department of Stomatology, Xinhua Hospital of Beijing, Beijing, 3Department of Oral and Maxillofacial Surgery, School of Stomatology, The Second Hospital of Hebei Medical University, Shijiazhuang, 4Department of Stomatology, Chinese PLA 532 Hospital, Huangshan, People’s Republic of China; 5Department of Orthopedic Surgery, Brigham and Women’s Hospital, Harvard Medical School, Boston, MA, USA
*These authors contributed equally to this work
Abstract: An easier method for constructing the hierarchical micro-/nano-structures on the surface of dental implants in the clinic is needed. In this study, three different titanium surfaces with microscale grooves (width 0.5–1, 1–1.5, and 1.5–2 µm) and nanoscale nanoparticles (diameter 20–30, 30–50, and 50–100 nm, respectively) were obtained by treatment with different concentrations of hydrofluoric acid (HF) and at different etching times (1%, 3 min; 0.5%, 12 min; and 1.5%, 12 min, respectively; denoted as groups HF1, HF2, and HF3). The biological response to the three different titanium surfaces was evaluated by in vitro human bone marrow-derived mesenchymal stem cell (hBMMSC) experiments and in vivo animal experiments. The results showed that cell adhesion, proliferation, alkaline phosphatase activity, and mineralization of hBMMSCs were increased in the HF3 group. After the different surface implants were inserted into the distal femurs of 40 rats, the bone–implant contact in groups HF1, HF2, and HF3 was 33.17%±2.2%, 33.82%±3.42%, and 41.04%±3.08%, respectively. Moreover, the maximal pullout force in groups HF1, HF2, and HF3 was 57.92±2.88, 57.83±4.09, and 67.44±6.14 N, respectively. The results showed that group HF3 with large micron grooves (1.5–2.0 µm) and large nanoparticles (50–100 nm) showed the best bio-functionality for the hBMMSC response and osseointegration in animal experiments compared with other groups.
Keywords: hydrofluoric acid etching, surface modification, micro-/nano-structures, osteogenic activity, titanium implant
Introduction
Current trends in dental implant therapy include the use of endosseous dental implant surfaces embellished with hierarchical micro-/nano-structures for effective and rapid osseointegration.1,2 First, from the biomechanical perspective, the micron-structured surface allows the modeling of bone elastic behavior,3 which can provide flow channels for fluid flow,4 enhance molecular and cellular transport, and induce shear stresses via fluid drag at cell surfaces. Nano-structured surface allows cells to orient in the groove direction, resulting in cytoskeleton alignment and cell rearrangement along the nanoscale guidance cue.5 Second, from the physical perspective, micron-structured surface can increase bone–implant contact (BIC), which is identified by measuring the physical interaction between rough implants and bone in pushout or torque removal assays.6,7 Nano-structured surface (nanocrystals, nanofibers, nanocomposites, etc.) can imitate the natural extracellular matrix (ECM)8,9 and has been widely studied in the field of regenerative medicine. Third, from the molecular perspective, micron-structured surface may involve surface signaling hypothesis for osteogenesis.10–13 Nano-structured surface contains nanoscale cell receptors/mechanosensors to microscale signal transducers because of nanoscale adhesion-localized structures.14 Hierarchical micro-/nano-structures may lead to more balanced enhancement of multiple cell functions such as morphology, migration, adhesion, proliferation, and differentiation.15,16 Furthermore, from a biomimetic perspective, a hierarchical micro-/nano-structure may provide a more suitable surface topography for cell functions as it can better mimic the structure of the bone tissues composed of nano-, micro-, and macroscale building blocks.17
Various combinations of hierarchical micro-/nano-structured surfaces are typically composed of microstructures including micropits,18 micropillars, and microgrooves,19 as well as nanostructures such as nanoleaves, nanoplates, nanorods, nanowires, nanotubes, and nanoparticles.16,20,21 Micropits and micropillars are typically arranged in an organized manner (isotropic) rather than an unorganized manner (anisotropic) on the microgrooves.22 It has been reported that the microscopic bone properties of cancellous and cortical bone enable them to be more suitable for use with the anisotropic surface for interlocking.23 Nanoleaves may provide a larger contact area for adherent cells compared to nanoplates; however, the production process is complicated.20 Nanorods are typically used to limit the contact area between cells and a nanorod-patterned surface to eliminate cell adhesion. Although stem cells can survive for long periods of time on surfaces sparsely coated with SiO2 nanowires, their high energy consumption is a disadvantage.24 Nanotubules are promising candidates as drug-delivery systems for increasing the amounts of calcium and phosphorous on the surfaces.25 Among these nanostructures, nanoparticles have been widely applied because of the following advantages: increasing integrin molecule clustering to enhance adhesion; facilitating matrix flow by forming interconnected microporous structures; and enabling easy fabrication of dense nano-arrays.26–28
Recently, numerous approaches, including physical, biological, optical, and chemical methods, have been employed to fabricate nanoparticles with titanium surfaces to improve BIC.26,29 Physical methods such as the compaction of TiO2 nanoparticles yield surfaces with nanoscale grain boundaries,30 which conserves the chemistry of the surface among different topographies, but are limited to linear and isotropic materials. Biological methods such as molecular self-assembly involve the spontaneous chemisorption and vertical close-packed positioning of molecules (osteoinductive or cell-adhesive molecule) onto specific substrata; however, the bond strength may be weak. Optical methods such as lithography typically rely on wavelength-specific dimensions to achieve appropriate nanoscale modifications; however, the approach is labor-intensive and requires considerable development prior to clinical translation.31 Chemical methods involving acid-etching, peroxidation, alkali treatment, anodization, and nanoparticle deposition such as sol–gel (colloidal particle adsorption) can impart nanoparticles to the surface and display strong physical interactions at the atomic-scale level.32 Among these chemical methods, acid etching with hydrofluoric acid (HF) has been used to create hierarchical micro-/nano-structures because of its high efficiency, simple operation, high volume of production, and incorporation of the osteogenic element fluoride ion onto surfaces.33–35
Numerous studies have reported that titanium surfaces treated with HF exhibit irregular rough hierarchical micro-/nano-structures, but most studies utilized the method to form microgrooves on titanium surfaces to provide a greater bonding surface area.36–38 Previous studies revealed that variations in acid concentrations and immersion time significantly affected these structures.36,37 However, no studies have analyzed the fine structures of hierarchical micro-/nano-structures on the titanium surface etched by HF. Literature review and preliminary experiments revealed that gradient scales of hierarchical micro-/nano-structures can be formed by precisely controlling the etching conditions. Thus, it is significant to determine an optimized scale for hierarchical micro-/nano-structures on the implant surface using HF etching to improve osseointegration.
In this study, we determined three gradient scales of hierarchical micro-/nano-structures on titanium surfaces obtained using different HF concentrations and etching times. In vitro experiments were performed to evaluate the biological response of human bone marrow-derived mesenchymal stem cells (hBMMSCs) to these titanium surfaces. In vivo experiments were performed to evaluate the effects of titanium implants with three gradient scales of micro-/nano-structures on osseointegration and bioactivity.
Materials and methods
Titanium disks preparation and surface modification
Commercially pure titanium disks (99.99% pure; ZhongBang Corporation, Xi’an, People’s Republic of China; n=500) with a diameter of 15 mm and height of 1 mm were ground and polished (Phoenix 4000; Buehler GmbH, Dusseldorf, Germany) in seven sequences. After polishing, the 108 disks were immersed in aqueous HF solutions at concentrations of 0.2%, 0.5%, 0.8%, 1%, 1.25%, and 1.5% (w/v) for respective etching times of 1, 3, 6, 9, 12, and 15 min, washed with deionized water, and stored at room temperature in 70 vol% ethanol. Sixty polished and cleaned titanium disks were used as a control group.
Surface characterization and chemical analysis
The structure of the control and fluoride-modified titanium disks and implant surface was characterized using a field emission scanning electron microscope (Hitachi S-4800 FE-SEM; Hitachi Ltd., Tokyo, Japan). The surface roughness of titanium samples was measured using an atomic force microscope (Nanoscope MultiMode & Explore SPM; Vecco Instrument, Plainview, NY, USA). Measurements by atomic force microscopy (AFM) were conducted in ambient air under tapping mode at a scan rate of 0.8413 Hz and scan size of 0.25×0.25 μm. Different areas of the surface for the control group and fluoride-modified groups were measured for statistical analysis.
The static contact angle was calculated using the sessile drop method with a video-based contact angle system (DSA30; Krüss, Hamburg, Germany) according to Young–Laplace fitting at room temperature. Contact angle measurements were performed for four different titanium disk surfaces from each group using ultrapure water (VWR, Radnor, PA, USA) as a wetting agent. The chemical composition of these titanium sample surfaces was analyzed by energy-dispersive spectroscopy (EDS) with scanning electron microscopy (SEM).
Human BMMSCs culture
Human-derived ilium cells of three donors were obtained after the iliac graft surgery after approval by an institutional review board (IRB) of the School of Stomatology of the Fourth Military Medical University (FMMU) and obtaining written informed consent. We extracted hBMMSCs from healthy cancellous bone. Standard cell culture procedures were used. Primary cells were treated with media containing low-glucose alpha-minimal essential medium (α-MEM), 20% fetal bovine serum (FBS), 1% glutamine, and 1% streptomycin/penicillin. Cells were cultured at 37°C and 5% CO2. The medium was changed every 3 days. Cells were passaged at 70% confluency with 60 cells seeded per square centimeter. The titanium samples were placed in a 24-well plate (Costar; Corning Incorporated, Corning, NY, USA), and the cells were seeded at a density of 2×10⁴ cells/mL for the assays, unless otherwise mentioned.
Count of adherent cells
Cells were seeded on titanium plates at a density of 5×10⁴ cells/mL. After incubation for 30, 60, and 120 min, the attached cells were stained using 4′,6′-diamidino-2-phenylindole (DAPI) (Sigma-Aldrich Co., St Louis, MO, USA). Positive cells were counted under an optical microscope (Olympus FluoView FV1000; Olympus Corporation, Tokyo, Japan) in five randomly selected fields at ×10 magnification.
Cell morphology
SEM analyses were performed to evaluate the morphology of hBMMSCs grown on the surface of both control and treated titanium plates. After cell culture for 6 h, the samples were washed with phosphate-buffered saline (PBS) and fixed with 0.25% glutaraldehyde in 0.1 M cacodylic acid buffer (pH 7.4) and then incubated for 15 min to ensure complete dissolution of the crystals. After fixation, the samples were sequentially dehydrated in a graded series of ethanol (70%, 80%, 90%, 95%, and 100%) for 10 min each, immersed in isoamyl acetate for 1.5 min, treated in a critical point dryer, and sputter-coated with a thin layer of Au. Cell morphology was observed by SEM.
Cytoskeleton assessment
The cytoskeleton was assessed by a confocal laser scanning microscope (Olympus FluoView FV1000). After culturing for 6 h, the cells on titanium samples were fixed in 3.7% formaldehyde for 5 min and then permeabilized with 0.1% Triton X-100. Subsequently, the samples were stained with 50 mg/mL fluorescein isothiocyanate (FITC)-labeled phalloidin (green fluorescence) (Sigma-Aldrich Co.) for 40 min, and then, nuclei were counterstained with DAPI (blue fluorescence) (Sigma-Aldrich Co.) for 5 min at room temperature in the dark. Finally, stained cells were inspected by confocal laser scanning microscopy (CLSM).
Alkaline phosphatase staining
After culturing for 7 and 14 days, the cells were washed and fixed, and alkaline phosphatase (ALP) staining was performed using a 5-Bromo-4-Chloro-3-Indolyl Phosphate/p-Nitro-Blue tetrazolium chloride ALP color development kit (Beyotime Institute of Biotechnology, Jiangsu, People’s Republic of China) for 30 min. Then, the cells were washed with PBS, and images were acquired. For each experiment, a minimum of three dishes was counted, and the experiments were repeated three times.
Alizarin Red staining
ECM mineralization of hBMMSCs was evaluated by Alizarin Red staining. After culturing for 7 and 14 days, the cells were washed three times with PBS, fixed in cold 3.7% formaldehyde for 20 min, and washed with PBS for 3 min. The cell cultures were stained with Alizarin Red for 10 min at room temperature. Cell monolayers were washed with distilled water until no more color appeared, and images were acquired.
Real-time PCR analysis of osteogenesis-related genes
Cells were plated on six-well plates at a density of 2×10⁴ cells/well and cultured in α-MEM supplemented with 10% FBS for 1, 3, and 7 days. The α-MEM was removed, and cells were washed three times with PBS. Total RNA was extracted using the Takara RNAiso Plus (Code No 9108). The subsequent reverse transcription reactions were performed using Prime Script™RT Master Mix (Takara Code No RR036A). Real-time quantitative polymerase chain reaction (PCR) was performed using an SYBR PCR Master Mix Kit (Takara) and 10 μM specific primers in a 25 μL volume. PCR amplification program consisted of 40 cycles under the following conditions: 94°C for 3 min, 94°C for 15 s, and 60°C for 30 s. The data were acquired using an iQ5 system (Bio-Rad). GAPDH was the housekeeping gene, and there were three target genes: Runx2, Alp, and Ocn. Sequences of sense and antisense primers were as follows: 5′-CCCACTCCTCCACCTTTGAC-3′ and 5′-TCTTCCTCTTGTGCTCTTGC-3′ for GAPDH; 5′-GCCTTCAAGGTGGTAGCCC-3′ and 5′-CGTTACCCGCCATGACAGTA-3′ for Runx2; 5′-CCACGTCTTCACATTTGGTG-3′ and 5′-AGACTGCGCCTGGTAGTTGT-3′ for Alp; 5′-GAAGCCCAGCGGTGCA-3′ and 5′-CACTACCTCGCTGCCCTCC-3′ for Ocn.
In vivo experiment
Animals and surgical procedures
All in vivo procedures strictly complied with the ethical and legal requirements under the Laboratory Animal Care & Welfare Committee of the FMMU on Animal Care guidelines for the care and use of laboratory animals and were approved by the Laboratory Animal Care & Welfare Committee of the FMMU. Twenty female Sprague Dawley rats (6 months old, 320±30 g) were included in this study. Forty implants with 10 for each group were randomly inserted into the distal femurs of 20 rats with one implant for each femur. The operations were performed under general anesthesia through intraperitoneal injection of sodium pentobarbital (40 mg/kg) (Merck Drugs and Biotechnology, NJ, USA) with lidocaine hydrochloride for local anesthesia. Postoperatively, 24 mg/kg penicillin was administered for three continuous days. Twelve weeks after implantation, the animals were sacrificed, and the femurs with implants were retrieved for histological analysis, and biomechanical test.
Histological analysis
Titanium implant samples in each group were maintained in 75% ethanol for 7 days. After dehydration through a graded series of ethanol and 100% acetone, the samples were embedded in polyester resin. We obtained 200 μm undecalcified sections with a sawing microtome (Leica SP 1600; Leica Microsystems, Wetzlar, Germany), and then polished these sections until a thickness of 100 μm. Images were captured using a fluorescence microscope (Leica Microsystems). After the fluorescence observation, the sections were stained with methylene blue/acid fuchsin and analyzed with a digitized image-analysis system (Leica Microsystems) coupled to a light microscope (Olympus Corporation) with a high-resolution video camera (card digital camera/red green blue color video camera; Sony) and a Trinitron monitor (Sony). BIC was calculated as the linear percentage of direct BIC to the total implant interface in the cancellous bone.
Biomechanical test
After the specimen harvest, the 10 samples in each group were quickly introduced to the biomechanical pullout test using a universal material testing system (AGS-10KNG; Shimadzu, Kyoto, Japan). The compression speed was set at 2 mm/min. The displacement versus force was recorded to calculate the maximal pullout force.
Statistical analysis
Data were analyzed with the Windows Version 13 Statistical Package for the Social Sciences (SPSS Inc., Chicago, IL, USA). One-way analysis of variance was used for multiple comparisons among these groups. All data were expressed as mean values with standard errors. The significance levels were notified significant (P<0.05) and highly significant (P<0.01) in the figures and tables.
Results
Surface properties of selected samples
SEM images clearly displayed the different scales of micro-/nano-structures of the 36 experimental group samples. The nanoparticle arrays were randomly organized over these substrates. We screened gradient scales of nanoparticles in the range of 20–100 nm and respective gradient scales of micron grooves from 36 experimental groups. We identified three groups with gradient scales of micro-/nano-structures etched by HF under three different etching conditions. Thus, we screened three gradient scales of hierarchical micro-/nano-structures from small to large at different HF concentrations and etching times (1%, 3 min; 0.5%, 12 min; 1.5%, 12 min) from 36 experimental group samples. Macroscopic surfaces (Figure 1A) showed that HF treatment visibly affected the titanium surfaces in all etched groups based on the change in surface brightness of the disks from polished (control group) to dull gray (etched groups). According to the SEM at a magnification of ×5,000, four groups presented micron-level changes. The polished group, as a control group, exhibited some parallel grooves in the same direction as polishing. However, the etched groups showed nonuniform grooves in inconsistent directions. In addition, the density of the micron grooves on the surface of the group HF3 decreased by more than that of the two etched groups. The depth and width of the micron grooves on the surface of the group HF3 exhibited larger values than the former two etched groups. The widths of micron grooves for the three etched groups were 0.5–1, 1–1.5, and 1.5–2 μm, respectively. At a magnification of ×50,000, only three etched groups exhibited nanoscale changes. The etched groups showed an irregular shape of nanoparticles distributed in an unordered manner. The diameters of these nanoparticles in the three etched groups were 20–30, 30–50, and 50–100 nm. AFM revealed that the HF1 groups had a dense and small particle-like structure. The group HF2 showed deep and steep mountain-like structures. The group HF3 showed relatively flat and larger hill-like structures. The control group showed no nano-level changes.
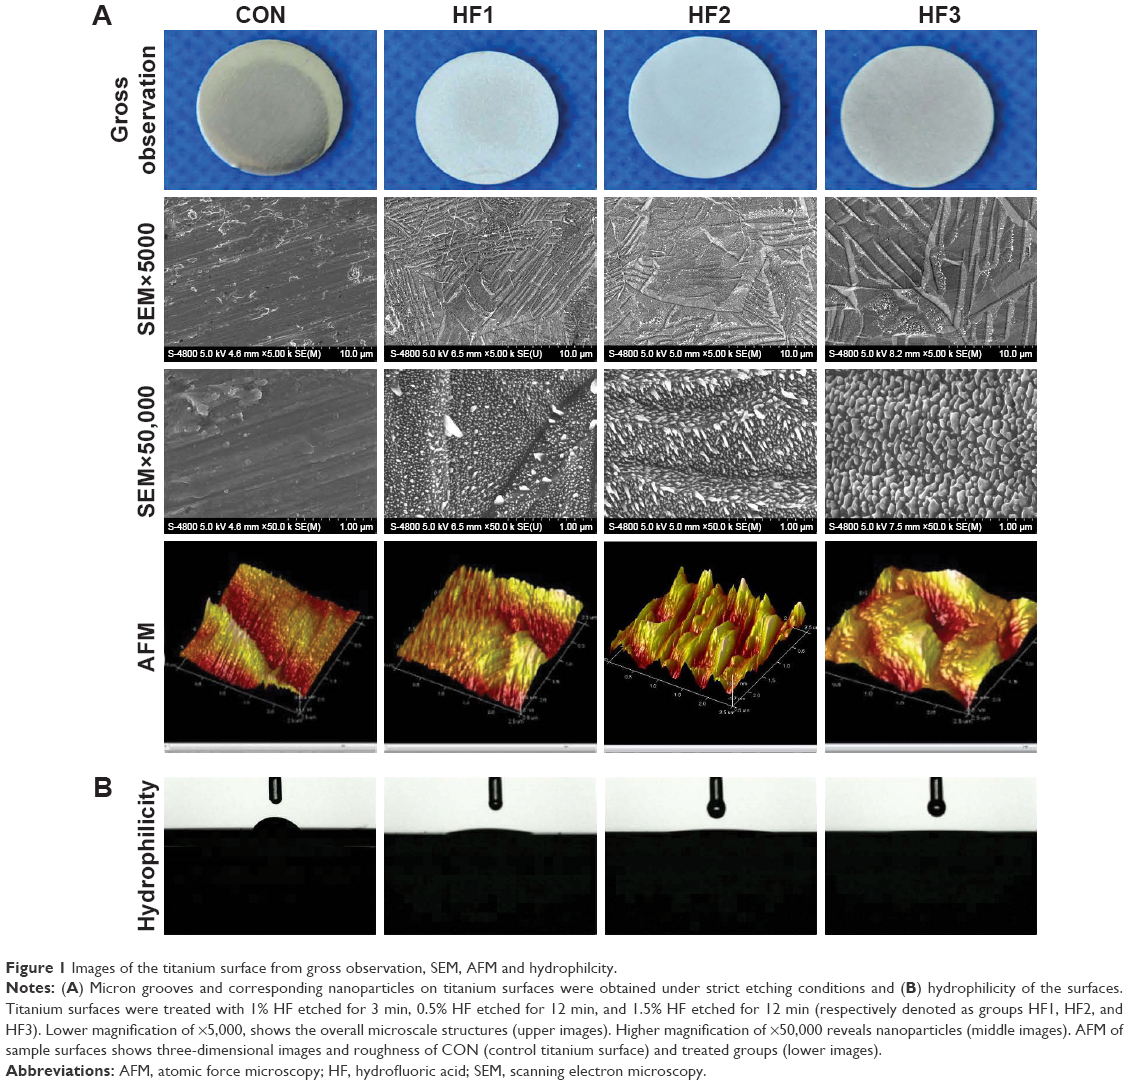 | Figure 1 Images of the titanium surface from gross observation, SEM, AFM and hydrophilcity. |
Surface wettability was measured by determining the water contact angles (Figure 1B). The etched groups exhibited high hydrophilicity compared to the control group. In addition, among the three treated groups, the group HF3 showed the highest hydrophilic properties because of its minimum contact angles (Table 1).
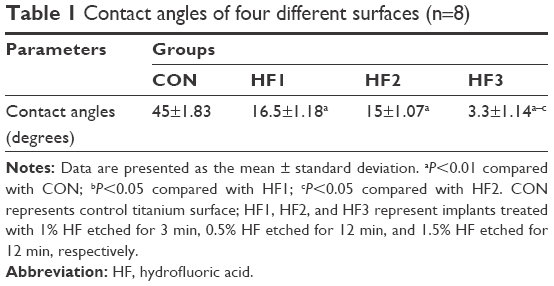 | Table 1 Contact angles of four different surfaces (n=8) |
Moreover, EDS (Table 2) confirmed that the fluoride contents on the surfaces of treated groups were 1.23%, 1.17%, and 1.30%, respectively. However, there were no significant differences in the surfaces of these treated groups.
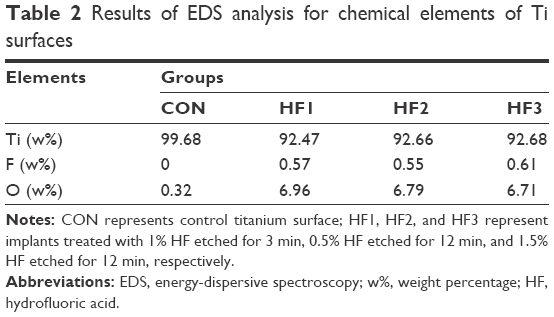 | Table 2 Results of EDS analysis for chemical elements of Ti surfaces |
Cell morphology and cytoskeleton assessment
As shown in Figure 2, a magnification of ×1,000 revealed a clear morphological difference in hBMMSCs on the different titanium plates. The cells on the etched groups spread over larger areas compared to cells in the control group. Among these etched groups, the group HF3 showed slightly larger spreading areas than the other two etched groups. Moreover, the cellular pseudopod on the group HF3 was larger than for the other two etched groups.
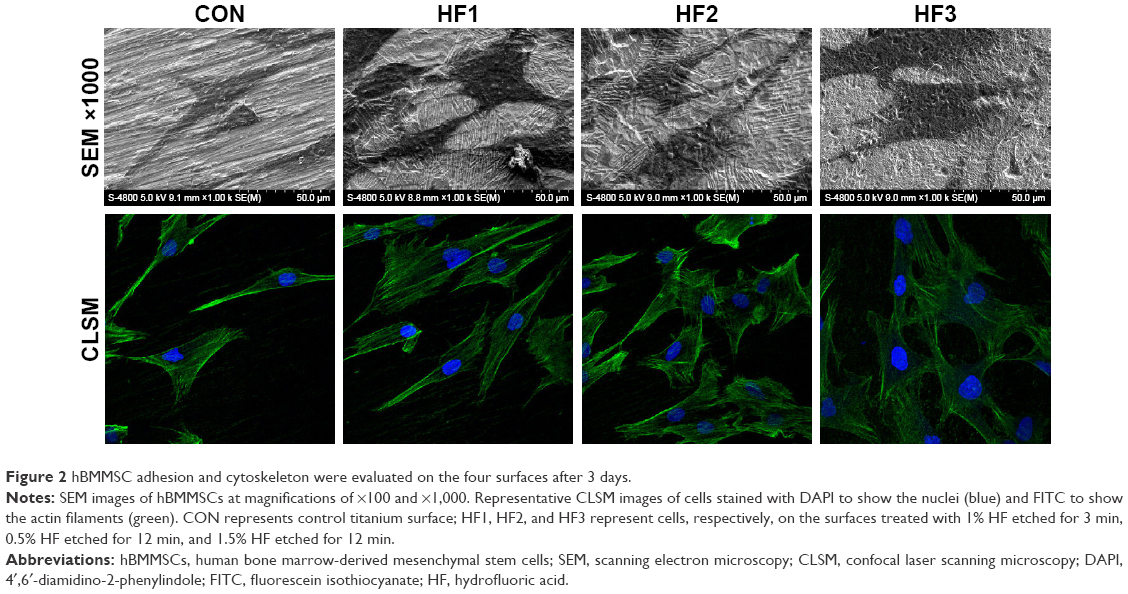 | Figure 2 hBMMSC adhesion and cytoskeleton were evaluated on the four surfaces after 3 days. |
The cytoskeleton morphology of hBMMSCs attached to sample surfaces was observed after 6 h of culture (Figure 2). The CLSM images showed hBMMSCs stained with FITC-phalloidin to label the actin cytoskeleton. A larger number of microfilaments and stress fibers (thicker bundles of filaments) were observed in the three etched groups. Strong labeling was frequently observed along the cellular edge and within the filopodia. In the control group, the cells were extended with many filopodia, but few cellular junctions were observed, and most cells did not exhibit a well-developed cytoskeleton. The actin bundles exhibited frequent haphazard orientation, and few long stress fibers were visible. However, cells on the etched surfaces were polygonous in shape with abundant long lamellipodia and filopodia forming good intercellular junctions between adjacent cells and exhibiting more stress fibers and actin microfilaments than those on the control. In addition, cells with flatter extensions and junctions were observed on the group HF3.
Number of adherent cells
The number of adherent cells on the titanium samples at the three time points (30, 60, and 120 min) of incubation is shown in Figure 3A. At each interval, the number of adherent cells on the etched groups was clearly higher than that on the control groups. Interestingly, in each etched group, there was no difference in the number of adherent cells following incubation for 30 and 120 min, while at 60 min, the number of adherent cells on the surface of group HF3 was significantly higher than for the other etched groups (Figure 3B) (P<0.05).
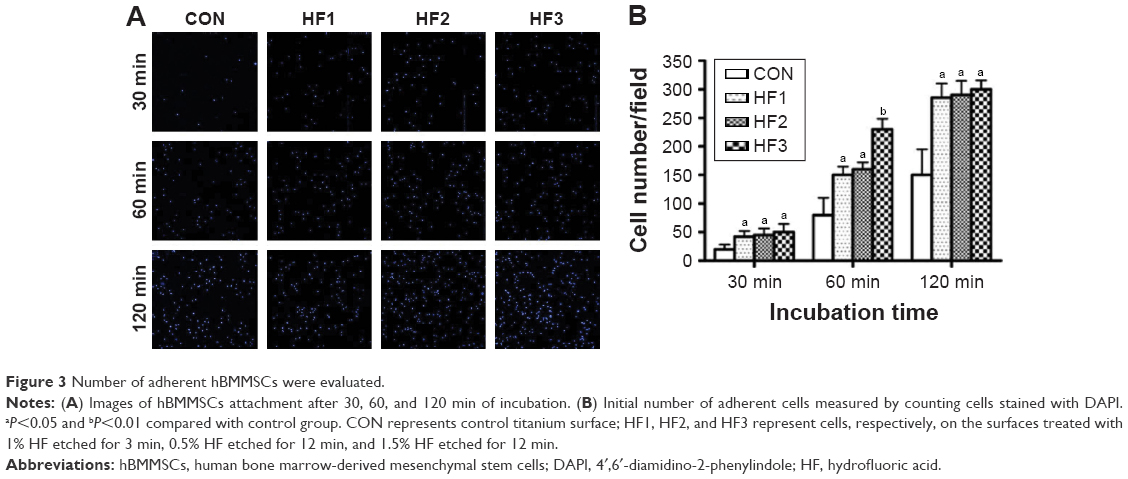 | Figure 3 Number of adherent hBMMSCs were evaluated. |
Osteogenic differentiation of hBMMSCs
As shown in Figure 4, ALP production in hBMMSCs on all substrates occurred as early as 1 week after incubation and increased over time. There were significant differences in ALP production between the control group and etched groups at each time point. There were no obvious differences in ALP production among the three etched groups. ECM mineralization was assessed by Alizarin Red staining at 7 and 14 days. The etched groups induced the formation of abundant mineralization nodules that were larger than those in the control group. Calcium deposition indicated that the ECM mineralization levels in the group HF3 were significantly higher than those in the other two groups.
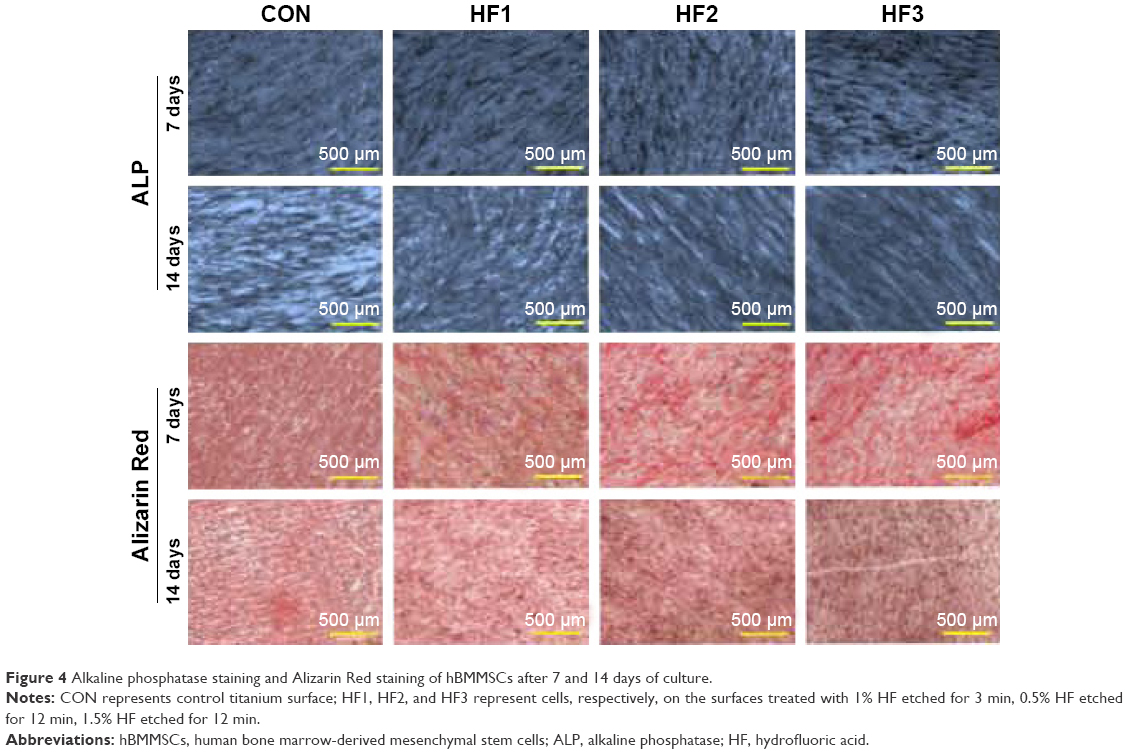 | Figure 4 Alkaline phosphatase staining and Alizarin Red staining of hBMMSCs after 7 and 14 days of culture. |
Osteogenesis-related gene expression
The gene expression of hBMMSCs on the titanium surfaces was quantified by real-time PCR as shown in Figure 5. In general, the gene expression in cells on the titanium surfaces was time-dependent. After 3 days of incubation, the Runx2, Alp, and Ocn showed the highest expression in the etched groups. However, Runx2 expression was higher in HF3 compared to the other two etched groups. After culturing for 7 days, the etched groups yielded higher expression for all genes except for Alp compared to the other surfaces. Gene expression in the group HF3 was maintained at a high level over time. Runx2, Alp, and Ocn showed much higher expression in the etched groups than in the control group.
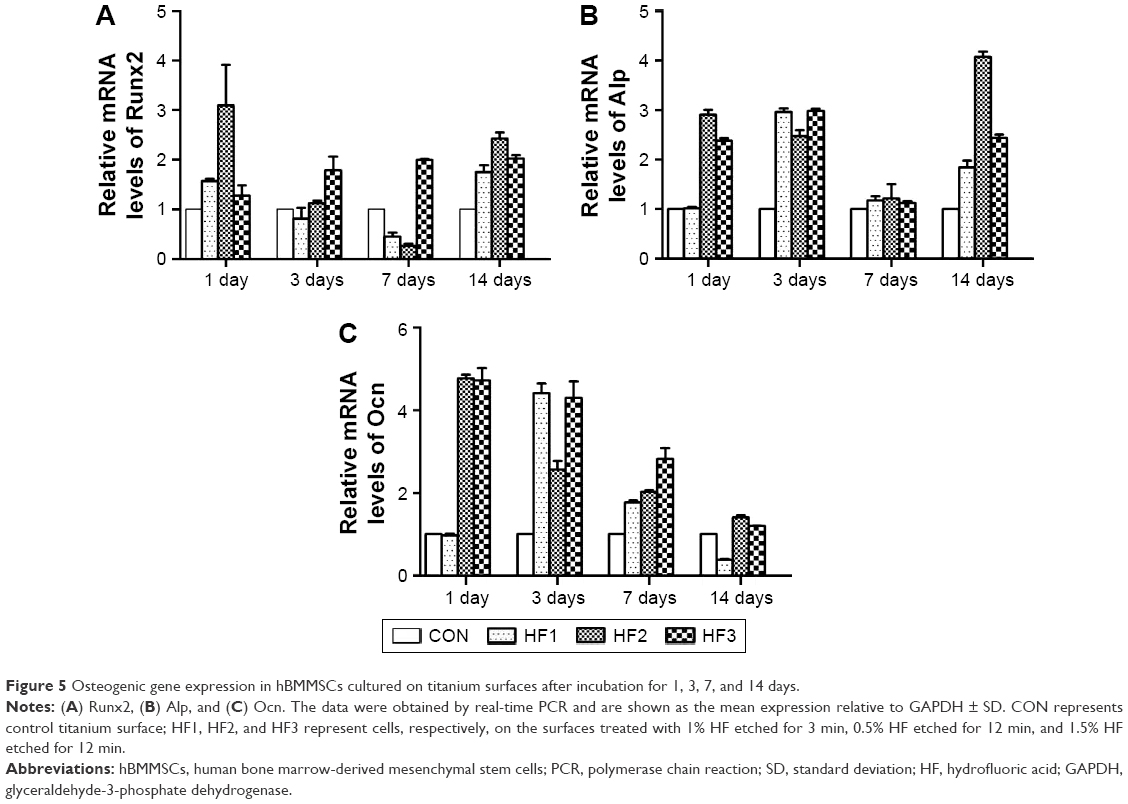 | Figure 5 Osteogenic gene expression in hBMMSCs cultured on titanium surfaces after incubation for 1, 3, 7, and 14 days. |
Histological analysis
The implants were etched by HF under the etching conditions described for the titanium plates. These implant surfaces exhibited gradient scales of hierarchical micro-/nano-structures as described (Figure 6A). The implants and osseointegration of peri-implant trabecular bones were observed in the undecalcified sections with methylene blue/acid fuchsin staining. Calcified bone in the stained slides was distinguished from other tissues by its characteristic color (Figure 6A). Bone tissue was stained bright pink, and the implant was stained black in the slides. One section from each sample was used for analysis, and the results of histomorphometry were expressed as BIC (Figure 6B). Three months after implantation, BIC% in the control group and groups HF1, HF2, and HF3 was 22.46%±1.98%, 33.17%±2.2%, 33.82%±3.42%, and 41.04%±3.08%, respectively (Table 3). There was a statistically significant difference in BIC% between the control group and other etched groups. Moreover, the group HF3 showed a statistically higher BIC% compared to the other two etched groups. Groups HF1 and HF2 showed insignificant differences in BIC%.
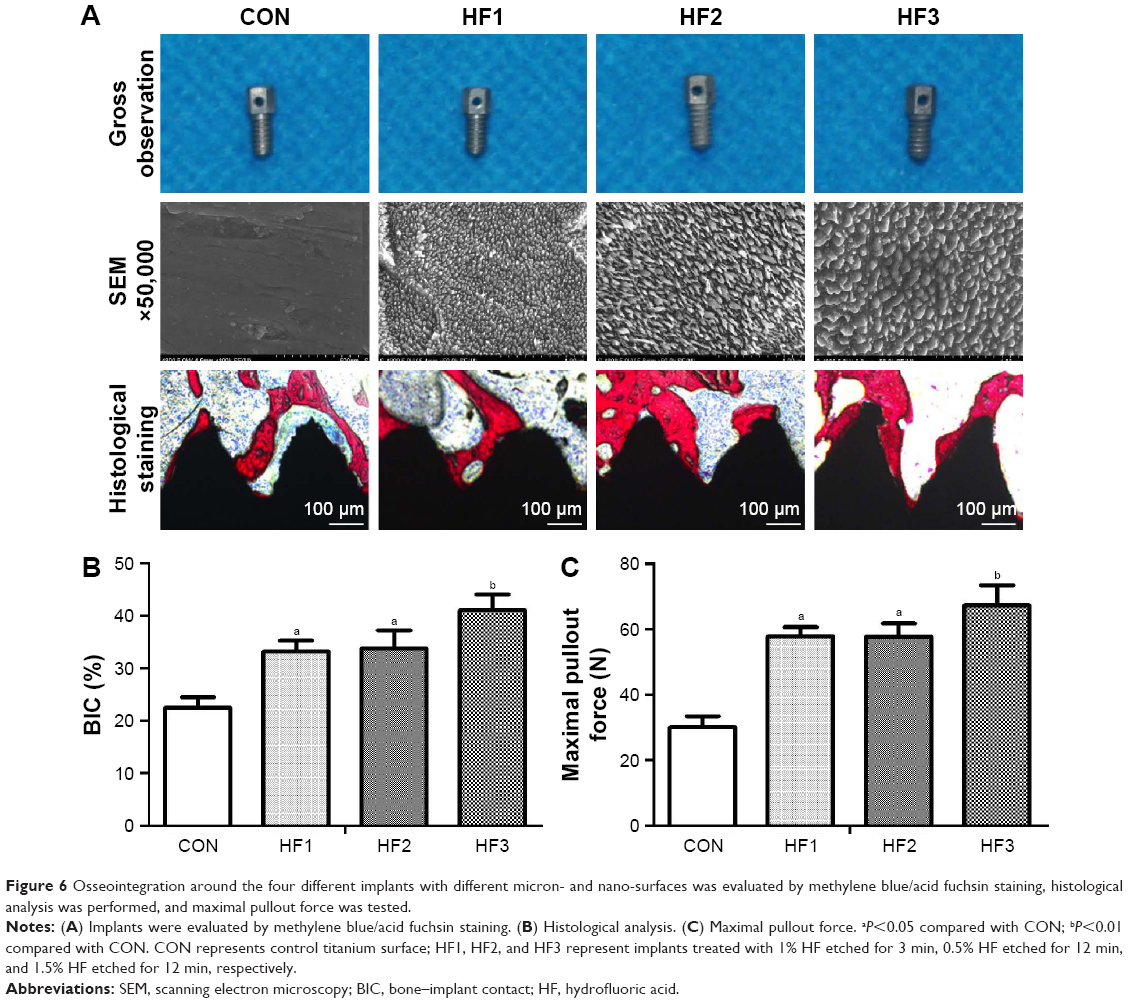 | Figure 6 Osseointegration around the four different implants with different micron- and nano-surfaces was evaluated by methylene blue/acid fuchsin staining, histological analysis was performed, and maximal pullout force was tested. |
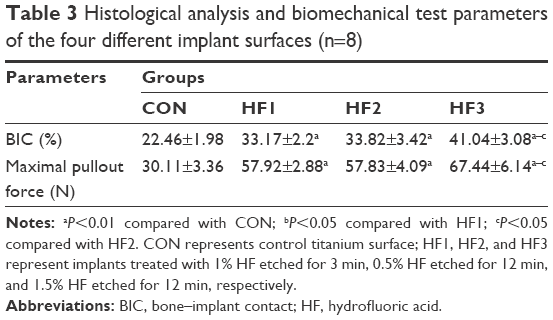 | Table 3 Histological analysis and biomechanical test parameters of the four different implant surfaces (n=8) |
Biomechanical test
Figure 6C shows the results for testing of the maximal pullout force of the four groups 12 weeks after implantation. The pullout forces of the etched groups were significantly higher than in the control groups (P<0.05). In the three treated groups, although there was no significant difference in the groups HF1 and HF2, the group HF3 showed the highest maximum pullout force.
Discussion
Micro-/nano-structures are widely thought to promote osseointegration. At the micron level, the structure of an implant surface can increase the contact surface between the bone and implant, and thus the biomechanical interlocking between the bone and implant.39 At the nano-level, a more textured surface structure increases surface energy. High surface energy increases the wettability to blood as well as binding of fibrin and matrix proteins. This condition favors cell attachment and tissue healing, particularly immediately after implantation, which is important in the osseointegration process.28 In this study, three gradient scales of hierarchical micro-/nano-structures were obtained by HF etching with different acid concentrations and etching times.
Micro-/nano-structures can be fabricated using additive methods and subtractive methods. Additive methods typically use templates fabricated through titanium plasma-spraying, electron-beam lithography, molecular self-assembly, and sol–gel transformation techniques, among others. These methods provide more complex micro-/nano-structures, and drugs can be coated onto the surface (such as the molecular self-assembly method)40 and sub-10 nm length scale structure can be achieved (such as electron-beam lithography).41 Subtractive methods typically use templates fabricated through blasting, peroxidation (H2O2) or acid oxidation, and acid etching.42 These methods are of particular interest because of the following advantages: loading of osteogenic drug and antibacterial element on surface, promotion of cell ingrowth through porous channel on surface, and adsorption of amino acid molecules.43 In these subtractive methods, HF etching is widely used for implant modification.44
A highly concentrated, pure aqueous solution of HF was first prepared in 1809, and hydrogen fluoride was first obtained at the end of the 18th century.45,46 The major applications of aqueous HF are as household and industrial products. In the medical field, HF etching can be used to modify implant surfaces due to the following advantages: First, random and irregular micro-/nano-structures can be obtained using HF without deliberate manipulation.35 The reason for this can be explained as follows. The etching in HF readily removes the natural oxide from the surface and dissolves titanium and generates Ti ion and F ion. Ti ion can be further oxidized by atmospheric oxygen or can be complexed by F ion. This treatment induces a micro rough surface, due to the preferential dissolution of the alpha phase of the biphasic alloy by HF.35 Considering the Ti–Al–V alloy, the alpha phase (rich in Al) is covered by a more efficient passivation film (since both Ti and Al occur in its formation), while the beta phase (rich in V) is passivated by a simple TiO2 film. A localized corrosion at the grain boundary between the alpha phase and beta one can be noticed causing surface beta crystal detachment and pitting effect.35 HF etching does not cause any variation of the surface morphology, and typical nanostructure is undamaged on the crests and on the valleys of the thread.47 Second, osteogenic fluorine elements can also be loaded onto the surface by bonding of oxygen and Ti to form TiFxOH, which can modulate osteogenesis by upregulating the expression levels of genes such as Runx2 and BSP.13,48 Third, aqueous HF is also highly efficient, of low cost, simple to use in industrialization, and shows a good clinical effect.33
Our results demonstrate that HF3 group became more hydrophilic and exhibited markedly improved wettability. A better understanding of the surface roughness and structure of modified titanium surfaces is a basic requirement for the discussion of wettability.49 The high-magnification SEM images (Figure 1A) also showed that similar nanoparticles were distributed in each experimental group and that the nanoparticles of the largest sizes were distributed in HF3 group. AFM three-dimensional images (Figure 1A) showed that the nanoparticles of the largest sizes were distributed in HF3 group, which indicates the largest surface roughness on HF3 group. This surface structure increases surface energy resulting in the good wettability. With a similar tendency, the contact angles of the HF3 group were lowest. Thus, surface hydrophilicity influences the adsorption of cell adhesion proteins containing Arg–Gly–Asp (RGD) sequences and thus enhances the adhesion and spreading of osteoblast precursors on implant surfaces.50 That is a good explanation for the results of hBMMSCs adhesion.
We found that the hierarchical micro-/nano-structures with micron groove widths of 1.5–2 μm and nanoparticle diameters of approximately 50–100 μm showed better osteogenic activity than the other two etched groups. These results can be explained as follows. First, from the micro perspective, a wide groove is beneficial for cell adhesion and high resistance to implantation friction.47 Cells on the flat part of the substrate spread randomly, while in the grooved part, the cells are elongated. It has been reported that the lamellipodia of cell edges preferentially adhere to the floor of 2.1 μm-wide grooves.5 Second, from the nano perspective, previous studies have shown that cell adhesion requires nanoscale adhesion-localized nanoparticles that change in response to integrin clustering.51 Filopodia are fine structures. Their adhesion to a material surface depends on the increased density of nanoparticles at focal adhesion sites. Supporting evidence for our hypothesis is that if individual RGD ligands of adhesion-related particles were present at a density of 70 nm apart (similarly to nanoparticles at a diameter of 70 nm), MSCs preferred to gather more individual integrins on the surface into mature adhesions.51 Shen et al demonstrated that the spreading, proliferation, and differentiation of MSCs could be greatly improved by hierarchical structures with large nanoparticles (80 nm) at the cellular and molecular levels.27
There were some limitations to our study. First, it was difficult to avoid chemical effects induced by fluorine ion during modification of a titanium surface with HF; however, we found that the fluorine content was equivalent in the three etched groups. Second, although osteogenic activity of the titanium surface was evaluated in vitro using hBMMSCs and in vivo using rats, effects of this surface must be evaluated in humans. Third, three selected groups with gradient scales of hierarchical micro-/nano-structures and other etched groups may require further evaluation. In addition, fatigue resistance and corrosion resistance were not evaluated after HF etching. Further characterizations of the disks and screw should be performed, and the mechanism underlying cell behavior changes on the three gradient micro-/nano-structure surfaces requires further analysis.
Conclusion
In summary, three gradient scales of hierarchical micro-/nano-structures on titanium surfaces were obtained by HF treatment with different acid concentrations and etching times. Hierarchical micro-/nano-structures with large micron grooves (1.5–2 μm) and nanoparticles (50–100 nm) enhanced cell behavior in vitro and promoted osteogenic activity in vivo, indicating promise in clinical applications.
Acknowledgments
This work was supported by the National Natural Science Foundation of China (number 81371186 and number 81670803) and Innovation Research Team in University (number IRT 13051).
Disclosure
The authors report no conflicts of interest in this work.
References
Gittens RA, Olivares-Navarrete R, Schwartz Z, Boyan BD. Implant osseointegration and the role of microroughness and nanostructures: lessons for spine implants. Acta Biomater. 2014;10(8):3363–3371. | ||
Haïat G, Wang HL, Brunski J. Effects of biomechanical properties of the bone-implant interface on dental implant stability: from in silico approaches to the patient’s mouth. Annu Rev Biomed Eng. 2014;16:187–213. | ||
Hellmich C, Kober C, Erdmann B. Micromechanics-based conversion of CT data into anisotropic elasticity tensors, applied to FE simulations of a mandible. Ann Biomed Eng. 2008;36(1):108–122. | ||
Sansalone V, Kaiser J, Naili S, Lemaire T. Interstitial fluid flow within bone canaliculi and electro-chemo-mechanical features of the canalicular milieu: a multi-parametric sensitivity analysis. Biomech Model Mechanobiol. 2013;12(3):533–553. | ||
Teixeira AI, Abrams GA, Bertics PJ, Murphy CJ, Nealey PF. Epithelial contact guidance on well-defined micro- and nanostructured substrates. J Cell Sci. 2003;116(Pt 10):1881–1892. | ||
Wong M, Eulenberger J, Schenk R, Hunziker E. Effect of surface topology on the osseointegration of implant materials in trabecular bone. J Biomed Mater Res. 1995;29(12):1567–1575. | ||
Wennerberg A, Ektessabi A, Albrektsson T, Johansson C, Andersson B. A 1-year follow-up of implants of differing surface roughness placed in rabbit bone. Int J Oral Maxillofac Implants. 1997;12(4):486–494. | ||
Armentano I, Bitinis N, Fortunati E, et al. Multifunctional nanostructured PLA materials for packaging and tissue engineering. Prog Polym Sci. 2013;38(10–11):1720–1747. | ||
Dvir T, Timko BP, Kohane DS, Langer R. Nanotechnological strategies for engineering complex tissues. Nat Nanotechnol. 2011;6(1):13–22. | ||
Cooper LF. Biologic determinants of bone formation for osseointegration: clues for future clinical improvements. J Prosthet Dent. 1998;80(4):439–449. | ||
Puleo DA, Nanci A. Understanding and controlling the bone-implant interface. Biomaterials. 1999;20(23–24):2311–2321. | ||
Schwartz Z, Lohmann CH, Oefinger J, Bonewald LF, Dean DD, Boyan BD. Implant surface characteristics modulate differentiation behavior of cells in the osteoblastic lineage. Adv Dent Res. 1999;13:38–48. | ||
Guo J, Padilla RJ, Ambrose W, De Kok IJ, Cooper LF. The effect of hydrofluoric acid treatment of TiO2 grit blasted titanium implants on adherent osteoblast gene expression in vitro and in vivo. Biomaterials. 2007;28(36):5418–5425. | ||
Patla I, Volberg T, Elad N, et al. Dissecting the molecular architecture of integrin adhesion sites by cryo-electron tomography. Nat Cell Biol. 2010;12(9):909–915. | ||
Curtis A, Wilkinson C. Topographical control of cells. Biomaterials. 1997;18(24):1573–1583. | ||
Zhao L, Mei S, Chu PK, Zhang Y, Wu Z. The influence of hierarchical hybrid micro/nano-textured titanium surface with titania nanotubes on osteoblast functions. Biomaterials. 2010;31(19):5072–5082. | ||
Rho JY, Kuhn-Spearing L, Zioupos P. Mechanical properties and the hierarchical structure of bone. Med Eng Phys. 1998;20(2):92–102. | ||
Kubo K, Tsukimura N, Iwasa F, et al. Cellular behavior on TiO2 nanonodular structures in a micro-to-nanoscale hierarchy model. Biomaterials. 2009;30(29):5319–5329. | ||
Moerke C, Mueller P, Nebe B. Attempted caveolae-mediated phagocytosis of surface-fixed micro-pillars by human osteoblasts. Biomaterials. 2016;76:102–114. | ||
Huang Q, Elkhooly TA, Liu X, et al. Effects of hierarchical micro/nano-topographies on the morphology, proliferation and differentiation of osteoblast-like cells. Colloids Surf B Biointerfaces. 2016;145:37–45. | ||
Gutwein LG, Webster TJ. Increased viable osteoblast density in the presence of nanophase compared to conventional alumina and titania particles. Biomaterials. 2004;25(18):4175–4183. | ||
Matschegewski C, Staehlke S, Birkholz H, et al. Automatic actin filament quantification of osteoblasts and their morphometric analysis on microtextured silicon-titanium arrays. Materials. 2012;5(7):1176–1195. | ||
Azeem A, English A, Kumar P, et al. The influence of anisotropic nano- to micro-topography on in vitro and in vivo osteogenesis. Nanomedicine (Lond). 2015;10(5):693–711. | ||
Kim W, Ng JK, Kunitake ME, Conklin BR, Yang P. Interfacing silicon nanowires with mammalian cells. J Am Chem Soc. 2007;129(23):7228–7229. | ||
Faria HA, de Queiroz AA. A novel drug delivery of 5-fluorouracil device based on TiO2/ZnS nanotubes. Mater Sci Eng C Mater Biol Appl. 2015;56:260–268. | ||
Huang R, Lu S, Han Y. Role of grain size in the regulation of osteoblast response to Ti-25Nb-3Mo-3Zr-2Sn alloy. Colloids Surf B Biointerfaces. 2013;111:232–241. | ||
Shen X, Ma P, Hu Y, Xu G, Zhou J, Cai K. Mesenchymal stem cell growth behavior on micro/nano hierarchical surfaces of titanium substrates. Colloids Surf B Biointerfaces. 2015;127:221–232. | ||
Dalby MJ, Gadegaard N, Oreffo RO. Harnessing nanotopography and integrin-matrix interactions to influence stem cell fate. Nat Mater. 2014;13(6):558–569. | ||
Tan J, Saltzman WM. Biomaterials with hierarchically defined micro- and nanoscale structure. Biomaterials. 2004;25(17):3593–3601. | ||
Webster TJ, Ejiofor JU. Increased osteoblast adhesion on nanophase metals: Ti, Ti6Al4V, and CoCrMo. Biomaterials. 2004;25(19):4731–4739. | ||
Zhou J, Chang C, Zhang R, Zhang L. Hydrogels prepared from unsubstituted cellulose in NaOH/urea aqueous solution. Macromol Biosci. 2007;7(6):804–809. | ||
Kim HW, Koh YH, Li LH, Lee S, Kim HE. Hydroxyapatite coating on titanium substrate with titania buffer layer processed by sol-gel method. Biomaterials. 2004;25(13):2533–2538. | ||
Ozcan M, Allahbeickaraghi A, Dündar M. Possible hazardous effects of hydrofluoric acid and recommendations for treatment approach: a review. Clin Oral Investig. 2012;16(1):15–23. | ||
Li Y, Qi Y, Gao Q, et al. Effects of a micro/nano rough strontium-loaded surface on osseointegration. Int J Nanomedicine. 2015;10:4549–4563. | ||
Ferraris S, Spriano S, Pan G, et al. Surface modification of Ti-6Al-4V alloy for biomineralization and specific biological response: part I, inorganic modification. J Mater Sci Mater Med. 2011;22(3):533–545. | ||
Zareidoost A, Yousefpour M, Ghaseme B, Amanzadeh A. The relationship of surface roughness and cell response of chemical surface modification of titanium. J Mater Sci Mater Med. 2012;23(6):1479–1488. | ||
Lamolle SF, Monjo M, Rubert M, Haugen HJ, Lyngstadaas SP, Ellingsen JE. The effect of hydrofluoric acid treatment of titanium surface on nanostructural and chemical changes and the growth of MC3T3-E1 cells. Biomaterials. 2009;30(5):736–742. | ||
Jia F, Zhou L, Li S, et al. Phosphoric acid and sodium fluoride: a novel etching combination on titanium. Biomed Mater. 2014;9(3):035004. | ||
Albrektsson T, Wennerberg A. Oral implant surfaces: part 1–review focusing on topographic and chemical properties of different surfaces and in vivo responses to them. Int J Prosthodont. 2004;17(5):536–543. | ||
Germanier Y, Tosatti S, Broggini N, Textor M, Buser D. Enhanced bone apposition around biofunctionalized sandblasted and acid-etched titanium implant surfaces. A histomorphometric study in miniature pigs. Clin Oral Implants Res. 2006;17(3):251–257. | ||
van Dorp WF, Zhang X, Feringa BL, Hansen TW, Wagner JB, De Hosson JT. Molecule-by-molecule writing using a focused electron beam. ACS Nano. 2012;6(11):10076–10081. | ||
Nanci A, Wuest JD, Peru L, et al. Chemical modification of titanium surfaces for covalent attachment of biological molecules. J Biomed Mater Res. 1998;40(2):324–335. | ||
Raffaini G, Ganazzoli F. Separation of chiral nanotubes with an opposite handedness by chiral oligopeptide adsorption: a molecular dynamics study. J Chromatogr A. 2015;1425:221–230. | ||
Ellingsen JE. Surface configurations of dental implants. Periodontol 2000. 1998;17:36–46. | ||
Litovitz TL, Klein-Schwartz W, Dyer KS, Shannon M, Lee S, Powers M. 1997 annual report of the American Association of Poison Control Centers Toxic Exposure Surveillance System. Am J Emerg Med. 1998;16(5):443–497. | ||
Litovitz TL, Klein-Schwartz W, Caravati EM, Youniss J, Crouch B, Lee S. 1998 annual report of the American Association of Poison Control Centers Toxic Exposure Surveillance System. Am J Emerg Med. 1999;17(5):435–487. | ||
Ferraris S, Bobbio A, Miola M, Spriano S. Micro- and nano-textured, hydrophilic and bioactive titanium dental implants. Surf Coat Technol. 2015;276:374–383. | ||
Kong DS. The influence of fluoride on the physicochemical properties of anodic oxide films formed on titanium surfaces. Langmuir. 2008;24(10):5324–5331. | ||
Rupp F, Scheideler L, Rehbein D, Axmann D, Geis-Gerstorfer J. Roughness induced dynamic changes of wettability of acid etched titanium implant modifications. Biomaterials. 2004;25(7–8):1429–1438. | ||
Park JW, Jang JH, Lee CS, Hanawa T. Osteoconductivity of hydrophilic microstructured titanium implants with phosphate ion chemistry. Acta Biomater. 2009;5(6):2311–2321. | ||
Huang J, Grater SV, Corbellini F, et al. Impact of order and disorder in RGD nanopatterns on cell adhesion. Nano Lett. 2009;9(3):1111–1116. |
 © 2017 The Author(s). This work is published and licensed by Dove Medical Press Limited. The full terms of this license are available at https://www.dovepress.com/terms.php and incorporate the Creative Commons Attribution - Non Commercial (unported, v3.0) License.
By accessing the work you hereby accept the Terms. Non-commercial uses of the work are permitted without any further permission from Dove Medical Press Limited, provided the work is properly attributed. For permission for commercial use of this work, please see paragraphs 4.2 and 5 of our Terms.
© 2017 The Author(s). This work is published and licensed by Dove Medical Press Limited. The full terms of this license are available at https://www.dovepress.com/terms.php and incorporate the Creative Commons Attribution - Non Commercial (unported, v3.0) License.
By accessing the work you hereby accept the Terms. Non-commercial uses of the work are permitted without any further permission from Dove Medical Press Limited, provided the work is properly attributed. For permission for commercial use of this work, please see paragraphs 4.2 and 5 of our Terms.