")
Back to Journals » International Journal of Nanomedicine » Volume 14
Osteoblast/bone-tissue responses to porous surface of polyetheretherketone–nanoporous lithium-doped magnesium silicate blends’ integration with polyetheretherketone
Authors Wang L, Zhang K , Hao Y, Liu M, Wu W
Received 5 December 2018
Accepted for publication 14 May 2019
Published 8 July 2019 Volume 2019:14 Pages 4975—4989
DOI https://doi.org/10.2147/IJN.S197179
Checked for plagiarism Yes
Review by Single anonymous peer review
Peer reviewer comments 3
Editor who approved publication: Dr Mian Wang
Lei Wang, Kai Zhang, Yongqiang Hao, Ming Liu, Wen Wu
Department of Orthopaedics, Shanghai Key Laboratory of Orthopaedic Implants, Shanghai Ninth People’s Hospital, Shanghai Jiaotong University School of Medicine, Shanghai 200011, People’s Republic of China
Abstract: The porous surface of a polyetheretherketone (PK)–nanoporous lithium-doped magnesium silicate (NLS) blend (PKNLS) was fabricated on a PK surface by layer-by-layer pressuring, sintering, and salt-leaching. As controls, porous surfaces of a PK/lithium-doped magnesium silicate blend (PKLS) and PK were fabricated using the same method. The results revealed that porosity, water absorption, and protein absorption of the porous surface of PKNLS containing macropores and nanopores were obviously enhanced compared to PKLS and PK containing macropores without nanopores. In addition, PKNLS, with both macroporostiy and nanoporosity, displayed the highest ability of apatite mineralization in simulated body liquid, indicating excellent bioactivity. In vitro responses (including adhesion, proliferation, and differentiation) of MC3T3E1 cells to PKNLS were significantly enhanced compared to PKLS and PK. In vivo implantation results showed that new bone grew into the macroporous surface of PKNLS, and the amount of new bone for PKNLS was the highest. In short, PKNLS integration with PK significantly promoted cells/bone-tissue responses and exhibited excellent osteogenesis in vivo, which might have great potential for bone repair.
Keywords: polyetheretherketone, nanoporous lithium doped magnesium silicate, porously bioactive surface, cells responses, osteogenesis
Introduction
Orthopedic implants are considered as effective substitutes to treat bone damage and defects caused by disease, trauma, accidents, and aging.1,2 Polyetheretherketone (PK), a thermoplastic polymer, has been used for implants in orthopedic applications for decades, due to its excellent biocompatibility, high mechanical strength, and elastic modulus similar to cortical bones of humans.3,4 However, the biological inertness of PK, with weak osteogenic activity, exhibits inferior osteogenesis and osseointegration, which reduces primary fixation and long-term stability of implants during prosthetic implantation.3–5
Various methods have been developed to improve the osteogenic activity of PK while maintaining its mechanical properties, such as coating with bioactive materials (eg, hydroxyapatite), grafting functional groups, and physical modifications (eg, sandblasting and plasma treatment).6–8 Unfortunately, the bonding strength of the coatings is generally weak, and can detach from the PK surface.9 The biological properties of grafting functional groups and plasma treatment of PK are usually unstable.10 Although sandblasting can enhance surface roughness, which may be beneficial to cell response, the biological inertia of PK remains unsolved.11 Therefore, development of new technology for improving surface biological properties of PK is still a significant need for bone repair.
As an important trace element in an organism, lithium (Li) exhibits significantly biological effects on mesenchymal stem cells (MSCs) by activating the Wnt–β-catenin signaling pathway, which plays a crucial role in bone remodeling.12 Li can enhance proliferation, osteogenic differentiation, and osteogenesis-related gene expression of MSCs.13 When cells are exposed to Li ions, the Wnt–β-catenin pathway is activated, which promotes osteoblastogenesis and inhibits osteoclastogenesis, leading to improvement in bone formation.14 Moreover, Li can improve bone-mineral density and reduce fracture risk in humans.15 The osteogenic activity of human periodontal ligament-derived cells is remarkably improved in culture with Li (5 wt%)-doped mesoporous bioglass compared with mesoporous bioglass.16 Furthermore, osteogenesis-related mRNA expression of MC3T3E1 cells is significantly promoted after exposure to Li-doped mesoporous bioglass.17 Li can stimulate proliferation and differentiation of MSCs, regarded as one of its therapeutic cellular mechanisms.20
Introducing nanoporous and macroporous structures to the surface of the orthopedic implant not only regulates the cell/bone-tissue responses but also provides a suitable space for ingrowth of new bone tissue (NB).20 A nanoporous structure on biomaterials can promote cell adhesion, proliferation, differentiation, and osteogenesis-related gene expressions, while macroporous structures accelerate osteogenesis and improve mechanical interlocking of ingrowth of NBs, providing greater mechanical stability at the critical interface and hence promoting ossteointegration.21 Nanoporous magnesium silicate (nMS) is a bioactive glass that possesses a nanoporous structure with large surface area and high pore volume.18 Our previous research has confirmed that the nMS exhibits superior in vitro bioactivity, cytocompatibility, and in vivo osteogenesis.19
Therefore, in this study, both nanoporous Li-doped magnesium silicate (NLS) and Li-doped magnesium silicate (LS) without nanopores were synthesized using the sol-gel method. In addition, the porous surface of a PK/NLS blend (PKNLS) was fabricated on the PK surface by layer-by-layer pressuring, sintering, and salt-leaching. As controls, porous surfaces of both the PK/LS blend (PKLS) and PK were fabricated by the same method. The porosity, water absorption, protein absorption, and apatite mineralization of PKNLS containing NLS with nanopores in vitro were studied, and the cells/bone-tissue responses to PKNLS in vitro and in vivo were also investigated by comparison with PKLS and PK. The objective of the study was to develop a porously bioactive surface of PK/NLS blend on the PK surface with both macroporous and nanoporous properties for promoting cell response and osteogenesis. The porous surface of PKNLS can be integrated with PK while maintains its mechanical properties.
Methods
Preparation and characterization of NLS
NLS containing 5 wt% Li was synthesized using the sol-gel method. Briefly, solution A was prepared by dissolving 1 g of cetyltrimethylammonium chloride (CTAC) into deionized water under stirring in a water bath for 1 hr. Then, 1.974 g g of magnesium nitrate hexahydrate was put into the solution. Solution B, containing 1.72 mL tetraethyl orthosilicate (TEOS) and 20 mL ethanol, was added to solution C, containing 4 mL ammonium hydroxide (25%), 20 mL deionized water, and 10 mL ethanol under consecutive agitation, then the mixture was added to solution A. After stirring for 30 mins, 0.25 g Li chlorine was added into the mixture. The reaction was allowed to continue or 90 mins, and the suspension was centrifuged for 5 mins to collect deposits, which were further washed twice with water and three times with ethanol and dried at 60 °C for 12 hrs to obtain powders. Afterward, the calcination of the powders was carried out in air at 600 °C for 3 h (heating rate of 2 °C/min) to remove the template (CTAC), and NLS was obtained. As a control, LS was synthesized using the same method without addition of CTAC. NLS powders were characterized by rotating-anode X-ray diffractometer (XRD, Rigaku Co., Tokyo, Japan), field-emission scanning electron microscopy (FESEM, Auriga, Carl-Zeiss, Germany), transmission electron microscopy (TEM, JEM-2100F, Jeol Co. Tokyo, Japan), and nitrogen adsorption–desorption using BET and BJH model analysis (Micromeritics ASAP 2010 analyzer, Micromeritics, Norcross, GA, USA).
Preparation and characterization of PNKLS
Porous surfaces of PKNLS were prepared by layer-by-layer pressuring, sintering, and salt-leachingusing NaCl particles as the porogen. Briefly, medical grade PK powders (450G, Victrex, Lancashire, UK) were first dispersed into ethanol solution with stirring for 2 hrs. Then, NLS powders were added to the PK dispersion and stirred for another 2 hrs. The resulting mixtures were dried at 40°C in a draught-drying cabinet, and PKNLS was obtained. The as-prepared PKNLS powders were mixed with NaCl particles (PKNLS: NaCl 1:10 w/w). Disc samples were prepared for in vitro evaluation (including porosity, water absorption, protein absorption, apatite-mineralization ability, and cell responses). Powders were put into a designed stainless-steel mold (Φ 12 mm) in a sequence of PK/NLS/NaCl-PK-PK/NLS/NaCl, and then compressed under 4 MPa pressure to get the samples. Cylinder samples were prepared for in vivo osteogenesis evaluations. PK powders were first put into a mold (Φ 4 mm) and compressed under 1 MPa pressure, then the rod-type samples were collected and placed into another mold (Φ 6 mm). The PK/NLS/NaCl powders were then added into the space between PK rods and molds and compressed under 4 MPa pressureto get the samples.
Disc and cylinder samples were sintered at 350°Cfor 10 hrs, then immersed in deionized water to leach out NaCl, dried at 60°C, and PKLNS obtained. As controls, porous surfaces of PKLS and PK were fabricated by the same method. The samples (PK, PKLS, and PKNLS) were characterized by rotating-anode XRD (Rigaku Co.) and SEM (S-4800, Hitachi, Tokyo, Japan), respectively. In addition, the reconstructed and 3D 2D images of PKNLS were obtained with synchrotron radiation-based microcomputed tomography (SRmCT, Shanghai Synchrotron Radiation Facility, Shanghai, China).
Porosity, protein absorption, and water absorption
The porosity (P%) of the sample surfaces was calculated according to Archimedes principle at room temperature:20

where W1 represents the dry weight of the scaffolds, W2 the weight of the scaffolds saturated with water, and W3 the weight of the scaffold suspended in water.
Adsorbing protein of the samples (PK, PKLS, and PKNLS) was determined using BSA. Samples were placed in 10 μg/mL BSA-PBS solution in a cell incubator for 4 hrs, then lightly washed with PBS twice to remove the protein that had not adsorbed. The BSA concentration of BSA-PBS solution was measured by ELISA, while the amount of BSA adsorbed on the sample surfaces was obtained by calculating the difference in BSA concentration in the solution before and after sample adsorption. The final results were characterized by the mass of BSA (mg protein/g scaffold) adsorbed by the unit mass of samples.
The water absorption of the samples (PK, PKLS, and PKNLS) was tested. Briefly, samples were dried at 37°C for 48 hrs and weighed as W1. Then, dried samples were placed into water at 37°C. Samples were fetched out every 12 hrs and blotted dry on filter paper to remove excess water, weighed, and returned to the water. When the weight of samples was constant, then weight of samples was recorded as W2. Water absorption (Wa%) of samples was calculated:

Apatite mineralization in SBF
Simulated body fluid (SBF) solution was adopted to evaluate the in vitro apatite-mineralization ability, which was prepared according to the method described by Kokubo and Takadama.21 The samples (PK, PKLS, and PKNLS) were soaked into SBF (200 mL/g) at 37°C in a constant temperature oscillator (HZQ-X300, Yiheng Science Instruments Co., Ltd., China) for 5 days. Then, samples were taken out from the SBF solution, rinsed in deionized water for 2 hrs, and air-dried at 60°C. Sample surfaces after soaking in SBF for 5 days were characterized using SEM and energy-dispersive spectroscopy (EDS).
In vitro cell responses
Mouse preosteoblastic cell lines (MC3T3E1 cells), obtained from the School of Medicine, Jiao Tong University (Shanghai, China), were used to evaluate in vitro cell responses in this study. The use of the cell lines was approved by Medical Ethics Committee of Shanghai Ninth People’s Hospital, Shanghai Jiao Tong University School of Medicine. Cells were cultured in DMEM (Gibco-Invitrogen, Carlsbad, CA, USA) supplemented with 10% FBS (Gibco, ThermoFisher Scientific, USA), penicillin (100 U/mL), and streptomycin (100 μg/mL) under an atmosphere of 100% humidity and 5% CO2 at 37°C. The culture medium was exchanged every 3 days.
Cell morphology and attachment
Samples were sterilized with ethylene oxide and placed in 24-well plates, then seeded with cells at a density of 1×10⁵ cells/well. After culturing for 12 hrs, samples were collected, gently washed with PBS for 3 times, and fixed with glutaraldehyde solution (0.25%, 500 μL) for 2 hrs. Afterward, the samples were progressively dehydrated with ethanol at different concentrations (10%, 30%, 50%, 70%, 85%, 90%, and 100%) for 15 mins. Samples were then air-dried at room temperature and cell morphology was observed on SEM. To measure cell attachment ratio on the samples, cells were cultured with samples in 24-well plates at a density of 1×10⁵ cells/well for 12 hrs. Then, the culture medium with unattached cells was carefully removed from the wells, and cells remaining on the samples were collected and counted with CyQUANT® assay kits (Life Technologies, California, Carlsbad, USA). The tissue culture plate (TCP) without samples was used as a control and attachment ratios are presented as cell counts on samples divided by those on the TCP.
Cell proliferation
Proliferation of MC3T3E1 cells on the samples was measured by MTT assay. Cells were cocultured with samples in 24-well plates at a density of 1×10⁵ cells/well for 1, 3, and 7 days. At specific time points, the culture medium was removed and the samples were gently washed with PBS. Afterward, 500 μL culture medium consisting of 400 μL DMEM and 100 μL MTT solution was added on the samples. After 2 hrs of cultivation, the medium was replaced with 500 μL DMSO (Sigma, Milwaukee, WI, USA) to dissolve the blue-violet crystals for 30 mins. Subsequently, 100 μL of above solution was taken out and OD values were determined by a microplate reader (AMR-100, Hangzhou,Allsheng Co., Ltd., China) at a wavelength of 490 nm.
Alkaline phosphatase activity
Cells at a density of 1×10⁵ cells/well were cultured with samples in 24-well plates.After 24 hrs of culture, the culture medium was replaced with osteogenic induction medium containing serum and then changed every 3 days. At days 7, 10, and 14, 200 μL Nonidet P40 solution (1%) was added and incubated for another 1 hr to obtain the cell lysate. Then, the cell lystae was centrifuged and 50 μL supernatant transferred into a new 96-well plate, and 50 μL of p-nitrophenylphosphate (2 mg/mL, Sangon, Shanghai, China) solution consisting of glycine (0.1 mol/L), MgCl2·6H2O (1 mmol/L) was added for another 30 mins. Subsequently, this reaction was stopped by adding 100 μL NaOH (0.1 mol/L) solution. ALP absorbance was quantified using microplate reader at a wavelength of 405 nm. The total protein content in cell lysate was determined using the bicinchoninic acid method in aliquots of the same samples with a Pierce protein assay kit (Pierce Biotechnology Inc., Rockford, Illinois, USA), read at 562 nm, and calculated according to a series of BSA standards. ALP activity was normalized to total protein content and was expressed as absorbance at OD405/total protein.
In vivo osteogenesis
Surgery
Male New Zealand rabbits weighing 2.0–2.5 kgand 7–8 months old were used to carry out in vivo tests in this study. The whole procedure was approved by the Animal Care and Experiment Committee of Shanghai Ninth People’s Hospital, affiliated with Shanghai Jiao Tong University. Animal welfare strictly followed by the National Research Council's Guide for the Care and Use of Laboratory Animals. Prior to surgery, all implants were sterilized by γ-ray (15 kGv) radiation. Three rabbits were randomly divided into 3 groups and anesthetized with intramuscular injections of sodium pentobarbital (20 mg/kg, Sigma-Aldrich). Then, incisions of 1 cm were created to expose the lateral site of the right femoral condyle. The high-speed medical bur was used to drill holes (6 mm diameter, 6 mm depth), and PK, PKLS, and PKNLS implants were inserted in the holes immediately. Subsequently, incisions were closed with sutures. At week 12 postsurgery, the rabbits were killed by overdosed intramuscular injections of anesthetics. Femoral condyles containing implants were harvested and fixed in 0.25% glutaraldehyde solution.
Micro-CT evaluation
The Micro-CT scanner (Skyscan 1076, Skyscan, Kontich, Belgium) was used to evaluate the repair of bone defects with the conditions of 40 kV voltage, 250 μA current, and 35 mm resolution. A cylinder area 6 mm in width and 5 mm in height of the femoral condyles containing implants was selected as the region of interest for measuring newly formed bone tissue. The 3D images of femoral condyles and newly formed bone tissues were reconstructed by NRecon (Skyscan Company) and CTVol (Skyscan Company), and the threshold was optimized to isolate bone tissues and implants. Bone volume/total volume (BV/TV), bone-mineral density (BMD), trabecular thickness (Tb.Th), and trabecular number (Tb.N) were quantified by CTAn program (Skyscan Company).
Histological evaluation
Femoral condyles containing implants were dehydrated by ethanol with ascending concentrations from 75% to 100% and embedded in polymethylmetacrylate (PMMA). A Leica SP1600 saw microtome (Leica, Hamburg, Germany) was used to cut the embedded samples into sections 150 μm thick, and the sections were then ground to 50 μm in thickness and stained with Van Gieson’s picrofuchsin. Stained sections were observed by inverted microscope (TE2000-U, Nikon), and the NB area of each sample was calculated by a semiautomatic image analysis system (Image-Pro Plus, Media Cybernetics, Silver Spring, MD, USA) from each stained histological section.
Statistical analysis
Data were expressed as means ± SD of at least three independent experiments. Statistical comparisons were carried out via one-way ANOVA with Tukey’s post hoc test. p-value less than 0.05 was considered statistically significant.
Results
Characterization of samples
Figure 1A and B shows the SEM and TEM micrographs NLS. On SEM micrograph, NLS exhibited uniformly spherical particles of around 200 nm. On TEM micrographs, NLS displayed spherical particles of around 200 nm, which was consistent with SEM micrographs. Additionally, NLS particles showed a porous structure, and the nanopores inside the NLS can seen on TEM micrographs. Figure 1C and D shows N2-adsorption isotherm and corresponding pore-size distribution of NLS. A type-IV curve with an H1 hysteresis loop was found, and a well-defined step was at relative pressure (P/P0) of 0.2–0.4 for NLS, which was the typical curve of nanoporous material (Figure 1C). Pore sizes of NLS were around 4 nm and pore-size distribution was narrow (Figure 1D). In addition, the specific surface area and pore volume of NLS were 759 m2/g and 0.32 cm3/g, respectively.
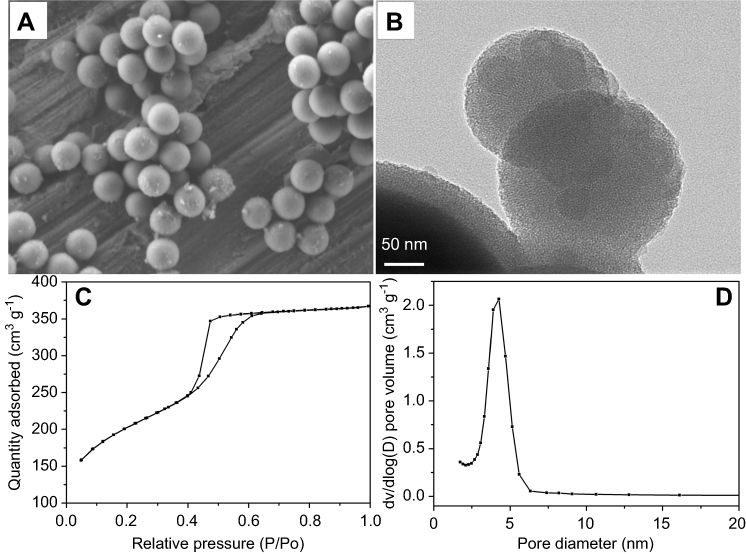 |
Figure 1 SEM (A) and TEM micrographs (B) of NLS, and N2-adsorption isotherm of NLS (C) and corresponding pore-size distribution of NLS (D).Abbreviations: SEM: scanning electron microscopy; TEM: transmission electron microscopy; NLS: nanoporous lithium-doped magnesium silicate |
Figure 2 shows reconstructed 3D images of PKNLS in disks and cylinders and reconstructed 2D images of PKNLS in cross-section and vertical views from SRmCT. Distinct porous surface integration with dense substrate (PK) was observed (Figure 2A and D). Interconnected macropores existed in porous surfaces of all samples, with thickness of around 1 mm (Figure 2B, C, E and F). Figure 3 shows SEM micrographs of surface and longitudinal section morphology of PK, PKLS, and PKNLS. Interconnected macropores of 300–400 μm were observed in the porous surfaces of all samples. In addition, the porous surface and dense substrate (PK) were tightly combined without any interface. No obvious differences in morphology were found among the samples. Figure 4A shows XRD of NLS, PK, PKLS, and PKNLS. The characteristic peaks of 2θ=18.71°, 20.76°, 22.81°, and 28.83° were ascribed to PK. A broad peak at around 24° was found in NLS, indicating an amorphous phase. All characteristic peaks of PK were detected in both PKLS and PKNLS.
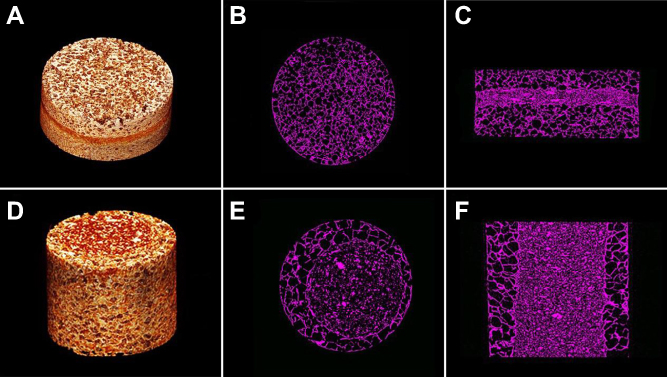 |
Figure 2 Reconstructed 3D images of PKNLS in disc (A) and cylinder (D); reconstructed 2D images of PKNLS in disk(B and C) and cylinder (E and F), in which PKNLS in cross (B and E) and vertical (C and F).Abbreviation: PKNLS: polyetheretherketone–nanoporous lithium-doped magnesium silicate blend. |
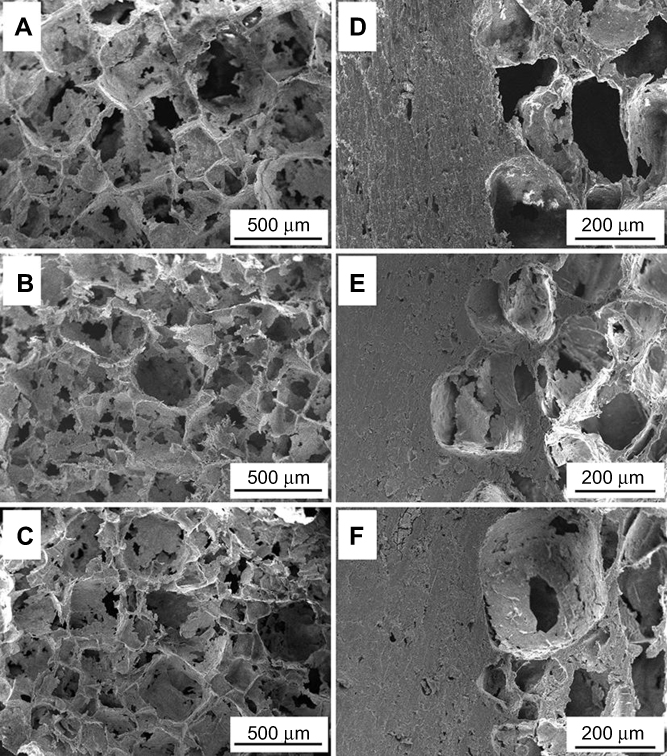 |
Figure 3 SEM micrographs of morphology of PK (A and D), PKLS (B and E) and PKNLS (C and F), and surface (A–C) and longitudinal section morphology (D–F) of samples.Abbreviations: PK: polyetheretherketone; PKNLS: polyetheretherketone–nanoporous lithium-doped magnesium silicate blend; PKLS: PK/lithium-doped magnesium silicate blend; SEM: scanning electron microscopy. |
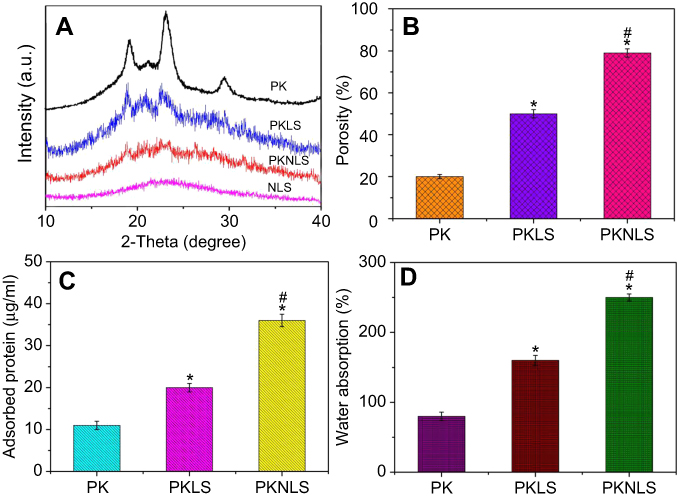 |
Figure 4 XRD (A) of NLS, PK, PKLS and PKNLS, and porosity (B), protein absorption (C) and water absorption (D) of PK, PKLS, and PKNLS (*p<0.05, vs PK; #p<0.05, PKNLS vs PKLS).Abbreviations: XRD: X-ray diffractometer; NLS: nanoporous Li-doped magnesium silicate; PK: polyetheretherketone; PKNLS: polyetheretherketone–nanoporous lithium-doped magnesium silicate blend; PKLS: PK/lithium-doped magnesium silicate blend. |
Porosity, protein adsorption, and water absorption
Figure 4B shows the porosity of the samples. The porosity of PK, PKLS, and PKNLS was 55.3±3.4%, 63.4±2.7% and 70.1±2.2%, respectively. Figure 4C shows protein adsorption of the samples. Protein adsorption amount on PK, PKLS, and PKNLS was 0.2±0.031, 0.71±0.029, and 0.90±0.032 mg/g. Figure 4D shows the water absorption of the samples. The water absorptionof PK, PKLS, and PKNLS was 80.5±12.5%, 158.6±18.4%, and 250.4±10.8%, respectively.
In vitro apatite mineralization
Figure 5 shows SEM micrographs of surface morphology of PK, PKLS, and PKNLS after soaking into SBF for 5 days. INo deposits were found on PK surface (Figure 5A), while a few deposits dispersed on PKLS (Figure 5B). Remarkably, many deposits were observed on PKNLS, which was almost covered (Figure 5C), indicating the mineralization ability of PKNLS was the highest compared with PK and PKLS. The EDS of deposits on PKNLS surface is shown in Figure 5D. The Ca and P elements were found, and the ratio of Ca to P (Ca/P) was 1.61, indicating the formation of deposits was apatite.
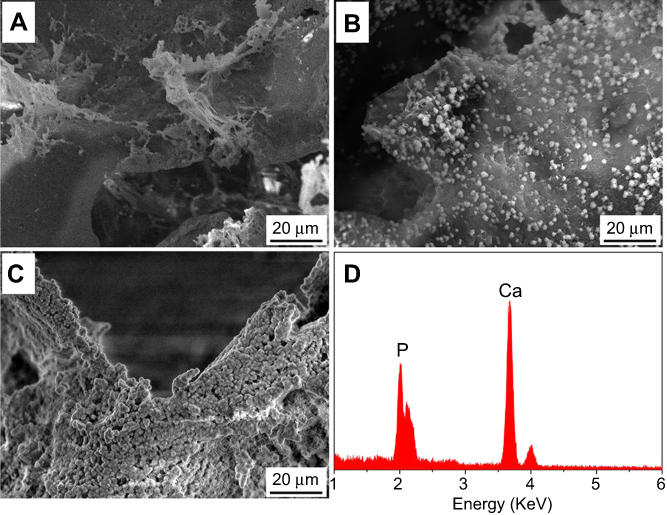 |
Figure 5 SEM micrographs of surface morphology of PK (A), PKLS (B), and PKNLS (C) after soaking into SBF for 5 days and EDS (D) of deposits on PKNLS surface.Abbreviations: SBF: simulated body fluid; PK: polyetheretherketone; PKNLS: polyetheretherketone–nanoporous lithium-doped magnesium silicate blend; PKLS PK/lithium-doped magnesium silicate blend; SEM: scanning electron microscopy; EDS: energy-dispersive spectroscopy. |
In vitro responses
Cell morphology and attachment
Figure 6 shows SEM micrographs of morphology of MC3T3E1-cell attachment on the samples (PK, PKLS, and PKNLS) at 12 hrs. Ellipsoidal cells without spreading were found on PK surface (Figure 6A), while cells on PKLS displayed expanded morphology with visible cell pseudopodia attachment on the walls of macropores (Figure 6B). Interestingly, many cells were found to grow into macropores of PKNLS, which displayed better adhesion and spreading on the walls of macropores (Figure 6C and D). Attachment of cells on the samples is shown in Figure 6E. Attachment for PKLS (118.6±5.2%) and PKNLS (141.4±4.3%) was significantly higher than PK (68.8±3.9%) and TCP (98%±2.5% ), with PKNLS the highest.
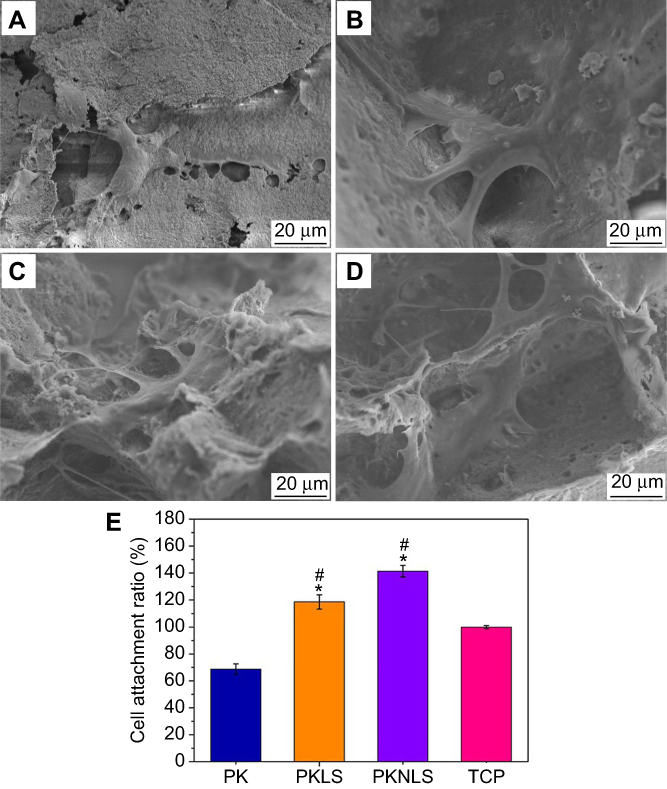 |
Figure 6 SEM micrographs of morphology of MC3T3-E1 cells on PK (A), PKLS (B), and PKNLS (C and D) after culturing for 12 hrs, and attachment ratio (E) of cells on samples for 12 hrs (* p<0.05, vs PK; #p<0.05, vs TCP, tissue culture plate).Abbreviations: PK: polyetheretherketone; PKNLS: polyetheretherketone–nanoporous lithium-doped magnesium silicate blend; PKLS: PK/lithium-doped magnesium silicate blend; SEM, scanning electron microscopy; TCP: tissue culture plate. |
Cell proliferation and ALP activity
OD values (cell proliferation) of MC3T3E1 cells on the samples (PK, PKLS, and PKNLS) for 1, 3, and 7 days are shown in Figure 7A. Cell OD for both PKLS and PKNLS increased with time, while no significant change was found for PK. At day 1, PKNLS OD was significantly higher than PKLS and PK, while no significant difference was found between PKLS and PK. At day 3 and 7, the OD values for PKLS and PKNLS were significantly higher than PK. PKNLS OD was significantly higher than PKLS at day 3. ALP activity of cells on the samples (PK, PKLS, and PKNLS) for 7, 10, and 14 days is shown in Figure 7B. At day 7, there were no significant differences in ALP activity among the samples. However, at day 10, ALP activity for PKNLS was obviously higher than PK and PKLS, while no significant differences were found for PK and PKLS. At day 14, ALP activity for PKNLS was obviously higher than PKLS and PKLS higher than PK.
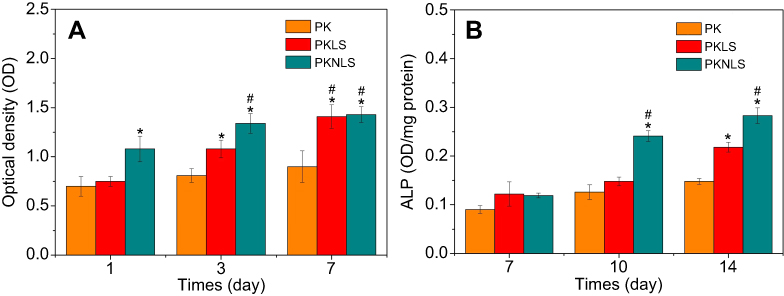 |
Figure 7 OD values (A) and ALP activity (B) of MC3T3E1 cells cultured on the samples for different time (*p<0.05, vs PK; #p<0.05, PKNLS vs PKLS).Abbreviations: PK: polyetheretherketone; PKNLS: polyetheretherketone–nanoporous lithium-doped magnesium silicate blend; PKLS: PK/lithium-doped magnesium silicate blend. |
Ion release from samples into cell-culture medium
hanges in concentration of Li, Mg, and Si ions in cell-culture medium with time after cell culture on samples (PK, PKLS, and PKNLS) are shown in Figure 8. It was found that concentrations of Li (Figure 8A), Mg (Figure 8B), and Si (Figure 8C) ions for PKLS and PKNLS increased with time, indicating that these ions were slowly released from both PKLS and PKNLS into cell culture medium. In addition, concentrations of Li, Mg, and Si ions for PKNLS were higher than PKLS at all the time points, indicating that PKNLS released more ions than PKLS.
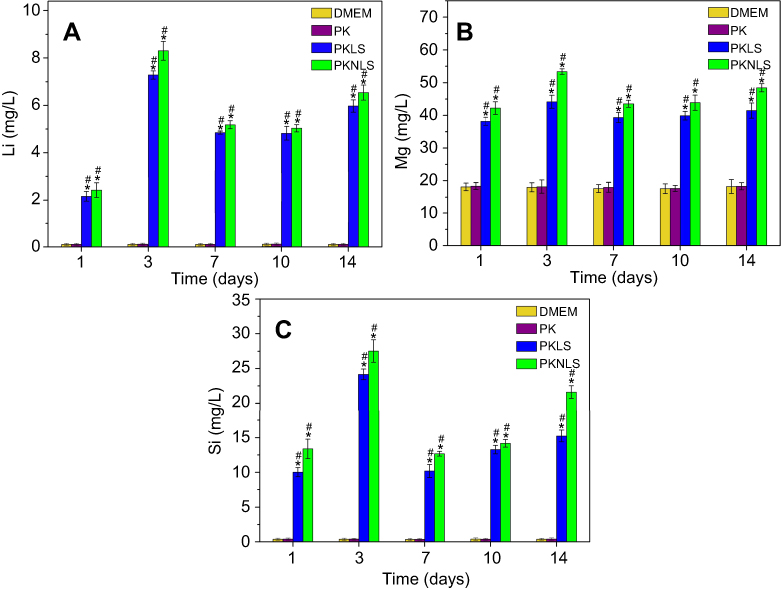 |
Figure 8 Changes in concentration of Li (A), Mg (B), and Si (C) ions in cell culture medium with time. |
In vivo osteogenesis
Micro-CT evaluation
Figure 9 shows the reconstructed 3D images of femoral condyles on mCT at week 12 postimplantation. It was shown that newly formed bone tissues (NBs) around PKNLS were higher than PKLS, and PKLS were higher than PK. Moreover, PKNLS obtained the highest NBs, indicating that PKNLS promoted osteogenesis.
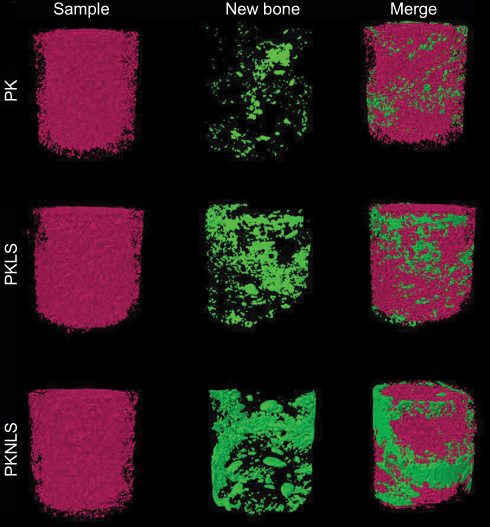 |
Figure 9 Reconstructed 3D images of femoral condyles on mCT at week 12 after implantation. The sample was marked by red color, while the new bones were shown in green.Abbreviations: PK: polyetheretherketone; PKNLS: polyetheretherketone–nanoporous lithium-doped magnesium silicate blend; PKLS: PK/lithium-doped magnesium silicate blend. |
Figure 10A–D shows the quantitative analysis of BV/TV, BMD, Tb.Th, and Tb.N of samples on mCT. It was found that BV/TV, BMD, Tb.Th, and Tb.N for both PKNLS and PKLS were significantly higher than PK. In addition, BV/TV and Tb.Th for PKNLS were significantly higher than PKLS, while there were no obvious differences in BMD or Tb.N for both PKNLS or PKLS.
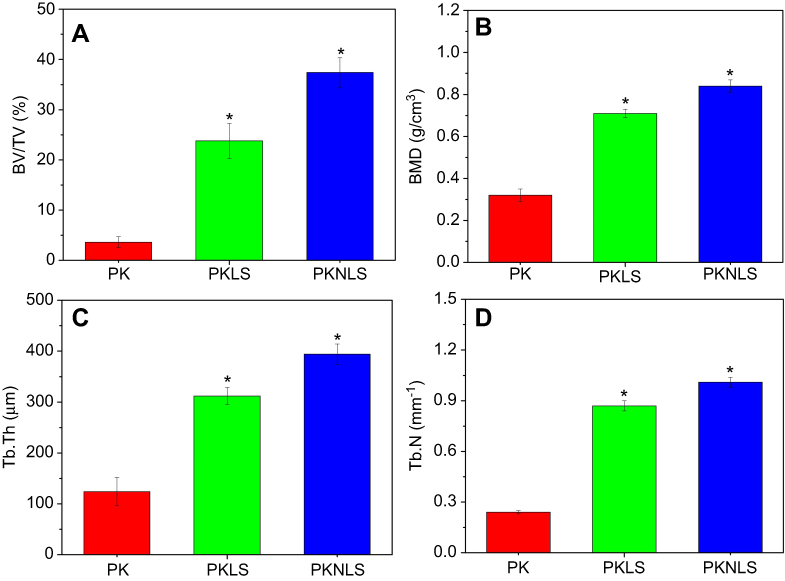 |
Figure 10 Quantitative analysis of BV/TV (A), BMD (B), Tb.Th (C), and Tb.N (D)of the samples (* p<0.05, vs PK).Abbreviations: BV/TV, bone volume/total volume; BMD, bone-mineral density; Tb.Th, trabecular thickness; Tb.N, trabecular number. |
Histological evaluation
Histological sections stained with Van Gieson’s picrofuchsin and quantitative analysis of NB growth into samples after PK, PKLS, and PKNLS implanted in vivo for 12 weeks are shown in Figure 11. It was found that few NBs were found in the macropores of PK, which were filled by fibrous tissues (Figure 11A and B). However, more NB was found to grow into the macropores of PKLS (Figure 11C and D). Remarkably, many NBs were found to grow into the macropores of PKNLS (Figure 11C and D) and pores were almost fulfilled with NBs (Figure 11E and F). From quantitative analysis of NB growth into the porous surfaces of samples, it was found that the NB area for PKNLS was significantly higher than PKLS and PKLS larger than PK (Figure 11G).
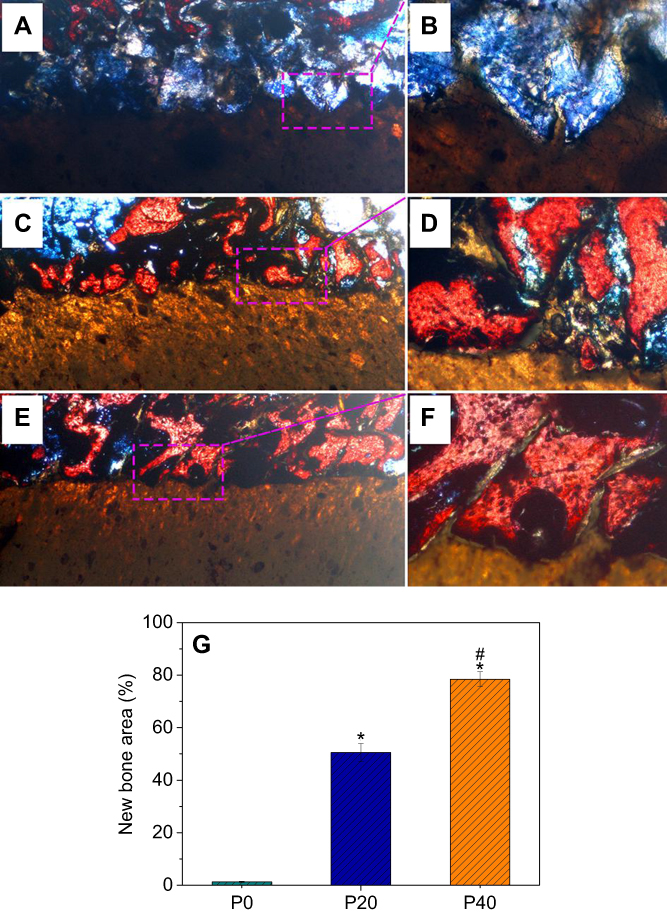 |
Figure 11 Van Gieson’s staining for NB growth in the samples after PK (A, B), PKLS (C, D), and PKNLS (E, F) implanted in vivo for 12 weeks. Quantitative analysis was showed in G. (*p<0.05, vs PK; #p<0.05, PKNLS vs PKLS) |
Discussion
As a biomaterial for orthopedic implants, PK displays some advantages (such as good biocompatibility, high mechanical strength, and elastic modulus in human bone). However, the disadvantage of biological inertness of PK exhibits inferior osteogenesis in vivo.22 In this study, to enhance osteogenic activity of PK, a porously bioactive surface of PKNLS was fabricated on the PK surface. The results revealed that the porous surface of PKNLS contained not only macroporosity but also nanoporosity due to the presence of NLS with nanopores. In addition, the porous surface of PKNLS exhibited interconnected macropores of around 300 μm, which was in favor of ingrowth of NB.23 Moreover, no interface was found between the porous surface and PK substrate, indicating that the porous surface was integrated with PK. Therefore, this macroporous/nanoporous surface of PKNLS exhibited good osteogenic activity while maintaining the mechanical properties of PK.
It is known that not only pore size but also porosity of the biomaterial has obvious effects on NB formation, and high porosity is of great benefit to osteogenesis in vivo.24 In this study, the results indicated that there was no obvious difference in porosity between PK and PKLS, while PKNLS exhibited the highest porosity, because the porous surfaces of both PK and PKLS contained macroporosity while PKNLS contained not only macroporosity but also nanoporosity. Therefore, the improvement in porosity for PKNLS was ascribed to the presence of NLS, with nanopores compared with both PK and PKLS without nanopores. The adsorption of protein on the biomaterial can promote cell membrane in contact with the biomaterial surface and the extension of pseudopodia, which is beneficial to cell adhesion and spreading.25 In this study, the results showed that compared with PK, the protein adsorption of PKLS was obviously improved due to the presence of LS, which is a bioactive material with high hydrophilicity.26 Furthermore, compared with PKLS, the protein adsorption of PKNLS was further enhanced due to the presence of NLS.
As an indicator of both porosity and hydrophilicity, water absorption is essential for the biomaterial in the biological environment, and is favorable for cell adhesion.27 In this study, compared with PK, the water absorption of PKLS was obviously improved due to the presence of hydrophilic LS. Furthermore, compared with PKLS, the water absorption of PKNLS was further enhanced due to the presence of hydrophilic NLS. Therefore, the improvement in water absorption of PKNLS was attributed to the presence of NLS. With the highest water absorption, PKNLS might be expected to absorb a large amount of blood and tissue fluid after implantation in vivo conducive to acceleration of osteogenesis.28
The ability of in vitro apatite mineralization of biomaterials in SBF is usually regarded as in vivo osteogenic activity.29 In this study, the results showed that compared with the porous surfaces of PK and PKLS containing LS without nanoporosity, the ability of apatite mineralization of PKNLS was the highest, indicating excellent bioactivity. Therefore, the enhancement of apatite mineralization of the porous surface of PKNLS was ascribed to the presence of NLS. Studies have shown that release of Mg and Si ions from silicates plays a key role in inducing apatite mineralization. The Mg ions exchanged with H+ in SBF, and then an Si-OH group layer formed on the surface of silicate through a series of reactions and provided sites for phosphate nucleation, followed by the growth of amorphous calcium phosphate and crystallization to form apatite.30 Therefore, compared with PKLS, PKNLSreleased more Mg and Si ions, and provided more sites for phosphate nucleation (apatite formation), and thus exhibited the highest ability of apatite mineralization.
Cell adhesion to the biomaterial surface is usually responsible for ensuing cell function and eventual osteogenesis in vivo.31 In this study, cells with pseudopodia were found to grow into macropores of PKNLS, which displayed better adhesion and spreading morphology on the walls of macropores than PKLS and PK. Furthermore, the attachment ratio of cells for PKNLS was significantly higher than PKLS and PK. Therefore, the promotion of cell adhesion and spreading on the porous surface of PKLNS containing NLS was attributed to the presence of nanoporosity compared with PKLS, containing LS without nanoporosity.
Cell proliferation on biomaterial is the second stage of bone remodeling after cell adhesion, and is closely correlated with ensuing cell differentiation and eventual bone formation.32 Compared with PKLS, cell proliferation for PKNLS was obviously improved due to the presence of NLS. Moreover, compared with PK, cell proliferation for PKLS was obviously enhanced due to the presence of LS. At the early stage of osteoblast differentiation, the production of ALP can provide sufficient local concentration of phosphate for mineralization, and ALP activity is generally regarded as a marker of osteoblast differentiation.33 Compared with PKLS, the ALP activity for PKNLS obviously increased due to the presence of NLS. Moreover, compared with PK, ALP activity for PKLS was significantly enhanced due to the presence of LS.
Cell response (eg, cell adhesion, proliferation, and differentiation) to biomaterial is usually regulated by its surface characteristics (such as surface chemistry and topography).34 In this study, compared with PKLS containing LS and PK, PKNLS containing NLS led to overall enlargement of the surface area, and potentially altered not only the surface topography, but also chemical composition. Therefore, the presence of nanoporosity obviously improved surface performances (such as surface morphology and ion release) of the porous surface of PKNLS and obviously stimulated cell response. Studies have confirmed that certain concentrations of Li, Mg, and Si ions released from biomaterials promote cell proliferation, differentiation, and gene expressions.35 In this study, Li, Mg, and Si ions were released slowly from both PKNLS and PKLS into cell cultured medium, and concentrations of Li, Mg, and Si ions for PKNLS in cell culture medium were higher than PKLS. Therefore, the improvement in cell proliferation and differentiation was attributed to the presence of nanoporosity, which promoted these ions' release from the porous surface of PKNLS into cell-culture medium.
In vivo studies were performed to determine the effects of PKNLS on osteogenesis. From mCT evaluations, NB around PKNLS was significantly enhanced compared with PKLS. Moreover, the NB around PKLS was obviously improved compared with PK. Clearly, the NB around PKLNS exhibited the highest, indicating that PKNLS obviously promoted osteogenesis. Histological evaluations showed that the macropores of PK were filled with fibrous tissues (no NB), indicating inferior osteogenesis. However, the NB was found to grow into the macropores of both PKLNS and PKLS, and the NBs were closely contact with the surfaces of both PKNLS and PKLS. Furthermore, the amount of NB is highest for PKNLS, indicating that PKNLS obviously promoted osteogenesis.
Surface characteristics (eg, pore size, porosity, and morphology) of biomaterials play key roles in facilitating osteoblast responses (eg, adhesion, proliferation, and differentiation) in vivo and ultimately osteogenesis.36 In this study, the porously bioactive surface of PKNLS was best for osteogenesis in vivo, as it not only regulated cell responses (nanopores) but also enhanced bone-tissue anchorage and ingrowth (macropores). The generally accepted mechanism of osteogenesis ofbioactive material is that osteoblasts first adhere to the surface, formed the bone matrix, and then mineralize to form bone.37 This process was favored by apatite mineralization on the biomaterial surface in the physiological environment because the apatite formed is closely similar to bone mineral in composition and structure and serves as a foundation for osteogenesis.38 In this study, compared with PK, the apatite-formation ability of PKLS containing LS was obviously improved. Moreover, compared with PKLS, the apatite formation ability of PKNLS was further improved. Therefore, it can be suggested thatpromotion of in vitro cell responses and in vivo osteogenesis of PKLNS were due to the improvement in apatite-formation ability. Moreover, the increase in Li, Mg, and Si ion release from the nanoporous/macroporous surface of PKNLS might have promoted NB formation in vivo compared with PKNLS and PK.
In this study, synergistic effects of nanoporosity and bioactivity of LNS in the porous surface of PKNLS played key roles in improvement of osteogenic activity, and significantly favored adhesion, proliferation, and differentiation of osteoblasts and NB formation both in vitro and in vivo. In summary, the nanoporous/macroporous surface of PKNLS exhibited good biocompatibility and significantly promoted osteogenesis, both of which are desirable in medical implants for bone repair.
Conclusions
In this study, a porously bioactive surface of PKNLS was fabricated on a PK surface, which contained both macroporosity and nanoporosity. The porosity, water absorption, protein absorption, and apatite mineralization ability of PKNLSwith nanopores were significantly improved compared with PKLS without nanopores. In addition, responses of the MC3T3E1 cells (adhesion, proliferation, and differentiation) to PKNLS were obviously enhanced as compared with PKLS and PK. Moreover, the results of in vivo implantation showed that the porous surface of PKNLS integration with PK significantly promoted the ingrowth of NBs. In summary, PKNLS exhibited excellent osteogenic activity, which might have great potential for bone repair.
Acknowledgments
This study was supported by grants from National Natural Science Foundation of China (81301546 and 81501905), National Key Research and Development Program of China (No 2016YFC1100600), Natural Science Foundation of Shanghai Science and Technology Committee (114119a2800), and New Cutting-Edge Technology Project of ShenKang Hospital Development Center of Shanghai (SHDC12014124).
Disclosure
The authors report no conflicts of interest in this work.
References
1. Ma HS, Feng C, Chang J, Wu CT. 3D-printed bioceramic scaffolds: from bone tissue engineering to tumor therapy. Acta Biomater. 2018;79:37–59. doi:10.1016/j.actbio.2018.08.026
2. Hotchkiss KM, Clark NM, Olivares-Navarrete R. Macrophage response to hydrophilic biomaterials regulates MSC recruitment and T-helper cell populations. Biomaterials. 2018;182:202–215. doi:10.1016/j.biomaterials.2018.08.029
3. Sikder P, Grice CR, Lin BR, Goel VK, Bhaduri SB. Single-phase, antibacterial trimagnesium phosphate hydrate coatings on polyetheretherketone (PEEK) implants by rapid microwave irradiation technique. Acs Biomater-Sci Eng. 2018;4:2767–2783. doi:10.1021/acsbiomaterials.8b00594
4. Toth JM, Wang M, Estes BT, Scifert JL, Seim HB, Turner AS. Polyetheretherketone as a biomaterial for spinal applications. Biomaterials. 2006;27:324–334. doi:10.1016/j.biomaterials.2005.07.011
5. Zhao Y, Wong HM, Wang WH, et al. Cytocompatibility, osseointegration, and bioactivity of three-dimensional porous and nanostructured network on polyetheretherketone. Biomaterials. 2013;34:9264–9277. doi:10.1016/j.biomaterials.2013.08.071
6. Lee JH, Jang HL, Lee KM, Baek HR, Jin K, Noh H. Cold-spray coating of hydroxyapatite on a three-dimensional polyetheretherketone implant and its biocompatibility evaluated by in vitro and in vivo minipig model. J Biomed Mater Res B. 2017;105:647–657. doi:10.1002/jbm.b.33589
7. Xu AX, Liu XC, Gao X, Deng F, Deng Y, Wei SC. Enhancement of osteogenesis on micro/nano-topographical carbon fiber-reinforced polyetheretherketone- nanohydroxyapatite biocomposite. Mat Sci Eng C. 2015;48:592–598. -MATER. doi:10.1016/j.msec.2014.12.061
8. Yabutsuka T, Fukushima I, Hiruta T, Takai S, Yao T. Effect of pores formation process and oxygen plasma treatment to hydroxyapatite formation on bioactive PEEK prepared by incorporation of precursor of apatite. Mat Sci Eng C. 2017;81:349–358. doi:10.1016/j.msec.2017.07.017
9. Kienle A, Graf N, Wilke HJ. Does impaction of titanium-coated interbody fusion cages into the disc space cause wear debris or delamination? Spine J. 2016;16:235–242. doi:10.1016/j.spinee.2015.09.038
10. Yuan B, Chen YM, Lin H, et al. Processing and properties of bioactive surface-porous PEKK. Acs Biomater-Sci Eng. 2016;2:977–986. doi:10.1021/acsbiomaterials.6b00103
11. Velasco-Ortega E, Alfonso-Rodriguez CA, Monsalve-Guil L, et al. Relevant aspects in the surface properties in titanium dental implants for the cellular viability. Mat Sci Eng C. 2016;64:1–10. doi:10.1016/j.msec.2016.03.049
12. Zhang J, Cai L, Tang LC, et al. Highly dispersed lithium doped mesoporous silica nanospheres regulating adhesion, proliferation, morphology, ALP activity and osteogenesis related gene expressions of BMSCs. Colloids Surf B. 2018;170:563–571. doi:10.1016/j.colsurfb.2018.06.038
13. Popescu AC, Florian PE, Stan GE, et al. Physical-chemical characterization and biological assessment of simple and lithium-doped biological-derived hydroxyapatite thin films for a new generation of metallic implants. Appl Surf Sci. 2018;439:724–735. doi:10.1016/j.apsusc.2018.01.008
14. Arioka M, Takahashi-Yanaga F, Sasaki M, et al. Acceleration of bone regeneration by local application of lithium: Wnt signal-mediated osteoblastogenesis and Wnt signal-independent suppression of osteoclastogenesis. Biochem Pharmacol. 2014;90:397–405. doi:10.1016/j.bcp.2014.06.011
15. Wang XM, Zhu SS, Jiang XW, Li YF, Song DH, Hu J. Systemic administration of lithium improves distracted bone regeneration in rats. Calcified Tissue Int. 2015;96:534–540. doi:10.1007/s00223-015-0004-7
16. Wu Y, Zhu SA, Wu CT, et al. A bi-lineage conducive scaffold for osteochondral defect regeneration. Adv Funct Mater. 2014;24:4473–4483. doi:10.1002/adfm.201304304
17. Cai YR, Guo LP, Shen HX, et al. Degradability, bioactivity, and osteogenesis of biocomposite scaffolds of lithium-containing mesoporous bioglass and mPEG-PLGA-b-PLL copolymer. Int J Nanomed. 2015;10:4125–4136.
18. Cao LH, Weng WZ, Chen X, et al. Promotion of in vivo degradability, vascularization and osteogenesis of calcium sulfate-based bone cements containing nanoporous lithium doping magnesium silicate. Int J Nanomed. 2017;12:1341–1352. doi:10.2147/IJN.S124965
19. Wu ZY, Li Q, Pan YK, et al. Nanoporosity improved water absorption, in vitro degradability, mineralization, osteoblast responses and drug release of poly(butylene succinate)-based composite scaffolds containing nanoporous magnesium silicate compared with magnesium silicate. Int J Nanomed. 2017;12:3637–3651. doi:10.2147/IJN.S132778
20. Li DH, Xie XW, Yang ZY, et al. Enhanced bone defect repairing effects in glucocorticoid-induced osteonecrosis of the femoral head using a porous nano-lithium- hydroxyapatite/gelatin microsphere/erythropoietin composite scaffold. Biomater Sci. 2018;6:519–537. doi:10.1039/c7bm00975e
21. Kokubo T, Takadama H. How useful is SBF in predicting in vivo bone bioactivity? Biomaterials. 2006;27:2907–2915. doi:10.1016/j.biomaterials.2006.01.017
22. Kurtz SM, Devine JN. PEEK biomaterials in trauma, orthopedic, and spinal implants. Biomaterials. 2007;28:4845–4869. doi:10.1016/j.biomaterials.2007.07.013
23. Xia L, Zhang N, Wang X, et al. The synergetic effect of nano-structures and silicon-substitution on the properties of hydroxyapatite scaffolds for bone regeneration. J Mater Chem B. 2016;4:3313–3323. doi:10.1039/C6TB00187D
24. Kapat K, Srivas PK, Rameshbabu AP, et al. Influence of porosity and pore-size distribution in Ti6Al4 V foam on physicomechanical properties, osteogenesis, and quantitative validation of bone ingrowth by micro-computed tomography. Acs Appl Mater Inter. 2017;9:39235–39248. doi:10.1021/acsami.7b13960
25. Zhang XY, Zhang GN, Li JF, et al. Cellular response to nano-structured Zr and ZrO2 alloyed layers on Ti-6Al-4V. Mat Sci Eng C. 2018;90:523–530. doi:10.1016/j.msec.2018.05.009
26. Feng SP, Li JY, Jiang XS, et al. Influences of mesoporous magnesium silicate on the hydrophilicity, degradability, mineralization and primary cell response to a wheat protein based biocomposite. J Mater Chem B. 2016;4:6428–6436. doi:10.1039/C6TB01449F
27. He FP, Li JY, Ye JD. Improvement of cell response of the poly(lactic-co-glycolic acid)/calcium phosphate cement composite scaffold with unidirectional pore structure by the surface immobilization of collagen via plasma treatment. Colloids Surf B. 2013;103:209–216. doi:10.1016/j.colsurfb.2012.10.018
28. Cai L, Pan YK, Tang SC, et al. Macro-mesoporous composites containing PEEK and mesoporous diopside as bone implants: characterization, in vitro mineralization, cytocompatibility, and vascularization potential and osteogenesis in vivo. J Mater Chem B. 2017;5:8337–8352. doi:10.1039/C7TB02344H
29. Angelopoulou A, Efthimiadou EK, Kordas G. A new approach to fabricate bioactive silica binary and ternary hybrid microspheres. Mat Sci Eng C. 2015;53:76–82. doi:10.1016/j.msec.2015.04.014
30. Ko CL, Chen JC, Tien YC, Hung CC, Wang JC, Chen WC. Osteoregenerative capacities of dicalcium phosphate-rich calcium phosphate bone cement. J Biomed Mater Res A. 2015;103:203–210. doi:10.1002/jbm.a.35167
31. Chen SC, Guo YL, Liu RH, et al. Tuning surface properties of bone biomaterials to manipulate osteoblastic cell adhesion and the signaling pathways for the enhancement of early osseointegration. Colloids Surf B. 2018;164:58–69. doi:10.1016/j.colsurfb.2018.01.022
32. Wang Q, Huang YX, Qian ZY. Nanostructured surface modification to bone implants for bone regeneration. J Biomed Nanotechnol. 2018;14:628–648. doi:10.1166/jbn.2018.2516
33. Sun HL, Wu CT, Dai KR, Chang J, Tang TT. Proliferation and osteoblastic differentiation of human bone marrow-derived stromal cells on akermanite-bioactive ceramics. Biomaterials. 2006;27:5651–5657. doi:10.1016/j.biomaterials.2006.07.027
34. Zhao SC, Wang H, Zhang YD, et al. Copper-doped borosilicate bioactive glass scaffolds with improved angiogenic and osteogenic capacity for repairing osseous defectse. Acta Biomater. 2015;14:185–196. doi:10.1016/j.actbio.2014.12.010
35. Zhai WY, Lu HX, Wu CT, et al. Stimulatory effects of the ionic products from Ca-Mg-Si bioceramics on both osteogenesis and angiogenesis in vitro. Acta Biomater. 2013;9:8004–8014. doi:10.1016/j.actbio.2013.04.024
36. Habibovic P, Juhl MV, Clyens S, et al. Comparison of two carbonated apatite ceramics in vivo. Acta Biomater. 2010;6:2219–2226. doi:10.1016/j.actbio.2009.11.028
37. Hasenbein ME, Andersen TT, Bizios R. Micropatterned surfaces modified with select peptides promote exclusive interactions with osteoblasts. Biomaterials. 2002;23:3937–3942.
38. Declercq H, Van Den Vreken N, De Maeyer E, et al. Isolation, proliferation and differentiation of osteoblastic cells to study cell/biomaterial interactions: comparison of different isolation techniques and source. Biomaterials. 2004;25:757–768.
 © 2019 The Author(s). This work is published and licensed by Dove Medical Press Limited. The full terms of this license are available at https://www.dovepress.com/terms.php and incorporate the Creative Commons Attribution - Non Commercial (unported, v3.0) License.
By accessing the work you hereby accept the Terms. Non-commercial uses of the work are permitted without any further permission from Dove Medical Press Limited, provided the work is properly attributed. For permission for commercial use of this work, please see paragraphs 4.2 and 5 of our Terms.
© 2019 The Author(s). This work is published and licensed by Dove Medical Press Limited. The full terms of this license are available at https://www.dovepress.com/terms.php and incorporate the Creative Commons Attribution - Non Commercial (unported, v3.0) License.
By accessing the work you hereby accept the Terms. Non-commercial uses of the work are permitted without any further permission from Dove Medical Press Limited, provided the work is properly attributed. For permission for commercial use of this work, please see paragraphs 4.2 and 5 of our Terms.