")
Back to Journals » Diabetes, Metabolic Syndrome and Obesity » Volume 12
Osteoarthritis patients with high haemoglobin A1c have increased Toll-like receptor 4 and matrix metalloprotease-13 expression in the synovium
Authors Murata K, Uchida K , Takano S, Shoji S, Iwase D, Inoue G , Aikawa J , Yokozeki Y, Sekiguchi H, Takaso M
Received 22 March 2019
Accepted for publication 4 July 2019
Published 16 July 2019 Volume 2019:12 Pages 1151—1159
DOI https://doi.org/10.2147/DMSO.S209677
Checked for plagiarism Yes
Review by Single anonymous peer review
Peer reviewer comments 2
Editor who approved publication: Prof. Dr. Muthuswamy Balasubramanyam
Kosuke Murata,1 Kentaro Uchida,1 Shotaro Takano,1 Shintaro Shoji,1 Dai Iwase,1 Gen Inoue,1 Jun Aikawa,1 Yuji Yokozeki,1 Hiroyuki Sekiguchi,2 Masashi Takaso1
1Department of Orthopedic Surgery, Kitasato University School of Medicine, Sagamihara City, Kanagawa 252-0374, Japan; 2Shonan University of Medical Sciences Research Institute, Chigasaki City, Kanagawa 253-0083, Japan
Purpose: While research has identified diabetes mellitus (DM) as a risk factor for knee osteoarthritis (KOA), the underlying mechanisms are not fully understood. Studies suggest that Toll-like receptor 4 (TLR4) expression is elevated in osteoarthritic lesions of OA patients and in target tissues of insulin resistance such as adipose tissue and skeletal muscle in patients with DM. TLR4 is associated with inflammation and catabolic response via regulation of matrix metalloproteases (MMPs). We hypothesized that TLR4 and MMP expression may be increased in the synovial tissue (SYN) of KOA patients with diabetic pathology. We therefore investigated TLR and MMP expression in the SYN of KOA patients with and without high haemoglobin A1c concentrations.
Patients and methods: A total of 171 patients radiographically diagnosed with KOA were grouped based on their HbA1c concentration (HbA1c ≥6.5 and HbA1c <6.5). We used real-time polymerase chain reaction to compare the expression of TLRs (TLR2, TLR4) and MMPs (MMP2, MMP3, MMP9 and MMP13) in patients’ SYN between the two groups. MMP13 regulation by the TLR4 ligand, lipopolysaccharide (LPS), in SYN cells was examined in culture by stimulating SYN cells with LPS or vehicle (culture medium) for 24 h.
Results: The expression of TLR4 and MMP13 in the HbA1c ≥6.5 group was significantly elevated compared to that in the HbA1c <6.5 group. In contrast, TLR2, MMP2, MMP3 and MMP9 expression levels were similar between the groups. MMP13 mRNA and MMP13 protein levels in SYN cells were significantly higher following stimulation with LPS compared to vehicle.
Conclusions: TLR4 and MMP13 expression were elevated in the synovium of osteoarthritis patients with high HbA1c concentrations. Our results may provide insight into the pathology of OA patients with DM.
Keywords: osteoarthritis, diabetes mellitus, TLR4, MMP13
Introduction
Several studies have reported an association between over-loading due to obesity and the development of knee osteoarthritis (KOA).1–4 However, based on the epidemiological correlation between hand OA and overweight or obesity, systemic factors identified in the association with KOA may also be involved in general OA pathology.5–8 Some epidemiological studies have also suggested an association of diabetes mellitus (DM) and hyperglycemia with OA.9–13 However, the mechanism underlying such an association is not fully understood.
Toll-like receptors (TLRs) are transmembrane proteins with roles in DM pathology. Among the TLR subtypes, TLR2 and TLR4 play an important role in DM pathology in both experimental and clinical conditions.14–16 TLR4-mediated chronic inflammation is also associated with DM complications such as diabetic neuropathy, diabetic retinopathy, and diabetic nephropathy.17 Interestingly, TLR4 is also expressed in joint tissues and contributes to OA pathology via inflammation and inflammation-induced catabolism.18,19 TLR4 deficiency decreases disease severity, as evidenced by lower bone erosion, cartilage damage, and synovial cellular influx.20 However, whether TLR4 levels are elevated in KOA patients with DM remains to be determined.
TLR4 signaling contributes to catabolic responses and results in elevated production of matrix metalloproteinase (MMP). Among the MMP subtypes, MMP13 expression is most localized to connective tissue,21 where it degrades type II, IV and IX collagen in articular cartilage,22 and is a key enzyme targeting cartilage for degradation. TLR4 is linked to MMP13 expression.22,23 TLR4 deficiency reduces MMP13 expression in mice.23 Interestingly, a recent study showed that glucose treatment of zebrafish induced diabetic conditions and increased MMP13 expression.24 We therefore hypothesized that MMP13 may be elevated in KOA patients under diabetic conditions.
Here, we compared TLR and MMP expression in synovial tissue (SYN) between KOA patients with and without high haemoglobin A1c concentrations.
Materials and methods
Patients
Power analysis using an alpha of 0.05, power of 0.80, and N2 (number of patients with HbA1c ≥6.5)/N1 (number of patients with HbA1c <6.5) ratio of 0.155 was conducted in G*POWER3 to determine the optimal sample size. Power analysis revealed that 23 patients with HbA1c ≥6.5 and 148 patients with HbA1c <6.5 were needed to detect a difference in TLR4 between HbA1c ≥6.5 and HbA1c <6.5 groups.
We examined SYN from patients (38 men and 133 women) with KOA diagnosed by radiography who underwent total knee arthroplasty at our institution. KOA patients with a cancer diagnosis, trauma, rheumatoid arthritis or other collagen diseases were excluded from this study. SYN samples were harvested from the operated knee during the operation. A piece of each of the 171 SYN specimens was snap frozen in liquid nitrogen at −80 °C prior to RNA extraction. Eight SYN specimens were used for cell culture.
This study protocol received approval by the Ethics Review Board of Kitasato University (reference number: KMEO B13-113). Written informed consent was obtained from all participants regarding participation in the study and the removal and use of their SYN one day prior to surgery. This study was conducted in accordance with the Declaration of Helsinki.
Quantitative polymerase chain reaction (qPCR) analysis
To evaluate the effect of the diabetic state on TLR and MMP expression, OA patients were grouped based on their HbA1c concentration (HbA1c ≥6.5 and HbA1c <6.5).25 Patients’ clinical characteristics are summarized in Table 1 by group. Methods for total RNA extraction, cDNA synthesis and qPCR using SYBR Green are described elsewhere.26 The following PCR primers were used for qPCR: TLR2-sense 5ʹ-CCT GTG TGA CTC TCC ATC CC-3ʹ, TLR2-antisense 5ʹ-GAC ATT CCG ACA CCG AGA GG-3 (product size: 71 bp); TLR4-sense 5ʹ-CGA CAA CCT CCC CTT CTC AAC-3ʹ, TLR4-antisense 5ʹ-AGA GGT GGC TTA GGC TCT GAT-3 (product size: 167 bp); MMP2-sense 5ʹ-GTG AAG TAT GGG AAC GCC GA-3ʹ, MMP2-antisense 5ʹ-AGA AGC CGT ACT TGC CAT CC-3 (product size: 154 bp); MMP3-sense 5ʹ-GTG GAG TTC CTG ACG TTG GT-3ʹ, MMP3-antisense 5ʹ-TGG AGT CAC CTC TTC CCA GA-3 (product size: 164 bp); MMP9-sense 5ʹ-TTT GAG TCC GGT GGA CGA TG-3ʹ, MMP9-antisense 5ʹ-GCT CCT CAA AGA CCG AGT CC-3 (product size: 197 bp); MMP13-sense 5ʹ-TGA CTG AGA GGC TCC GAG AA-3ʹ, MMP13-antisense 5ʹ-CAT CAG GAA CCC CGC ATC TT-3 (product size: 111 bp); GAPDH-sense 5ʹ-TGT TGC CAT CAA TGA CCC CTT-3ʹ and GAPDH-antisense 5ʹ-CTC CAC GAC GTA CTC AGC G-3ʹ (product size: 202 bp). TLR and MMP mRNA expression levels were normalized to GAPDH levels using the delta-delta Ct method. We compared the expression of TLR2, TLR4, MMP2, MMP3, MMP9 and MMP13 in the SYN between the two HbA1c groups. Additionally, we grouped the patients based on the World Health Organization Body Mass Index (BMI) classification (Table 2) (normal, overweight, obese) and compared TLR2, TLR4, MMP2, MMP3, MMP9 and MMP13 expression among these groups. Relative expression was calculated using the mean of all control samples (samples from SYN from the HbA1c <6.5 group or α-MEM-treated SYN cells in vitro). To investigate potential gender effects, female and male KOA patients were grouped based on their HbA1c level and BMI and TLR4 and MMP13 levels were analyzed.
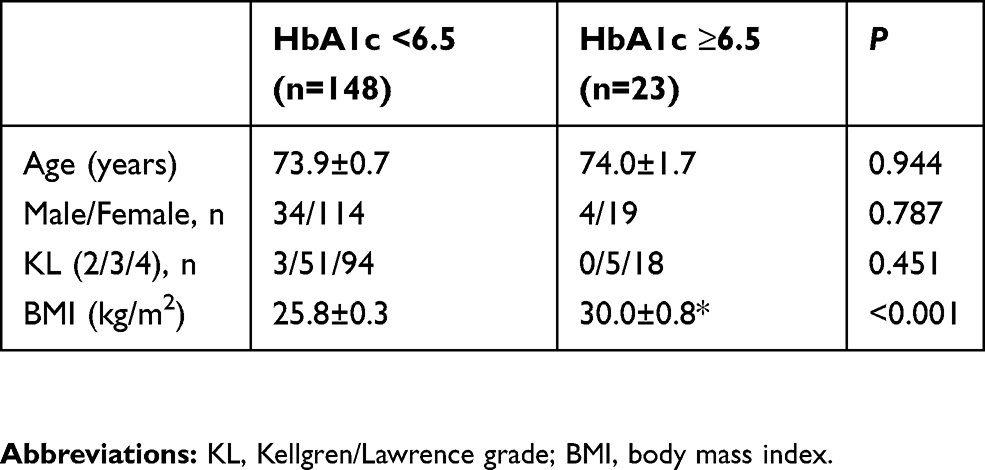 |
Table 1 Patients’ clinical characteristics by HbA1c group |
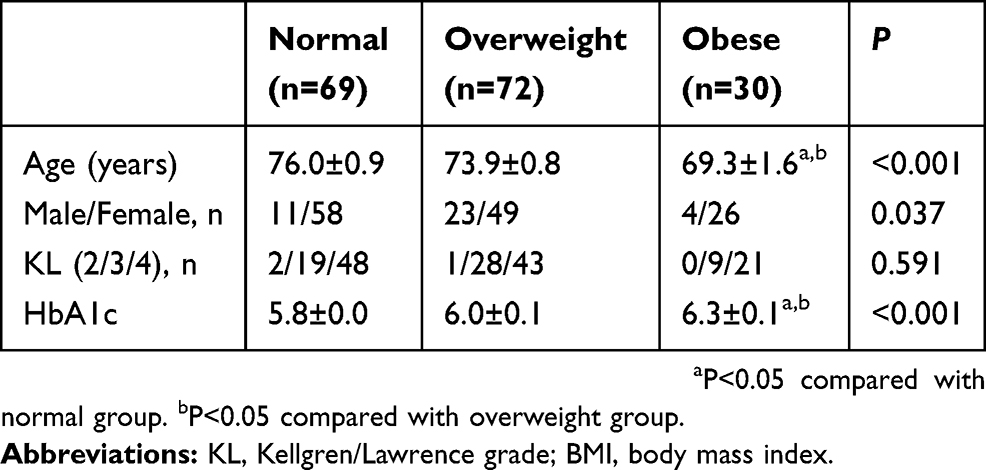 |
Table 2 Patients’ clinical characteristics by body mass index group |
Cell culture
SYN cells derived from 8 patients were used to examine the effect of the TLR4 agonist, LPS, on MMP13 mRNA expression and MMP13 protein production. Synovial cells were obtained following collagenase digestion of SYN as reported previously.27 Isolated synovial cells were cultured in 6-well plates in α-minimal essential media (α-MEM) with 10% fetal bovine serum. One week later, the cell population of cultured SYN cells was determined using flow cytometric analysis as reported previously.27 The cultured SYN cells were incubated with FITC-conjugated anti-CD45 (Biolegend, CA, USA) and allophycocyanin (APC)-conjugated anti-CD90 (Biolegend) antibodies for 45 min at 4 °C. After washing twice in PBS, 50,000 total events were acquired using FACSVerseTM (BD Biosciences, San Jose, CA, USA), and the data were analyzed using Flow Jo 10.0 (Tree Star, Ashland, OR). SYN cells were exposed to 1000 μL of 0 (α-MEM), 100 or 1000 ng/mL LPS (Sigma, St. Louis, MO, USA) for 24 h. Subsequently, MMP13 mRNA expression was examined using qPCR with the primers described above. MMP13 protein concentration in the cell supernatant was analyzed using a commercial ELISA kit (Human Pro-MMP-13 Quantikine ELISA Kit, R&D Systems, Inc., Minneapolis, MN, USA).
Statistical analysis
The SPSS 25.0 statistical package was used for statistical analysis. Continuous variables were analyzed using the Mann-Whitney U test and Tukey multiple comparisons test, and categorical variables were analyzed using Fisher’s exact test. Statistical significance was defined by P<0.05.
Results
Clinical characteristics of patients with HbA1c ≥6.5 and HbA1c <6.5
BMI among KOA patients with HbA1c ≥6.5 was significantly higher than that among KOA patients with HbA1c <6.5 (Table 1). Age, male/female ratio and Kellgren/Lawrence grade 2/3/4 ratio were similar between the groups (Table 1).
Expression of TLRs and MMPs among patients with HbA1c ≥6.5 and HbA1c <6.5
To determine whether TLR and MMP expression levels are increased in diabetic KOA patients, we examined TLRs and MMPs in the SYN of KOA patients with HbA1c ≥6.5 and HbA1c <6.5. TLR2 expression was similar between patients with HbA1c ≥6.5 and HbA1c <6.5 (P=0.078; Figure 1A), while TLR4 expression in the HbA1c ≥6.5 group was significantly higher than that in the HbA1c <6.5 group (P=0.040; Figure 1B). There were no differences in MMP2, MMP3, or MMP9 expression between the groups (MMP2, P=0.626; MMP3, P=0.876; MMP9, P=0.912; Figure 1C–E). MMP13 expression in the HbA1c ≥6.5 group was significantly higher than that in the HbA1c <6.5 group (P<0.001; Figure 1F).
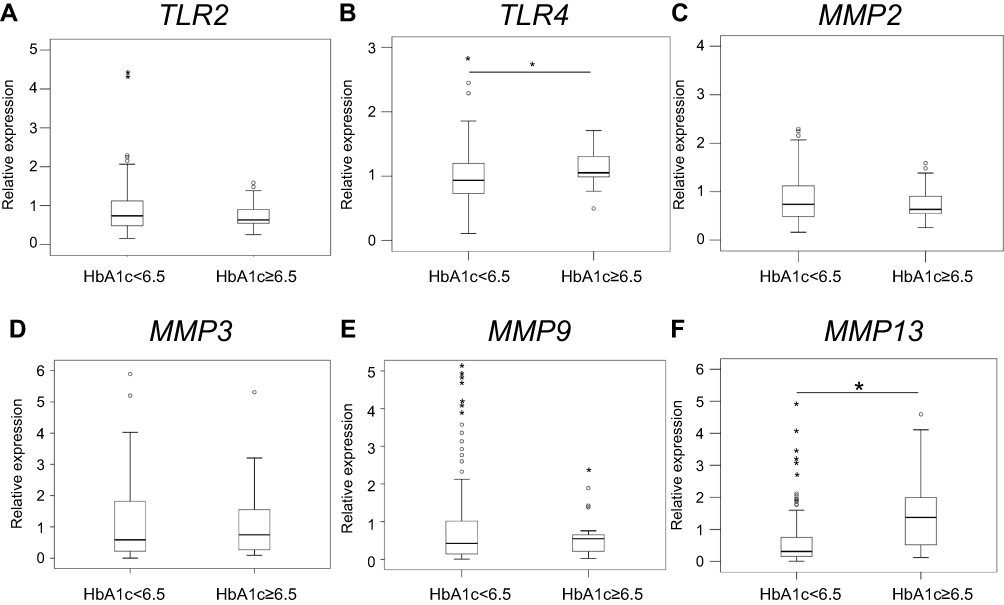 |
Figure 1 Effect of HbA1c concentration on TLR and MMP expression in the synovium. TLR2 (A), TLR4 (B), MMP2 (C), MMP3 (D), MMP9 (E) and MMP13 (F) expression in patients with HbA1c ≥6.5 and HbA1c <6.5. *P<0.05 compared with HbA1c <6.5 group. |
Effect of obesity on expression of TLRs and MMPs
Patients in the HbA1c ≥6.5 group had higher BMI than those in the HbA1c <6.5 group. We therefore investigated the effect of obesity on the expression of TLRs and MMPs. Patients in the obese group were significantly younger than those in the normal and overweight groups (Table 2). HbA1c levels in the obese group were significantly higher than those in the normal and overweight groups (Table 2). The Kellgren/Lawrence grade 2/3/4 ratio was similar among the groups (Table 2). Expression levels of TLR2, TLR4, MMP2, MMP3, MMP9, and MMP13 were also similar among the normal, overweight, and obese groups (TLR2, P=0.821; TLR4, P=0.075; MMP2, P=0.294; MMP3, P=0.636; MMP9, P=0.659; MMP13, P=0.853; Figure 2).
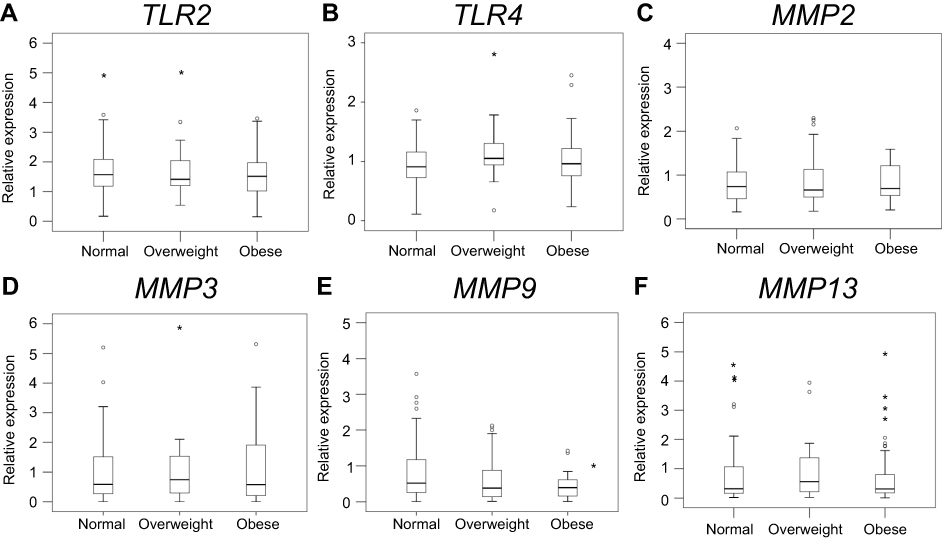 |
Figure 2 Effect of obesity on TLR and MMP expression in the synovium. TLR2 (A), TLR4 (B), MMP2 (C), MMP3 (D), MMP9 (E) and MMP13 (F) expression in normal, overweight, and obese groups. |
Gender differences in expression of TLR4 and MMP13
Previous studies have suggested that there may be gender differences in pathological conditions in obese and diabetes patients.28–32 Therefore, we analyzed TLR4 and MMP13 expression between HbA1c ≥6.5 and HbA1c <6.5 and among normal, overweight, and obese groups separately in male and female patients. Female patients but not male patients had higher BMI in the HbA1c ≥6.5 group than in the HbA1c <6.5 group (Table 3). Among male OA patients, there was no difference in TLR4 or MMP13 between the HbA1c ≥6.5 and HbA1c <6.5 group (P=0.216 and P=0.341, respectively; Figure 3A and B). TLR4 and MMP13 expression in female KOA patients with HbA1c ≥6.5 was significantly higher than that in female KOA patients with HbA1c <6.5 (P=0.021 and P<0.001, respectively; Figure 3C and D). Both male and female patients in the obese group were significantly younger than those in the normal group (Table 4). HbA1c levels in female patients but not male patients were significantly higher in the obese group than in the normal and overweight groups (Table 4). There were no differences in TLR4 or MMP13 among the normal, overweight, and obese groups in male (TLR4, P=0.888; MMP13, P=0.320; Figure 4A and B) or female (TLR4, P=0.096, MMP13, P=0.812; Figure 4C and D) KOA patients.
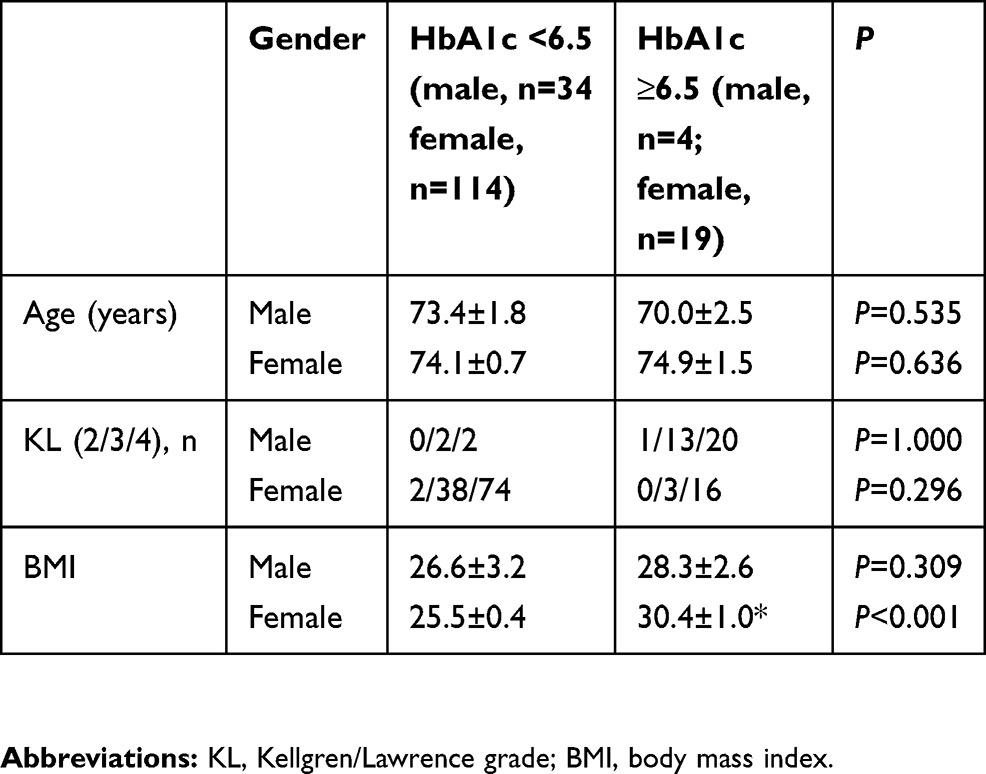 |
Table 3 Patients’ clinical characteristics by HbA1c group and gender |
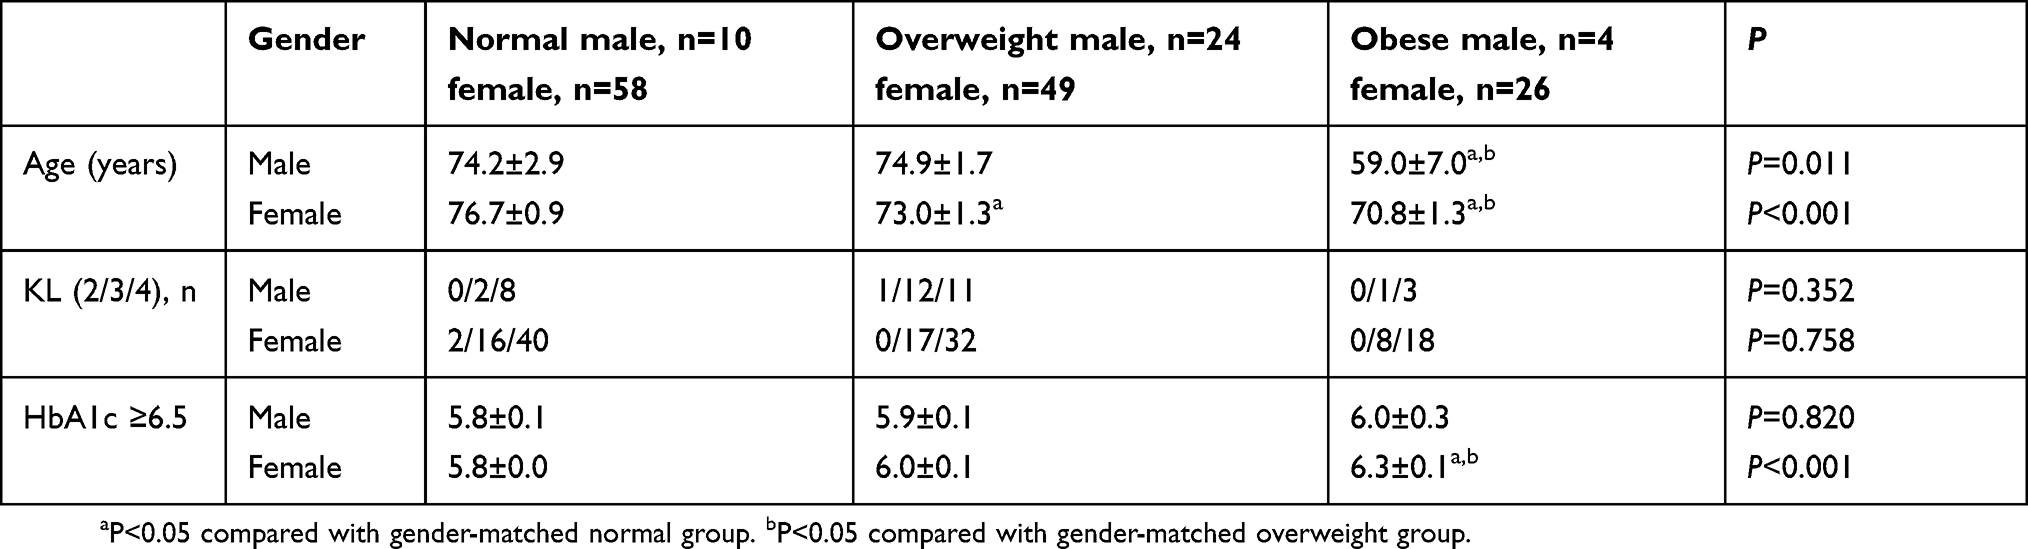 |
Table 4 Patients’ clinical characteristics by body mass index group and gender |
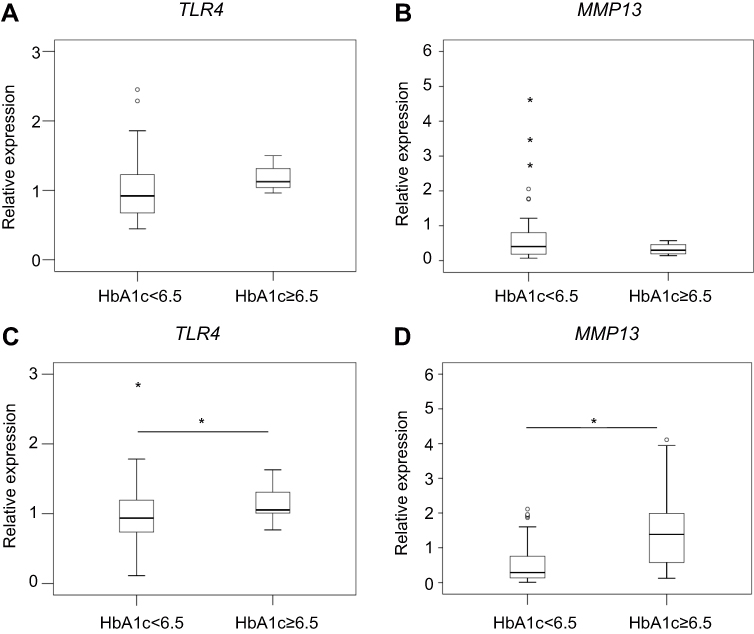 |
Figure 3 Effect of HbA1c on TLR4 and MMP13 expression in the synovium of male and female patients. (A-B). TLR4 (A) and MMP13 (B) expression in male patients with HbA1c ≥6.5 and HbA1c <6.5. C-D. TLR4 (C) and MMP13 (D) expression in female patients with HbA1c ≥6.5 and HbA1c <6.5. *P<0.05 compared with gender-matched HbA1c<6.5 group. |
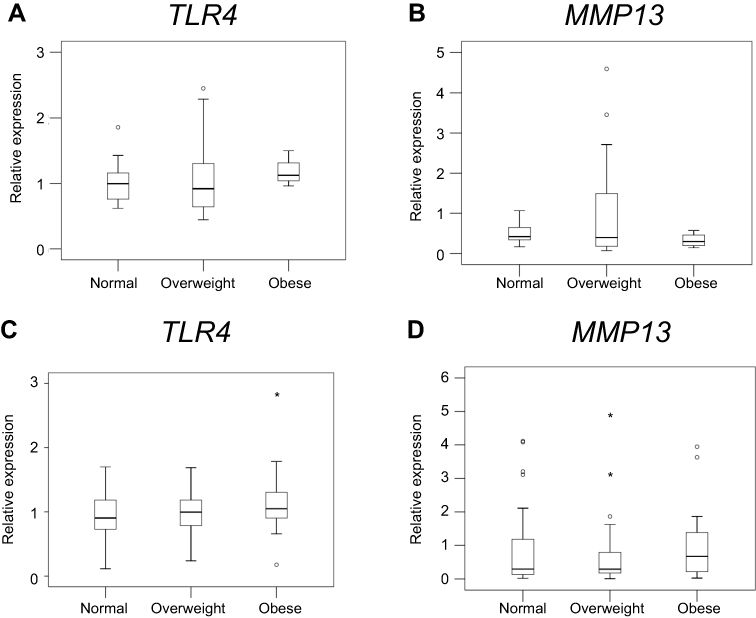 |
Figure 4 Effect of obesity on TLR and MMP expression in the synovium of male and female patients. (A-B). TLR4 (A) and MMP13 (B) expression in male patients in the normal, overweight, and obese groups. C-D. TLR4 (C) and MMP13 (D) expression in female patients in the normal, overweight, and obese groups. |
Effect of TLR4 ligand, LPS, on MMP13 expression and MMP13 production
Flow cytometric analysis showed that almost all cells (94.5±0.9%) among cultured SYN cells were CD45- CD90+ (synovial fibroblasts) (Figure 5A). TLR4 and MMP13 expression levels were elevated in the synovium of OA patients with high HbA1c concentrations. We therefore investigated whether a TLR4 agonist regulates MMP13 in synovial cells. Synovial cells stimulated with 100 or 1000 ng/mL LPS exhibited significant increases in MMP13 mRNA expression compared to vehicle-treated cells (P=0.006 and P=0.007, respectively; Figure 5B). MMP13 protein levels in the supernatant of synovial cells treated with 100 or 1000 ng/mL LPS were also significantly higher than those of cells treated with vehicle (P=0.021 and P=0.022, respectively; Figure 5C).
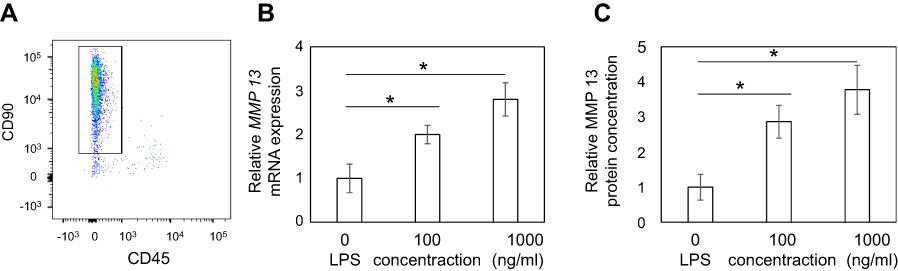 |
Figure 5 Effect of the TLR4 agonist lipopolysaccharide on MMP13 expression and MMP13 production. (A). Flow cytometric analysis of cultured synovial tissue-derived cells. X-axis indicates CD45, y-axis indicates CD90. (B-C). Effect of the TLR4 agonist lipopolysaccharide on MMP13 expression and MMP13 production. Relative MMP13 expression (B) and MMP13 protein concentration in the culture supernatant (C) of synovial cells treated with or without lipopolysaccharide were examined by quantitative PCR and enzyme-linked immunosorbent assay, respectively. Data indicate mean ± standard error (n=8). *P<0.05. |
Discussion
Studies have shown that TLR2 and TLR4 expression are raised in traditional target tissues of insulin resistance such as adipose tissue and skeletal muscle in DM patients.33,34 Consistent with these reports, we observed higher TLR4 expression in the SYN of KOA patients with high HbA1c concentrations. TLR4 is associated with inflammatory and catabolic responses, and is up-regulated in inflamed SYN35 and osteoarthritic lesions in OA patients.36 Elevated TLR4 expression in the SYN of KOA patients with high HbA1c concentrations may therefore be associated with OA pathology.
Clinical studies have reported elevated MMP13 expression in patients with articular cartilage destruction,37,38 indicating that raised MMP13 levels may contribute to cartilage degradation. A previous study showed that transgenic mice overexpressing Mmp13 exhibit OA phenotype, including cartilage degradation. TLR4 signaling is associated with catabolic response via MMP13.39 TLR4 ligands stimulate MMP13 in human chondrocytes40,41 and synovial fibroblasts.42 Here, MMP13 expression was increased in the SYN of KOA patients with high HbA1c concentrations. In addition, the TLR4 agonist, LPS, stimulated MMP13 expression and MMP13 production. Several endogenous TLR4 ligands that may exacerbate diabetic conditions have been reported, including advanced glycation end products,41 macroglobulin43 and amyloid-β.44 However, it is unclear which endogenous ligands contribute to the elevation of MMP13 in KOA patients with high HbA1c concentrations. Nevertheless, elevation of TLR4 and MMP13 expression in the SYN of KOA patients with high HbA1c concentrations may explain some of the epidemiological findings showing that DM is associated with OA. Previous epidemiological studies have reported that DM patients have high prevalence of overweight/obesity.45–47 Fatani et al reported that 41% of a DM patient population was obese.46 Hedley et al reported that 70% of DM patients were obese.47 In our study, patients with HbA1c ≥6.5 had higher BMI than those with HbA1c <6.5, and 56% of OA patients with HbA1c ≥6.5 were obese. However, TLR4 and MMP13 expression were comparable among normal, overweight, and obese patients. Therefore, our results suggest that higher TLR4 and MMP13 expression may be reflective of diabetic conditions but not obesity.
Several studies have reported gender differences in type 2 DM28,32 and obese patients.29–31 For example, the effect of type 2 DM on the risk of coronary heart disease is greater in females than males.28 Fat distribution with menopause is the main contributor to obesity in females.30,31 In our study, there were no significant differences in TLR4 or MMP13 expression among the normal, overweight, and obese groups in either males or females. In contrast, TLR4 and MMP13 expression in female KOA patients with HbA1c ≥6.5 was significantly higher than that in female KOA patients with HbA1c <6.5. No such difference was observed between male KOA patients with HbA1c ≥6.5 and HbA1c <6.5. Our results may indicate gender differences in KOA patients with diabetes. However, our study lacked sufficient numbers of male patients for statistical analysis. Further investigations are needed to reveal the potential gender differences in KOA pathology with diabetes.
Several limitations of the present study warrant mention. First, the present study lacked oral glucose tolerance test (OGTT) data. Further characterization with OGTT data may more accurately reflect TLR4 and MMP13 expression in diabetic conditions. Second, the inclusion of a non-KOA population is needed to confirm whether TLR4 and MMP13 expression are increased in diabetic individuals and if this directly contributes to KOA progression. Measurement of MMP levels in the serum of diabetic patients with and without OA and non-diabetic controls with and without OA is needed to support our conclusion. Third, elucidation of the mechanism by which TLR4 and MMP13 contributes to KOA pathology is needed. Fourth, we assessed the mRNA expression of TLRs and MMPs in SYN. Further investigation, such as a protein profiling study, is needed to tie the gene expression profile results together. Fifth, a positive control using a human synovial fibroblast or chondrocyte cell line was lacking in the in vitro study. Finally, whether there is also an increase in MMP/TLR expression in cartilage remains to be determined.
In summary, TLR4 and MMP13 were elevated in the synovium of osteoarthritis patients with high HbA1c concentrations. Our results may provide insights into the pathology of KOA patients with DM.
Acknowledgments
This investigation was supported by JSPS KAKENHI Grant No. 18K09119. We thank DMC Corp. (www.dmed.co.jp) for editing drafts of this manuscript.
Disclosure
The authors report no conflicts of interest in this work.
References
1. Coggon D, Reading I, Croft P, McLaren M, Barrett D, Cooper C. Knee osteoarthritis and obesity. Int J Obes Relat Metab Disord. 2001;25:622–627. doi:10.1038/sj.ijo.0801585
2. Felson DT. Relation of obesity and of vocational and avocational risk factors to osteoarthritis. J Rheumatol. 2005;32:1133–1135.
3. Hart DJ, Spector TD. The relationship of obesity, fat distribution and osteoarthritis in women in the general population: the Chingford Study. J Rheumatol. 1993;20:331–335.
4. Runhaar J, Koes BW, Clockaerts S, Bierma-Zeinstra SM. A systematic review on changed biomechanics of lower extremities in obese individuals: a possible role in development of osteoarthritis. Obes Rev. 2011;12:1071–1082. doi:10.1111/j.1467-789X.2011.00916.x
5. Aspden RM. Obesity punches above its weight in osteoarthritis. Nat Rev Rheumatol. 2011;7:65–68. doi:10.1038/nrrheum.2010.123
6. Griffin TM, Guilak F. Why is obesity associated with osteoarthritis? Insights from mouse models of obesity. Biorheology. 2008;45:387–398.
7. Grotle M, Hagen KB, Natvig B, Dahl FA, Kvien TK. Obesity and osteoarthritis in knee, hip and/or hand: an epidemiological study in the general population with 10 years follow-up. BMC Musculoskelet Disord. 2008;9:132. doi:10.1186/1471-2474-9-87
8. Oliveria SA, Felson DT, Cirillo PA, Reed JI, Walker AM. Body weight, body mass index, and incident symptomatic osteoarthritis of the hand, hip, and knee. Epidemiology. 1999;10:161–166.
9. Karvonen-Gutierrez CA, Sowers MR, Heeringa SG. Sex dimorphism in the association of cardiometabolic characteristics and osteophytes-defined radiographic knee osteoarthritis among obese and non-obese adults: NHANES III. Osteoarthritis Cartilage. 2012;20:614–621. doi:10.1016/j.joca.2012.02.644
10. Louati K, Vidal C, Berenbaum F, Sellam J. Association between diabetes mellitus and osteoarthritis: systematic literature review and meta-analysis. RMD Open. 2015;1:e000077. doi:10.1136/rmdopen-2015-000077
11. Schett G, Kiechl S, Bonora E, et al. Vascular cell adhesion molecule 1 as a predictor of severe osteoarthritis of the hip and knee joints. Arthritis Rheum. 2009;60:2381–2389. doi:10.1002/art.24757
12. WAINE H, NEVINNY D, ROSENTHAL J, Joffe IB. Association of osteoarthritis and diabetes mellitus. Tufts Folia Med. 1961;7:13–19.
13. Yoshimura N, Muraki S, Oka H, Kawaguchi H, Nakamura K, Akune T. Association of knee osteoarthritis with the accumulation of metabolic risk factors such as overweight, hypertension, dyslipidemia, and impaired glucose tolerance in Japanese men and women: the ROAD study. J Rheumatol. 2011;38:921–930. doi:10.3899/jrheum.100569
14. Devaraj S, Dasu MR, Rockwood J, Winter W, Griffen SC, Jialal I. Increased toll-like receptor (TLR) 2 and TLR4 expression in monocytes from patients with type 1 diabetes: further evidence of a proinflammatory state. J Clin Endocrinol Metab. 2008;93:578–583. doi:10.1210/jc.2007-2185
15. Shi H, Kokoeva MV, Inouye K, Tzameli I, Yin H, Flier JS. TLR4 links innate immunity and fatty acid-induced insulin resistance. J Clin Invest. 2006;116:3015–3025. doi:10.1172/JCI28898
16. Wong FS, Wen L. Toll-like receptors and diabetes. Ann N Y Acad Sci. 2008;1150:123–132. doi:10.1196/annals.1447.063
17. Huang NQ, Jin H, Zhou SY, Shi JS, Jin F. TLR4 is a link between diabetes and Alzheimer’s disease. Behav Brain Res. 2017;316:234–244. doi:10.1016/j.bbr.2016.08.047
18. Ospelt C, Brentano F, Rengel Y, et al. Overexpression of toll-like receptors 3 and 4 in synovial tissue from patients with early rheumatoid arthritis: toll-like receptor expression in early and longstanding arthritis. Arthritis Rheum. 2008;58:3684–3692. doi:10.1002/art.24140
19. Scanzello CR, Goldring SR. The role of synovitis in osteoarthritis pathogenesis. Bone. 2012;51:249–257. doi:10.1016/j.bone.2012.02.012
20. Bdollahi-Roodsaz S, Joosten LA, Koenders MI, et al. Stimulation of TLR2 and TLR4 differentially skews the balance of T cells in a mouse model of arthritis. J Clin Invest. 2008;118:205–216. doi:10.1172/JCI32639
21. Vincenti MP, Brinckerhoff CE. Transcriptional regulation of collagenase (MMP-1, MMP-13) genes in arthritis: integration of complex signaling pathways for the recruitment of gene-specific transcription factors. Arthritis Res. 2002;4:157–164. doi:10.1186/ar401
22. Shiomi T, Lemaitre V, D’Armiento J, Okada Y. Matrix metalloproteinases, a disintegrin and metalloproteinases, and a disintegrin and metalloproteinases with thrombospondin motifs in non-neoplastic diseases. Pathol Int. 2010;60:477–496. doi:10.1111/j.1440-1827.2010.02547.x
23. Liu-Bryan R, Terkeltaub R. Chondrocyte innate immune myeloid differentiation factor 88-dependent signaling drives procatabolic effects of the endogenous Toll-like receptor 2/Toll-like receptor 4 ligands low molecular weight hyaluronan and high mobility group box chromosomal protein 1 in mice. Arthritis Rheum. 2010;62:2004–2012. doi:10.1002/art.27475
24. Waldron AL, Schroder PA, Bourgon KL, et al. Oxidative stress-dependent MMP-13 activity underlies glucose neurotoxicity. J Diabetes Complications. 2018;32:249–257. doi:10.1016/j.jdiacomp.2017.11.012
25. Sabanayagam C, Khoo EY, Lye WK, et al. Diagnosis of diabetes mellitus using HbA1c in Asians: relationship between HbA1c and retinopathy in a multiethnic Asian population. J Clin Endocrinol Metab. 2015;100:689–696. doi:10.1210/jc.2014-2498
26. Minatani A, Uchida K, Inoue G, et al. Activation of calcitonin gene-related peptide signaling through the prostaglandin E2-EP1/EP2/EP4 receptor pathway in synovium of knee osteoarthritis patients. J Orthop Surg Res. 2016;11:117. doi:10.1186/s13018-016-0460-4
27. Takano S, Uchida K, Inoue G, et al. Nerve growth factor regulation and production by macrophages in osteoarthritic synovium. Clin Exp Immunol. 2017;190:235–243. doi:10.1111/cei.13007
28. Juutilainen A, Kortelainen S, Lehto S, Ronnemaa T, Pyorala K, Laakso M. Gender difference in the impact of type 2 diabetes on coronary heart disease risk. Diabetes Care. 2004;27:2898–2904. doi:10.2337/diacare.27.12.2898
29. Kanter R, Caballero B. Global gender disparities in obesity: a review. Adv Nutr. 2012;3:491–498. doi:10.3945/an.112.002063
30. Morita Y, Iwamoto I, Mizuma N, et al. Precedence of the shift of body-fat distribution over the change in body composition after menopause. J Obstet Gynaecol Res. 2006;32:513–516. doi:10.1111/j.1447-0756.2006.00437.x
31. Regitz-Zagrosek V, Lehmkuhl E, Mahmoodzadeh S. Gender aspects of the role of the metabolic syndrome as a risk factor for cardiovascular disease. Gend Med. 2007;4(Suppl B):S162–S177. doi:10.1016/S1550-8579(07)80056-8
32. Siddiqui MA, Khan MF, Carline TE. Gender differences in living with diabetes mellitus. Mater Sociomed. 2013;25:140–142. doi:10.5455/msm.2013.25.140-142
33. Dasu MR, Devaraj S, Park S, Jialal I. Increased toll-like receptor (TLR) activation and TLR ligands in recently diagnosed type 2 diabetic subjects. Diabetes Care. 2010;33:861–868. doi:10.2337/dc09-1799
34. Reyna SM, Ghosh S, Tantiwong P, et al. Elevated toll-like receptor 4 expression and signaling in muscle from insulin-resistant subjects. Diabetes. 2008;57:2595–2602. doi:10.2337/db08-0038
35. Radstake TR, Roelofs MF, Jenniskens YM, et al. Expression of toll-like receptors 2 and 4 in rheumatoid synovial tissue and regulation by proinflammatory cytokines interleukin-12 and interleukin-18 via interferon-gamma. Arthritis Rheum. 2004;50:3856–3865. doi:10.1002/art.20678
36. Kim HA, Cho ML, Choi HY, et al. The catabolic pathway mediated by Toll-like receptors in human osteoarthritic chondrocytes. Arthritis Rheum. 2006;54:2152–2163. doi:10.1002/art.21951
37. Aigner T, Zien A, Hanisch D, Zimmer R. Gene expression in chondrocytes assessed with use of microarrays. J Bone Joint Surg Am. 2003;85-A(Suppl 2):117–123. doi:10.2106/00004623-200300002-00016
38. Bau B, Gebhard PM, Haag J, Knorr T, Bartnik E, Aigner T. Relative messenger RNA expression profiling of collagenases and aggrecanases in human articular chondrocytes in vivo and in vitro. Arthritis Rheum. 2002;46:2648–2657. doi:10.1002/art.10531
39. Neuhold LA, Killar L, Zhao W, et al. Postnatal expression in hyaline cartilage of constitutively active human collagenase-3 (MMP-13) induces osteoarthritis in mice. J Clin Invest. 2001;107:35–44. doi:10.1172/JCI10564
40. Xu G, Ye Y, Ni J, et al. Toll-like receptor 4 affects the expression of matrix metalloproteinase 13 in human chondrocytes. Int J Clin Exp Pathol. 2017;10(2):1683–1689.
41. Chen YJ, Sheu ML, Tsai KS, Yang RS, Liu SH. Advanced glycation end products induce peroxisome proliferator-activated receptor gamma down-regulation-related inflammatory signals in human chondrocytes via Toll-like receptor-4 and receptor for advanced glycation end products. PLoS One. 2013;8:e66611. doi:10.1371/journal.pone.0066611
42. Geurts J, van Den Brand BT, Wolf A, et al. Toll-like receptor 4 signalling is specifically TGF-beta-activated kinase 1 independent in synovial fibroblasts. Rheumatology (Oxford). 2011;50:1216–1225. doi:10.1093/rheumatology/ker021
43. Sohn DH, Sokolove J, Sharpe O, et al. Plasma proteins present in osteoarthritic synovial fluid can stimulate cytokine production via Toll-like receptor 4. Arthritis Res Ther. 2012;14:R7. doi:10.1186/ar3555
44. Stewart CR, Stuart LM, Wilkinson K, et al. CD36 ligands promote sterile inflammation through assembly of a Toll-like receptor 4 and 6 heterodimer. Nat Immunol. 2010;11:155–161. doi:10.1038/ni.1836
45. Bacchus RA, Bell JL, Madkour M, Kilshaw B. The prevalence of diabetes mellitus in male Saudi Arabs. Diabetologia. 1982;23:330–332.
46. Fatani HH, Mira SA, El-Zubier AG. Prevalence of diabetes mellitus in rural Saudi Arabia. Diabetes Care. 1987;10:180–183. doi:10.2337/diacare.10.2.180
47. Hedley AA, Ogden CL, Johnson CL, Carroll MD, Curtin LR, Flegal KM. Prevalence of overweight and obesity among US children, adolescents, and adults, 1999-2002. JAMA. 2004;291:2847–2850. doi:10.1001/jama.291.23.2847
 © 2019 The Author(s). This work is published and licensed by Dove Medical Press Limited. The full terms of this license are available at https://www.dovepress.com/terms.php and incorporate the Creative Commons Attribution - Non Commercial (unported, v3.0) License.
By accessing the work you hereby accept the Terms. Non-commercial uses of the work are permitted without any further permission from Dove Medical Press Limited, provided the work is properly attributed. For permission for commercial use of this work, please see paragraphs 4.2 and 5 of our Terms.
© 2019 The Author(s). This work is published and licensed by Dove Medical Press Limited. The full terms of this license are available at https://www.dovepress.com/terms.php and incorporate the Creative Commons Attribution - Non Commercial (unported, v3.0) License.
By accessing the work you hereby accept the Terms. Non-commercial uses of the work are permitted without any further permission from Dove Medical Press Limited, provided the work is properly attributed. For permission for commercial use of this work, please see paragraphs 4.2 and 5 of our Terms.