")
Back to Journals » International Journal of Nanomedicine » Volume 13
Origanum vulgare mediated green synthesis of biocompatible gold nanoparticles simultaneously possessing plasmonic, antioxidant and antimicrobial properties
Authors Benedec D, Oniga I, Cuibus F, Sevastre B, Stiufiuc G, Duma M, Hanganu D, Iacovita C , Stiufiuc R , Lucaciu CM
Received 27 August 2017
Accepted for publication 5 December 2017
Published 20 February 2018 Volume 2018:13 Pages 1041—1058
DOI https://doi.org/10.2147/IJN.S149819
Checked for plagiarism Yes
Review by Single anonymous peer review
Peer reviewer comments 3
Editor who approved publication: Dr Thomas Webster
Daniela Benedec,1,* Ilioara Oniga,1,* Flavia Cuibus,1 Bogdan Sevastre,2 Gabriela Stiufiuc,3 Mihaela Duma,4 Daniela Hanganu,1 Cristian Iacovita,1 Rares Stiufiuc,1,5 Constantin Mihai Lucaciu1
1Faculty of Pharmacy, “Iuliu Haţieganu” University of Medicine and Pharmacy, 2Faculty of Veterinary Medicine, University of Agricultural Sciences and Veterinary Medicine, 3Faculty of Physics, “Babeş Bolyai” University, 4State Veterinary Laboratory for Animal Health and Safety, 5Department of Bionanoscopy, MedFuture Research Center for Advance Medicine, “Iuliu Haţieganu” University of Medicine and Pharmacy, Cluj-Napoca, Romania
*These authors contributed equally to this work
Purpose: The leaves and flowering stem of Origanum vulgare contain essential oils, flavonoids, phenolic acids and anthocyanins. We propose a new, simple, one-pot, O. vulgare extract (OVE) mediated green synthesis method of biocompatible gold nanoparticles (AuNPs) possessing improved antioxidant, antimicrobial and plasmonic properties.
Materials and methods: Different concentrations of OVEs were used to reduce gold ions and to synthetize biocompatible spherical AuNPs. Their morphology and physical properties have been investigated by means of transmission electron microscopy, ultraviolet–visible absorption spectroscopy, photon correlation spectroscopy and Fourier transform infrared spectroscopy, whereas their plasmonic properties have been tested using surface-enhanced Raman spectroscopy (SERS). The antioxidant properties of nanoparticles (NPs) have been evaluated by 2,2-diphenyl-1-picrylhydrazyl radical scavenging assay, and the antimicrobial tests were performed using the disk diffusion assay. Their cytotoxicity has been assessed by means of 3-(4,5-dimethylthiazol-2-yl)-2,5-diphenyltetrazolium bromide assay.
Results: The experimental results confirmed the successful synthesis of biocompatible, spherical, plasmonic NPs having a mean diameter of ~40 nm and an outstanding aqueous stability. This new class of NPs exhibits a very good antioxidant activity and presents interesting inhibitory effects against Staphylococcus aureus and Candida albicans. Due to their plasmonic properties, AuNPs are used as SERS substrates for the detection of a test molecule (methylene blue) up to a concentration of 10-7 M and a pharmaceutical compound (propranolol) in solution. Cytotoxicity assays revealed that AuNPs are better tolerated by normal human dermal fibroblast cells, while the melanoma cancer cells are more sensitive.
Conclusion: The biocompatible AuNPs synthetized using OVEs showed significant bactericidal and antimycotic activities, the most sensitive microorganisms being S. aureus and C. albicans, both commonly involved in various dermatological infections. Moreover, the significant antioxidant effect might recommend their use for protective and/or preventive effect in various skin inflammatory conditions, including the reduction in side effects in dermatological infections. Meanwhile, the as-synthesized biocompatible AuNPs can be successfully used as SERS substrates for the detection of pharmaceutical compounds in aqueous solutions.
Keywords: green nanoparticles’ synthesis, toxicity, antioxidant activity, Staphylococcus aureus, Candida albicans, SERS
Introduction
In the last few decades, we witnessed a tremendous interest in the science of nanoparticles (NPs) due to the strong dependence of their electric, magnetic, optical and mechanical properties on their size and shape. The tunability of these properties made them ideal candidates for applications in many different fields such as electronics, engineering, catalysis, biology and medicine. As a result, metallic nanoparticles (MNPs) have already been used in biomedical applications for sensing, imaging and therapy, including cancer diagnosis,1,2 delivery of antitumor agents3–8 and photothermal and photodynamic therapies.3
Among the different classes of MNPs that have been tested so far, gold nanoparticles (AuNPs) possess several advantages over their competitors: facile synthesis and surface functionalization, ease of characterization and apparent low cytotoxicity. Currently, AuNPs are used in clinical practice to treat rheumatoid arthritis, while radioactive gold microparticles are successfully used in radioisotope cancer therapy.9,10 Recent studies also reported the use of AuNPs in various imaging, biomolecular sensing, photothermal therapy and targeted drug delivery methods.11–14
On the other hand, the presence of a surface plasmon resonance (SPR) band, leading to a strong amplification of the incident electromagnetic field in the close proximity of AuNPs’ surface, made them ideal candidates for surface-enhanced Raman spectroscopy (SERS) applications. This vibrational technique is gaining more and more attention in the field of nanomedicine since it is able to provide molecular-specific structural information with a high degree of sensitivity and specificity by performing rapid and nondestructive measurements on different biological samples (tissues, biofluids, cells).
In a typical synthesis procedure, AuNPs are obtained through chemical reduction of a gold precursor (chloroauric acid) by a chemical agent such as hydrazine, sodium borohydride, sodium citrate and other chemical compounds. Very often this reduction process is performed in the presence of a capping agent, stabilizer or surfactant (ie, cetyltrimethylammonium halides), capable to physisorb onto the surface of NPs and to stabilize them in solution by means of electrostatic and/or steric repulsions. From the point of view of medical applications, the major disadvantage of these methods is represented by the toxicity of the chemical species implied in the synthesis, the very vast majority of them being very toxic even at submicromolar doses.15
Over the last decade, a tremendous effort has been made toward the development of new, nontoxic and low-cost synthesis methods of AuNPs, which could be used in biomedical applications, based on green chemistry and biological approaches. A green chemistry approach for the synthesis of NPs has several advantages over conventional chemical methods, as it is a simple, fast, single-step, environmentally safe and inexpensive method. Moreover, in many cases, the natural plant extracts have been proved to have a dual role, acting in the first instance as reducing and capping agents and then modulating the biological effects of NPs in a synergistic manner.16–18 Some medicinal plants (Aloe vera, Mentha piperita, Ananas comosus, Senna siamea, Azadirachta indica, Medicago sativa, Pelargonium graveolens) have already been used for the synthesis of spherical or anisotropic AuNPs,19–25 but still a large number of medicinal plant extracts have not been tested so far.
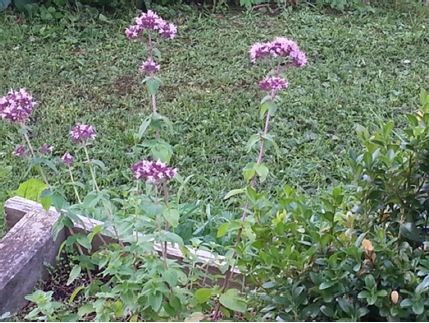
Origanum vulgare (oregano) is an herbaceous, perennial and very tough plant, with pinnate leaves and purple flowers, belonging to the Lamiaceae family.26 It is native to warm temperate western and southwestern Eurasia and Mediterranean regions. It has been widely used in the agricultural, pharmaceutical and cosmetic industries as a culinary herb, as flavoring substance in food products and in alcoholic beverages and perfumery, mainly due to its spicy fragrance.27,28 The leaves and flowering stems contain essential oils (carvacrol, thymol, p-cymene, etc.), flavonoids (apigenin, luteolin, salvigenin, cirsimaritin, diosmetin), phenolic acids (rosmarinic and caffeic acids), anthocyanins, etc.29 Oregano is widely known as possessing therapeutic properties (diaphoretic, carminative, antispasmodic, antiseptic, tonic), being used in the traditional medicine systems of many countries for the treatment of digestive, respiratory and urinary tract disorders, indigestion, dental caries and rheumatoid arthritis.26 Several previous studies concerning the antimicrobial, antiviral, antioxidant, antimutagenic, antihyperglycemic, and anti-inflammatory effects of O. vulgare have been reported in the literature.27,30–33
The aqueous leaf extract of O. vulgare has been used for the green synthesis of silver NPs. The as-synthesized silver NPs showed antimicrobial and cytotoxic activities.29 However, to the best of our knowledge, in the scientific literature, there are no studies reporting the capacity of O. vulgare to act as a reducing agent for Au3+ and to generate AuNPs in a very rapid and simple synthesis procedure.
The aim of the present paper was to develop an original method for the synthesis of biocompatible AuNPs using aqueous extracts of the O. vulgare aerial parts and/or leaves collected from Romanian spontaneous flora. Once synthesized, the AuNPs have been thoroughly characterized using different complementary techniques. Their physicochemical properties (size, shape, plasmonic properties) have been evaluated together with their biological ones (antioxidant, antimicrobial and cytotoxic capacities) for a proper assessment of their potential applicability in nanomedicine.
Materials and methods
Chemicals
All chemicals used in this study were of analytical grade. Ethanol, Folin–Ciocalteu reagent (EMD Millipore, Billerica, MA, USA), sodium carbonate, tetrachloroauric acid (III) trihydrate (HAuCl4·3H2O), gallic acid, methylene blue (MB), propranolol (PRNL) hydrochloride (Sigma-Aldrich Co., St Louis, MO, USA), 2,2-diphenyl-1-picrylhydrazyl (DPPH) and ascorbic acid (Alfa-Aesar, Karlsruhe, Germany) were used without further purification. For the assessment of antimicrobial potential, the following microorganism strains were purchased from Microbiologics® (St Cloud, MN, USA): Staphylococcus aureus ATCC 49444, Listeria monocytogenes ATCC 13076, Escherichia coli ATCC 25922, Salmonella typhimurium ATCC 14028 and one fungal strain, Candida albicans ATCC 10231. For the antiproliferative effect and cell cytotoxicity assay, normal human dermal fibroblast, adult (HDFa; Thermo Fisher Scientific, Waltham, MA, USA) cell line, human radial growth phase melanoma cell line (WM35; American Type Culture Collection [ATCC], Manassas, VA, USA), fetal calf serum (FCS; HyClone), non-essential amino acids (NEAA; Sigma-Aldrich Co.), gentamicin and amphotericin (Biochrom AG, Berlin, Germany), Dulbecco’s Modified Eagle’s Medium/F12 (DMEM/F12; Sigma-Aldrich Co.), dimethyl sulfoxide (DMSO) and 3-(4,5-dimethylthiazol-2-yl)-2,5-diphenyltetrazolium bromide (MTT; Sigma-Aldrich Co.) have been used. Double distilled water (18.2 MΩ·cm; Barnstead EasyPure RoDi) was used as a solvent.
Characterization
The ultraviolet (UV)–visible (Vis) absorption spectra of colloidal solutions were recorded by a T92+ UV–Vis spectrophotometer (PG Instruments, Leicestershire, UK) using standard 1 cm quartz cells at room temperature. The measurements have been performed in the 400–900 nm spectral range with a spectral resolution of 2 nm.
Transmission electron microscopy (TEM) images of the NPs were acquired on a Hitachi HT7700 (Hitachi Ltd., Tokyo, Japan) electron microscope equipped with an 8-megapixel CCD camera operating at 120 kV in the high contrast mode. For TEM examination, a 5 μL drop of NP suspension was deposited on carbon-coated copper grids. After 2 minutes, the excess liquid was removed by filter paper and the sample was left to dry under ambient air.
Photon correlation spectroscopy (PCS) and zeta potential measurements were performed on Zetasizer Nano ZS90 (Malvern Instruments, Malvern, UK) working in a 90° configuration. Three cycles of 10 measurements of 5 s each were performed for each sample.
The Fourier transform infrared (FTIR) spectra were recorded with a TENSOR II instrument (Bruker Optics Inc., Billerica, MA, USA) in attenuated total reflectance mode using the platinum attenuated total reflectance (ATR) accessory with a single reflection diamond ATR in the 400–4,000 cm−1 spectral range with a resolution of 4 cm−1. Dry plant materials or dry colloid samples were placed in direct contact with the diamond crystal, and an average spectrum of 16 scans was recorded for each sample. The colloids were centrifuged for 10 minutes (10,000× g), and the supernatant was discarded before placing the pellet on the diamond crystal and allowing it to dry.
Surface-enhanced Raman (SER) spectra were recorded on DeltaNu Advantage Raman Spectrometer (DeltaNu, Laramie, WY, USA) using a 785 nm excitation wavelength, working in a backscattering geometry, with a laser power of 60 mW and a spectral resolution of 5 cm−1. All measurements were performed in 1 mL glass vials filled with 540 μL colloid and 60 μL analyte. For each spectrum, a minimum of four accumulations having each an exposure time of 20 s have been performed. The final spectrum was obtained by averaging all recorded spectra.
Plant material and extraction procedure (O. vulgare extract [OVE])
The aerial parts (Origanum herba [OH]) or leaves (Origanum folium [OF]) of O. vulgare (Voucher No 793) were harvested from the spontaneous flora (Valea Ariesului region, Romania) in the blossom period (Figure S1). A voucher specimen was deposited in the Faculty of Pharmacy’s Herbarium, Department of Pharmacognosy, Cluj-Napoca, Romania. The plant materials were reduced to a proper degree of refinement. In all, 2 g were weighed and extracted with 20 mL of absolute ethanol (Sigma-Aldrich Co.) on ultrasonic bath (Sonic 3; Polsonic Palczyński Sp. J., Warsaw, Poland) at 60°C and followed by sonication for 30 min. The OVE was filtered through a paper filter in a 20 mL graduated flask, and the resulting residue was washed twice with ethanol in the same flask. The ethanol was further evaporated by drying the resulting extract on a water bath. The dry residue was then dissolved into 20 mL of bi-distilled water and sonicated for 30 min at 60°C. The sample was then cooled down and centrifuged (1,930× g) for 20 min, and the supernatant was recovered.33
Preparation of AuNPs
The AuNPs have been synthesized using an original method, adapted from a previous one developed in our laboratory for the green synthesis of biocompatible gold and silver NPs using polyethylene glycol (PEG) of different chain lengths as both reducing and capping agents.34,35 Briefly, 20 mL of an HAuCl4 (1 mM) stock solution have been heated using a magnetic heating plate. When the solution’s temperature reached 85°C, different volumes (between 0.25 and 2 mL) of plant extract solutions (either OH or OF) were rapidly added to the heated solution containing Au3+ ions. After 60 s of stirring, the colloidal solution changed its color from pale yellow to ruby red, indicating the successful synthesis of AuNPs. The pH values, measured right after the synthesis, were in the 2.5–3.2 range, and the maximum UV–Vis absorption peaks were located between 522 and 546 nm.
Determination of total phenolic content
The total phenolic content (TPC) was calculated using a modified colorimetric method previously described by Singleton et al.36 The method involves the reduction of Folin–Ciocalteu reagent by phenolic compounds, with a concomitant formation of a blue complex.37–39 The method has been applied for the determination of TPC for both pure OVEs and colloidal AuNPs synthesized using OVE as reducing and capping agents. Briefly, 2 mL of the tested solution was added to 1 mL of Folin–Ciocalteu reagent and the mixture was supplemented with 10 mL of distilled water. A sodium carbonate solution (290 g/L) was added up to a final volume of 25 mL. The samples were incubated in the dark for 30 min, and the absorbance values at 760 nm were measured. Meanwhile, standard experimental curves were obtained using different concentrations of gallic acid as a standard probe (Figure S2). The TPC values were determined using the calibration curve of gallic acid graph (R2=0.999). The TPC was expressed as gallic acid equivalent (GAE) in milligrams/dry material plant in the sample in grams.
Radical scavenging activity using DPPH method
Free radical scavenging activity of OVE and gold colloids synthesized using OVE was determined by the DPPH assay. Ascorbic acid was chosen as a reference antioxidant. A volume of 1 mL of DPPH solution in ethanol (0.1 g/L) was separately mixed with 1 mL of O. vulgare diluted extract (69 times) and 1 mL of the AuNP solution. After 30 min of incubation at room temperature, the decrease in the absorbance was measured at 517 nm. The percentage of scavenging ability of the extracts and colloids was calculated as:
|
|
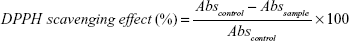
where Abscontrol is the absorbance of DPPH radical + ethanol (containing all reagents except the sample) and Abssample is the absorbance of DPPH radical + sample extract. The control solution was prepared by mixing 1 mL of ethanol with 1 mL of DPPH radical solution. A very low absorbance value can be correlated with a high DPPH scavenging activity.40–42
Determination of antimicrobial activity
The disk diffusion assay was used to determine the comparative antimicrobial activity of plant extracts and AuNP solutions against a panel of microorganisms, including two Gram-positive bacteria (S. aureus ATCC 6538P and L. monocytogenes ATCC 13932), two Gram-negative bacteria (Salmonella enteritidis ATCC 13076 and E. coli ATCC 25922) and one fungus (C. albicans ATCC 10231). After the hydration of the lyophilized strain, the sterile tampon was impregnated with the hydrated material and transferred on the selective medium specific for each strain (eg, Salmonella: Rambach agar, xylose lysine deoxycholate agar; E. coli: tryptone bile x-glucuronide agar). The tampon was rotated with pressure, and a circular area was inoculated on the agar media. Using a sterile loop, streaks were repeatedly made in the inoculated area and on the rest of the plate. Immediately afterwards, the inoculated culture mediums were incubated at corresponding temperatures (eg, Salmonella 37°C; E. coli 44°C). A 0.5 McFarland suspension was obtained from the pure ATCC reference culture of 24 h (corresponding to 108 colony-forming unit [CFU]/mL). The Müller–Hinton agar plates were inoculated by inundation. The plates were dried in a thermostat for 20 min (this time interval was not exceeded because the bacteria might reach a multiplication phase). The sterile disks were soaked in 60 μL of the tested solutions (10% OH extract or AuNPs synthesized using 1 mL of OH extract). Disks embedded in double distilled water were used as negative controls. The plates were incubated overnight at 37°C, and the results were recorded by measuring the diameter of the inhibition zone (DIZ) in millimeters.43–46
Toxicity assay
Cell culture
The assessment of antiproliferative effect was performed on both normal HDFa cells and a human radial growth phase melanoma cell line (WM35). The cell lines originate from the cell collection of Oncological Institute “Prof Dr Ion Chiricuţă” Cluj-Napoca, being a generous gift of Dr Olga Soritau. Fibroblasts cells were cultivated in DMEM/F12 supplemented with 10% FCS, 1% NEEA, 1% antibiotic/antimycotic (Thermo Fisher Scientific) and 2 mM glutamine (Thermo Fisher Scientific). MW35 cells were maintained in the Roswell Park Memorial Institute (RPMI) medium (Sigma-Aldrich Co.) supplemented with 10% FCS, 1% antibiotic/antimycotic and 2 mM glutamine.47
Cytotoxicity assay
Cytotoxicity assay was performed using the standard MTT approach, following the procedure specified by the manufacturer. The MTT assay consisted of the conversion of water soluble MTT to the insoluble formazan, which was further solubilized with 200 μL DMSO. Its final concentration was determined by reading the absorbance at 550 nm, using an enzyme-linked immunosorbent assay (ELISA) microplate reader. The cells were seeded at a density of 105 cells/well in ELISA 96-well microtitration flat bottom plates and allowed to accommodate for 24 h in normal growth conditions. The cultures were then exposed to different concentrations of as-synthesized AuNPs and pure OVEs (0.25, 0.5, 1.0, 2.0 and 4.0 μg/mL) for 24 h. Each experiment was carried out in triplicate. Cell cultures treated only with medium were used as control. After 24 h, the treated cells and their control counterparts were incubated for 2 h with 200 μL of MTT.
Statistical analysis
All data are reported as the mean value ± standard error of the mean (SEM). A minimum of three replicates were performed for each experiment. The Gaussian distribution was checked by the Shapiro–Wilk normality test. Statistical analysis was performed using the two-way analysis of variance (ANOVA), and Bonferroni posttest was used as a post hoc analysis. p-values <0.05 were considered as significant. Statistical values and figures were obtained using either GraphPad Prism version 5.0 for Windows (GraphPad Software, Inc., La Jolla, CA, USA) or OriginPro 2016 (OriginLab Corporation, Northampton, MA, USA).
Results and discussions
Synthesis and characterization of gold NPs
The addition of different volumes of the two types of OVEs (OH or OF) to the heated gold precursor solutions induced their color change from pale yellow to red. This strong color shift, which can be attributed to the excitation of SPR vibration, represented the first evidence of formation of AuNPs. All reactions completed within a few minutes. The UV–Vis spectra of the colloids, recorded after the solutions cooled down to room temperature, are presented in Figure 1 together with the optical images of the colloids synthesized using the two types of plant extracts.
 | Figure 1 UV–Vis absorption spectra of different colloidal solutions. |
In the case of OH extract (Figure 1A), the smallest volume necessary for the synthesis of gold colloid was 0.25 mL. By increasing the extract volume up to 1 mL, an increase in the overall absorbance values and a blue shift of the maximum of absorption have been observed. Starting from 1 mL plant extract, a second plasmonic peak – located in the near infrared (NIR) region – can be detected. Its presence indicates the existence of either larger or anisotropic nanostructures. A further increase in the added extract volume (1.5 and 2 mL) led to a decrease in the main plasmonic peak absorbance values together with a redshift of their wavelengths. An increase in the absorbance values of the second peak from the NIR region and a blue shift of the maximum absorbance wavelengths have also been noticed.
It is important to note that as we increased the amount of extract used in the synthesis, the absorbance at 400 nm (A400) monotonically increased up to a maximum value of 1.3 (obtained for 1 mL extract). This value remained constant even if the volume of the plant extract was further increased up to 2 mL. Very recently, Scarabelli et al48 have shown that the A400 value can accurately predict the gold ions’ reduction yield (or the amount of gold in atomic state), regardless of the shape and size of the synthesized NPs. Based on inductively coupled plasma-mass spectrometry measurements, they have shown that an A400 value of 1.2 corresponds to a concentration of gold atoms [Au0] of 0.5 mM. In our study, the increase in the extract volume led to an increase in A400 value, indicating a larger reduction yield. The maximum absorbance was reached for 1 mL OH extract, the absorbance values being in good correlation with the literature. A further increase in the extract volume could not increase the A400 value since the gold precursor was completely reduced.
A similar behavior has been observed for OF extracts (Figure 1B). In this case, only three volumes of plant extracts have been tested (0.5, 1 and 1.5 mL). The maximum absorption peak has been obtained again for a volume of 1 mL extract, and the A400 values were very close to those observed for OH extracts. However, in this case, the surface plasmonic peaks were located at higher wavelengths (556 nm for 0.5 mL, 546 nm for 1 mL and 536 nm for 1.5 mL extract volumes), indicating the synthesis of larger particles with respect to those synthesized using OH extracts. No absorption peaks have been detected in the NIR region, suggesting that the vast majority of the NPs have a spherical shape. TEM images of the colloids synthesized using the two types of plant extracts are presented in Figure 2. The ability of OVEs to reduce the gold ions and to promote their self-organization into NPs can be explained if one considers their rich content in polyphenols.28 Polyphenols are efficient ligands for metal ions through multiple hydroxyl groups they possess. They form stable chelating rings able to reduce Au3+ ions to Au0. Recent computational studies have showed that polyphenolic molecules are physically attached onto the surface of AuNPs.49 The process is mediated by the binding of O atoms, belonging to polyphenol molecules, to the surface of AuNPs through an electron transfer process.49 Thus, we supposed that all plant extracts used in this study are able to not only reduce gold ions but also act as very efficient capping agents, stabilizing the NPs by means of electrostatic and/or steric repulsion.
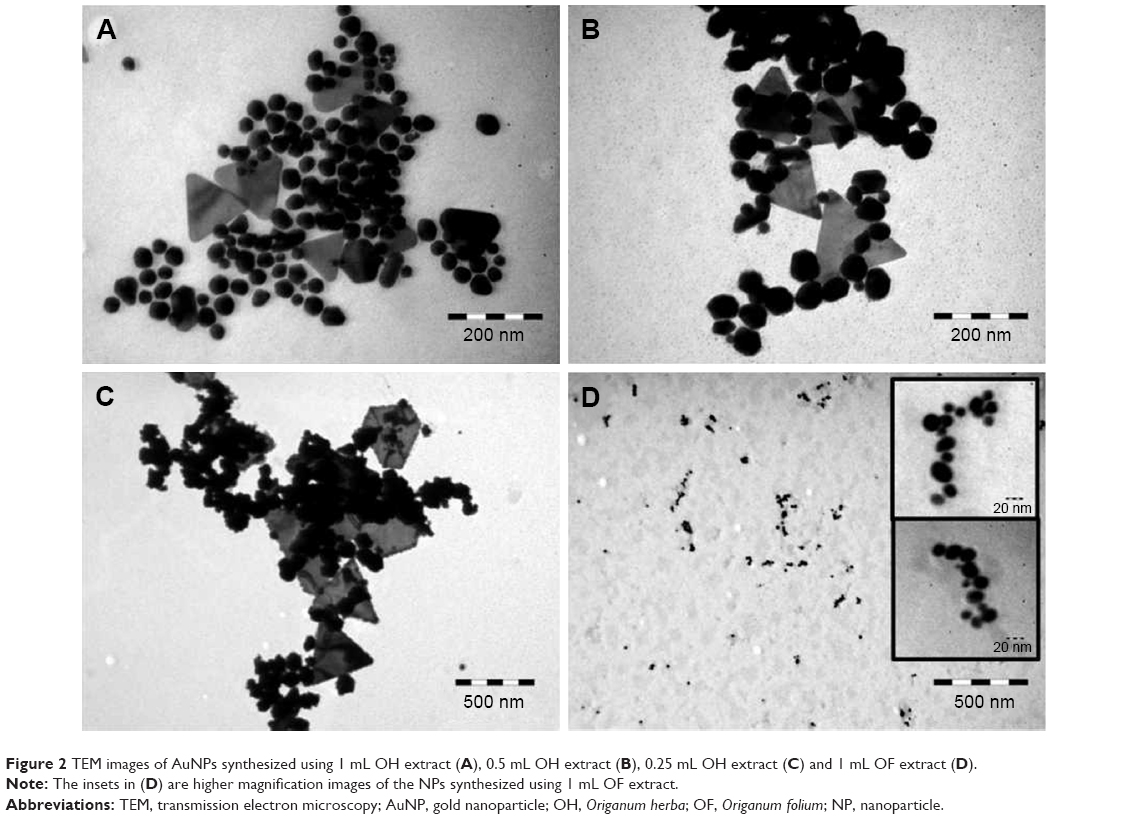 | Figure 2 TEM images of AuNPs synthesized using 1 mL OH extract (A), 0.5 mL OH extract (B), 0.25 mL OH extract (C) and 1 mL OF extract (D). |
As a common feature, for all colloids synthesized using OH extracts (Figure 2A–C), one can notice that, apart from the predominant spherically shaped NPs, a few triangular nanoplates are also present. The green synthesis of similar triangular gold nanoplates was reported for lemongrass (Cymbopogon flexuosus) plant extracts.50 It was shown that the water-soluble fraction of the lemongrass extract is implicated in the formation of triangular gold nanoplates and the polar fraction of the extract, containing mainly ketones, aldehydes and carboxylic acids, is very efficient for producing triangular gold structures.50 Another study has shown that gold nanoplates can be synthesized in the presence of acetone.51 Given the fact that our extraction procedure implies only polar solvents, we believe that our OH extracts could also contain the abovementioned molecular species. This could explain the presence of triangular nanoplates in the TEM images and the existence of the absorbance peak in the NIR region only in the case of NPs synthesized using OH extracts. For the NPs synthesized using OF extracts, only spherical or ellipsoidal NPs were detected (Figure 2D). The differences between the two types of extracts might presumably be due to the difference in their composition. The flowering stem of O. vulgare is very rich in volatile oils (carvacrol, thymol) containing ketone groups, and this could be the explanation for the presence of triangular structures in the colloids synthesized using OH extracts.28,50 On the other hand, for the NPs synthesized using OH extracts, their shape and size are strongly dependent on the used extract volumes. For 0.25 mL of extract, triangular nanoplates with large edges (~400–500 nm) are formed, together with aggregates constituted by smaller NPs with irregular shapes (Figure 2C). By increasing the volume to 0.5 mL, well-defined spherical and faceted NPs together with smaller (100–200 nm edge) triangular nanoplates were observed (Figure 2B). By continuing to increase the OH extract volume at 1 mL, the overall size decreased (Figure 2A), but again both spherical and triangular nanoplates were detected. The mean sizes and the standard deviations of NPs, obtained from TEM and PCS data, are presented in Table 1. The size distribution (obtained from TEM images) of AuNPs synthesized using 1 mL of OH extract is presented in Figure 3. Large-scale TEM images, size histograms and a scattering distribution of PCS light intensity are presented in Figures S3–S5, respectively. The size distributions are qualitatively in agreement with the data obtained from UV–Vis absorption spectra. The lowest wavelength of the maximum absorption peak corresponds to AuNPs synthesized using 1 mL of OH extract. The increase in the mean size of NPs was qualitatively correlated with a red shift in the SPR peak. However, the maximum absorption peak wavelengths do not correlate quantitatively with the theoretical and experimental data proposed for spherical AuNPs.52,53 For example, in the case of AuNPs synthesized with 1 mL OH extract, the maximum plasmonic absorption peak is located at 534 nm. According to a theoretical multipole scattering model proposed by Haiss et al,53 this value corresponds to NPs having a mean diameter of 56 nm. Another theoretical model based on the Mie theory and discrete dipole approximation developed by the group of Jain et al52 indicates a mean size of 52 nm. Given the fact that the maximum absorption peak wavelength is strongly related to the dielectric constant of the medium surrounding the NPs, the shifts in the localized surface plasmon resonance (LSPR) are currently used in biodetection and sensing applications for various molecular species.54 Therefore, we strongly believe that the differences between the theoretical values and the experimental LPSR peaks observed in our study are a direct proof of the fact that the surface of as-synthesized AuNPs is capped with a dense molecular layer.
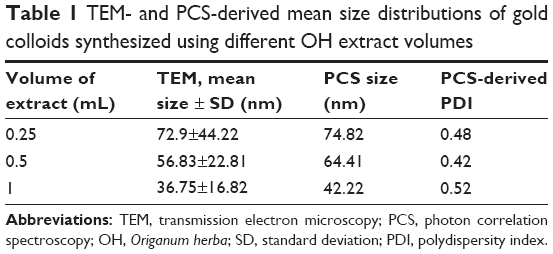 | Table 1 TEM- and PCS-derived mean size distributions of gold colloids synthesized using different OH extract volumes |
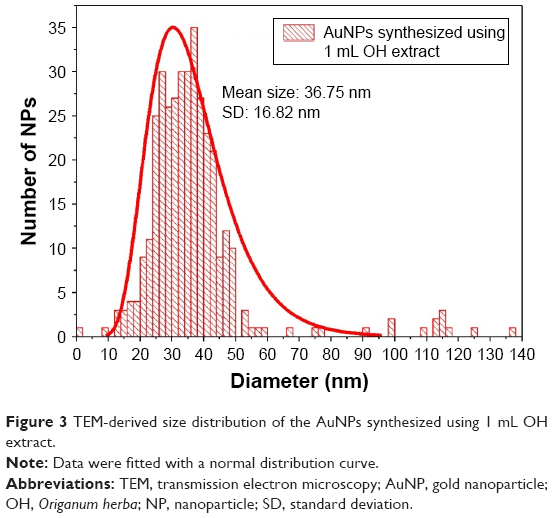 | Figure 3 TEM-derived size distribution of the AuNPs synthesized using 1 mL OH extract. |
The size distributions obtained from PCS measurements are slightly larger as compared with those obtained from TEM measurements. These small differences can be explained if one considers that the diameters obtained from PCS measurements correspond to the so-called hydrodynamic diameters. They include the molecular layer present on the surface of NPs, which cannot be visualized in TEM. The zeta potential measurements revealed that the NPs have a negative potential situated in the −22 to −26 mV domain in acidic conditions, while in basic solutions (pH 11–12), the zeta potential is shifted toward more negative values (−41 to −47 mV). This can explain the incredible colloidal stability for the whole pH domain. By comparing the UV–Vis spectra of the NPs synthesized using 1 mL OH extract (Figure 4), one recorded right after the synthesis and the second one recorded after the colloid has been stored at room temperature for 30 months, no major differences can be detected. Owing to their stability, for the rest of the study, only AuNPs synthesized using 1 mL of OH extract (1 mL OH AuNPs) have been used (unless otherwise stated).
 | Figure 4 UV–Vis absorption spectra of 1 mL OH AuNP solution measured right after the synthesis (black curve) and after 30 months of storage at room temperature (red curve). |
To evidence the molecular layer capping the NPs, FTIR-ATR measurements have been performed, both on dry plant material and dry colloid (Figure 5). The OH and OF extracts present similar ATR-FTIR spectra, characteristic to other plant extracts.55 The two peaks observed in the region of high wavenumbers (2,847 and 2,915 cm−1) are assigned to CH2 stretching vibrations. These peaks are also visible in the spectrum of dry colloids. Both plant extracts show complex spectral features having the main vibrational bands located at 1,038 cm−1 (associated with cellulose and other polysaccharide-rich substances such as hemicelluloses and pectins), 1,471 cm−1 (associated with methylene bending) and ~1,600 cm−1 (associated with the stretching vibration of carboxylate anion −COO−). The biggest difference observed in the spectra of the two plant extracts is the band at 1,730 cm−1. This band, which is very distinctive in spectrum of OH extract, is usually associated with a carbonyl stretching vibration. We strongly believe that this difference is a result of a much larger concentration of aldehydes and ketones in OH extracts, their presence being responsible for the synthesis of triangular AuNPs. The FTIR-ATR spectrum of 1 mL OH AuNPs features mainly the methylene stretching vibrations (2,847 and 2,915 cm−1). Other vibrations are not so well defined, making their assignment much more difficult. The presence of the two vibrational bands is a clear evidence of the existence of an organic layer capping the surface of AuNPs.
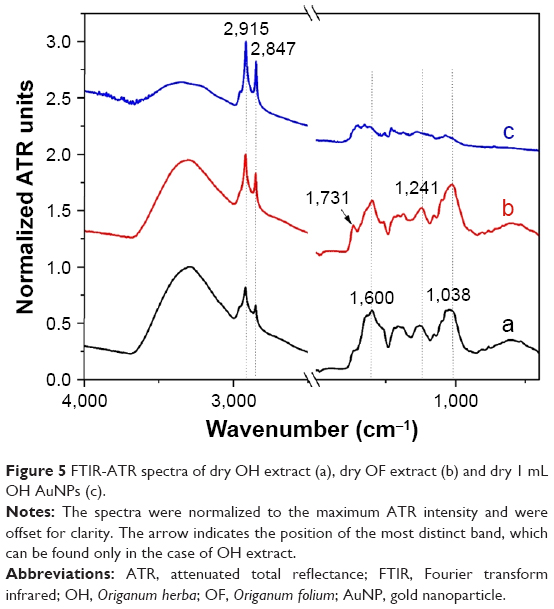 | Figure 5 FTIR-ATR spectra of dry OH extract (a), dry OF extract (b) and dry 1 mL OH AuNPs (c). |
Surface-enhanced Raman spectroscopy
The AuNPs were tested for their performances in enhancing the Raman signal of different analytes. In Figure 6 are presented the SER spectra of MB using as substrates 1 mL OH AuNPs. The SER spectrum of MB was faintly visible right after the analyte was mixed with the colloid. A strong fluorescence background was observed even for an excitation wavelength of 785 nm. After several hours of incubation (Figure 6B), the fluorescence strongly decreased and the intensity of the Raman scattered signal continuously increased. All the characteristic Raman bands of MB (as they are reported in the literature) were clearly visible. The main vibrations correspond to C−C ring stretching (1,620 cm−1), C−N−C skeletal deformation (448 and 502 cm−1) and asymmetric C−N stretching (1,420 cm−1).56 The time-dependent evolution of SER spectra is presumably due to a process of slow replacement of the capping molecules by the analyte. The same type of SER spectrum was obtained right after the addition of analyte by changing the colloidal pH (Figure 6A). It seems that a more basic environment favors the attachment of MB molecules to AuNPs, probably due to a stronger electrostatic interaction between the cationic dye and the anionic NPs. It is also interesting to note that other vibrational bands are strongly enhanced (608, 889, 1,120, 1,328 and 1,350 cm−1) both after a long incubation time or in a basic environment. These vibrational bands, characteristic to MB, were also observed in SERS measurements performed on “classical” citrate-capped AuNPs at pH values >10 (data not shown). These results might suggest a modification of MB’s absorption geometry in the presence of capping agents (slow process) or in basic environments (rapid process).
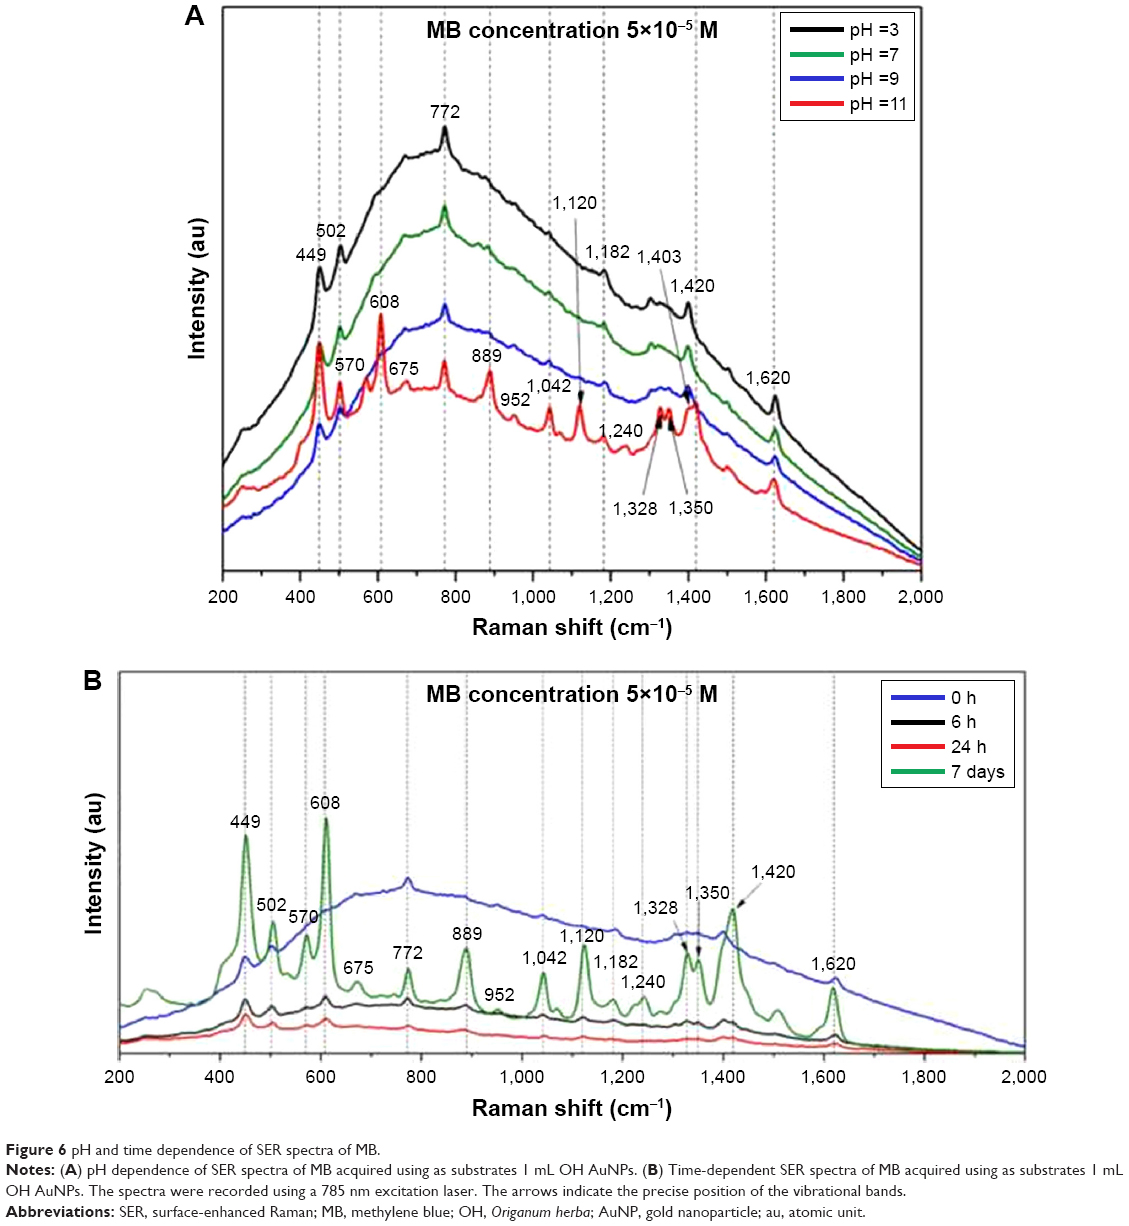 | Figure 6 pH and time dependence of SER spectra of MB. |
The plasmonic properties of 1 mL OH AuNPs were also tested for a well-known beta-blocker pharmaceutical compound: PRNL (Figure 7). A previous study revealed that the SER spectra of beta blockers are dominated by central aromatic ring vibrations.57 PRNL presents high-intensity Raman bands at 1,383 and 737 cm−1 and medium intensity bands at 1,578 and at 1,439 cm−1. All these bands are assigned to different vibrational modes of the naphthyl group.58,59 When using 1 mL OH AuNPs as SERS substrates, one could not record the characteristic spectrum of PRNL by the simple addition of the analyte to colloidal suspension. The result remained the same in basic conditions or upon the addition of different aggregating agents (NaCl, LiCl). This behavior can be explained if one considers that PRNL molecules cannot replace the capping agents present on the surface of AuNPs. For a proper understanding of this phenomena, the approach proposed by Xu et al60 in the case of silver NPs (called iodide NPs modification) has been used in this study. When a monolayer of iodide ions is created on the surface of NPs, the halide ions are able to “clean” the surface, thus increasing the chances of analyte molecules to adhere to the surface of NPs and to be detected by means of SERS. In our case, 0.1 mL of KI solution (1 M) was added to 0.4 mL of 1 mL OH AuNP colloidal solution. After 30 min, the analyte molecule (PRNL) has been added and the characteristic SER spectrum of PRNL could be recorded (Figure 7). Apart from the characteristic Raman bands of PRNL, two other bands (464 and 585 cm−1) have been observed. These bands are present even in the absence of the analyte and are probably due to capping molecules. Their assignment is not straightforward, but it is worth mentioning that Raman bands in this spectral range are associated with various organic combinations of Si, S or I. The evolution of the SER spectra with the increase in colloidal pH is similar to that observed in the case of MB. The best spectrum of PRNL has been measured in basic conditions (pH =10).
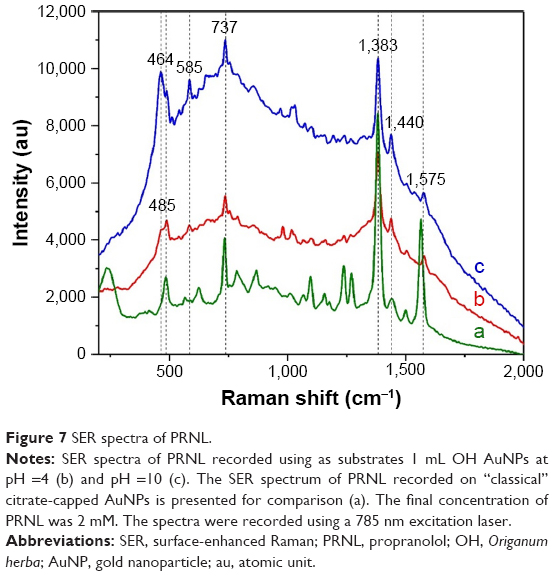 | Figure 7 SER spectra of PRNL. |
For both analytes used in this study, it has been noticed that they can be brought closer to the surface of NPs in basic conditions, probably because at high pH values, the capping molecules can be easily replaced by the analytes.
Polyphenolic content and radical scavenging activity
For the quantification of TPC, the colorimetric Folin–Ciocalteu method, frequently used for TPC quantification in natural products, was used in this study. The TPC values of pure OVEs and 1 mL OH AuNP solutions are presented in Table 2. The TPC of OVEs used in this study has a value of 21.58 mg/g dry weight plant material (DW). The TPC of a product is considered high when its GAE values are in the 12–20 mg/g DW range or higher. Therefore, O. vulgare can be considered as a species very rich in polyphenols.61–64 On the other hand, when we compare the TPC value of the gold colloids with the value of pure extracts, for the same amount of DW, it appears that the TPC of colloids is ~3.5 times smaller. This striking difference might be due to the fact that, at least partially, the polyphenols were “consumed” during the synthesis of gold colloids.
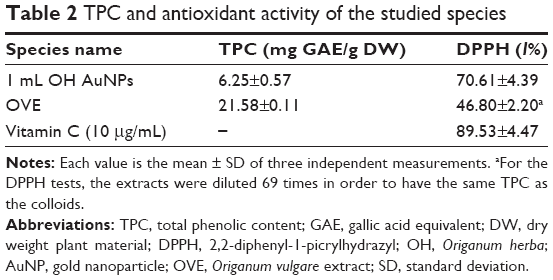 | Table 2 TPC and antioxidant activity of the studied species |
When comparing the TPC values, expressed as milligrams of GAE per milliliter of sample, the difference is even larger. The extract of O. vulgare contains 69 times more polyphenols (2,158 μg/mL) than the NPs’ suspension (31.27 μg/mL). Therefore, for a proper evaluation of the DPPH scavenging ability of the colloids with respect to pure extracts, the latter was 69 times diluted. After this dilution, the extract contained the same quantity of polyphenols as the colloidal solution. The antioxidant assay pointed out that NPs’ suspension showed a higher antioxidant activity (70.61%) than the diluted extract (46.80%). Although in most plant extracts there is a positive correlation between the TPC and their antioxidant activity, some reports showed that in several plant species, there is an equivocal relationship between the TPC and the antioxidant activity.63 These differences might be explained on one hand by the fact that Folin–Ciocalteu assay gives only a crude estimate of the TPC and on the other hand that the TPC does not necessarily incorporate all the antioxidants that may be present in an extract. In such conditions, diluting the extracts 69 times can lead to a significant decrease in nonphenolic compounds possessing significant antioxidant activity.
Cytotoxicity assessment
AuNPs might have a multitude of medical applications, but their clinical use is still limited by their cytotoxicity. One of the major goals of this study was to synthesize NPs active against fungi and bacteria that are well tolerated by the skin. To determine if the as-synthesized 1 mL OH AuNPs are appropriate for medical use, cell viability tests were performed on both normal human dermal fibroblast (HDF) and radial growth phase melanoma (WM35) cells. The HDF cells resembled the cutaneous and mucosal route of NPs’ application, while WM35 cells could shed light on their potential anticancer effect. Several assays are commonly used for evaluating the impact of cells exposure to NPs. In this study, we have used the MTT assay, which is considered as the “gold standard” for cytotoxicity evaluation. It is considered to be more relevant as compared with other methods measuring cell membrane integrity (lactate dehydrogenase assay and fluorescent dye-based assays).65 To exclude the effects of different TPCs, the solutions of NPs were compared with 69 times diluted pure plant extracts.
The results presented in Figure 8 indicate that 1 mL OH AuNPs presents a low toxicity level for both cell lines, for an exposure time of 24 hours. In HDF cells, no toxicity was noticed up to a concentration of 2.0 μg/mL, while the exposure to the highest concentration (4.0 μg/mL) induced a small inhibition (Figure 8A). Similar results were observed in the case of WM35 cells, but this cell line seems to be more sensitive to AuNPs’ exposure. The inhibitory effect was noticeable starting from 2.0 μg/mL (Figure 8B) and was dose dependent. The IC50 values were calculated from dose–response curves using nonlinear regression. Their values (at 24 h) were 15.9±9.2 μg/mL for HDF cells and 6.5±3.8 μg/mL for WM35 cells. This is a further proof of a higher sensibility of WM35 cells upon exposure to AuNPs with respect to HDF cells.
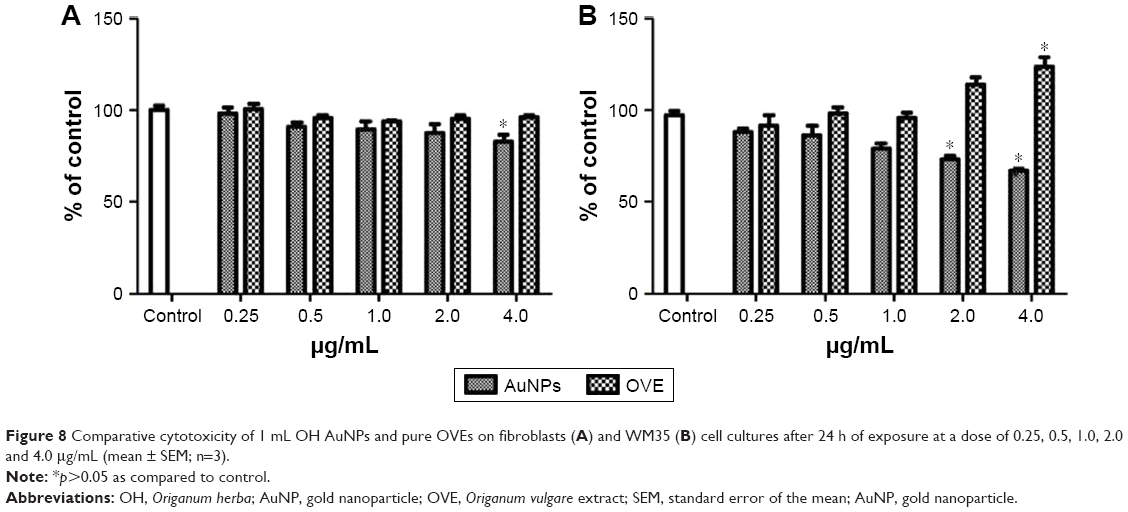 | Figure 8 Comparative cytotoxicity of 1 mL OH AuNPs and pure OVEs on fibroblasts (A) and WM35 (B) cell cultures after 24 h of exposure at a dose of 0.25, 0.5, 1.0, 2.0 and 4.0 μg/mL (mean ± SEM; n=3). |
On the other hand, the extracts of O. vulgare did not interfere with the proliferation of fibroblastic cells, and at the highest administered doses, they seem to have even a stimulative effect on melanoma cells (Figure 8B).
Cytotoxicity of AuNPs is a topic of paramount interest from the point of view of their potential biotechnological applications, but currently it is still a matter of controversy. A large number of experiments (performed in vitro and/or in vivo) have confirmed their nontoxicity, while others concluded that AuNPs could be toxic.66 Multiple factors such as size, shape, surface coating, surface charge, dose and exposure influence the reported toxicological data.67 Although the in vivo data are obviously more relevant, many studies reported in the literature were performed in vitro. These studies are simpler to perform and can provide the basis for understanding the mechanisms responsible for toxicity of NPs in vivo. Our results showing that AuNPs manifest their toxic effect at concentrations as low as 4 μg/mL are in agreement with other reports and can be explained by the size of NPs. It has been shown that the optimal size for uptake of NPs by cells is ~50 nm.67 The explanation of this optimal size was based on the so-called wrapping effect. This theoretical model, describing how a cellular membrane encloses NPs, states that NPs with 27–30 nm diameter have the fastest wrapping time and the fastest receptor-mediated endocytosis. As a consequence, they are the most cytotoxic.68 On the other hand, several polyphenols have shown remarkable cancer-preventive and/or cancer-therapeutic effects, which are likely due to their ability to induce apoptosis in cancer cells without affecting normal cells. The same behavior was recently demonstrated for epigallocatechin-3-gallate-capped AuNPs.70 In our study, the OVEs, which are very rich in polyphenols, seem to have a proliferative effect on melanoma cells, while the AuNPs synthesized with the same extract possess a cytotoxic effect on the same cell line. These results, which are apparently contradictory, might be explained by the effect of AuNPs on biomolecules. Very recently, it has been demonstrated that citrate-capped AuNPs are able to reprogram pancreatic tumor environment and inhibit tumor growth.71 It has been speculated that bare AuNPs of ~20 nm have an optimum size to maximize the density of the biomolecules bound on their surfaces, changing their configuration and by this mechanism altering the communication between normal and cancer cells and thus leading to tumor growth inhibition.72 HDF primary cell culture is derived from adult skin being cryopreserved at the end of the primary culture, while WM35 is an immortal cell line raised from a radial growth phase of melanoma. Despite the fact that melanoma tumors are notoriously refractory to therapy, the melanoma cell lines are particularly sensitive to genotoxic stress. For instance, UV light induces apoptosis in melanoma cell lines (including WM35) in vitro by DNA damage, through a mechanism mediated by reactive oxygen species. The induced DNA damage might enhance the malignancy of the surviving tumor cells.73 Nucleus is also an important target for AuNPs, melanoma cell lines being one of the most susceptible. Our results are in good agreement with recent results showing that AuNPs are able to induce nucleus damage in cancer cells but not in their normal counterparts.74
In vitro antimicrobial activity
The antimicrobial activity of AuNPs and OVEs was compared on five representative microorganisms, S. aureus, L. monocytogenes, S. enteritidis, E. coli and C. albicans, using the DIZ in a disk diffusion assay (Table 3). The susceptible strains exhibited large DIZ (>10 mm), whereas the resistant strains exhibited small DIZ (≤10 mm). The aqueous extract of O. vulgare was inactive against all tested microbial strains (DIZ =6 mm). On the contrary, the disks treated with 1 mL OH AuNPs were surrounded by a large and clear zone in the case of S. aureus (DIZ =21 mm; Figure 9), suggesting their powerful antibacterial action against this bacterium. Meanwhile, our AuNPs showed a low antibacterial activity against S. enteritidis and L. monocytogenes (DIZ =10 mm) and did not show any inhibitory effect against E. coli (DIZ =8 mm). Recently it was shown that silver NPs synthesized using OVEs were effective against Gram-negative and Gram-positive bacteria, but this could be related to the presence of silver ions.30 Regarding the antifungal activity, our NPs exhibited a strong activity against C. albicans (DIZ =28 mm; Figure 9). In the scientific literature, there is no clear explanation of the mechanism involved in the antibacterial action of NPs. It is supposed that NPs could target the microbial cell membranes, disrupting the membrane potential.44 By considering the biomolecules covering the surface of our NPs, we believe that their strong antimycotic and antibacterial effects might be related to an easier penetration of the cell membranes, mediated by these biomolecules. Our results emphasize the potential topical applications of these AuNPs against Candida and Staphylococcus pathogens in dermatological disorders.
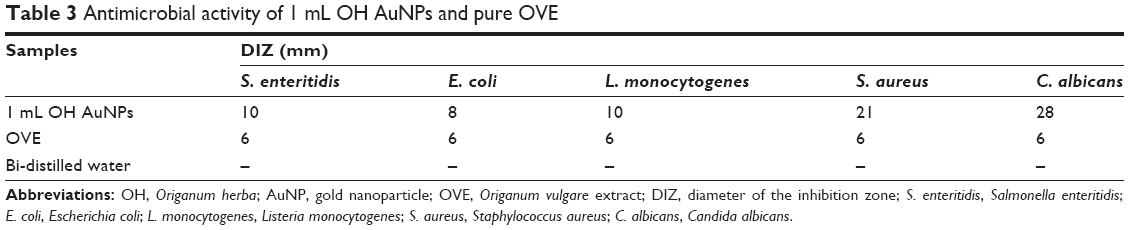 | Table 3 Antimicrobial activity of 1 mL OH AuNPs and pure OVE |
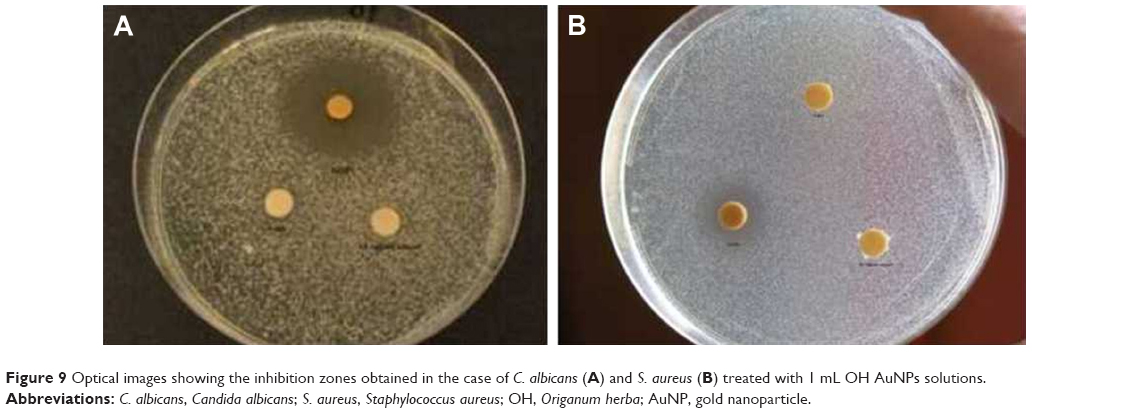 | Figure 9 Optical images showing the inhibition zones obtained in the case of C. albicans (A) and S. aureus (B) treated with 1 mL OH AuNPs solutions. |
Conclusion
In this study, we report a new, simple, rapid and efficient green synthesis method of biocompatible AuNPs using OVEs as reducing and capping agents. The as-synthesized AuNPs were thoroughly characterized by UV–Vis, FTIR and SER spectroscopies and PCS and TEM. The experimental results pointed out the formation of quasi-spherical biocompatible NPs possessing very interesting plasmonic, antioxidant and antimicrobial properties. The plasmonic properties of AuNPs capped with a layer of biomolecules originating from the plant extracts are able to enhance the Raman signal of MB and PRNL. Meanwhile, they showed significant bactericidal and antimycotic activities against human pathogenic bacterial strains. The most sensitive species were S. aureus and C. albicans, two microorganisms commonly involved in various dermatological infections. The standard MTT cytotoxicity assay revealed that this new class of AuNPs was well tolerated by normal HDF cells, while the melanoma WM35 cancer cells were more sensitive. The significant antioxidant properties they possess could recommend them for use in various skin inflammatory applications, including reduction of side effects in dermatological infection. More investigations on antibacterial activity and skin tolerance remain to be done, but nevertheless, data presented here provide a good starting point for exploring new applications of AuNPs in nanomedicine.
Acknowledgments
This research was supported by “Iuliu Haţieganu” University of Medicine and Pharmacy, Cluj-Napoca (PhD BD, 4944/2/08.03.2016) and by the Romanian National Authority for Scientific Research, CNCSIS-UEFISCDI project no PN-II-RU-TE-2014-4-1770.
Disclosure
The authors report no conflicts of interest in this work.
References
Giljohann DA, Seferos DS, Daniel WL, Massich MD, Patel PC, Mirkin CA. Gold nanoparticles for biology and medicine. Angew Chem Int Ed Engl. 2010;49(19):3280–3294. | ||
Llevot A, Astruc D. Applications of vectorized gold nanoparticles to the diagnosis and therapy of cancer. Chem Soc Rev. 2012;41(1):242–257. | ||
Sperling RA, Rivera-Gil P, Zhang F, Zanella M, Parak WJ. Biological applications of gold nanoparticles. Chem Soc Rev. 2008;37(9):1896–1908. | ||
Dykman L, Khlebtsov N. Gold nanoparticles in biomedical applications: recent advances and perspectives. Chem Soc Rev. 2012;41(6):2256–2282. | ||
Dreaden EC, Alkilany AM, Huang X, Murphy CJ, El-Sayed MA. The golden age: gold nanoparticles for biomedicine. Chem Soc Rev. 2012;41(7):2740–2779. | ||
Vigderman L, Zubarev ER. Therapeutic platforms based on gold nanoparticles and their covalent conjugates with drug molecules. Adv Drug Deliv Rev. 2013;65(5):663–676. | ||
Cai W, Gao T, Hong H, Sun J. Applications of gold nanoparticles in cancer nanotechnology. Nanotechnol Sci Appl. 2008;1:17–32. | ||
Carnovale C, Bryant G, Shukla R, Bansal V. Size, shape and surface chemistry of nano-gold dictate its cellular interactions, uptake and toxicity. Prog Mater Sci. 2016;83:152–190. | ||
Finkelstein AE, Walz DT, Batista V, Mizraji M, Roisman F, Misher A. Auranofin: new oral gold compound for treatment of rheumatoid-arthritis. Ann Rheum Dis. 1976;35:251–257. | ||
Metz O, Stoll W, Plenert W. Meningosis prophylaxis with intratechal Au-198-colloid and methotrexate in childhood acute lymphocytic-leukemia. Cancer. 1982;49:224–228. | ||
Durr NJ, Larson T, Smith DK, Korgel BA, Sokolov K, Ben-Yakar A. Two-photon luminescence imaging of cancer cells using molecularly targeted gold nanorods. Nano Lett. 2007;7(4):941–945. | ||
Mayer KM, Lee S, Liao H, et al. A label-free immunoassay based upon localized surface plasmon resonance of gold nanorods. ACS Nano. 2008;2(4):687–692. | ||
von Maltzahn G, Park JH, Agrawal A, et al. Computationally guided photothermal tumor therapy using long circulating gold nanorod antennas. Cancer Res. 2009;69(9):3892–3900. | ||
Min Y, Mao C, Xu D, Wang J, Liu Y. Gold nanorods for platinum based prodrug delivery. Chem Commun. 2010;46(44):8424–8426. | ||
Alkilany AM, Murphy CJ. Toxicity and cellular uptake of gold nanoparticles: what we have learned so far? J Nanopart Res. 2010;12:2313–2333. | ||
Sanna V, Pala N, Dessi G, et al. Single-step green synthesis and characterization of gold-conjugated polyphenol nanoparticles with antioxidant and biological activities. Int J Nanomedicine. 2014;9:4935–4951. | ||
Arunachalam KD, Annamalai SK, Hari S. One-step green synthesis and characterization of leaf extract-mediated biocompatible silver and gold nanoparticles from Memecylon umbellatum. Int J Nanomedicine. 2013;8:1307–1315. | ||
Arunachalam KD, Annamalai SK. Chrysopogon zizanioides aqueous extract mediated synthesis, characterization of crystalline silver and gold nanoparticles for biomedical applications. Int J Nanomedicine. 2013;8:2375–2384. | ||
Ramezania N, Ehsanfara Z, Shamsab F, et al. Screening of medicinal plant methanol extracts for the synthesis of gold nanoparticles by their reducing potential. Z Naturforsch. 2008;63(b):903–908. | ||
MubarakAli D, Thajuddin N, Jeganathanv K, Gunasekaran M. Plant extract mediated synthesis of silver and gold nanoparticles and its antibacterial activity against clinically isolated pathogens. Colloid Surf B Biointerfaces. 2011;85(2):360–365. | ||
Basavegowda N, Sobczak-Kupiec A, Malina D, et al. Plant mediated synthesis of gold nanoparticles using fruit extracts of Ananas comosus (L.) (Pineapple) and evaluation of biological activities. Adv Mat Lett. 2013;4(5):332–337. | ||
Reddy GR, Morais AB, Gandhi NN. Green synthesis, characterization and in vitro antibacterial studies of gold nanoparticles by using Senna siamea plant seed aqueous extract at ambient conditions. Asian J Chem. 2013;25(15):8541–8544. | ||
Chandran SP, Chaudhary M, Pasricha R, Ahmad A, Sastry M. Synthesis of gold nanotriangles and silver nanoparticles using Aloe vera plant extract. Biotechnol Prog. 2006;22(2):577–583. | ||
Starnes DL, Jain A, Sahi SV. In planta engineering of gold nanoparticles of desirable geometries by modulating growth conditions: an environment-friendly approach. Environ Sci Technol. 2010;44(18):7110–7115. | ||
Stiufiuc R, Toderas F, Iosin M, Stiufiuc G. Anisotropic gold nanocrystals: synthesis and characterization. Int Mod Phys B. 2010;24(6–7):753–761. | ||
Ciocârlan V. Illustrated Flora of Romania. Pteridophyta et Spermatophyta. Bucharest: Ceres Publishing House; 2009:644–670. | ||
Chishti S, Kaloo ZA, Sultan P. Medicinal importance of genus Origanum: a review. J Pharmacognosy Phytother. 2013;5:170–177. | ||
Kaurinovic B, Popovic M, Vlaisavljevic S, Trivic S. Antioxidant capacity of Ocimum basilicum L. and Origanum vulgare L. extracts. Molecules. 2011;16:7401–7414. | ||
Hawas UW, El-Desoky SK, Kawashty SA, Sharaf M. Two new flavonoids from Origanum vulgare. Nat Prod Res. 2008;22(17):1540–1543. | ||
Sankar R, Karthik A, Prabu A, Karthik S, Shivashangari KS, Ravikumar V. Origanum vulgare mediated biosynthesis of silver nanoparticles for its antibacterial and anticancer activity. Colloids Surf B Biointerfaces. 2013;108:80–84. | ||
Mohamed NA, Nassier OA. The antihyperglycaemic effect of the aqueous extract of Origanium vulgare leaves in streptozotocin-induced diabetic rats. Jordan J Biol Sci. 2013;6:31–38. | ||
Ozbek T, Gulluce M, Sahin F, Ozkan H, Sevsay S, Baris O. Investigation of the antimutagenic potentials of the methanol extract of Origanum vulgare L. subsp. vulgare in the Eastern Anatolia region of Turkey. Turk J Biol. 2008;32(4):271–276. | ||
Vujicic M, Nikolic I, Kontogianni VG, et al. Methanolic extract of Origanum vulgare ameliorates type 1 diabetes through antioxidant, anti-inflammatory and anti-apoptotic activity. Br J Nutr. 2015;113(5):770–782. | ||
Stiufiuc R, Iacovita C, Lucaciu CM, et al. SERS-active silver colloids prepared by reduction of silver nitrate with short-chain polyethylene glycol. Nanoscale Res Lett. 2013;8(1):47. | ||
Stiufiuc R, Iacovita C, Nicoara R, et al. One-step synthesis of PEGylated gold nanoparticles with tunable surface charge. J Nanomater. 2013;2013:7. | ||
Singleton VL, Orthofer R, Lamuela-Raventos RM. Analysis of total phenols and other oxidation substrates and antioxidants by means of Folin-Ciocalteu reagent. Methods Enzymol. 1999;299:152–178. | ||
Slinkard K, Singleton VL. Total phenol analyses: automation and comparison with manual methods. Am J Enol Viticult. 1977;28:49–55. | ||
Dipankar C, Murugan S. The green synthesis, characterization and evaluation of the biological activities of silver nanoparticles synthesized from Iresine herbstii leaf aqueous extracts. Colloids Surf B Biointerfaces. 2012;98:112–119. | ||
Benedec D, Vlase L, Oniga I, et al. Polyphenolic composition, antioxidant and antibacterial activities for two Romanian subspecies of Achillea distans Waldst. et Kit. ex Willd. Molecules. 2013;18:8725–8739. | ||
Mani A, Lakshmi S, Gopal V. Bio-mimetic synthesis of silver nanoparticles and evaluation of its free radical scavenging activity. Int J Biol Pharm Res. 2012;3(4):631–633. | ||
Medhe S, Bansal P, Srivastava MM. Enhanced antioxidant activity of gold nanoparticle embedded 3,6-dihydroxyflavone: a combinational study. Appl Nanosci. 2014;4:153–161. | ||
El-Rafie HM, Hamed MA. Antioxidant and anti-inflammatory activities of silver nanoparticles biosynthesized from aqueous leaves extracts of four Terminalia species. Adv Nat Sci Nanosci Nanotechnol. 2014;5:1–11. | ||
Reeves DS, White LO. Principles of methods of assaying antibiotics. In: Hugo WB, Russel AD, editors. Pharmaceutical Microbiology. 3rd ed. Oxford, UK: Blackwell Scientific Publication; 1983:140–162. | ||
Ravishankar Rai V, Jamuna Bai A. Nanoparticles and their potential application as antimicrobials. In: éndez-Vilas AM, editor. Science against Microbial Pathogens: Communicating Current Research and Technological Advances. Badajoz: Formatex Research Center; 2011:197–209. | ||
Prema P, Thangapandiyan S. In-vitro antibacterial activity of gold nanoparticles capped with polysaccharide stabilizing agents. Int J Pharm Pharm Sci. 2013;5:310–314. | ||
Bao Q, Zhang D, Qi P. Synthesis and characterization of silver nanoparticle and graphene oxide nanosheet composites as a bactericidal agent for water disinfection. J Colloid Interface Sci. 2011;360:463–470. | ||
Mosmann T. Rapid colorimetric assay for cellular growth and survival: application to proliferation and cytotoxicity assays. J Immunol Methods. 1983;65(1–2):55–63. | ||
Scarabelli L, Sánchez-Iglesias A, Pérez-Juste J, Liz-Marzán LM. A “tips and tricks” practical guide to the synthesis of gold nanorods. J Phys Chem Lett. 2015;6:4270–4279. | ||
Singh DK, Jagannathan R, Khandelwal P, Abraham PM, Poddar P. In situ synthesis and surface functionalization of gold nanoparticles with curcumin and their antioxidant properties: an experimental and density functional theory investigation. Nanoscale. 2013;5:1882–1893. | ||
Shankar S, Rai AS, Ankamwar B, Singh A, Ahmad A, Sastry M. Biological synthesis of triangular gold nanoprisms. Nat Mat. 2004;3:482–488. | ||
Li G, Lauer M, Schulz A, Boettcher C, Li F, Fuhrhop J-H. Spherical and planar gold(0) nanoparticles with a rigid gold(I)-anion or a fluid gold(0)-acetone surface. Langmuir. 2003;19:6483–6491. | ||
Jain PK, Lee KS, El-Sayed IH, El-Sayed MA. Calculated absorption and scattering properties of gold nanoparticles of different size, shape, and composition: applications in biological imaging and biomedicine. J Phys Chem B. 2006;110:7238–7248. | ||
Haiss W, Thanh NTK, Aveyard J, Fernig DG. Determination of size and concentration of gold nanoparticles from UV-vis spectra. Anal Chem. 2007;79:4215–4221. | ||
Willets KA, Van Duyne RP. Localized surface plasmon resonance spectroscopy and sensing. Annu Rev Phys Chem. 2007;58:267–297. | ||
Ribeiro da Luz B. Attenuated total reflectance spectroscopy of plant leaves: a tool for ecological and botanical studies. New Phytol. 2006;172:305–318. | ||
Xiao GN, Man SQ. Surface enhanced Raman scattering of methylene blue adsorbed on cap-shaped silver nanoparticles. Chem Phys Lett. 2007;447:305–309. | ||
Farcaş A, Iacoviţă C, Vinţeler E, Chiş V, Ştiufiuc R, Lucaciu CM. The influence of molecular structure modifications on vibrational properties of some beta blockers: a combined raman and DFT study. J Spectrosc. 2016;2014:9. Article ID 3137140. | ||
Stiufiuc R, Iacovita C, Stiufiuc G, Bodoki E, Chis V, Lucaciu CM. Surface mediated chiral interactions between cyclodextrins and propranolol enantiomers: a SERS and DFT study. Phys Chem Chem Phys. 2015;17(2):1281–1289. | ||
Stiufiuc R, Iacovita C, Lucaciu CM, et al. Adsorption geometry of propranolol enantiomers on silver nanoparticles. J Mol Struct. 2013;1031:201–206. | ||
Xu LJ, Lei ZC, Li J, Zong C, Yang CJ, Ren B. Label-free surface-enhanced Raman spectroscopy detection of DNA with single-base sensitivity. J Am Chem Soc. 2015;137(15):5149–5154. | ||
Resetár A, Freytag C, Kalydi F, et al. Production and antioxidant capacity of tissue cultures from four Amaryllidaceae species. Acta Soc Bot Pol. 2017;86:1–12. | ||
Amensour M, Sendra E, Abrini J, Pérez-Alvarez JA, Fernández-López J. Antioxidant activity and total phenolic compounds of myrtle extracts. CyTA J Food. 2010;8:95–101. | ||
Tawaha K, Alali FQ, Gharaibeh M, Mohammad M, El-Elimat T. Antioxidant activity and total phenolic content of selected Jordanian plant species. Food Chem. 2007;104:1372–1378. | ||
Alali FQ, Tawaha K, El-Elimat T, et al. Antioxidant activity and total phenolic content of aqueous and methanolic extracts of Jordanian plants: an ICBG project. Nat Prod Res. 2007;21:1121–1131. | ||
Marquis BJ, Love SA, Braun KL, Haynes CL. Analytical methods to assess nanoparticle toxicity. Analyst. 2009;134:425–439. | ||
Fratoddi I, Venditti I, Cametti C, Russo MV. How toxic are gold nanoparticles? The state-of-the-art. Nano Res. 2015;8(6):1771–1799. | ||
Alklany A, Murphy CJ. Toxicity and cellular uptake of gold nanoparticles: what we have learned so far? J Nanopart Res. 2010;12:2313–2333. | ||
Chithrani BD, Chan WCW. Elucidating the mechanism of cellular uptake and removal of protein-coated gold nanoparticles of different sizes and shapes. Nano Lett. 2007;7:1542–1550. | ||
Gao HJ, Shi WD, Freund LB. Mechanics of receptor mediated endocytosis. Proc Natl Acad Sci U S A. 2005;102:9469–9474. | ||
Sanna V, Pala N, Dessì G, et al. Single-step green synthesis and characterization of gold-conjugated polyphenol nanoparticles with antioxidant and biological activities. Int J Nanomedicine. 2014;9:4935–4951. | ||
Saha S, Xiong X, Chackraborty PK, et al. Gold nanoparticle reprograms pancreatic tumor environment and inhibits tumor growth. ACS Nano. 2016;10(12):10636–10651. | ||
Melamed RM, Riley RS, Valcourt DM, Day ES. Using gold nanoparticles to disrupt the tumor microenvironment: an emerging therapeutic strategy. ACS Nano. 2016;10(12):10631–10635. | ||
Hussein MR, Haemel AK, Sudilovsky O, Wood GS. Genomic instability in radial growth phase melanoma cell lines after ultraviolet irradiation. J Clin Pathol. 2005;58(4):389–396. | ||
Kodiha M, Wang YM, Hutter E, Maysinger D, Stochaj U. Off to the organelles – killing cancer cells with targeted gold nanoparticles. Theranostics. 2015;5(4):357–370. | ||
Elia P, Zach R, Hazan S, Kolusheva S, Porat Z, Zeiri Y. Green synthesis of gold nanoparticles using plant extracts as reducing agents. Int J Nanomedicine. 2014;9(1):4007–4021. |
Supplementary materials
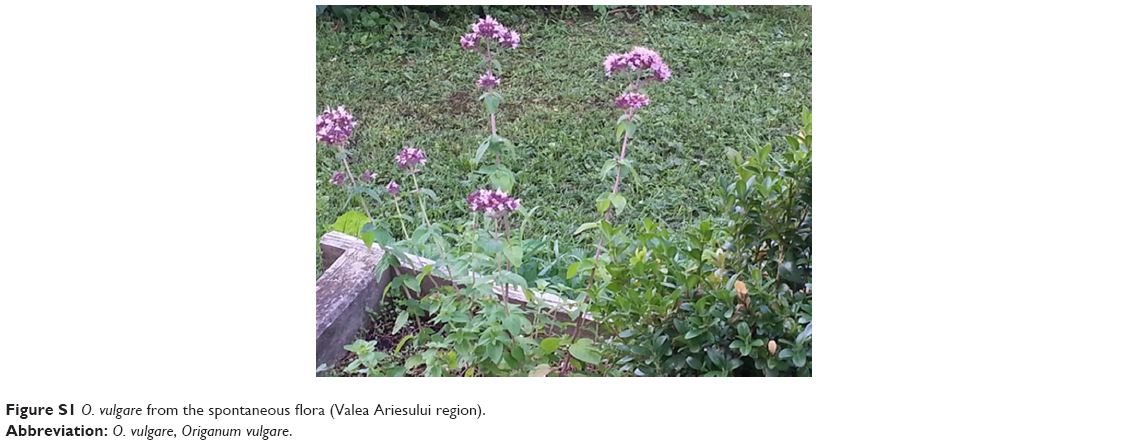 | Figure S1 O. vulgare from the spontaneous flora (Valea Ariesului region). |
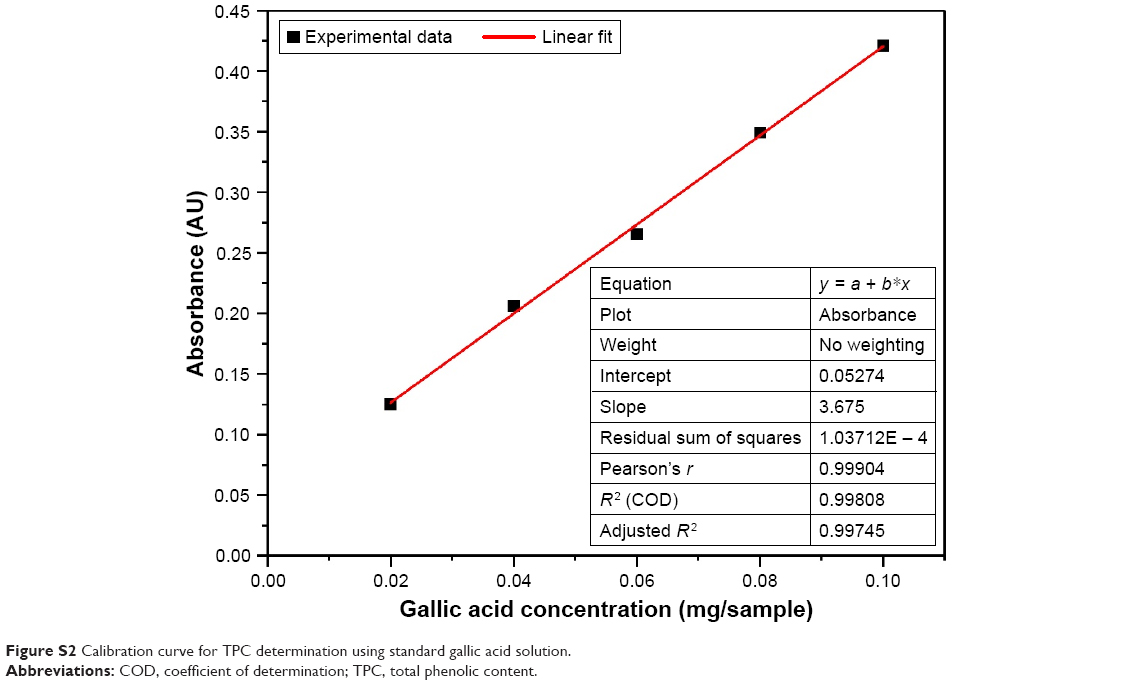 | Figure S2 Calibration curve for TPC determination using standard gallic acid solution. |
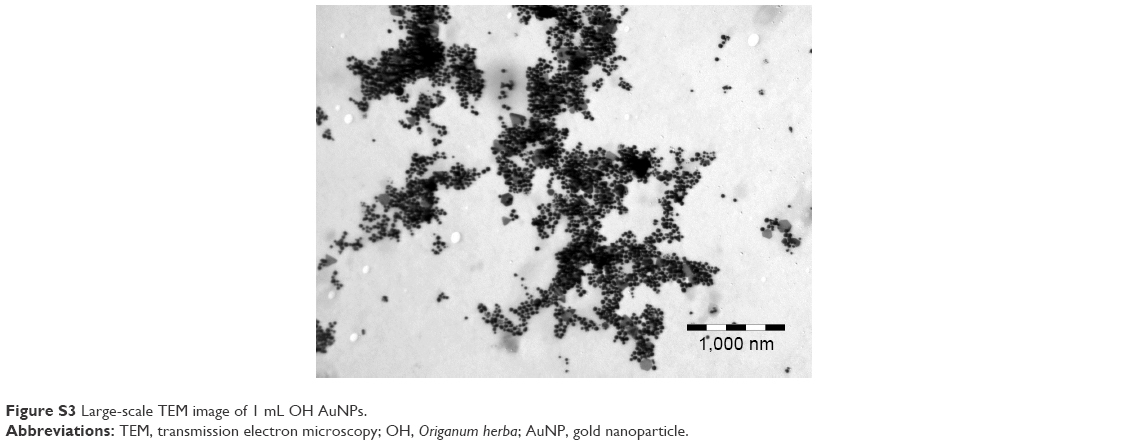 | Figure S3 Large-scale TEM image of 1 mL OH AuNPs. |
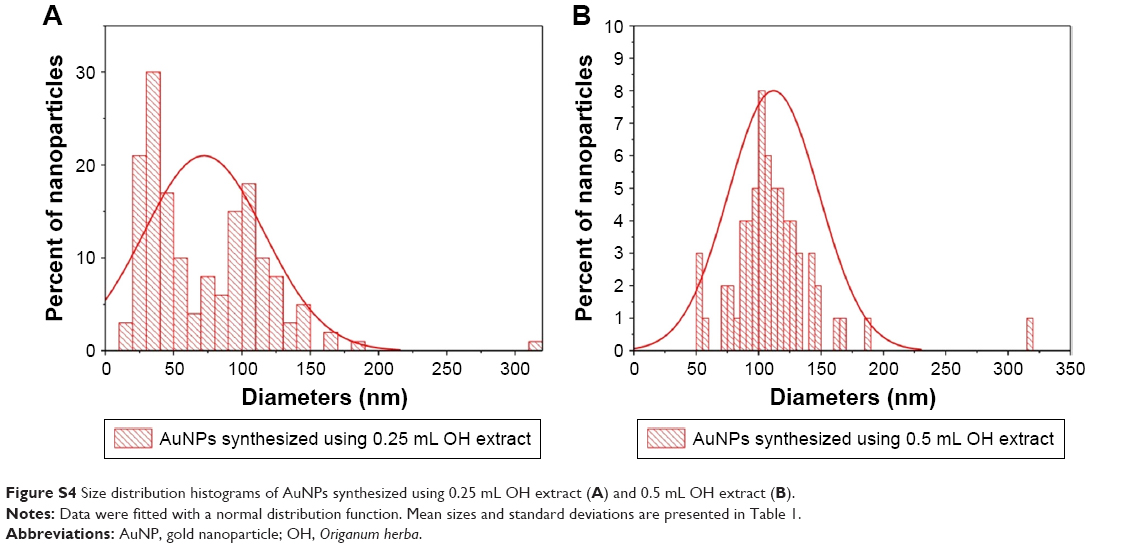 | Figure S4 Size distribution histograms of AuNPs synthesized using 0.25 mL OH extract (A) and 0.5 mL OH extract (B). |
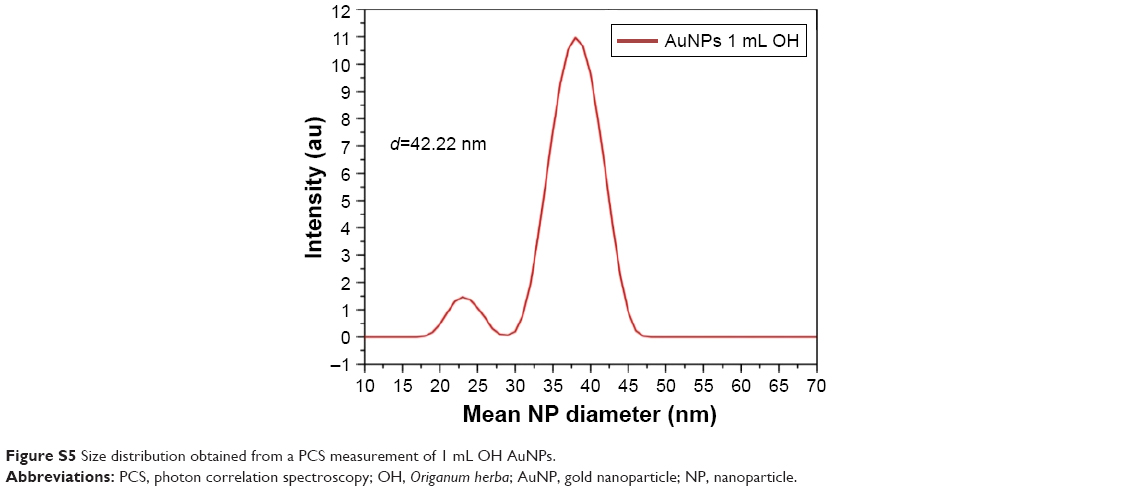 | Figure S5 Size distribution obtained from a PCS measurement of 1 mL OH AuNPs. |
 © 2018 The Author(s). This work is published and licensed by Dove Medical Press Limited. The full terms of this license are available at https://www.dovepress.com/terms.php and incorporate the Creative Commons Attribution - Non Commercial (unported, v3.0) License.
By accessing the work you hereby accept the Terms. Non-commercial uses of the work are permitted without any further permission from Dove Medical Press Limited, provided the work is properly attributed. For permission for commercial use of this work, please see paragraphs 4.2 and 5 of our Terms.
© 2018 The Author(s). This work is published and licensed by Dove Medical Press Limited. The full terms of this license are available at https://www.dovepress.com/terms.php and incorporate the Creative Commons Attribution - Non Commercial (unported, v3.0) License.
By accessing the work you hereby accept the Terms. Non-commercial uses of the work are permitted without any further permission from Dove Medical Press Limited, provided the work is properly attributed. For permission for commercial use of this work, please see paragraphs 4.2 and 5 of our Terms.