")
Back to Journals » International Journal of Nanomedicine » Volume 13
Oridonin-loaded and GPC1-targeted gold nanoparticles for multimodal imaging and therapy in pancreatic cancer
Authors Qiu W, Chen R , Chen X, Zhang H , Song L, Cui W, Zhang J , Ye D, Zhang Y, Wang Z
Received 26 June 2018
Accepted for publication 1 October 2018
Published 24 October 2018 Volume 2018:13 Pages 6809—6827
DOI https://doi.org/10.2147/IJN.S177993
Checked for plagiarism Yes
Review by Single anonymous peer review
Peer reviewer comments 3
Editor who approved publication: Professor Lei Yang
Wenli Qiu,1 Rong Chen,2 Xiao Chen,3 Huifeng Zhang,1 Lina Song,3 Wenjing Cui,3 Jingjing Zhang,1 Dandan Ye,1 Yifen Zhang,4 Zhongqiu Wang3
1The First Clinical Medical School, Nanjing University of Chinese Medicine, Nanjing, People’s Republic of China; 2Department of Diagnostic Radiology and Nuclear Medicine, University of Maryland School of Medicine, Baltimore, MD, USA; 3Department of Radiology, Affiliated Hospital of Nanjing University of Chinese Medicine, Nanjing, People’s Republic of China; 4Department of Pathology, Affiliated Hospital of Nanjing University of Chinese Medicine, Nanjing, People’s Republic of China
Purpose: Early diagnosis and therapy are critical to improve the prognosis of patients with pancreatic cancer. However, conventional imaging does not significantly increase the capability to detect early stage disease. In this study, we developed a multifunctional theranostic nanoplatform for accurate diagnosis and effective treatment of pancreatic cancer.
Methods: We developed a theranostic nanoparticle (NP) based on gold nanocages (AuNCs) modified with hyaluronic acid (HA) and conjugated with anti-Glypican-1 (anti-GPC1) antibody, oridonin (ORI), gadolinium (Gd), and Cy7 dye. We assessed the characteristics of GPC1-Gd-ORI@HAuNCs-Cy7 NPs (ORI-GPC1-NPs) including morphology, hydrodynamic size, stability, and surface chemicals. We measured the drug loading and release efficiency in vitro. Near-infrared fluorescence (NIRF)/magnetic resonance imaging (MRI) and therapeutic capabilities were tested in vitro and in vivo.
Results: ORI-GPC1-NPs demonstrated long-time stability and fluorescent/MRI properties. Bio-transmission electron microscopy (bio-TEM) imaging showed that ORI-GPC1-NPs were endocytosed into PANC-1 and BXPC-3 (overexpression GPC1) but not in 293 T cells (GPC1-negative). Compared with ORI and ORI-NPs, ORI-GPC1-NPs significantly inhibited the viability and enhanced the apoptosis of pancreatic cancer cells in vitro. Moreover, blood tests suggested that ORI-GPC1-NPs showed negligible toxicity. In vivo studies showed that ORI-GPC1-NPs enabled multimodal imaging and targeted therapy in pancreatic tumor xenografted mice.
Conclusion: ORI-GPC1-NP is a promising theranostic platform for the simultaneous diagnosis and effective treatment of pancreatic cancer.
Keywords: pancreatic cancer, GPC1, ORI, theranostic
Introduction
Pancreatic ductal adenocarcinoma (PDAC) is one of the main causes of global morbidity and mortality, with a 5-year survival <5%.1 The very low survival rate is mainly due to the lack of early diagnosis and effective treatment strategies.2,3 Although existing imaging technologies can provide morphological information about pancreatic tissues, single-modality imaging does not have sufficient sensitivity and specificity for the diagnosis of pancreatic cancer.4 Multimodal imaging for pancreatic cancer provided a more comprehensive view of tumor tissues.5 A major challenge in treatment is that PDAC is not sensitive to traditional chemotherapy.6,7 Major problems in clinical antitumor therapy include the short half-life, hydrophobic nature, undesired adverse effects, and poor bioavailability.8 Therefore, a new strategy that combines multimodal imaging diagnosis and targeted therapy is urgently needed to eradicate pancreatic cancer.
Molecular imaging offers a promising approach to combine multimodal imaging diagnosis and targeted therapy to improve diagnosis and efficacy of pancreatic cancer.9,10 Gold nanocages (AuNCs) are widely used in cancer theranostics due to their easy modification, excellent stability, and biocompatibility.11 AuNCs have unique properties such as the inner hollow space,12 ease of surface functionalization,13 and the capacity to transport and deliver various cargo.14 By loading a variety of functional materials such as dyes, imaging agents, or drugs, AuNCs can achieve multimodal imaging diagnosis and targeted therapy. Armin et al developed PEGylated gold-mitoxantrone nanoparticles (NPs) and found that it could improve the therapy efficacy of cancer.15 Compared with a single-function gold NP drug delivery system, a multifunctional theranostic nanoplatform is capable of multimodal imaging diagnosis and targeted treatment of cancer. Previous studies describe that theranostic agents are combined with diagnostic elements and therapeutic agents for pancreatic cancer imaging and treatment.16 Deng et al developed an mesothelin-targeted NP for magnetic resonance imaging (MRI) and targeted therapy.17 Wang et al reported a gemcitabine (GEM)-loaded nanospheres for MRI and thermochemotherapy.18 Jaidev et al reported human epidermal growth factor receptor-targeted multifunctional NP for imaging and treatment of pancreatic cancer.19 However, these studies only provided single-modality imaging to image pancreatic cancer.
In this study, we constructed a multifunctional theranostic nanoplatform capable of multimodal imaging diagnosis and targeted therapy for pancreatic cancer. The platform has these characteristics. First, it uses glypican-1 (GPC1) as the theranostic target. Targeting modification of NPs can enhance the accumulation of NPs in tumor sites. GPC1 is a member of the heparan sulfate proteoglycan family and covalently anchored to the extracytoplasmic surface of the plasma membrane.20 GPC1 plays an important role in cancer progression by influencing tumor metastasis, invasion, and apoptosis. It is selectively overexpressed in pancreatic cancer,21,22 but not in normal pancreatic tissues, pancreatic tissues, or benign pancreatic tumors.23 However, to date, this molecule has rarely been used as a target for pancreatic cancer molecular imaging.
Oridonin (ORI) is a tetracycline diterpenoid compound that is naturally found in Rabdosia rubescens.24 It has detoxification, antibacterial, anti-inflammatory, and antitumor effects.25,26 Unlike synthetic chemical drugs, ORI is an inexpensive natural compound with significant efficacy and few side effects. Recently, Gui et al reported that ORI inhibited the migration of pancreatic cancer cells by altering the cytoskeleton and/or type II epithelial–mesenchymal transition.27 However, ORI has not been widely applied due to its low blood solubility and random distribution throughout the body.28 In this study, we conjugated ORI into AuNCs in order to increase its solubility and enhance cellular uptake and antitumor efficacy.29
Hyaluronic acid (HA) is a good surface modifier due to its non-toxicity, water dispersibility, and high stability and biocompatibility.30 Active groups on the HA backbone – such as carboxylic acid or hydroxyl groups – make it easy to conjugate with various functional groups.31 The HA coating on the AuNCs provides binding sites for the anti-GPC1 antibody, Cy7, Gd, and permits the encapsulation of an unprecedented high amount of ORI for pH- and enzyme-triggered delivery.32
In this study, we developed a unique multifunctional theranostic nanoplatform, then evaluated its ability in multimodal imaging (near-infrared fluorescence [NIRF] and MRI) and treatment effect for pancreatic cancer both in vitro and in vivo. Our results indicate that the multifunctional theranostic nanoplatform (ORI-GPC1-NPs) has great potential in precise diagnosis and targeted treatment of GPC1 overexpression pancreatic cancer and may open a new avenue for improving the survival rate of patients with pancreatic cancer.
Materials and methods
Materials
AuNCs were purchased from Southeast University School of Materials Science and Engineering Laboratory (Nanjing, China). Thiolated hyaluronic acid (HA-SH) was purchased from Zhenjiang Dong Yuan Biotechnology Corporation (Zhenjiang, China). N-(3-Dimethylaminopropyl)-N-ethylcarbodiimide hydrochloride (EDC), N-hydroxysuccinimide (NHS), hydrophilic gadolinium (III) 1,4,7,10-tetraazacyclododecane-1,4,7,10-tetraacetate acid (Gd-DOTA)-NHS ester, and Cy7-NHS ester were purchased from J&K Chemical Ltd (Shanghai, China). Bovine serum albumin (BSA) was purchased from Solarbio (Beijing, China). ORI and GEM were purchased from Yuan Ye Technology Co., Ltd. (Shanghai, China). Matrigel, MTT, propidium iodide (PI), Annexin V-fluorescein isothiocyanate (FITC)/PI apoptosis detection agents, dimethyl sulfoxide (DMSO), and N,N-dimethylformamide (DMF) were obtained from Sangon Biological Engineering Technology & Services Co., Ltd (Shanghai, China). High-glucose DMEM, Modified Eagle’s Medium (MEM), FBS, penicillin/streptomycin, and PBS were purchased from Thermo Fisher Scientific (Waltham, MA, USA). Human pancreatic cancer cell lines (PANC-1, BXPC-3, and SW1990) and cells from the human embryonic kidney 293 T-cell lines were purchased from the Chinese Academy of Sciences Shanghai Branch Cell Bank (Shanghai, China). Anti-GPC1 antibody (ab199343), casepase-3 antibody (ab32150), bcl-2 antibody (ab201335), β-actin antibody (ab8226), and horseradish peroxidase-conjugated AffiniPure antibody (ab191866) were purchased from Abcam (Cambridge, UK). All chemicals were of analytical grade or higher.
Preparation of ORI@AuNCs
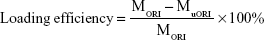
AuNCs loaded with ORI were produced according to a previously reported method.14 In brief, ORI (1 mg) was dissolved in absolute DMF, and a mixture was then distributed in the PBS (10 M, PH 7.4). AuNCs (5 mg) were then added to the ORI solution (10 mL, 0.5 mg/mL), and the resulting solution was shaken in an orbital shaker at room temperature for 24 hours. Thereafter, ORI-loaded AuNCs were gathered by centrifugation (8,000 rpm, 4°C, 10 minutes) and washed with PBS (10 M, pH 7.4) three times to remove free ORI, the ORI@AuNCs NPs were then redispersed in 10 mL PBS by sonication. The concentration of AuNCs was calculated by UV spectrophotometer. For investigating the ORI-loading efficiency and content, we gathered the supernatants in the different washing processes and the concentration of free ORI was measured by plotting a standard calibration curve for ORI present in the supernatants using a UV–Vis spectrophotometer at the wavelength of 243 nm. The ORI-loading efficiency and content were expressed as
|
|
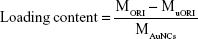
Here MORI, MuORI, and MAuNCs are the total amount of ORI (mg), the unloaded amount of ORI in the supernatant (mg), and the amount of AuNCs (mg), respectively.33
Conjugation of HA-SH to ORI@HAuNCs
We produced HA-SH-capped AuNCs according to a simple method reported previously.34 Briefly, 1 g HA-SH was added to a colloidal solution of ORI@AuNCs and the resulting mixture was shaken in an orbital shaker at room temperature for 24 hours. Then, ORI@HAuNCs were fabricated successfully. They were washed with PBS (10 M, PH 7.4) three times with centrifugation at 8,000 rpm for 10 minutes to remove excess HA-SH, to obtain ORI@HAuNCs.
Simultaneous attachment of anti-GPC1 antibody, Gd, and Cy7 to ORI@HAuNCs (ORI-GPC1-NPs)
Preparation of the ORI-GPC1-NPs was performed in three steps. First, the carboxyl group of HA was activated by EDC and NHS.35 ORI@HAuNCs were dissolved in MES buffer (0.1 M, pH 6), and 1 mg EDC and 1 mg NHS were then added to the solution to fully activate the carboxyl group. Second, anti-GPC1 antibody (10 nM) was added to the mixture solution, which was then continuously stirred for 2 hours. To provide more amino groups for subsequent reactions, BSA (10 μM) was added to the solution and mixed on a rotary shaker for 10 hours at room temperature. The solution was then washed with PBS (10 M, pH 7.4) three times and centrifuged to remove unreacted protein. The anti-GPC1 antibody and BSA were covalently grafted onto ORI@HAuNCs by an esterification reaction between the amino group and carboxyl group. Third, we added Gd-DOTA-NHS ester (1 mM) to GPC1-ORI@HAuNCs micelles. The reaction mixture was stirred at room temperature for 12 hours in the dark and then was washed with PBS (10 M, pH 7.4) three times and centrifugation was used to remove unreacted material. As in the above steps, Cy7-NHS ester (10 μM) was added into the mixture solution and Cy7-NHS ester was also covalently grafted onto micelles based on an esterification reaction between the amino group and carboxyl group. The obtained GPC1-Gd-ORI@HAuNCs-Cy7 NPs (ORI-GPC1-NPs) were then harvested. Meanwhile, we synthesized non-targeted Gd-ORI@HAuNCs-Cy7 NPs (ORI-NPs) as a control.
Characterization of NPs
The morphologies of the materials were obtained by transmission electron microscopy (TEM) using a JEM-100CX electron microscope (JEOL Ltd., Tokyo, Japan). The size distribution and zeta potential were investigated by dynamic light scattering (DLS) using a Zetasizer Nano ZS model ZEN 3600 (Worcestershire, UK). UV−Vis absorption spectra were measured by a Cary 60 UV−Vis spectrophotometer (Agilent Technologies, Santa Clara, CA, USA). The elements of theranostic micelles were analyzed by energy dispersive spectrometer (EDS) also using a JEM-100CX electron microscope. The functional group modifications of the NPs were detected by Fourier transform infrared (FTIR) spectra using Nicolet 6700 FTIR spectrophotometer (Thermo Nicolet, Madison, WI, USA) at the wavelength range of 400–4,000 cm−1. In vitro fluorescence spectra of ORI-GPC1-NPs at different Cy7 concentrations (10, 5, 2.5, 1.25, 0.625, and 0 μM) were evaluated by a fluorescence spectrophotometer (Thermo Fisher Scientific) at a wavelength of 600 nm. In vitro MRI of ORI-GPC1-NPs at different Gd concentrations (1, 0.5, 0.25, 0.125, 0.0625, and 0 mM) was obtained by a 3.0 T MR system (Siemens, Erlangen, Germany) to assess the ability of MRI. MRI was performed under the following parameters: repetition time (TR), 5.8 ms; echo delay time (TE), 3.66 ms; slice thickness, 5 mm; inversion time (TI), 16–320 ms; field of view (FOV) read, 40 mm; FOV phase, 100%. The longitudinal (T1) relaxation times of NPs were evaluated.
In vitro drug release
The release profile of ORI from ORI-GPC1-NPs was determined in serum containing media according to a reported procedure with some modifications.36 In brief, 1 mL of ORI-GPC1-NPs was added to 9 mL of 10% FBS containing media at pH 7.4, pH 5.5, and pH 5.5+ hyaluronidase (60 U/mL). ORI-loaded GPC1-ORI-NPs were isolated by centrifugation at 8,000 rpm for 20 minutes and the supernatants were collected. The amount of ORI released was measured by plotting a standard calibration curve for ORI in the supernatants using a UV–Vis spectrophotometer at a wavelength of 243 nm. Each assay was performed in triplicate, and the results of the experiment were reported as mean value ± standard deviation (SD) of the three assays.
Cell culture
PANC-1, BXPC-3, and SW1990 cells (pancreatic cancer cells) were cultured at a density of 2×10⁴ cells/cm2 in DMEM, and 293 T cells (normal cells) were cultured at a density of 2×10⁴ cells/cm2 in MEM at 37°C in an atmosphere of humidified air with 5% CO2. The media were supplemented with 10% FBS and 1% penicillin/streptomycin. When the cells reached 80% of confluency, they were subcultured in 0.25% trypsin.
PCR and flow cytometry analysis for GPC1 expression of cell lines
Total RNA samples were extracted using TRIzol reagent (Thermo Fisher Scientific). Reverse transcription was performed using a PrimeScript Reagent Kit (Takara, Japan). PCR was carried out using a PCR SYBR Green master mix (CloudSeq, Shanghai, China). Specific primer pairs were obtained from Cloud-Seq: GPC1, forward: 5′-TACAGAGGAGGCCTCAAAGC-3′, reverse: 5′-GGCATCATGCATCATCTCAG-3′; GAPDH, forward: 5′-GTGGATCAGCAAGCAGGAGT-3′, reverse: 5′-AAAGCCATGCCAATCTCATC-3′. The thermocycling conditions were as follows: 95°C for 10 minutes followed by 40 cycles at 95°C for 10 seconds and 60°C for 60 seconds using ABI ViiA7 Real-time PCR System (Thermo Fisher Scientific). The relative expression of RNA in each sample was normalized to a GAPDH internal control and was calculated using the 2−ΔΔCT method. All assays were performed in triplicate.
GPC1 expression in pancreatic cancer cells was also verified by a standard flow cytometry technique. Cells were seeded in six-well plates and incubated for 24 hours to allow cell attachment. Cells were then trypsinized and centrifuged at 1,500 rpm for 5 minutes, and resuspended in PBS, and 5 μL of FITC-stained anti-GPC1 antibody (1:50) was added before the mixture was incubated at 4°C for 1 hour. Finally, the cells were washed twice with PBS and analyzed using a FACS Caliber cell analyzer with Cell Quest software (BD Biosciences, San Jose, CA, USA).
Cellular uptake of ORI-GPC1-NPs
ORI-GPC1-NPs were incubated with PANC-1, BXPC-3, and 293 T cells and were then observed using a bio-TEM (Tecnai G2 Polara; FEI, Hillsboro, OR, USA). Our procedure was as follows: PANC-1, BXPC-3, and 293 T cells were seeded in six-well plates at 1×10⁶ per well in 2 mL of DMEM or MEM and incubated for 24 hours to allow cell attachment. Then, the media were replaced with 2 mL of fresh media containing ORI-GPC1-NPs (15 μg/mL of AuNCs), and the resulting mixture was incubated at 37°C for 6 hours. Next, cells were collected by centrifugation and were fixed in 2.5% glutaraldehyde at room temperature for 1 hour. The samples were then stained with 0.5% uranyl acetate and 2% osmium tetroxide. The samples were dehydrated by ethanol and embedded in Epon-propylene oxide (Epon-PO). Thin sections were obtained by an ultramicrotome and AuNCs in cells were assessed by bio-TEM.
Effects of ORI-GPC1-NPs on cancer cell viability
We investigated the effects of ORI-GPC1-NPs, ORI-NPs, and ORI (dissolved in DMSO) on cell viability by MTT assay in PANC-1, BXPC-3, and 293 T cells. Cells were seeded in 96-well plates at 5×10³ per well in 200 μL of DMEM or MEM with 10% FBS and were incubated for 24 hours to allow cell attachment.20 Fresh media containing ORI, ORI-NPs, or ORI-GPC1-NPs at different concentrations (2, 5, 10, 20, 50, 100, and 200 μg/mL NPs or ORI) in a total volume of 200 μL and cells were incubated at 37°C for 24 and 48 hours, respectively. The medium was then removed and cells were washed twice with cold PBS. Next, 20 μL of MTT solution was added to each well and the resulting mixture was further incubated for 4 hours, after which 100 μL of DMSO was added to each well to dissolve formazan crystals. The optical density (OD) in each well was measured at a wavelength of 490 nm using a multifunctional microplate reader (PerkinElmer Inc., Waltham, MA, USA). Cell viability was calculated by using the following formula:
|
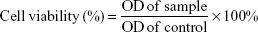
IC50 (the inhibitory concentration of drug required to induce 50% death) was determined by the regression curve of cell viability.
Apoptosis analyses, cell cycle assays, and migration assessments
Flow cytometry assays were implemented to quantitatively analyze ORI-, ORI-NP-, ORI-GPC1-NP-induced apoptosis or necrosis. First, PANC-1 and BXPC-3 cells were seeded in six-well plates at 1×10⁶ per well and were incubated for 24 hours to allow cell attachment. The cells were then incubated with ORI (90 μg/mL of ORI for PANC-1 or 30 μg/mL of ORI for BXPC-3), ORI-NPs (60 μg/mL of ORI-NPs for PANC-1 or 15 μg/mL of ORI-NPs for BXPC-3), or ORI-GPC1-NPs (30 μg/mL of ORI-GPC1-NPs for PANC-1 or 10 μg/mL of ORI-GPC1-NPs for BXPC-3) for 24 hours. The cells thus obtained were then resuspended in PBS and stained with Annexin V-FITC/PI, and the signal was acquired by a flow cytometer (BD Biosciences). Western blot assays were performed to quantitatively analyze the expression of apoptosis-related proteins after different treatments to test whether the prepared formulations affected tumor cell apoptosis. To do so, we treated cells as above and cell proteins were extracted with cell lysis solution. Protein extracts were quantified by a BCA protein assay. About 40 μg of proteins was loaded into wells of an SDS-PAGE gel and were transferred to polyvinylidene fluoride membranes. These were incubated with the caspase-3 antibody and/or bcl-2 antibody at 4°C overnight37,38 and were then incubated further with secondary antibody. β-Actin was chosen as the internal reference. Signals were obtained using an ECL chemiluminescence reagent kit.
Cell cycle assays were used to analyze the ORI-, ORI-NP-, and ORI-GPC1-NP-induced cell cycle progression. To do so, we treated the cells as above and fixed in 70% ethanol at −20°C overnight. Cells were treated with DNA staining solution, 100 μL RNase A, and 400 μL PI. Cell cycle analysis was performed using a flow cytometer (BD Biosciences).
We performed transwell migration assessments using PANC-1 and BXPC-3 cells. For this assay, 5×10⁵ cells were added to the upper chamber, the polycarbonate membranes with 5 μm pores, and the lower chamber was filled with serum-free medium containing ORI, ORI-NPs, or ORI-GPC1-NPs at the same concentration as above. After 24 hours, the cells that passed through the membrane to the lower chamber were fixed and stained with 0.1% crystal violet. Cells were counted in three random fields under a microscope at 200× magnification. All assays were performed in triplicate.
Animal study
These animal experiments were approved by and conducted in accordance with the guidelines of the animal care committee of Nanjing University of Chinese Medicine (SYXK 2014-0001). Healthy athymic BALB/C male nude mice (4 weeks; 18~22 g) were purchased from Changzhou Cavens Experimental Animal Co., Ltd (Changzhou, China) and raised under pathogen-free conditions. Mice were kept at the temperature of 25°C on a 12-hour light/12-hour dark cycle. We established the orthotopic pancreatic tumor model of nude mice by injecting BXPC-3-GFP cells (5×10⁵ per mouse) subcutaneously into the flanks of the mice. When the tumor reached 7–10 mm in diameter, tumors were harvested and cut into 1 mm3 fragments. Then the tumor fragments were transplanted into the pancreas of recipient nude mice using surgical orthotopic transplantation.39 When the tumor reached 5–10 mm in diameter, the mice were grouped for further analyses.
In vivo toxicity
Twenty heathy nude mice were randomly divided into four groups (five mice per group), each group received an intravenous injection of different agents twice a week. These agents were administered to mice as follows: 1) control group: 200 μL saline; 2) high-dose group: ORI-GPC1-NP micelles in physiological saline (200 μL, 0.5 mg/mL); 3) middle-dose group: ORI-GPC1-NP micelles in physiological saline (200 μL, 0.1 mg/mL); and 4) low-dose group: ORI-GPC1-NP micelles in physiological saline (200 μL, 0.02 mg/mL). Relative body weight was measured every 3~4 days for 21 days, and the mice were anesthetized on the 21st day after injection, and blood samples were collected for biochemical analysis.
In vivo NIR fluorescence/MRI
We assessed the multimodal imaging properties of the prepared formulations in vivo using BXPC-3 orthotropic pancreatic tumor xenograft model of nude mice. Mice were divided into two groups (six mice per group). One group was injected with ORI-NPs and another group was injected with ORI-GPC1-NPs (200 μL, 0.5 mg/mL of NPs) through a lateral tail vein. Fluorescence images were acquired with an IVIS Imaging Spectrum System (PerkinElmer Inc.) under certain parameters (excitation: 743 nm, emission: 767 nm, exposure time: 0.1 seconds). Imaging was conducted at different time points including preinjection, 12, 24, and 48 hours postinjection. After in vivo imaging, the mice were sacrificed and the tumor and organs – including liver, kidneys, spleen, stomach, intestines, heart, and lung – were harvested for ex vivo fluorescent imaging. All fluorescence images were analyzed using IVIS 3.0 Living Imaging software.
Once the mice were fully anesthetized, they were placed inside a rodent receiver coil (Chenguang Med Tech, Shanghai, China) and MRI was performed using a 3.0 T clinical MR system (Siemens). T1-weighted MR images of the mice were obtained at the predetermined time points including preinjection, 12, 24, and 48 hours postinjection, the parameters for the spin-echo sequence were TR, 482.0 ms; TE, 13.0 ms; slice thickness, 0.8 mm; matrix size, 192×192; FOV read, 60 mm; FOV phase, 100%. The T1 values of NPs within the region of interest were evaluated. For bio-distribution measurement, after imaging, we sacrificed one mouse in each group at the predetermined time points including 12, 24, and 48 hours postinjection. The tumor tissues, liver, kidney, and blood were weighted and dissolved with nitro hydrochloric acid. Then, the Au and Gd levels of tissues were investigated by inductively coupled plasma mass spectrometry (ICP-MS) test. The contents of elements were shown as the percentage of per gram of the tissue (% ID/g).
In vivo antitumor efficiency
BXPC-3 orthotopic pancreatic tumor xenograft models were randomly divided into five groups (six mice per group), each group received intravenous injection of different agents twice a week: 1) saline group; 2) GEM group (200 μL, 2.5 mg/mL of GEM);40 3) ORI group (200 μL, 21 μg/mL of ORI); 4) ORI-NP group (200 μL, 0.5 mg/mL of ORI-NPs); 5) ORI-GPC1-NP group (200 μL, 0.5 mg/mL of ORI-GPC1-NPs). The body weight of the mice and the tumor volume were evaluated both before and during treatment (every 3–4 days for 14 days). A fluorescence stereo microscope model MZ650 (Nanjing Optic Instrument Inc., Nanjing, China) equipped with GFP emission filter (excitation 563 nm, emission 582 nm) was used to monitor the tumor growth. The tumor volumes were calculated according to the equation (volume = [length×width2]/2).41 On the 14th day, the tumor and organ samples were harvested from euthanized mice and were subjected to hematoxylin and eosin (H&E) staining and immunohistochemistry (IHC) assay. For H&E staining, tissues were immobilized in 4% paraformaldehyde and were then embedded into paraffin to permit observation of pathological changes in the tissues of different groups under a light microscope. The IHC was used to verify the expression levels of apoptosis-related proteins in tumor tissues. Paraffin sections were treated with 3% hydrogen peroxide for 15 minutes at room temperature and then the staining was blocked using normal serum (diluted 1:20) for 15 minutes at room temperature. In addition, the sections were incubated with bcl-2 or casepase-3 antibodies (diluted 1:200) for 2 hours at 37°C and then further incubated with HRP-conjugated secondary antibodies for 1 hour at 37°C. The immunoreactive cells were determined using an Image-Pro Plus 6.0 imaging analysis system at 400× magnification (Media Cybernetics, Rockville, MD, USA).
Statistical analysis
Experimental data were expressed as mean and SD. Statistical analyses were performed using SPSS version 20.0 (IBM Corporation, Armonk, NY, USA). We used one-way ANOVA or two-tailed independent t-test to detect group differences. P-value <0.05 was considered statistically significant.
Results
Synthesis and characterization of ORI-GPC1-NPs
ORI@HAuNCs were successfully fabricated by the electrostatic adsorption method. Based on esterification reaction between the amino group and carboxyl group, the anti-GPC1 antibody, Gd-DOTA-NHS ester, and Cy7-NHS ester were all connected to the surface of ORI@HAuNCs (Figure 1). NP morphologies were measured by TEM. Figure 2A shows that the gold seeds grew progressively larger, and the ORI-GPC1-NPs had a nearly spherical shape and excellent dispersity. The UV absorbance curve of the supernatant after coupling was consistent with the baseline and no absorption peak was observed (Figure 2B). There were obvious peaks at 720 nm for the AuNCs, 280 nm for the anti-GPC1 antibody, and 300 nm for the DOTA, which showed that the added AuNCs, antibody, and Gd were all loaded on the NPs. The concentrations of Gd, antibody, and AuNCs were 1 mM, 10 nM and 0.5 mg/mL, respectively. The average hydrodynamic diameters of AuNCs, ORI-NPs, and ORI-GPC1-NPs were 50, 82, and 88 nm, respectively (Figure 2C). We recorded the hydrodynamic sizes of ORI-GPC1-NPs at different time points to evaluate long-term colloidal stability by DLS analysis. We found no appreciable change in the hydrodynamic size within 1 week (Figure 2D). Photographs of ORI-GPC1-NPs at different pH levels revealed that the color of the ORI-GPC1-NPs also did not have any appreciable changes (Figure 2E), further indicating that colloidal stability was high. The EDS spectrum of the ORI-GPC1-NPs confirmed the existence of the following elements: Au from the AuNCs, Gd from the Gd-DOTA-NHS ester, N and S from anti-GPC1 antibody, and F from ORI (Figure 2F). To investigate the surface charge of the prepared NPs, the surface zeta potential of the NPs was measured. The zeta potentials of different formulations (AuNCs, ORI-NPs, and ORI-GPC1-NPs) were −23.6, −14.6, and −10.2 mV, respectively (Figure S1A–C). The chemical structures of AuNCs, ORI@HAuNCs, and GPC1-ORI-NPs were evaluated by FTIR spectroscopy. The broad band around 3,400 cm−1 related to stretching vibration of remainder −NH2 group. The absorption band in 2,940 cm−1 was due to stretching vibration of C−H bond. The typical amido linkage (−CO−NH−) peak appeared around 1,650 cm−1. Compared with ORI@HAuNCs, ORI-GPC1-NPs possessed absorption band in 1,710 cm−1 attributed to the C=O bond of ester (Figure 2G). All of these FTIR spectrum changes suggested the successful formation of GPC1-ORI-NPs. The drug loading efficiency is crucial for a drug delivery system. ORI loading is defined as the weight of ORI (μg) per milligram of NCs. ORI exhibited an absorption peak at a wavelength of 243 nm on an ultraviolet spectrophotometer (Figure 2H), ORI loading efficiency was about 21%, and content was about 42 μg per milligram of AuNCs. This result demonstrated that the prepared drug delivery system held an adequate amount of ORI content.42 ORI-GPC1-NPs were successfully synthesized as a novel multifunctional theranostic nanoplatform.
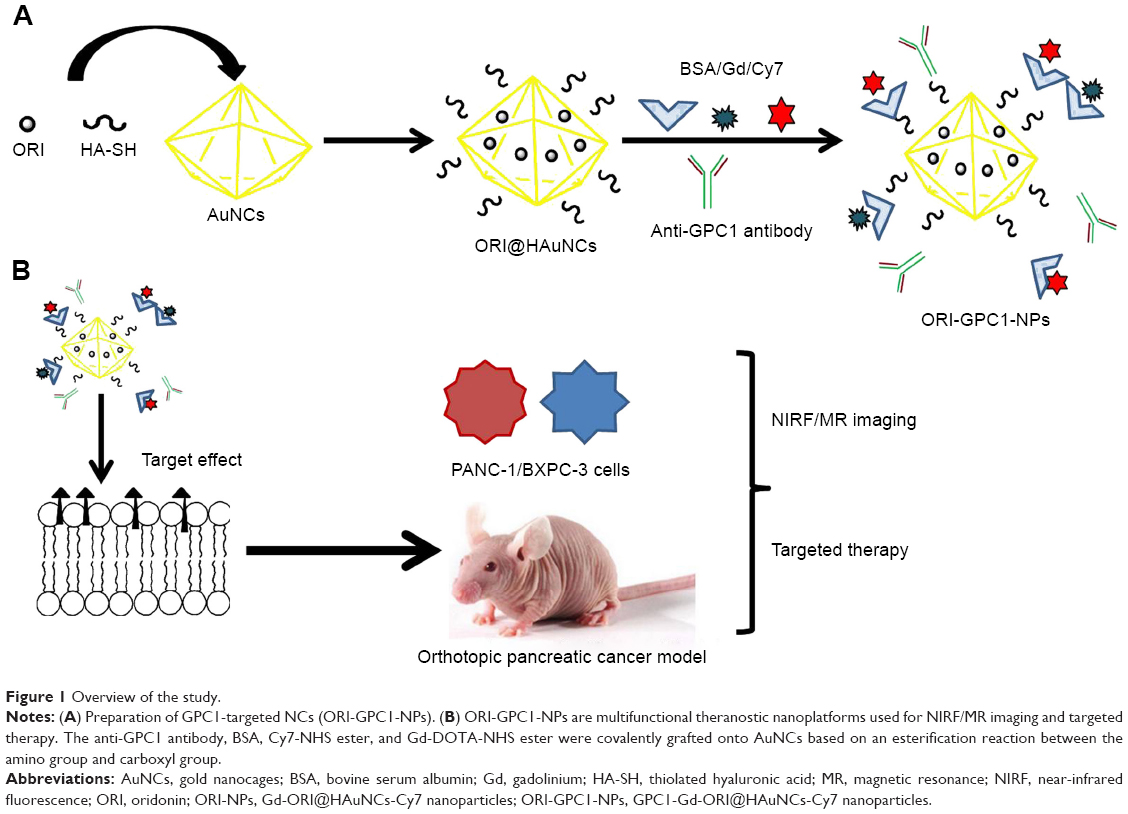 | Figure 1 Overview of the study. |
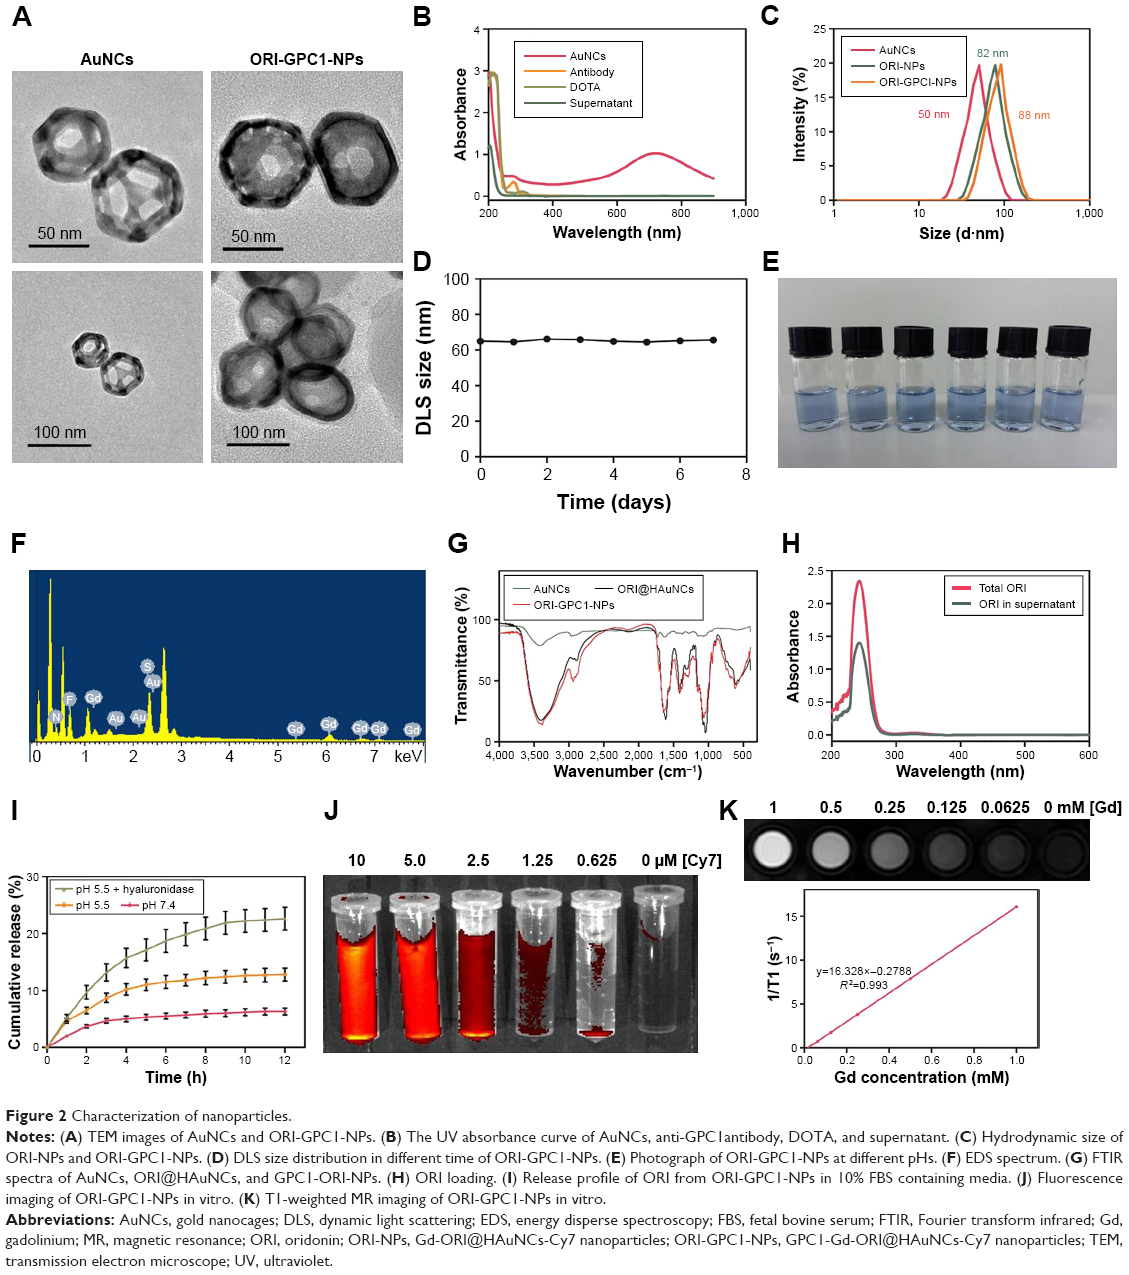 | Figure 2 Characterization of nanoparticles. |
In vitro drug release
The release profiles of ORI from ORI-GPC1-NPs in media at pH 7.4, pH 5.5, and pH 5.5+ hyaluronidase (60 U/mL) – representing blood plasma, endocytic compartments of the tumor, and microenvironment of tumor,43 respectively – are shown in Figure 2I. The release of ORI after 12 hours at pH 5.5 was 12.6%±1.1% and at pH 5.5+ hyaluronidase was 22.4%±2.0%. Both were significantly higher than that at pH 7.4 which was 5.5%±0.5%. Moreover, the release of ORI at pH 5.5+ hyaluronidase was significantly higher than that at pH 5.5. The results showed that the release of ORI from ORI-GPC1-NPs was pH- and enzyme-sensitive, likely via dissociation of the connection between AuNCs and HA-SH in the acidic and enzymatic environments.
In vitro fluorescence/MR multimodal imaging
ORI-GPC1-NPs with various Cy7 concentrations were detected by fluorescence imaging. Cy7 concentration-dependent fluorescent intensity was observed (Figure 2J), indicating that the final formulation could be used as a fluorescent imaging contrast agent. We performed MRI for ORI-GPC1-NPs agents. The T1-weighted imaging intensity increased with the increase of Gd concentration (Figure 2K). The ORI-GPC1-NPs showed a linear dependency of the 1/T1 values on Gd concentration with r1 relativity values of 16.328 mM−1s−1. The results demonstrated that our NPs could be used as MR contrast agents.
PCR and flow cytometry analysis of GPC1 expression in cell lines
The expression of GPC1 mRNA in PANC-1, BXPC-3, SW1990, and 293 T cells was determined using PCR. 293 T cells showed very low expression of GPC1. The expression of GPC1 in all three pancreatic cancer cell lines (PANC-1, BXPC-3, and SW1990) was higher than that in 293 T cells (PANC-1, 27.17±3.97-fold; BXPC-3, 21.34±2.13-fold; and SW1990, 15.91±0.62-fold, Figure 3A).
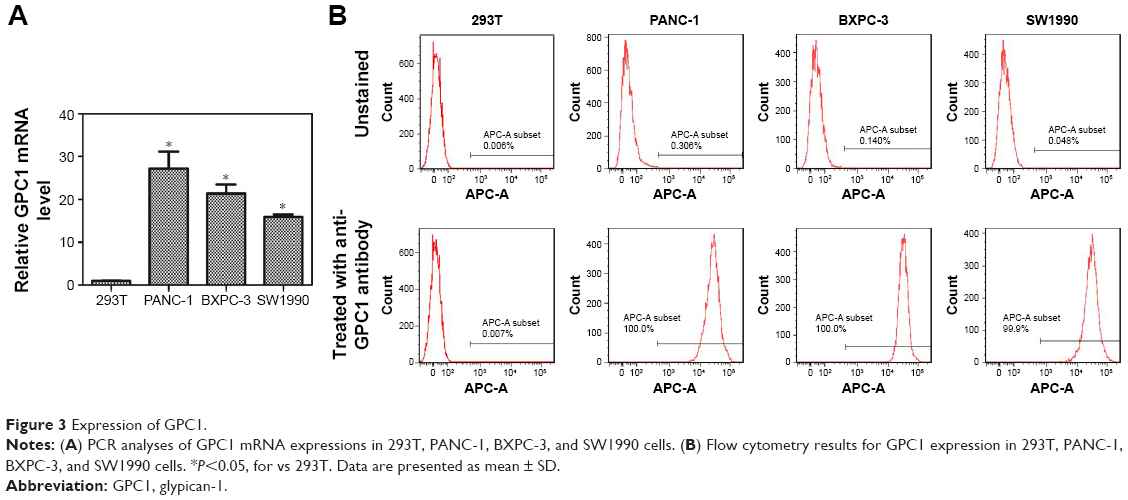 | Figure 3 Expression of GPC1. |
Flow cytometry assay further showed the positive expression of GPC1 in PANC-1, BXPC-3, and SW1990 cells, but negative expression in 293 T cells (Figure 3B). Thus, considering the proliferation rate of cells, PANC-1 and BXPC-3 cells were selected for in vitro studies; and BXPC-3-GFP cells were selected for in vivo model studies.
Cellular uptake of ORI-GPC1-NPs
Subsequently, we assessed the cellular uptake of ORI-GPC1-NPs in PANC-1, BXPC-3, and 293 T cells using bio-TEM. At higher magnification, ORI-GPC1-NP samples were found in PANC-1 and BXPC-3 cells (overexpressing GPC1) after 6 hours of incubation, and many were trapped in cytoplasm vesicles, such as lysosomes or endosomes (Figure 4A, red arrows). ORI-GPC1-NP samples could not be found in 293 T cells (negative GPC1). These results suggest that ORI-GPC1-NPs have a high affinity for GPC1 overexpressing cancer cells and indicate that the anti-GPC1 antibody can enhance the cellular uptake of ORI-GPC1-NPs through the antigen-antibody-mediated endocytosis process effectively.
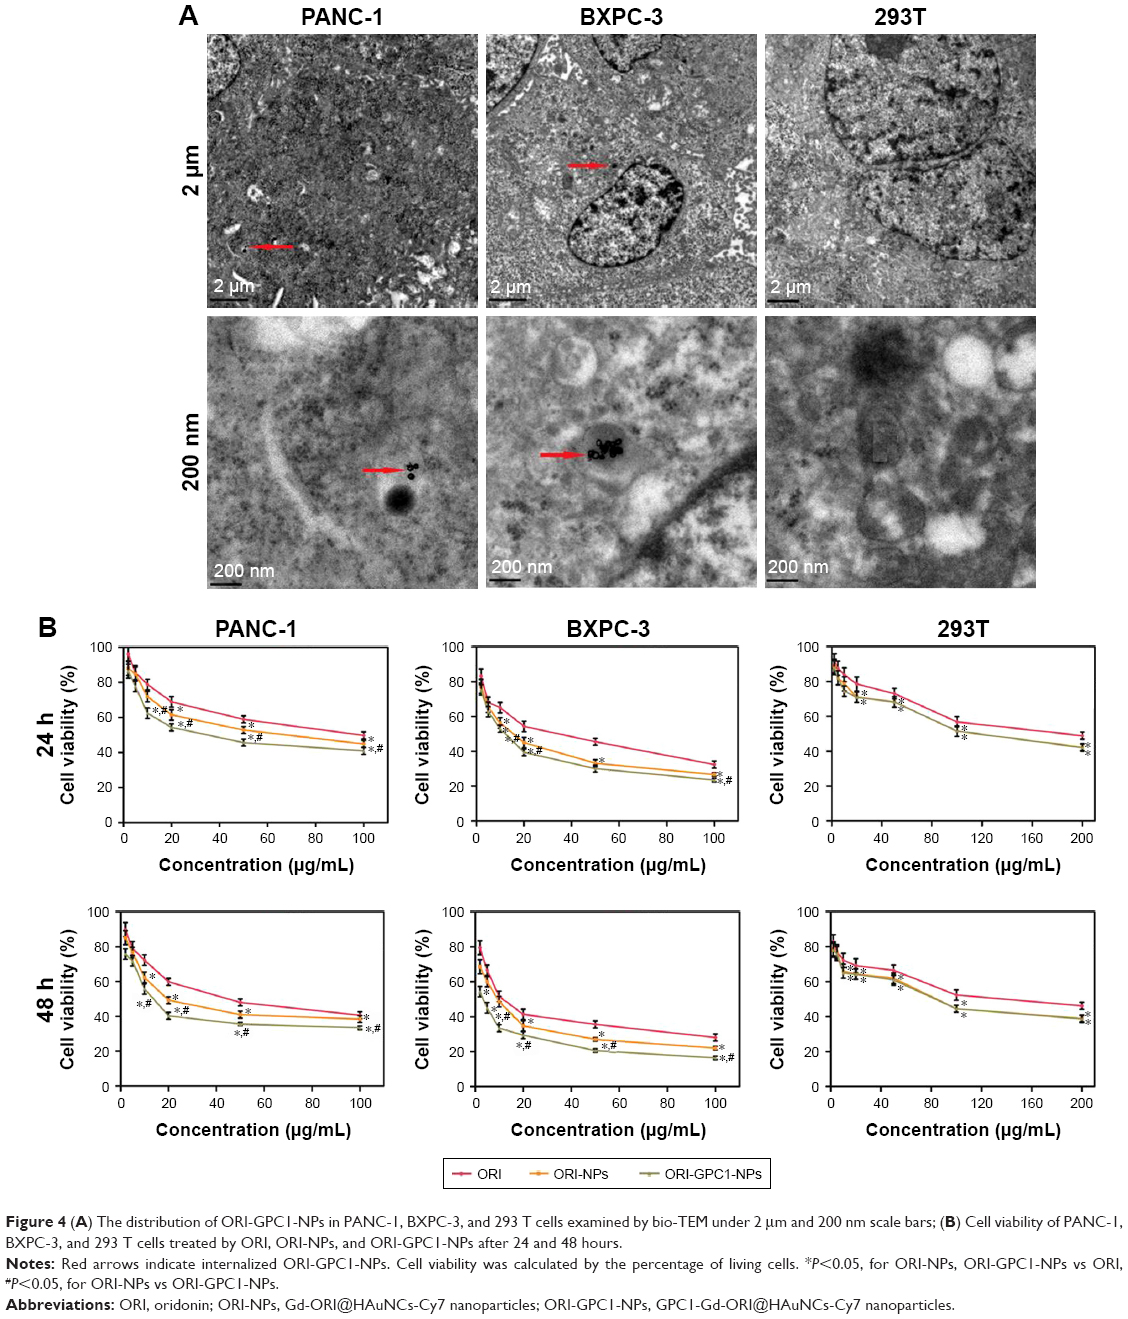 | Figure 4 (A) The distribution of ORI-GPC1-NPs in PANC-1, BXPC-3, and 293 T cells examined by bio-TEM under 2 μm and 200 nm scale bars; (B) Cell viability of PANC-1, BXPC-3, and 293 T cells treated by ORI, ORI-NPs, and ORI-GPC1-NPs after 24 and 48 hours. |
ORI-GPC1-NPs inhibited cell viability
In PANC-1 and BXPC-3 cells, compared with ORI-NPs, ORI-GPC1-NPs demonstrated significant inhibited cell viability. In 293 T cells, there was no significant difference between ORI-GPC1-NPs and ORI-NPs (Figure 4B). As shown in Table 1, the IC50 of ORI-GPC1-NPs in PANC-1 was twofold after 24 hours and twofold after 48 hours compared with ORI-NPs. In BXPC-3, IC50 of ORI-GPC1-NPs was onefold after 24 hours and threefold after 48 hours compared with ORI-NPs. Both ORI-GPC1-NPs and ORI-NPs showed less inhibition against normal 293 T cells which may be due to low expression of GPC1 and lower metabolic rate. In our study, ORI-GPC1-NPs showed limited inhibition to normal cells, and relatively higher targeted inhibition against cancerous cells than ORI and ORI-NPs in a time- and dose-dependent manner, which could lead to improvement in their therapeutic efficacy. These results indicate that the targeted NPs (ORI-GPC1-NPs) require lower concentrations compared with the non-targeted NPs (ORI-NPs) to inhibit GPC1 overexpressing cancer cells.
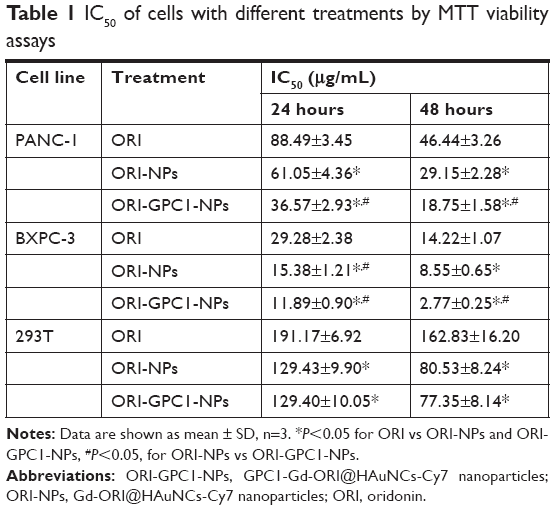 | Table 1 IC50 of cells with different treatments by MTT viability assays |
Apoptosis analysis, cell cycle assay, and migration study
The apoptosis rate in ORI-GPC1-NP group was much greater than that in the control, ORI, and ORI-NP groups (Figure 5A). We observed downregulation in the expression of bcl-2 and upregulation in the expression of cleaved-caspase-3 in cells with different treatments (Figure 5B). ORI-GPC1-NPs showed greater efficacy in promoting cleaved-caspase-3 and inhibition of bcl-2 expression compared to control, ORI, and ORI-NPs. Relative to the control group, treatment with ORI-GPC1-NPs resulted in a greater proportion of cells in the G1 phase (Figure 5C and D). The migration abilities of PANC-1 and BXPC-3 cells were significantly inhibited after ORI-GPC1-NPs treatment, relative to control, ORI, and ORI-NP treatment (Figure 5E and F).
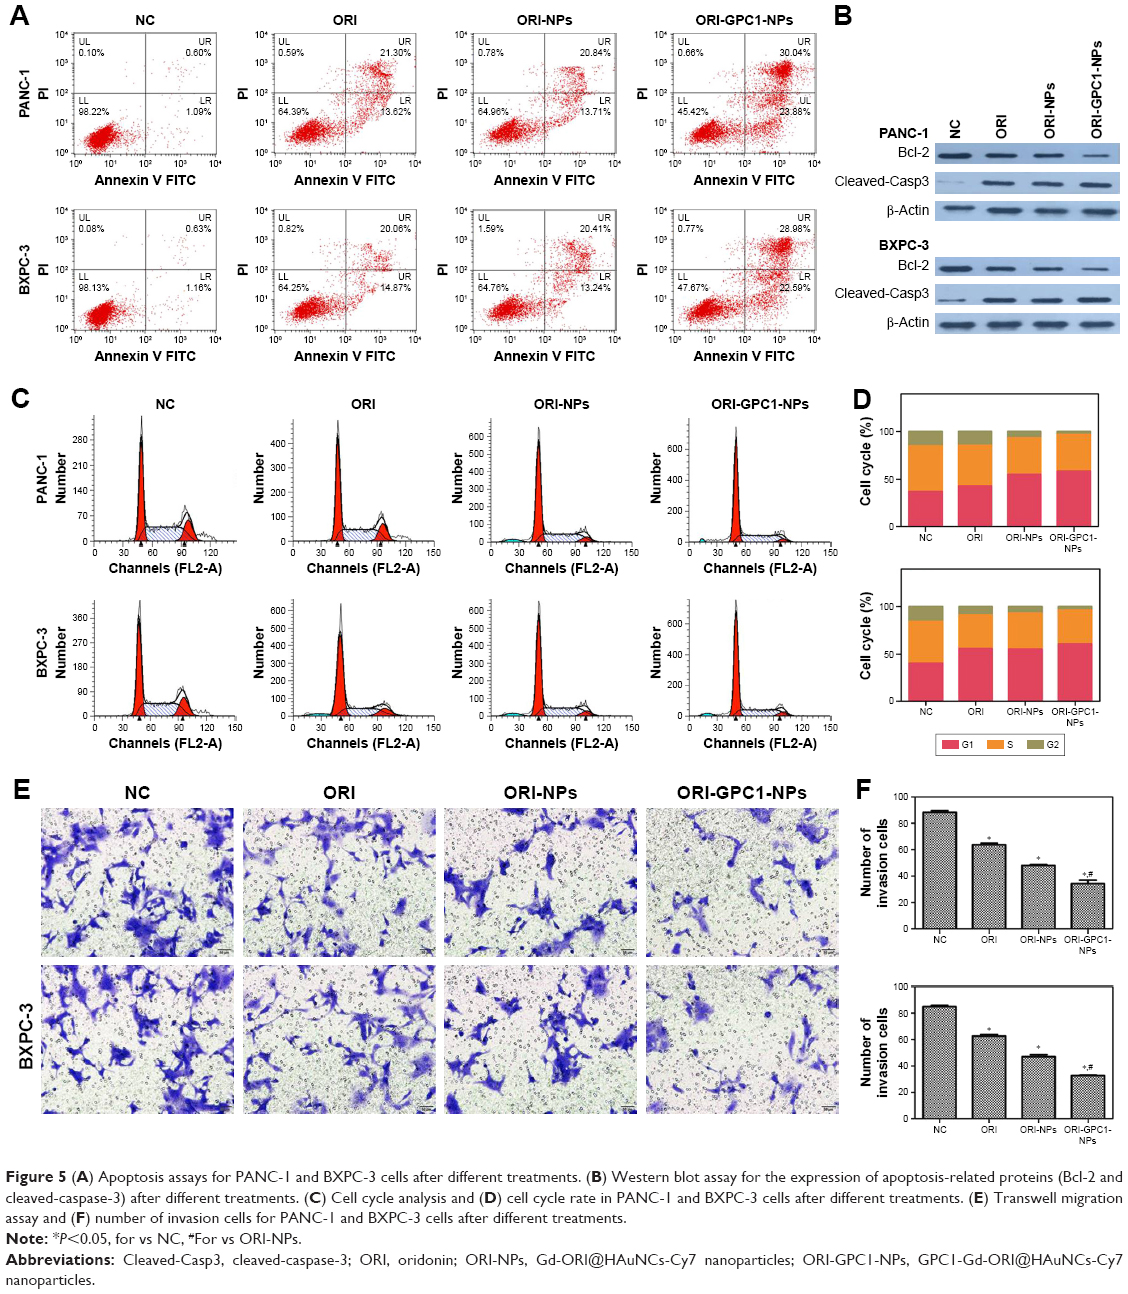 | Figure 5 (A) Apoptosis assays for PANC-1 and BXPC-3 cells after different treatments. (B) Western blot assay for the expression of apoptosis-related proteins (Bcl-2 and cleaved-caspase-3) after different treatments. (C) Cell cycle analysis and (D) cell cycle rate in PANC-1 and BXPC-3 cells after different treatments. (E) Transwell migration assay and (F) number of invasion cells for PANC-1 and BXPC-3 cells after different treatments. |
In vivo toxicology assay
No significant changes in body weight were observed during the study (Figure S2A). Compared to the saline group, the RBC (Figure S2B), hemoglobin (Figure S2C), WBC, lymphocyte (Figure S2D), liver (Figure S2E), and kidney (Figure S2F) function markers remained within the normal range over the observation period in different doses of ORI-GPC1-NP groups. The formulations did not cause any adverse effects.
In vivo NIRF/MRI
We verified the multimodal imaging effect of ORI-GPC1-NPs in vivo. First, we observed the time-dependent biodistribution of ORI-GPC1-NPs from in vivo NIRF images (Figure 6A). NIRF signal of the ORI-NP group reached peak intensity at 12 hours postinjection (Figure 6B). These signals gradually diminished as time passed, and nearly disappeared after 48 hours. For the ORI-GPC1-NPs group, NIRF signals were also detected in the tumor 12 hours after injection. These signals gradually increased and reached peak intensity at 24 hours postinjection. The tumor fluorescence intensity remained steady even 48 hours after injection. The biodistribution of the NPs in tumor and major organs was assessed by performing ex vivo semiquantitative NIRF intensity detection. After 48 hours, ex vivo fluorescence images showed that there was a higher accumulation of the NPs in ORI-GPC1-NP group than in the ORI-NP group, both in tumors and most organs (Figure 6C), which may be due to the GPC1-medicated active target effect. The accumulation of ORI-GPC1-NPs was in the following order: liver > tumor > kidneys > intestines. Fluorescence in other organs nearly could not be detected (Figure 6D).
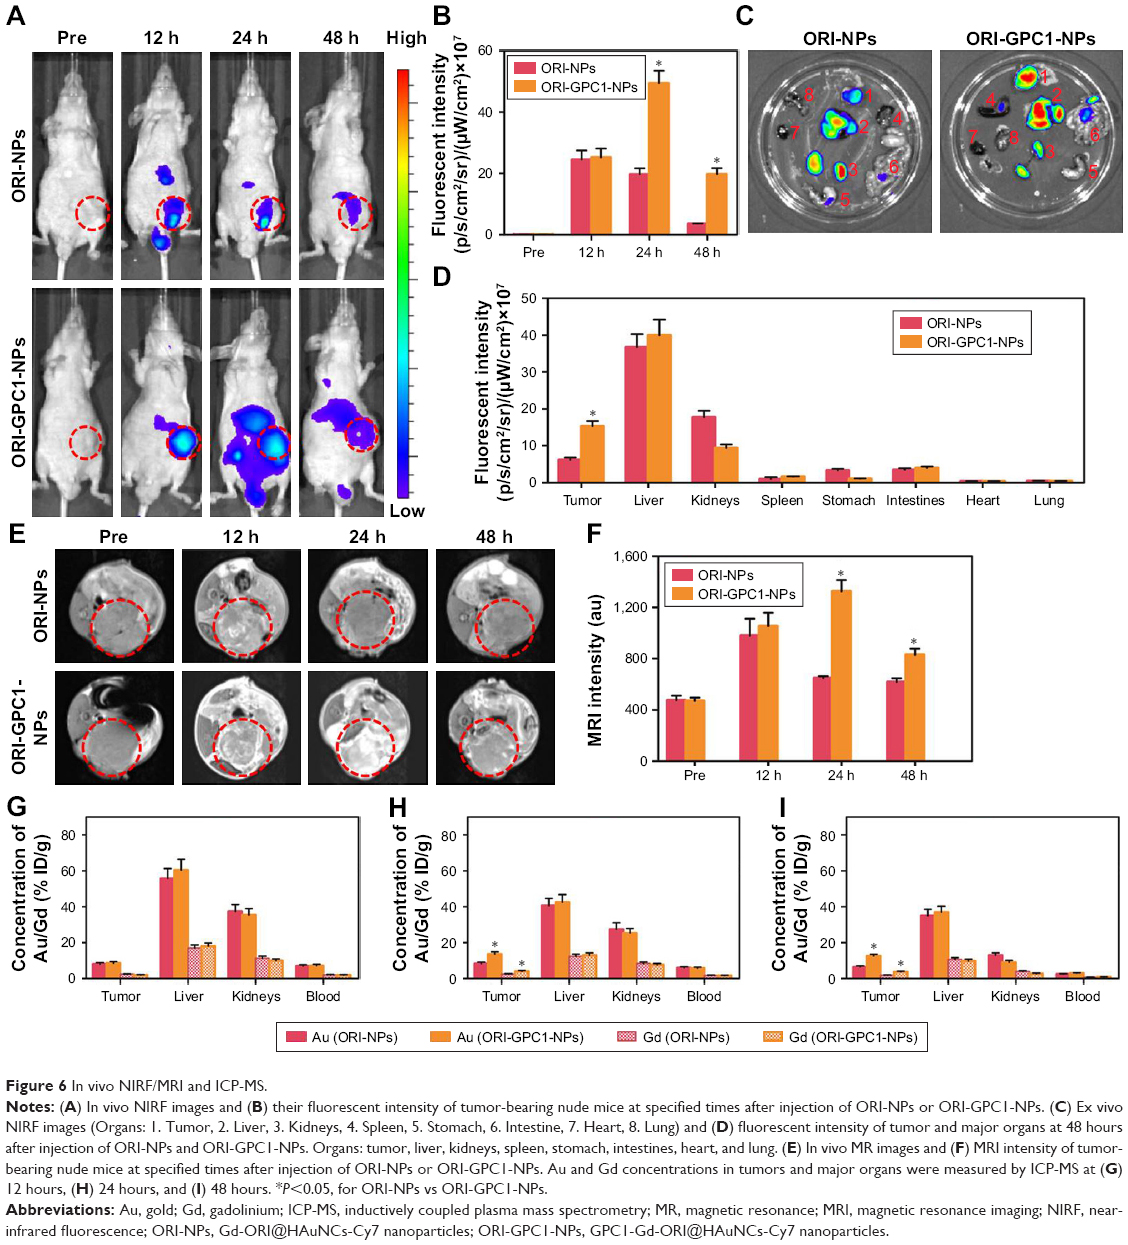 | Figure 6 In vivo NIRF/MRI and ICP-MS. |
To further verify the targeted ability of ORI-GPC1-NPs, in vivo MRI experiments were conducted before and after NP injection. As shown in Figure 6E, the MRI signals of tumor region in the ORI-GPC1-NP group and ORI-NP group reached their peak intensity at 24 and 12 hours postinjection, respectively, and the signal gradually diminished as time passed. The higher T1 value in ORI-GPC1-NP group at 24 and 48 hours postinjection compared to ORI-NP group demonstrated the GPC1-mediated targeting ability of NPs to the tumor site (Figure 6F). Moreover, the relative T1 value of the ORI-GPC1-NP group remained high 48 hours after injection, which further confirmed a higher ORI-GPC1-NP accumulation in tumor compared to ORI-NPs. Thus, ORI-GPC1-NPs may evolve as promising targeted MRI NPs for pancreatic cancer screening.
The Au and Gd contents in tissue samples were measured by ICP-MS. As shown Figure 6G, at 12 hours postinjection, the accumulation of Au in the liver (reticuloendothelial systems) is dramatic. The accumulation in the kidney may be due to the excretion of NPs. At 24 hours postinjection, the accumulation of Au in the tumors in ORI-GPC1-NP group reached a peak and was significantly higher than that of ORI-NP group, which was consistent with the optical and MRI study (Figure 6H). However, at 48 hours postinjection, the Au accumulation in the tumors and major organs decreased, presumably due to clearance of the NPs through the liver and kidneys (Figure 6I). Moreover, no significant differences in the distribution of Au and Gd were detected, further verifying the ideal stability of ORI-GPC1-NPs.
In vivo antitumor efficiency
We examined the in vivo antitumor efficacy of ORI-GPC1-NPs using BXPC-3 orthotopic pancreatic tumor xenograft models. The targeted NPs (ORI-GPC1-NPs) were compared with four controls: untargeted NPs (ORI-NPs), ORI, a positive chemotherapy drug (GEM), and saline via tail-vein injection. The body weight of mice in different treatment groups did not significantly change over the course of the experimental time period (Figure 7A), which indicated no systemic toxic response in the mice. The tumors grew rapidly in both the saline and ORI-NP groups. The GEM and ORI inhibited tumor growth to some extent. The ORI-GPC1-NPs had the strongest inhibitory effect on tumor growth. The tumor volume in this group was much smaller than that in the saline group (Figure 7B). On the last day, tumors and major organ tissues (liver and kidney, according to ex vivo fluorescence images) were harvested from mice and weighed. As shown in Figure 7C, the tumor weight of the ORI-GPC1-NP group was lighter than that of the other groups, which is consistent with the assessments of tumor volume (Figure 7B and D). H&E staining demonstrated that the structure of the tumor tissue in the ORI-GPC1-NP group suffered more obvious damage than the other groups; this damage included irregular widening intercellular spaces.41 No obvious major organ damage was observed in any major organ tested (Figure S3), showing that ORI-GPC1-NPs have negligible toxic side effects.
 | Figure 7 In vivo antitumor efficiency. |
We observed reduced expression of bcl-2 and enhanced expression of cleaved-caspase-3 in tumor tissues after different treatments (Figure 7E). ORI-GPCA-NPs showed the greatest efficacy in modulating the expression levels of these proteins relative to GEM, ORI, or ORI-NPs (Figure 7F and G). These results indicated that ORI-GPC1-NPs could inhibit tumor growth.
Discussion and conclusion
Much effort has been made to develop a multifunctional theranostic nanoplatform for diagnosis and treatment of pancreatic cancer.44–46 In this study, we successfully constructed ORI-loaded HA-bioinspired anti-GPC1 antibody, Gd and Cy7 hybrid-functionalized hollow AuNCs (ORI-GPC1-NPs). ORI-GPC1-NPs have several valuable features, including good biocompatibility, potential for multimodal imaging, controllable drug release, effective treatment against tumors, few side effects, and high bioavailability.
Most NP delivery to tumor tissue is hindered due to poor uptake.47 NPs with the hydrodynamic size in the 10–100 nm range have a long blood circulation time, easily pass the leaky vasculature in tumors, and are suitable for drug delivery in cancer diagnosis and therapy.48 In this study, the hydrodynamic size of ORI-GPC1-NPs was 88 nm, which allowed them to reach the tumor site. The potential of NPs is related to their nonspecific binding of proteins and clearance by reticuloendothelial system.49 Negatively charged NPs tend to bind to plasma proteins to a lesser degree than positively charged NPs, and high protein binding leads to more rapid clearance of NPs by Kupffer cells.50 The zeta potential of our formulations (AuNCs, ORI-NPs, and ORI-GPC1-NPs) were −23.6, −14.6, and −10.2 mV, respectively. These NPs have optimal potentials, which are suitable for in vivo applications. The potential differences between these NPs may indicate the successful binding of ORI, Cy7, Gd, and anti-GPC1 antibody with AuNCs. Drug release assays highlighted how the NPs have pH- and enzyme-controlled sustained drug release. This result demonstrates that the developed drug delivery system is capable of being controlled in the tumor microenvironment; this can decrease the side effects of ORI in normal tissues.
Rapid clearance rate is an obstacle in multifunctional theranostic nanoplatform, with a half-life of only a few hours.4,51 To overcome this obstacle, we used anti-GPC1 antibody to modify the NPs.52 The anti-GPC1 antibody modification significantly improves the NP cycle time, while promoting NP accumulation at the tumor site.53 Relative to the non-targeted NPs (ORI-NPs), the GPC1-targeted NPs (ORI-GPC1-NPs) showed significantly higher cellular uptake. MTT assays, apoptosis analyses, cell cycle assays, and migration assessments all revealed remarkably efficient therapeutic effects in vitro. Enhanced antitumor efficiency of ORI-GPC1-NPs may be due to antigen-antibody mediated endocytosis.54,55 Relative to the ORI-NPs or ORI, high expression of GPC1 on the pancreatic cancer cells enabled more cellular uptake of the ORI-GPC1-NPs.
Among the many modalities of molecular imaging, including NIRF, MR, photoacoustic, positron emission tomography, and ultrasound imaging, NIRF and MR are most widely used.5 Each imaging modality has its advantages and limitations. NIRF imaging is sensitive, but has poor tissue penetration and low spatial resolution.56 MRI has an ideal spatial resolution but suffers from poor sensitivity.57 In this study, we assembled the ORI-GPC1-NPs for a combination of NIRF and MRI. In vitro and in vivo NIRF/MRI experiments demonstrated that ORI-GPC1-NPs can act as suitable contrast agents for NIRF/MR multimodal imaging. They combine the advantages of each imaging modality in one platform with higher sensitivity and resolution and thus provide comprehensive information of different aspects of pancreatic cancer. The significant enhancement in the fluorescent intensity and T1 value of the ORI-GPC1-NP group demonstrates higher tumor accumulation and longer blood circulation time than ORI-NP group due to the GPC1-targeted effects. Bio-distribution of NP demonstrates its metabolism and accumulation.58 The ICP-MS assay revealed that the accumulation of Au in the liver was dramatic and the accumulation of Au in the tumors of ORI-GPC1-NP group was significantly higher than that of ORI-NP group. The results demonstrate that ORI-GPC1-NPs mainly accumulate in tissues containing relatively high levels of endocytosis, and anti-GPC1 antibody conjugated on the NPs has a satisfactory active targeting ability. In vivo toxicology assay was the convincing evidence that the synthesized ORI-NPs/OPI-GPC1-NPs were biocompatible in vivo and could be used in further tests. In vivo antitumor experiments revealed that the GPC1-ORI-NPs inhibit tumor volume growth significantly better than any other treatment studied here.
There were several limitations in this study. First, AuNCs could be used for computed tomography imaging, but due to concentration limitations, we did not conduct such experiment.59 Second, pancreatic tumor tissue volume may limit the NIR imaging modality used in humans. Third, the diameter of the tumors reached 5–10 mm in our study. It is not clear if these tumors in the early stage of pancreatic cancer. Fourth, HA belongs to glycosaminoglycan, we did not accurately measure the conjugation efficiency of HA on NPs. In future research, we will explore the methods to resolve these limitations. Nonetheless, our ORI-GPC1-NP possess several unique advantages: 1) the ORI-GPC1-NPs show high biocompatibility and suitable stability under physiological conditions; 2) the hollow inner space of the AuNCs enables relatively large amounts of ORI loading; 3) the HA coating not only provides multiple attachment sites but also enables pH- and enzyme-controlled release of the drug; 4) the attachment of the anti-GPC1 antibody allows for the selective accumulation of prepared NPs at the tumor site with fewer side effects on healthy tissues; and 5) relative to single-modal imaging, dual-modal imaging provides more accurate information.
We conclude that, overall, the proposed multifunctional GPC1-targeted NPs showed the selective accumulation in pancreatic tumors by NIRF/MRI and targeted therapy in a preclinical model. Our results suggest that this multifunctional theranostic nanoplatform may open new avenues for early diagnosis and targeted treatment of pancreatic cancer.
Acknowledgment
This work is supported by the National Natural Science Foundation of China (Grant Nos 81471705, 81771899) and Primary Research & Development Plan of Jiangsu Province (BE2017772).
Disclosure
The authors report no conflicts of interest in this work.
References
Yang JJ, Hu ZG, Shi WX, Deng T, He SQ, Yuan SG. Prognostic significance of neutrophil to lymphocyte ratio in pancreatic cancer: a meta-analysis. World J Gastroenterol. 2015;21(9):2807–2815. | ||
Ham H, Kim SG, Kwon HJ, Ha H, Choi YY. Distal pancreatectomy with celiac axis resection for pancreatic body and tail cancer invading celiac axis. Ann Surg Treat Res. 2015;89(4):167–175. | ||
Torgeson A, Garrido-Laguna I, Tao R, Cannon GM, Scaife CL, Lloyd S. Value of surgical resection and timing of therapy in patients with pancreatic cancer at high risk for positive margins. ESMO Open. 2018;3(1):e000282. | ||
Deng L, Cai X, Sheng D, et al. A Laser-Activated Biocompatible Theranostic Nanoagent for Targeted Multimodal Imaging and Photothermal Therapy. Theranostics. 2017;7(18):4410–4423. | ||
Chen X, Zhou H, Li X, et al. Plectin-1 Targeted Dual-modality Nanoparticles for Pancreatic Cancer Imaging. EBioMedicine. 2018;30:129–137. | ||
Zhang R, Liu Y, Hammache K, et al. The role of FADD in pancreatic cancer cell proliferation and drug resistance. Oncol Lett. 2017;13(3):1899–1904. | ||
Sheng W, Dong M, Chen C, et al. Cooperation of Musashi-2, Numb, MDM2, and P53 in drug resistance and malignant biology of pancreatic cancer. FASEB J. 2017;31(6):2429–2438. | ||
Jiao Y, Sun Y, Tang X, Ren Q, Yang W. Tumor-Targeting Multifunctional Rattle-Type Theranostic Nanoparticles for MRI/NIRF Bimodal Imaging and Delivery of Hydrophobic Drugs. Small. 2015;11(16):1962–1974. | ||
Kramer-Marek G, Gore J, Korc M. Molecular imaging in pancreatic cancer – a roadmap for therapeutic decisions. Cancer Lett. 2013;341(2):132–138. | ||
Polasek M, Yang Y, Schühle DT, et al. Molecular MR imaging of fibrosis in a mouse model of pancreatic cancer. Sci Rep. 2017;7(1):8114. | ||
Wang Y, Liu Y, Luehmann H, et al. Evaluating the pharmacokinetics and in vivo cancer targeting capability of Au nanocages by positron emission tomography imaging. ACS Nano. 2012;6(7):5880–5888. | ||
Szymanski P, Mahmoud MA, O’Neil D, Garlyyev B, El-Sayed MA. Electronic and vibrational dynamics of hollow au nanocages embedded in cu2 o shells. Photochem Photobiol. 2015;91(3):599–606. | ||
Zhu DM, Xie W, Xiao YS, et al. Erythrocyte membrane-coated gold nanocages for targeted photothermal and chemical cancer therapy. Nanotechnology. 2018;29(8):084002. | ||
Pang B, Yang X, Xia Y. Putting gold nanocages to work for optical imaging, controlled release and cancer theranostics. Nanomedicine (Lond). 2016;11(13):1715–1728. | ||
Imanparast A, Bakhshizadeh M, Salek R, Sazgarnia A. Pegylated hollow gold-mitoxantrone nanoparticles combining photodynamic therapy and chemotherapy of cancer cells. Photodiagnosis Photodyn Ther. 2018;23:295–305. | ||
Cho N, Han W, Han BK, et al. Breast Cancer Screening With Mammography Plus Ultrasonography or Magnetic Resonance Imaging in Women 50 Years or Younger at Diagnosis and Treated With Breast Conservation Therapy. JAMA Oncol. 2017;3(11):1495–1502. | ||
Deng L, Ke X, He Z, et al. A MSLN-targeted multifunctional nanoimmunoliposome for MRI and targeting therapy in pancreatic cancer. Int J Nanomedicine. 2012;7:5053–5065. | ||
Wang L, An Y, Yuan C, et al. GEM-loaded magnetic albumin nanospheres modified with cetuximab for simultaneous targeting, magnetic resonance imaging, and double-targeted thermochemotherapy of pancreatic cancer cells. Int J Nanomedicine. 2015;10:2507–2519. | ||
Jaidev LR, Chellappan DR, Bhavsar DV, et al. Multi-functional nanoparticles as theranostic agents for the treatment & imaging of pancreatic cancer. Acta Biomater. 2017;49:422–433. | ||
Li C, Du X, Tai S, et al. GPC1 regulated by miR-96-5p, rather than miR-182-5p, in inhibition of pancreatic carcinoma cell proliferation. Int J Mol Sci. 2014;15(4):6314–6327. | ||
Diamandis EP, Plebani M. Glypican-1 as a highly sensitive and specific pancreatic cancer biomarker. Clin Chem Lab Med. 2016;54(1):e1–e2. | ||
Herreros-Villanueva M, Bujanda L. Glypican-1 in exosomes as biomarker for early detection of pancreatic cancer. Ann Transl Med. 2016;4(4):64. | ||
Melo SA, Luecke LB, Kahlert C, et al. Glypican-1 identifies cancer exosomes and detects early pancreatic cancer. Nature. 2015;523(7559):177–182. | ||
Gao S, Tan H, Zhu N, et al. Oridonin induces apoptosis through the mitochondrial pathway in human gastric cancer SGC-7901 cells. Int J Oncol. 2016;48(6):2453–2460. | ||
Yang IH, Shin JA, Lee KE, Kim J, Cho NP, Cho SD. Oridonin induces apoptosis in human oral cancer cells via phosphorylation of histone H2AX. Eur J Oral Sci. 2017;125(6):438–443. | ||
Xia S, Zhang X, Li C, Guan H. Oridonin inhibits breast cancer growth and metastasis through blocking the Notch signaling. Saudi Pharm J. 2017;25(4):638–643. | ||
Gui Z, Luo F, Yang Y, Shen C, Li S, Xu J. Oridonin inhibition and miR200b3p/ZEB1 axis in human pancreatic cancer. Int J Oncol. 2017;50(1):111–120. | ||
Ding C, Zhang Y, Chen H, et al. Novel nitrogen-enriched oridonin analogues with thiazole-fused A-ring: protecting group-free synthesis, enhanced anticancer profile, and improved aqueous solubility. J Med Chem. 2013;56(12):5048–5058. | ||
Bothra S, Babu LT, Paira P, Ashok Kumar SK, Kumar R, Sahoo SK. A biomimetic approach to conjugate vitamin B6 cofactor with the lysozyme cocooned fluorescent AuNCs and its application in turn-on sensing of zinc(II) in environmental and biological samples. Anal Bioanal Chem. 2018;410(1):201–210. | ||
Yan H, Song J, Jia X, Zhang Z. Hyaluronic acid-modified didecyldimethylammonium bromide/d-a-tocopheryl polyethylene glycol succinate mixed micelles for delivery of baohuoside I against non-small cell lung cancer: in vitro and in vivo evaluation. Drug Deliv. 2017;24(1):30–39. | ||
Jin Y, Ma X, Feng S, et al. Hyaluronic Acid Modified Tantalum Oxide Nanoparticles Conjugating Doxorubicin for Targeted Cancer Theranostics. Bioconjug Chem. 2015;26(12):2530–2541. | ||
Liu HN, Guo NN, Wang TT, et al. Mitochondrial Targeted Doxorubicin-Triphenylphosphonium Delivered by Hyaluronic Acid Modified and pH Responsive Nanocarriers to Breast Tumor: in Vitro and in Vivo Studies. Mol Pharm. 2018;15(3):882–891. | ||
You Q, Sun Q, Yu M, et al. BSA-Bioinspired Gadolinium Hybrid-Functionalized Hollow Gold Nanoshells for NIRF/PA/CT/MR Quadmodal Diagnostic Imaging-Guided Photothermal/Photodynamic Cancer Therapy. ACS Appl Mater Interfaces. 2017;9(46):40017–40030. | ||
Agrahari V, Meng J, Ezoulin MJ, et al. Stimuli-sensitive thiolated hyaluronic acid based nanofibers: synthesis, preclinical safety and in vitro anti-HIV activity. Nanomedicine. 2016;11(22):2935–2958. | ||
Luo Y, Wang X, Du D, Lin Y. Hyaluronic acid-conjugated apoferritin nanocages for lung cancer targeted drug delivery. Biomater Sci. 2015;3(10):1386–1394. | ||
Ghorbani M, Bigdeli B, Jalili-Baleh L, et al. Curcumin-lipoic acid conjugate as a promising anticancer agent on the surface of gold-iron oxide nanocomposites: A pH-sensitive targeted drug delivery system for brain cancer theranostics. Eur J Pharm Sci. 2018;114:175–188. | ||
Liu Y, Shi QF, Qi M, Tashiro S, Onodera S, Ikejima T. Interruption of hepatocyte growth factor signaling augmented oridonin-induced death in human non-small cell lung cancer A549 cells via c-met-nuclear factor-κB-cyclooxygenase-2 and c-Met-Bcl-2-caspase-3 pathways. Biol Pharm Bull. 2012;35(7):1150–1158. | ||
Sun Z, Han Q, Duan L, Yuan Q, Wang H. Oridonin increases anticancer effects of lentinan in HepG2 human hepatoblastoma cells. Oncol Lett. 2018;15(2):1999–2005. | ||
Lwin TM, Murakami T, Miyake K, et al. Tumor-Specific Labeling of Pancreatic Cancer Using a Humanized Anti-CEA Antibody Conjugated to a Near-Infrared Fluorophore. Ann Surg Oncol. 2018;25(4):1079–1085. | ||
Mohammad J, Dhillon H, Chikara S, et al. Piperlongumine potentiates the effects of gemcitabine in in vitro and in vivo human pancreatic cancer models. Oncotarget. 2018;9(12):10457–10469. | ||
Dou Y, Li X, Yang W, et al. PB@Au Core-Satellite Multifunctional Nanotheranostics for Magnetic Resonance and Computed Tomography Imaging in Vivo and Synergetic Photothermal and Radiosensitive Therapy. ACS Appl Mater Interfaces. 2017;9(2):1263–1272. | ||
Muthu MS, Kutty RV, Luo Z, Xie J, Feng SS. Theranostic vitamin E TPGS micelles of transferrin conjugation for targeted co-delivery of docetaxel and ultra bright gold nanoclusters. Biomaterials. 2015;39:234–248. | ||
Kultti A, Zhao C, Singha NC, et al. Accumulation of extracellular hyaluronan by hyaluronan synthase 3 promotes tumor growth and modulates the pancreatic cancer microenvironment. Biomed Res Int. 2014;2014:817613. | ||
Han H, Wang J, Chen T, Yin L, Jin Q, Ji J. Enzyme-sensitive gemcitabine conjugated albumin nanoparticles as a versatile theranostic nanoplatform for pancreatic cancer treatment. J Colloid Interface Sci. 2017;507:217–224. | ||
Zhou H, Qian W, Uckun FM, et al. IGF1 Receptor Targeted Theranostic Nanoparticles for Targeted and Image-Guided Therapy of Pancreatic Cancer. ACS Nano. 2015;9(8):7976–7991. | ||
Aghevlian S, Lu Y, Winnik MA, Hedley DW, Reilly RM. Panitumumab Modified with Metal-Chelating Polymers (MCP) Complexed to (111) In and (177) Lu-An EGFR-Targeted Theranostic for Pancreatic Cancer. Mol Pharm. 2018;15(3):1150–1159. | ||
Jain RK, Stylianopoulos T. Delivering nanomedicine to solid tumors. Nat Rev Clin Oncol. 2010;7(11):653–664. | ||
Wong RM, Gilbert DA, Liu K, Louie AY. Rapid size-controlled synthesis of dextran-coated, 64Cu-doped iron oxide nanoparticles. ACS Nano. 2012;6(4):3461–3467. | ||
Chao Y, Karmali PP, Mukthavaram R, et al. Direct recognition of superparamagnetic nanocrystals by macrophage scavenger receptor SR-AI. ACS Nano. 2013;7(5):4289–4298. | ||
Pelegri-O’Day EM, Lin EW, Maynard HD. Therapeutic protein-polymer conjugates: advancing beyond PEGylation. J Am Chem Soc. 2014;136(41):14323–14332. | ||
Jaque D, Martínez Maestro L, del Rosal B, et al. Nanoparticles for photothermal therapies. Nanoscale. 2014;6(16):9494–9530. | ||
Perrault SD, Walkey C, Jennings T, Fischer HC, Chan WC. Mediating tumor targeting efficiency of nanoparticles through design. Nano Lett. 2009;9(5):1909–1915. | ||
Liu F, Le W, Mei T, et al. In vitro and in vivo targeting imaging of pancreatic cancer using a Fe3O4@SiO2 nanoprobe modified with anti-mesothelin antibody. Int J Nanomedicine. 2016;11:2195–2207. | ||
Fan K, Cao C, Pan Y, et al. Magnetoferritin nanoparticles for targeting and visualizing tumour tissues. Nat Nanotechnol. 2012;7(7):459–464. | ||
Chen WH, Xu XD, Jia HZ, et al. Therapeutic nanomedicine based on dual-intelligent functionalized gold nanoparticles for cancer imaging and therapy in vivo. Biomaterials. 2013;34(34):8798–8807. | ||
Hernandez R, Heskamp S, Rijpkema M, et al. Preventing Radiobleaching of Cyanine Fluorophores Enhances Stability of Nuclear/NIRF Multimodality Imaging Agents. Theranostics. 2017;7(1):1–8. | ||
Villanueva-Meyer JE, Wood MD, Choi BS, et al. MRI Features and IDH Mutational Status of Grade II Diffuse Gliomas: Impact on Diagnosis and Prognosis. AJR Am J Roentgenol. 2018;210(3):621–628. | ||
Yu JJ, Lee HA, Kim JH, et al. Bio-distribution and anti-tumor efficacy of PEG/PLA nano particles loaded doxorubicin. J Drug Target. 2007;15(4):279–284. | ||
Wang G, Gao W, Zhang X, Mei X. Au Nanocage Functionalized with Ultra-small Fe3O4 Nanoparticles for Targeting T1-T2Dual MRI and CT Imaging of Tumor. Sci Rep. 2016;6:28258. |
Supplementary materials
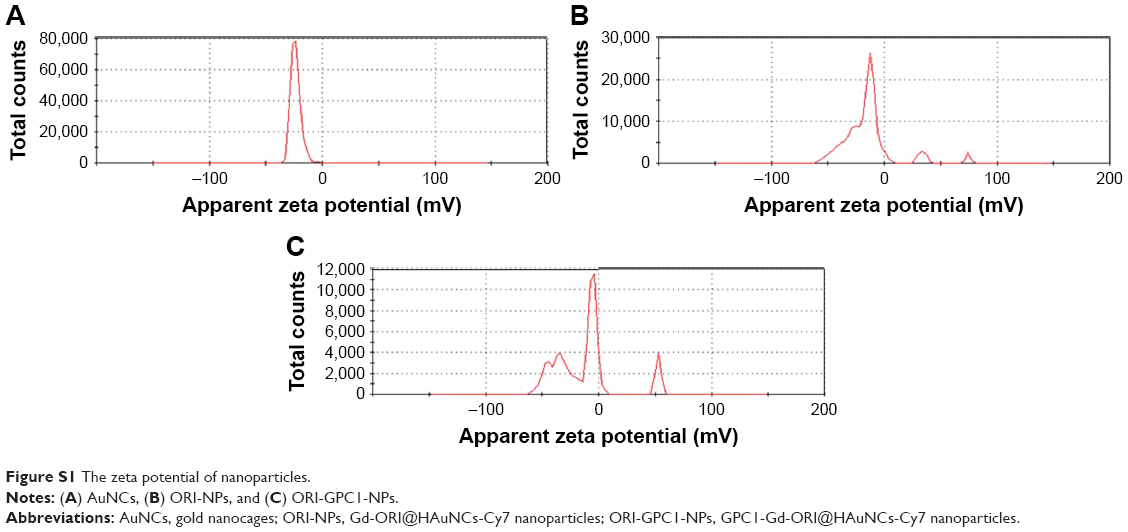 | Figure S1 The zeta potential of nanoparticles. |
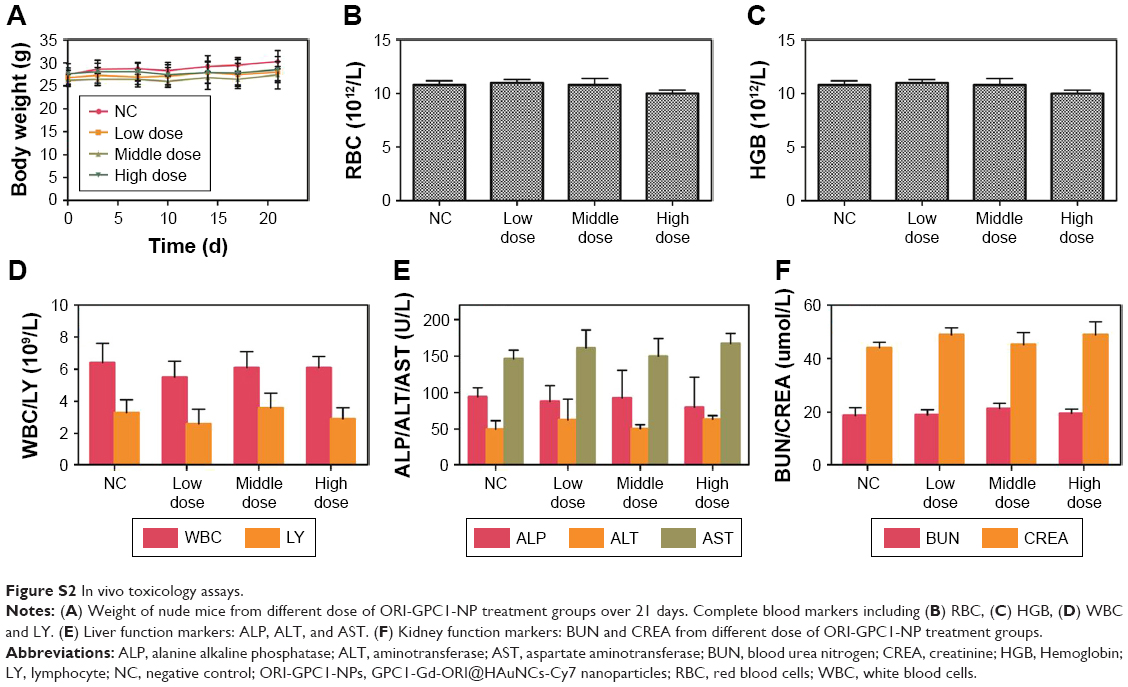 | Figure S2 In vivo toxicology assays. |
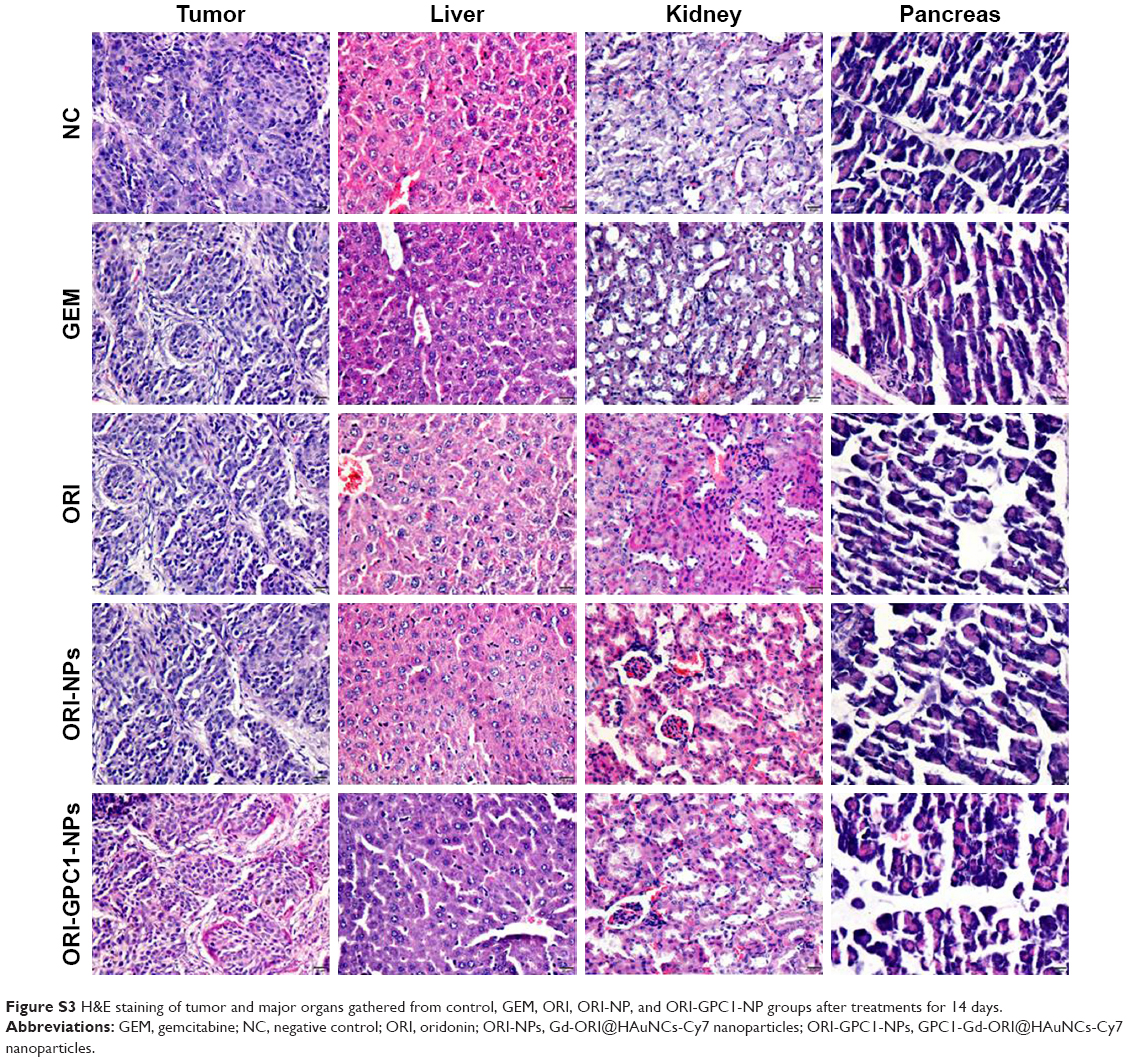 | Figure S3 H&E staining of tumor and major organs gathered from control, GEM, ORI, ORI-NP, and ORI-GPC1-NP groups after treatments for 14 days. |
 © 2018 The Author(s). This work is published and licensed by Dove Medical Press Limited. The full terms of this license are available at https://www.dovepress.com/terms.php and incorporate the Creative Commons Attribution - Non Commercial (unported, v3.0) License.
By accessing the work you hereby accept the Terms. Non-commercial uses of the work are permitted without any further permission from Dove Medical Press Limited, provided the work is properly attributed. For permission for commercial use of this work, please see paragraphs 4.2 and 5 of our Terms.
© 2018 The Author(s). This work is published and licensed by Dove Medical Press Limited. The full terms of this license are available at https://www.dovepress.com/terms.php and incorporate the Creative Commons Attribution - Non Commercial (unported, v3.0) License.
By accessing the work you hereby accept the Terms. Non-commercial uses of the work are permitted without any further permission from Dove Medical Press Limited, provided the work is properly attributed. For permission for commercial use of this work, please see paragraphs 4.2 and 5 of our Terms.