")
Back to Journals » International Journal of Nanomedicine » Volume 10 » Issue 1
Optimized zein nanospheres for improved oral bioavailability of atorvastatin
Authors Hashem F, Al-Sawahli M , Nasr M , Ahmed OAA
Received 4 March 2015
Accepted for publication 29 April 2015
Published 19 June 2015 Volume 2015:10(1) Pages 4059—4069
DOI https://doi.org/10.2147/IJN.S83906
Checked for plagiarism Yes
Review by Single anonymous peer review
Peer reviewer comments 2
Editor who approved publication: Dr Thomas Webster
Fahima M Hashem,1 Majid M Al-Sawahli,2 Mohamed Nasr,1 Osama AA Ahmed3,4
1Department of Pharmaceutics and Industrial Pharmacy, Faculty of Pharmacy, Helwan University, Cairo, 2Holding Company for Biological Products and Vaccines, Giza, Egypt; 3Department of Pharmaceutics and Industrial Pharmacy, Faculty of Pharmacy, King Abdulaziz University, Jeddah, Saudi Arabia; 4Department of Pharmaceutics and Industrial Pharmacy, Faculty of Pharmacy, Minia University, Minia, Egypt
Background: This work focuses on the development of atorvastatin utilizing zein, a natural, safe, and biocompatible polymer, as a nanosized formulation in order to overcome the poor oral bioavailability (12%) of the drug.
Methods: Twelve experimental runs of atorvastatin–zein nanosphere formula were formulated by a liquid–liquid phase separation method according to custom fractional factorial design to optimize the formulation variables. The factors studied were: weight % of zein to atorvastatin (X1), pH (X2), and stirring time (X3). Levels for each formulation variable were designed. The selected dependent variables were: mean particle size (Y1), zeta potential (Y2), drug loading efficiency (Y3), drug encapsulation efficiency (Y4), and yield (Y5). The optimized formulation was assayed for compatibility using an X-ray diffraction assay. In vitro diffusion of the optimized formulation was carried out. A pharmacokinetic study was also done to compare the plasma profile of the atorvastatin–zein nanosphere formulation versus atorvastatin oral suspension and the commercially available tablet.
Results: The optimized atorvastatin–zein formulation had a mean particle size of 183 nm, a loading efficiency of 14.86%, and an encapsulation efficiency of 29.71%. The in vitro dissolution assay displayed an initial burst effect, with a cumulative amount of atorvastatin released of 41.76% and 82.3% after 12 and 48 hours, respectively. In Wistar albino rats, the bioavailability of atorvastatin from the optimized atorvastatin–zein formulation was 3-fold greater than that from the atorvastatin suspension and the commercially available tablet.
Conclusion: The atorvastatin–zein nanosphere formulation improved the oral delivery and pharmacokinetic profile of atorvastatin by enhancing its oral bioavailability.
Keywords: nanoparticles, optimization, experimental design, fractional factorial design
Introduction
Increased levels of low-density lipoprotein and total serum cholesterol are a known cause of hypercholesterolemia, mixed dyslipidemia, homozygous familial hypercholesterolemia, and coronary heart disease.1 Overall, statins are characterized by their high selectivity as HMG-CoA reductase inhibitors and do not exhibit any pertinent affinity towards other enzymes or receptor systems.2 Atorvastatin (ATR) is used to reduce levels of low-density lipoprotein, cholesterol, apolipoprotein B, and triglycerides. ATR also increases high-density lipoprotein cholesterol levels in the treatment of hyperlipidemia and dysbetalipoproteinemia (type III hyperlipoproteinemia).3 ATR has a unique crystalline structure, undergoes hepatic first-pass metabolism, and has very good intestinal permeability and better low-density lipoprotein-lowering potency compared with other HMG-CoA reductase inhibitors.4
ATR belongs to Biopharmaceutics Classification System class II, showing low oral bioavailability (12%) due to low aqueous solubility (0.1 mg/mL), high presystemic clearance in the gastrointestinal mucosa (>80%), and extensive hepatic first-pass metabolism.5 The poor performance of ATR means that higher doses of the drug need to be administered, which may lead to liver abnormalities, myopathy, rhabdomyolysis, arthralgia, and kidney failure.6–8
Interest in developing novel oral delivery vehicles to improve the bioavailability of lipophilic drugs is growing worldwide.9,10 Nanoparticulate formulations depend on the choice of suitable formulation components having maximum encapsulation efficiency (EE) and improvement of bioavailability and retention time.11 Like other nanoparticle formulations, the key factor in improving the oral performance of drugs when incorporated into nanoparticles is a reduction in particle size. The decrease in particle size results in an increase in surface area and solubility, which in turn improves the release rate of the drug and provides high concentrations in the gastrointestinal tract.12,13
The zein polymer is composed of a group of alcohol-soluble proteins that are present predominantly in the endosperm of corn kernels.13 As a drug delivery vehicle, zein shows good biocompatibility and does not induce an autoimmune response or celiac disease.14 Nanoparticulate formulations utilizing zein have shown improved absorbability and less toxicity than synthetic polymeric nanoparticulate formulations.7,15–17 It can also overcome the drawbacks of a hydrophilic polymeric system in order to achieve sustained drug release.12
The aim of this study was to enhance the dissolution rate and modify the release characteristics of ATR, a poorly water-soluble drug, via creation of zein nanospheres. Development of this formulation involved size reduction to the nanoscale and utilization of optimization to understand the experimental parameters affecting the formulation in order to enhance the oral delivery and bioavailability of ATR. An in vivo study using adult Wistar albino rats was done to investigate the pharmacokinetic parameters of the developed zein nanospheres in comparison with the commercial product.
Materials and methods
Materials
ATR (≥98%, CAS number 134523-03-8) was kindly supplied by the Egyptian International Pharmaceutical Industry Company (10th of Ramadan City, Egypt). Zein (≥97%, CAS number 9010-66-6), ethanol, methanol, and all other chemicals were obtained from Sigma-Aldrich (St Louis, MO, USA).
Mathematical experimental design and formulation of ATR–zein nanospheres
Fractional factorial design was custom-constructed in this study using statistical package JMP 7.1 software (SAS Institute, Cary, NC, USA). According to the preliminary results, all process parameters were investigated and the most significant parameters were specified (data not shown). The factors studied were weight % of zein to ATR (X1), pH value (X2), and stirring time (X3). Levels for each formulation variable were designed. The selected dependent variables were mean particle size (Y1), zeta potential (Y2), drug loading efficiency (Y3), drug encapsulation efficiency (Y4), and yield percentage (Y5). The factor levels of design are presented in Table 1. Twelve experimental runs of ATR–zein nanosphere formulations were prepared by a liquid–liquid phase separation method, as shown in Table 1. Each run was carried out in triplicate. Twenty-five milligrams of ATR and the corresponding weight of zein were dissolved completely in 10 mL of 80% ethanol utilizing a probe sonicator (VCX 750, Sonics & Materials Inc, Newtown, CT, USA). The obtained ethanol solution was immersed in 18 mL of deionized water. The resulting dispersion was stirred at 2,000 rpm at room temperature for 3 hours until evaporation of the ethanol. The dispersion was subjected to centrifugation at 20,000 rpm followed by freeze-drying for 72 hours using mannitol as a cryoprotectant. The mannitol concentration was added as a 1:1 weight ratio to the amount of polymer used. Mannitol was removed by exhaustive dialysis prior to drug analysis.
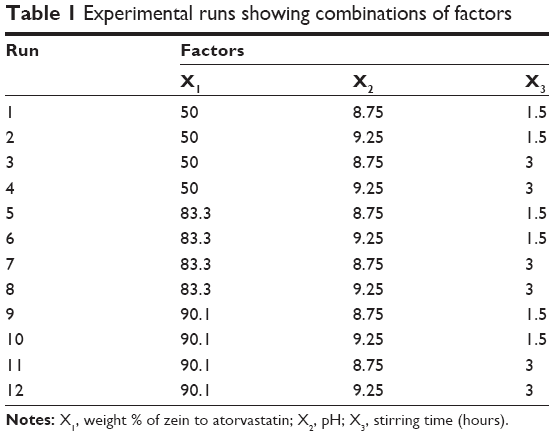 | Table 1 Experimental runs showing combinations of factors |
Characterization of the prepared ATR–zein nanospheres
Particle size and zeta potential
The number weighed particle size of the freshly prepared nanospheres was determined by a laser diffraction technique. The particle size and zeta potential were measured using a Zetatrac analyzer (Microtrac Inc, Montgomeryville, PA, USA).
Drug loading efficiency, encapsulation efficiency, and yield
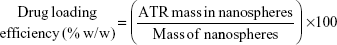
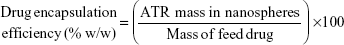
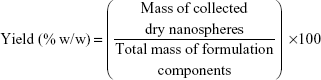
A specific weight of the lyophilized powder of ATR–zein nanospheres was dissolved in 100 mL of methanol using a probe sonicator and subjected to high-performance liquid chromatography analysis (Agilent 1200 series, equipped with an ultraviolet diode array detector, and an automatic sampling system, Agilent Technologies, Santa Barbara, CA, USA). Drug loading efficiency, EE, and percent yield were determined by equations 1, 2, and 3, respectively.18,19
|
|
|
|
|
|
Morphology of ATR–zein nanospheres
The surface morphology of the prepared ATR nanospheres was visualized with a scanning electron microscope (JEM-100 CX, JEOL, Tokyo, Japan). Before observation, the samples were fixed onto metal aluminum stubs using double-sided sticky tape and then coated with gold under vacuum.
Powder X-ray diffraction assay
The crystalline state of ATR in the optimized formulation was confirmed using a powder X-ray diffractometer (D/max 2500, Rigaku, Tokyo, Japan) with CuKα radiation. The obtained data were typically collected between 3° and 45°. Diffraction patterns were recorded for 20 minutes.
In vitro diffusion study
Diffusion of ATR from the prepared nanospheres was carried out using automated Franz diffusion cell apparatus (MicroettePlus, Hanson Research, Chatsworth, CA, USA) with a 1.76 cm2 diffusion area and a receptor chamber volume of 7 mL. A synthetic nylon membrane with a 0.45 μm pore size (Pall Corporation, Port Washington, NY, USA) was used as the diffusion membrane. The developed nanospheres were placed between the donor and receptor compartments. The temperature was maintained at 37°C±0.5°C. Phosphate-buffered saline (pH 7.0, 0.01 M) was used as a diffusion medium in the receptor chamber and stirred at 400 rpm. Aliquots were withdrawn at 0.5, 1, 2, 4, 6, 8, 10, 12, and 24 hours by the autosampler and analyzed for ATR content using a validated high-performance liquid chromatography technique.20 Each test was carried out in triplicate.
Pharmacokinetic study of optimized ATR–zein nanospheres
Adult female Wistar albino rats weighing 200–250 g were used for the in vivo experiments. Animal use was approved by the local institutional review board for preclinical and clinical research that ensures the care and use of animals conforms to the European Union Directive 2010/63/EU on the protection of animals used for scientific purposes.
The animals were divided into four groups, containing six rats each. The first group received orally administered plain zein nanospheres (negative control). The second group received an orally administered ATR suspension at a dose of 25 mg/kg body weight (positive control).21,22 The third group received an orally administered optimized formulation of ATR–zein nanospheres at the same dose. The fourth group received an orally administered suspension of commercial tablets at the same dose. All groups were administered the oral formulations using a ball-tipped feeding needle. Blood samples (0.25 mL) were withdrawn from the tail vein at 0 (pre-dose), 0.25, 0.5, 1, 2, 4, 6, 8, 12, and 24 hours into microcentrifuge tubes. Plasma levels of ATR were determined using a validated high-performance liquid chromatography method.23 Pharmacokinetic parameters, ie, maximum plasma concentration (Cmax), time point of maximum plasma concentration, elimination rate constant (Ke), half-life, mean residence time, and area under the plasma concentration-time curve (AUC) were calculated based on serum ATR concentrations. Pharmacokinetic parameters were calculated by noncompartmental methods using Kinetica software for pharmacokinetic/pharmacodynamic data analysis version 4.2 (Thermo Scientific Corporation, Philadelphia, PA, USA).
Results and discussion
Mathematical experimental design and formulation of ATR–zein nanospheres
This study aimed to develop ATR–zein nanospheres to obtain the optimum formulation and control preparation factors. According to custom fractional factorial design, the factor combinations yielded various values of observed mean dependent variables. The results for Y1 were in the range of 183–1,540 nm for runs 5 and 11, respectively (Table 2). The zeta potential (Y2) showed a highest value of 18.2 (run 2) and the lowest value, ie, closest to zero, was −1.1 (run 10). It has been reported that zein is positively charged, and the variation in zeta potential values could be attributed to adsorption of the ionized salt of the drug in the alkaline hydration medium at the surface of the zein nanospheres.24 The highest value for Y3 and Y4 was achieved by run 2, while run 5 showed the highest value for Y5 (Table 2).
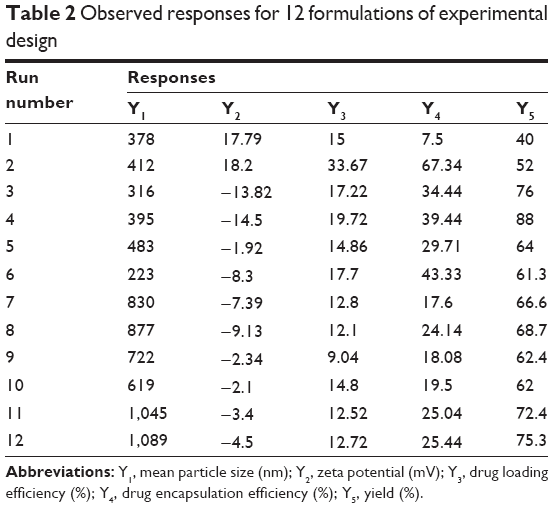 | Table 2 Observed responses for 12 formulations of experimental design |
Analysis of variance results for the investigated dependent variables (Y1–Y5) are shown in Table 3. Evidence of a regression effect is considered for a P-value of 0.05 or less.
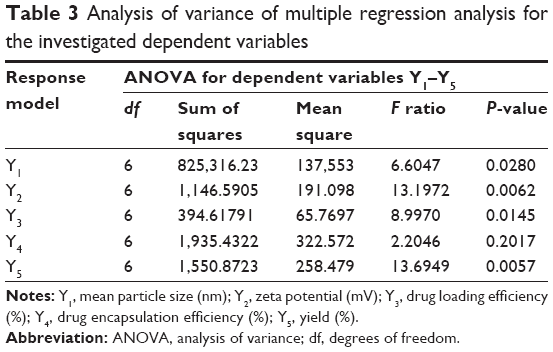 | Table 3 Analysis of variance of multiple regression analysis for the investigated dependent variables |
Accordingly, a significant effect of the independent factors on the dependent variables Y1, Y2, Y3 and Y5 was indicated, with P-values of 0.028, 0.0062, 0.0145, and 0.0057, respectively. The estimated effects and associated P-values for the investigated dependent variables were 0.048, 0.0015, and 0.0043 for the dependent variables Y1, Y2, and Y5, respectively (Table 4). These results indicate significant effects of the interaction term X2.X3 on the dependent variables Y1, Y2, and Y5, as shown in Table 4. The P-values for Y3 showed significant effects of 0.047, 0.0466, and 0.043 for the independent factors X1 and X3 and the interaction term X1X2, respectively. Three-dimensional response surface plots for the estimated dependent variables were constructed according to the polynomial functions to assess the change of the response surface (Figure 1). Since the model has more than two factors, two factors were held constant for each diagram; therefore, a total of five response surface plots were produced.
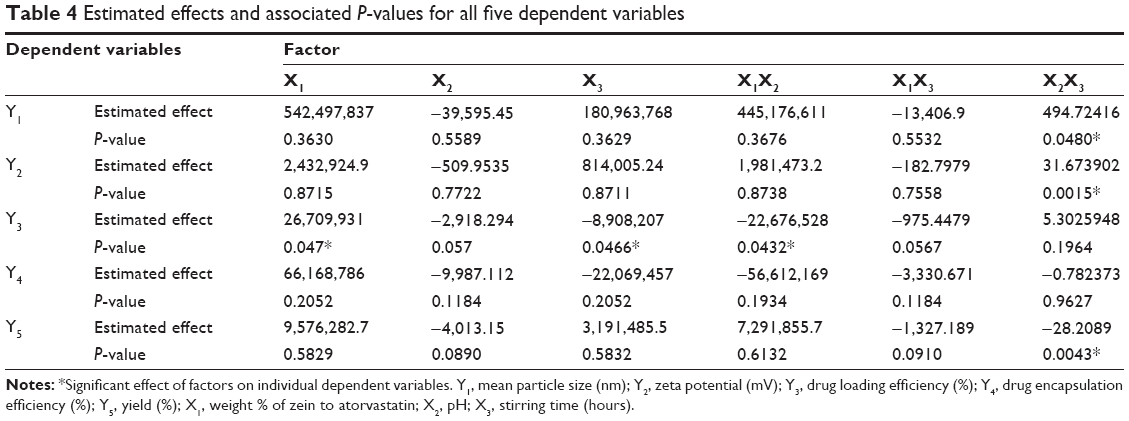 | Table 4 Estimated effects and associated P-values for all five dependent variables |
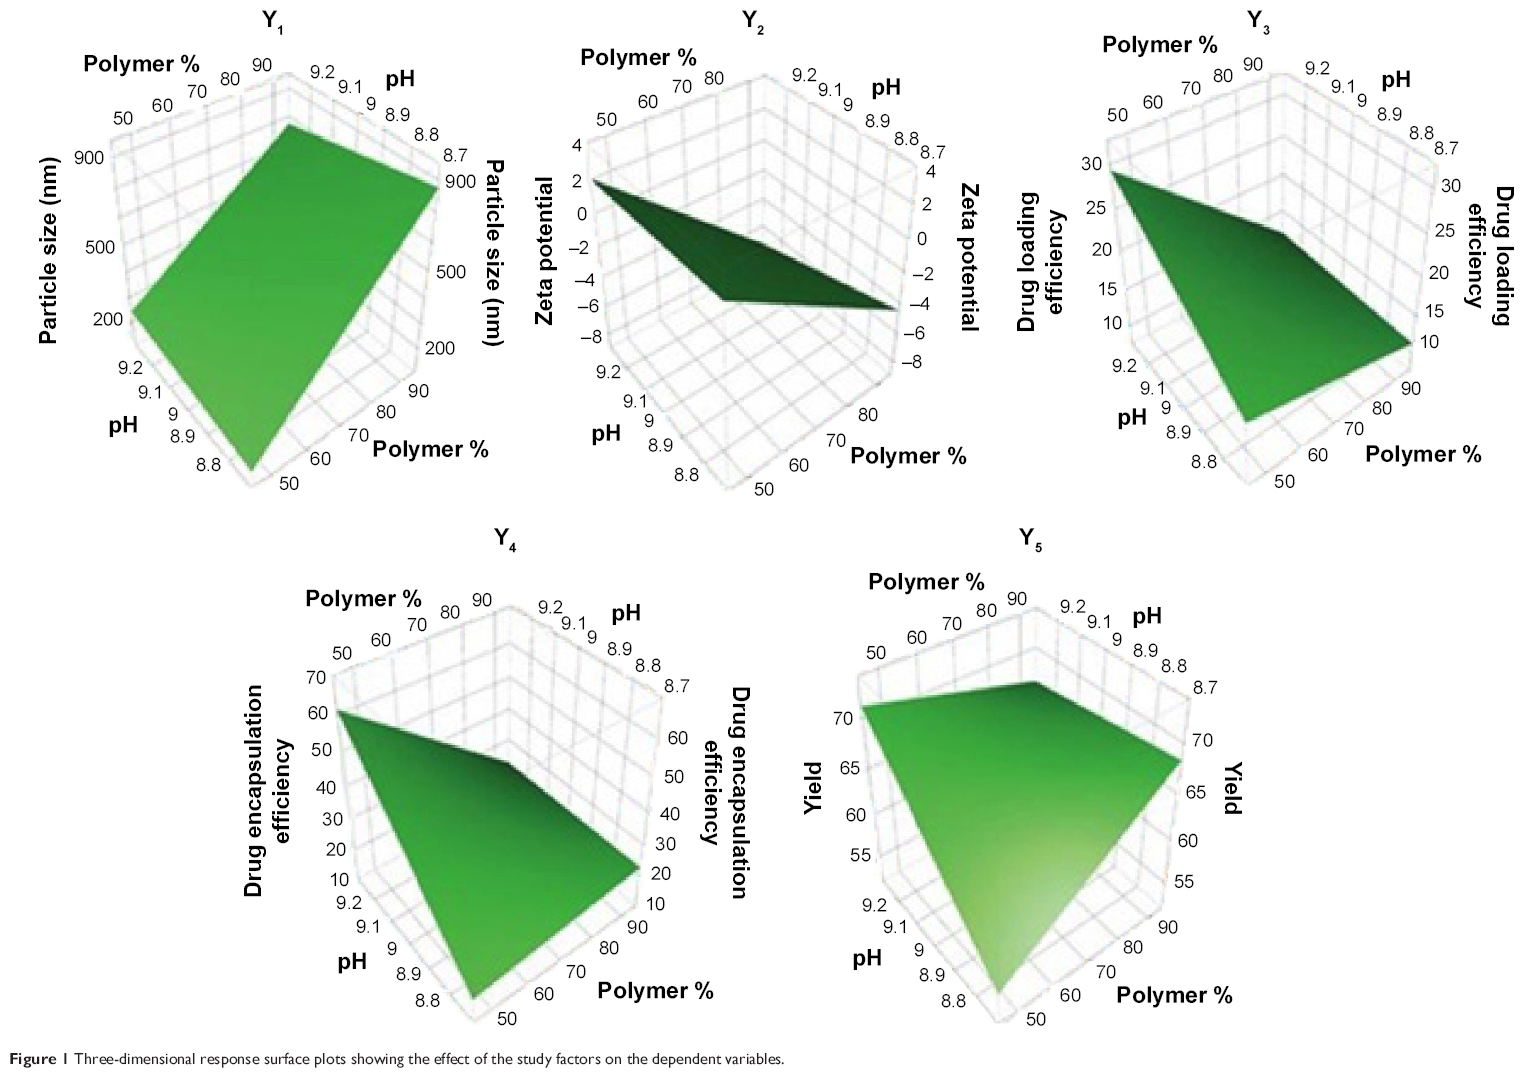 | Figure 1 Three-dimensional response surface plots showing the effect of the study factors on the dependent variables. |
Linear correlations of the quantile–quantile relationships were produced from plotting the measured parameters against the predicted ones (Figure 2). The relationships showed r2 values of 0.89, 0.94, 0.92, 0.73, and 0.94 for Y1, Y2, Y3, Y4, and Y5 respectively. These values indicate the validity of the corresponding models for predicting the investigated dependent variables within the predesigned design spaces (Figure 2). Pareto charts were used to rank the independent variables including their interaction terms according to magnitude of their influences on the dependent variables (Figure 3). The chart includes a vertical reference line at the critical P-value of 0.05. An effect that exceeds the vertical line is considered to be statistically significant. On the other hand, positive signs of the factors’ estimates illustrate direct relationships of the studied factors with the dependent variables. On the other hand, negative signs show inverse relationships.
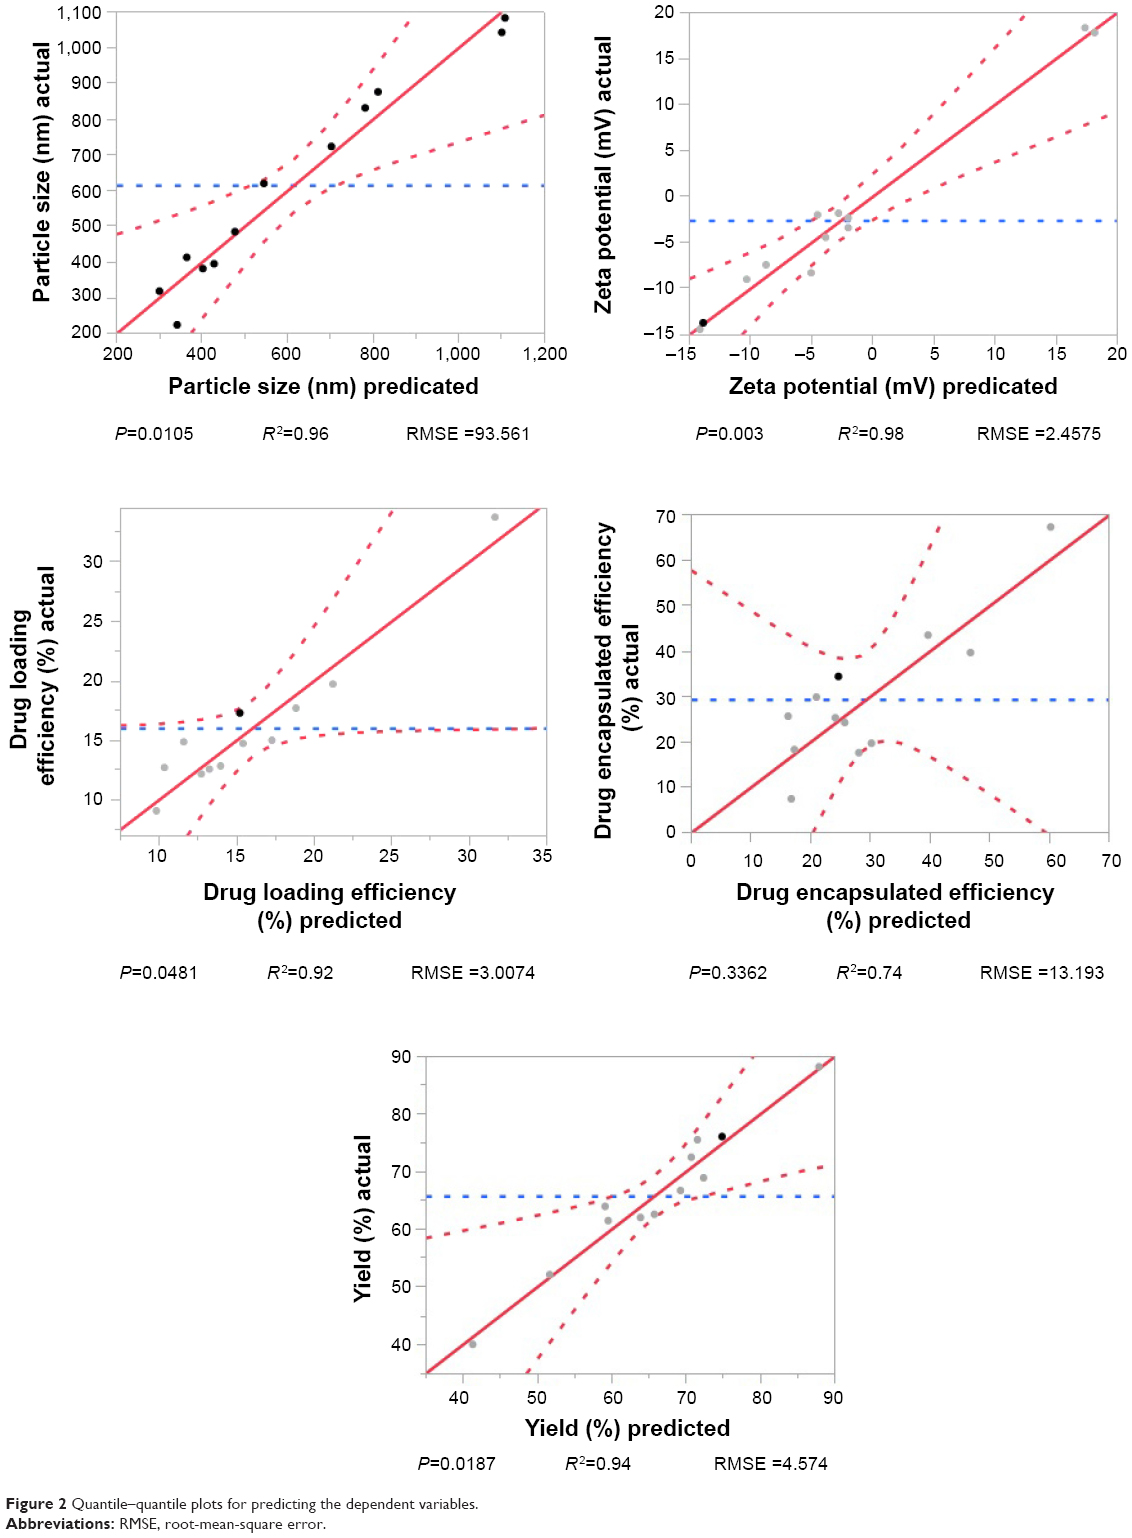 | Figure 2 Quantile–quantile plots for predicting the dependent variables. |
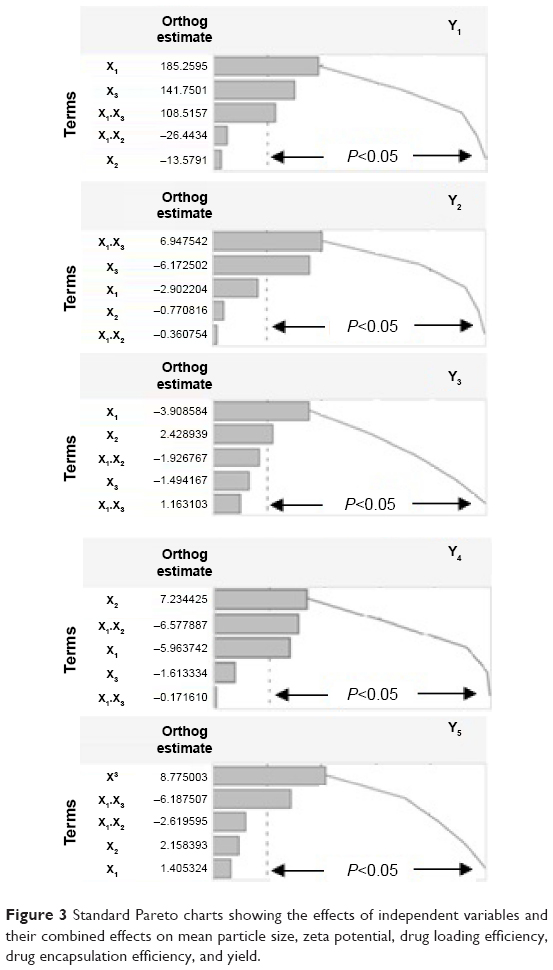 | Figure 3 Standard Pareto charts showing the effects of independent variables and their combined effects on mean particle size, zeta potential, drug loading efficiency, drug encapsulation efficiency, and yield. |
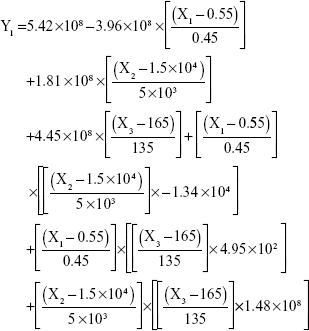
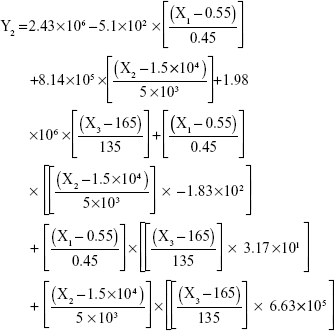
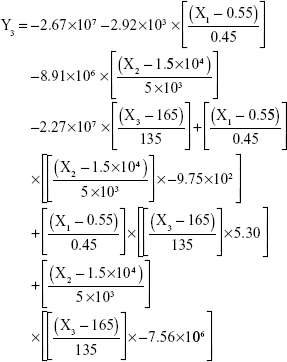
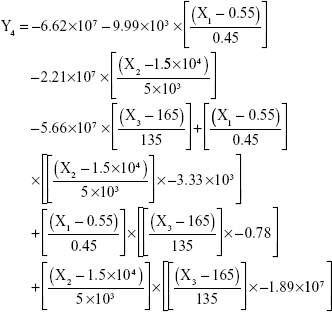
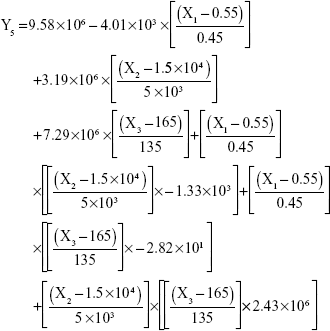
The results showed that increasing the weight % of zein to ATR (X1) increases the mean particle size and loading efficiency significantly. The drug EE is significantly affected by pH in a direct proportional profile. This can be explained by the unfolding of the protein molecule of zein at basic pH, which increases the thiol–disulfide interchange reaction, and may enhance drug inclusion and particle formation, but inhibits formation of large aggregates.12 In addition, improved loading and EE by the increase in weight % of zein to ATR could be attributed to the enhanced partitioning of ATR to the hydrophobic matrix of zein. The significant effect of X3 and the interaction term X1X3 influencing the surface charge intensity of the prepared ATR-zein nanospheres could be attributed to variation in adsorption of the ionized form of the drug in the medium at the surface of the zein nanospheres with variation in X3 (Figure 3). The yield was significantly increased by increased stirring time, which enhanced the homogeneous distribution of the antisolvent droplets, dispersing ATR in the formed zein nanospheres. The reduced model prediction equations (equations 4–8) including the individual effects of the independent variables and their interaction terms were generated using mathematical regression models for the observed dependent variables, Y1, Y2, Y3, Y4, and Y5. Theoretical values of the dependent variables were obtained by substitution of the X1–X3 values in these equations.
|
|
|
|
|
|
|
|
|
|
Drug-nanoparticulate delivery systems show particular promise for high payloads, extended circulation times, and active targeting capabilities. Nanoparticulate systems help to realize the potential of new therapeutic entities, improve the delivery of currently used drugs, increase the maximum tolerated dose, and improve dissolution rates and bioavailability.25–28 Therefore, there is a pressing need to develop general techniques for the formulation of therapeutic nanoparticles.29–32 Zein nanospheres, with size range of 150–550 nm, can be produced from ethanolic solution using antisolvent procedures with water as an antisolvent. The particle size for the 12 formulae ranged from 183 nm to 1,540 nm. The coagulation and adherence of zein nanospheres may be the reason for the high values of some formulae due to a high proportion of zein in these formulae in comparison with ATR. This conclusion is in agreement with previous reports.12,33 The increase in particle size could be attributed to the smaller amount of ATR found on the nanosphere surface, which could lead to an increase in interfacial tension between the particle surface and the aqueous medium, and hence an increased particle diameter.
After analyzing the effect of the independent variables (X1–X3) on the dependent variables (Y1–Y5), the levels of these factors were specified using a computer optimization process and a desirability function. Accordingly, the predicted values of Y1, Y2, Y3, Y4, and Y5 were 186.3 nm, −11.92 mV, 14.79%, 29.71%, and 93.1%, respectively. These predicted values were deduced at X1, X2, and X3 levels of 85%, 8.8%, and 1.4%, respectively. To confirm the output predictions, a fresh formulation of ATR–zein nanospheres was prepared with the specified predicted values, ie, optimized weight % of zein to ATR (85%), pH 8.8, and a stirring time of 1.4 hours. These optimized levels yielded a formulation with a particle size of 191 nm, a zeta potential of −12.7 mV, a drug loading efficiency of 15.64%, an EE of 28.99%, and a yield of 93.6%. The close agreement of the observed and predicted values demonstrated the reliability of the optimization procedure in predicting the characteristics of the ATR–zein nanosphere formulation. The 191 nm particle size of the optimized formula would not be possibly recognized by the reticuloendothelial system to allow long residence time of the nanospheres in the body. In addition, if the formula was applied as a parenteral dosage form, it would be suitable for sterilization by filtration.
The scanning electron microscopic image of the optimized ATR–zein nanosphere formula is shown in Figure 4. The nanospheres showed spherical morphology, with smooth surfaces that have no cracks or pores. The diameter of the particles was consistent with the particle size measured by the laser diffraction technique.
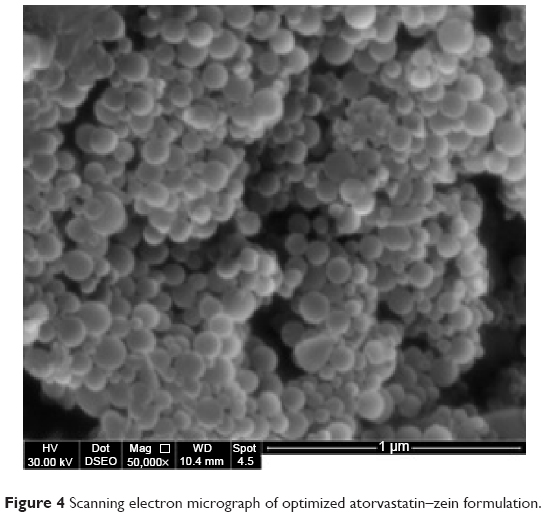 | Figure 4 Scanning electron micrograph of optimized atorvastatin–zein formulation. |
X-ray diffraction analysis was also performed to inspect the physical state of ATR in the developed formula after the formulation process. The raw ATR showed intense crystalline peaks between 5° and 45°C. Zein nanospheres loaded with ATR exhibited broad peaks that indicate transformation of a great extent of drug crystallinity to the amorphous form (Figure 5). Transformation of ATR to an amorphous form, with its high-energy and highly disordered state, would result in an enhanced dissolution rate and improved bioavailability.18
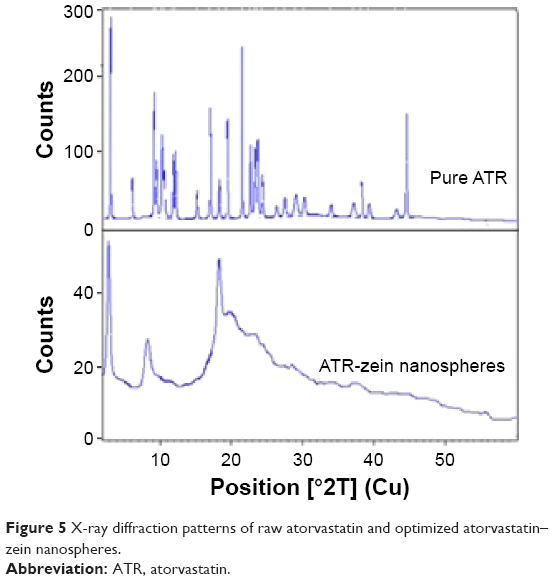 | Figure 5 X-ray diffraction patterns of raw atorvastatin and optimized atorvastatin–zein nanospheres. |
Figure 6 shows the percentage of ATR diffused from the optimized ATR–zein nanospheres. The results show a biphasic sustained-release pattern during the 48-hour release study. The initial release is usually attributed to rapid release of drug entrapped near the surface of the nanospheres. This is mainly related to the heterogeneous drug distribution. Drug particles either loosely associated with the surface or embedded in the surface layer are responsible for the burst release. A low polymer concentration also results in high internal porosity and high initial bursts.19–22 After the initial stage, release of ATR was characterized by a period of slow release. After 12 hours, about 41.76% of the ATR in the zein nanospheres was released. About 53.1% of the entrapped ATR was released after 24 hours (Figure 6). The slow pattern of ATR release from the nanospheres after the initial stage could be attributed to the ATR that is more deeply entrapped in the core matrix of the zein nanospheres. ATR in the core of the nanospheres has a longer diffusion path to reach the surface compared with ATR entrapped near the surface.11 The release of ATR from the core matrix of the zein nanospheres is controlled by parameters that affect the kinetics of drug release from a polymeric matrix. In addition, the hydrophobic nature of zein augments the delay of water penetration and could slow down the diffusion of the poorly water-soluble ATR into the dissolution medium.
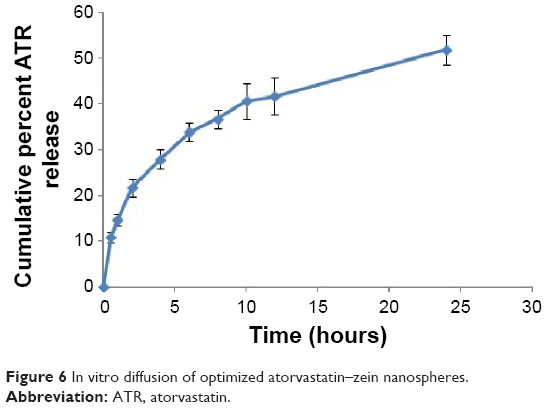 | Figure 6 In vitro diffusion of optimized atorvastatin–zein nanospheres. |
Pharmacokinetic study of optimized ATR–zein nanospheres
The pharmacokinetic study showed lower initial plasma concentrations relative to the oral suspension and commercial ATR tablets for the first 3 hours. There was a high burst release for the ATR–zein formulation. This action continued until reaching Cmax in less than 4 hours, followed by a sharp decrease in plasma levels. This can be attributed to some extent of ATR adhesion to the nanospheres surface that suggest the need for efficient washing procedures for the prepared nanospheres. Optimized ATR–zein showed a higher Cmax and a relative higher area under the plasma concentration-time curve compared with the ATR suspension and commercial tablets, as shown in Figure 7. The Cmax for ATR was 1,788.99, 8,650.32, and 1,780.82 ng/mL for the ATR suspension, optimized ATR–zein nanospheres, and commercial tablets, respectively (Figure 7, inset table). Our results also showed that zein nanospheres could significantly modify the pharmacokinetic profile and increase the bioavailability of ATR by more than 3-fold in comparison with the oral suspension and the commercially available tablets.
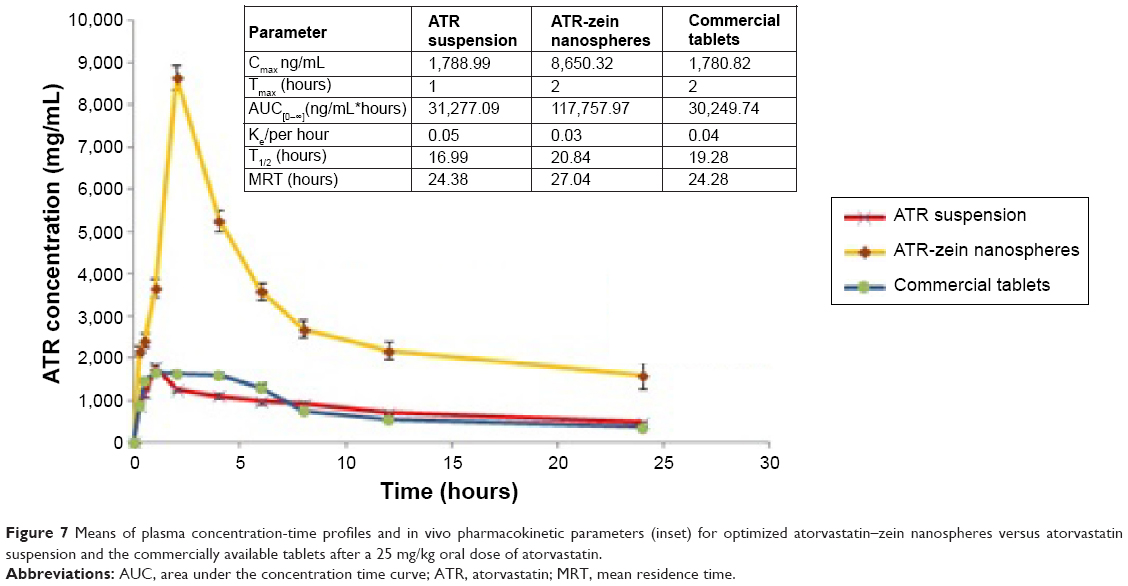 | Figure 7 Means of plasma concentration-time profiles and in vivo pharmacokinetic parameters (inset) for optimized atorvastatin–zein nanospheres versus atorvastatin suspension and the commercially available tablets after a 25 mg/kg oral dose of atorvastatin. |
These results indicate that formulation of ATR as zein nanospheres enhanced its dissolution and absorption across the wall of the gastrointestinal tract. This could be attributed to the fact that preparation of ATR in the form of nanospheres enhances not only solubility of ATR, but also tissue permeability and paracellular absorption of the prepared nanospheres in the gastrointestinal tract. Further, the nanospheres introduce the formulated drug as a fine dispersion rather than the coarse particles of oral suspension, hence an increased surface area with a reduced diffusion path length.7 These results demonstrate the promising features of zein nanospheres, which enhance the oral delivery and bioavailability of ATR in vivo.
Conclusion
Development of optimized ATR–zein nanospheres can improve the pharmacokinetic profile and bioavailability of ATR by more than 3-fold in comparison with ATR oral suspension. We conclude that formulation of zein nanospheres loaded with ATR enhanced the bioavailability and sustained the release of ATR. Further in vitro–in vivo correlation studies are in progress to identify the optimum dosage regimen with the least toxicity.
Acknowledgments
The authors would like to thank Usama Fahmy (Faculty of Pharmacy, King Abdulaziz University) for assistance with the high-performance liquid chromatography assay. They are also grateful to Ahmed Zidan (Faculty of Pharmacy, King Abdulaziz University) for useful discussions regarding the experimental design.
Disclosure
The authors report no conflicts of interest in this work.
References
Corsini A, Maggi FM, Catapano AL. Pharmacology of competitive inhibitors of HMG-CoA reductase. Pharmacol Res. 1995;31:9–27. | ||
Igel M, Sudhop T, von BK. Pharmacology of 3-hydroxy-3-methylglutaryl-coenzyme A reductase inhibitors (statins), including rosuvastatin and pitavastatin. J Clin Pharmacol. 2002;42:835–845. | ||
Breitkreitz MC, Sabin GP, Polla G, Poppi RJ. Characterization of semi-solid self-emulsifying drug delivery systems (SEDDS) of atorvastatin calcium by Raman image spectroscopy and chemometrics. J Pharm Biomed Anal. 2013;73:3–12. | ||
Shete G, Puri V, Kumar L, Bansal AK. Solid state characterization of commercial crystalline and amorphous atorvastatin calcium samples. AAPS Pharm Sci Tech. 2010;11:598–609. | ||
Ronaldson KJ, O’Shea JM, Boyd IW. Risk factors for rhabdomyolysis with simvastatin and atorvastatin. Drug Saf. 2006;29:1061–1067. | ||
Zhong Q, Jin M. Nanoscalar structures of spray-dried zein microcapsules and in vitro release kinetics of the encapsulated lysozyme as affected by formulations. J Agric Food Chem. 2009;57:3886–3894. | ||
Ahmed OA, Hosny KM, Al-Sawahli MM, Fahmy UA. Optimization of caseinate coated simvastatin-zein nanoparticles: improved bioavailability and modified release characteristics. Drug Des Devel Ther. 2015;9:655–662. | ||
Shukla R, Cheryan M. Zein: the industrial protein from corn. Ind Crops Prod. 2001;13:171–192. | ||
Meena AK, Ratnam DV, Chandraiah G, Ankola DD, Rao PR, Kumar MN. Oral nanoparticulate atorvastatin calcium is more efficient and safe in comparison to Lipicure in treating hyperlipidemia. Lipids. 2008;43:231–241. | ||
Desai DP, Date AA, Patravale VB. Overcoming poor oral bioavailability using nanoparticle formulations – opportunities and limitations. Drug Discov Today Technol. 2012;9:87–95. | ||
Liu X, Sun Q, Wang H, Zhang L, Wang JY. Microspheres of corn protein, zein, for an ivermectin drug delivery system. Biomaterials. 2005;26:109–115. | ||
Lai LF, Guo HX. Preparation of new 5-fluorouracil-loaded zein nanoparticles for liver targeting. Int J Pharm. 2011;404:317–323. | ||
Lai LF, Guo HX. Preparation of new 5-fluorouracil-loaded zein nanoparticles for liver targeting. Int J Pharm. 2011;404:317–323. | ||
Lee JH, Park TG, Lee YB, Shin SC, Choi HK. Effect of adding non-volatile oil as a core material for the floating microspheres prepared by emulsion solvent diffusion method. J Microencapsul. 2001;18: 65–75. | ||
Chen L, Hebrard G, Beyssac E, Denis S, Subirade M. In vitro study of the release properties of soy-zein protein microspheres with a dynamic artificial digestive system. J Agric Food Chem. 2010;58:9861–9867. | ||
Podaralla S, Perumal O. Preparation of zein nanoparticles by pH controlled nanoprecipitation. J Biomed Nanotechnol. 2010;6:312–317. | ||
Suzuki T, Sato E, Matsuda Y, Tada H, Unno K, Kato T. Preparation of zein microspheres conjugated with antitumor drugs available for selective cancer chemotherapy and development of a simple colorimetric determination of drugs in microspheres. Chem Pharm Bull (Tokyo). 1989;37:1051–1054. | ||
Zhang HX, Wang JX, Zhang ZB, Le Y, Shen ZG, Chen JF. Micronization of atorvastatin calcium by antisolvent precipitation process. Int J Pharm. 2009;374:106–113. | ||
Sah H, Toddywala R, Chien YW. The influence of biodegradable microcapsule formulations on the controlled release of a protein. J Control Release. 1994;30:201–211. | ||
Stanisz B, Kania L. Validation of HPLC method for determination of atorvastatin in tablets and for monitoring stability in solid phase. Acta Pol Pharm. 2006;4:476–471. | ||
O’Hagan DT, Jeffery H, Davis SS. The preparation and characterization of PLGA microspheres: III. Microparticle/polymer degradation rates and the in vitro release of a model protein. Int J Pharm. 1994;103:37–45. | ||
Yeo Y, Park K. Control of encapsulation efficiency and initial burst in polymeric microparticle systems. Arch Pharm Res. 2004;27:1–12. | ||
Shum YY, Huang N, Walter G, et al. Development, validation, and interlaboratory comparison of an HMG-CoA reductase inhibition assay for quantitation of atorvastatin in plasma matrices. Ther Drug Monit. 1998;20:41–49. | ||
Zhang Y, Niu Y, Luo Y et al. Fabrication, characterization and antimicrobial activities of thymol-loaded zein nanoparticles stabilized by sodium caseinate-chitosan hydrochloride double layers. Food Chem. 2014;142:269–275. | ||
Liu Y, Huang L, Liu F. Paclitaxel nanocrystals for overcoming multidrug resistance in cancer. Mol Pharm. 2010;7:863–869. | ||
Petros RA, DeSimone JM. Strategies in the design of nanoparticles for therapeutic applications. Nat Rev Drug Discov. 2010;9:615–627. | ||
Kumar V, Hong SY, Maciag AE, et al. Stabilization of the nitric oxide (NO) prodrugs and anticancer leads, PABA/NO and double JS-K, through incorporation into PEG-protected nanoparticles. Mol Pharm. 2010;7:291–298. | ||
Liversidge GG, Cundy KC. Particle-size reduction for improvement of oral bioavailability of hydrophobic drugs:1. Absolute oral bioavailability of nanocrystalline danazol in beagle dogs. Int J Pharm. 1995;125:91–97. | ||
Ahuja BK, Jena SK, Paidi SK, Bagri S, Suresh S. Formulation, optimization and in vitro-in vivo evaluation of febuxostat nanosuspension. Int J Pharm. 2014;478:540–552. | ||
Mishra B, Arya N, Tiwari S. Investigation of formulation variables affecting the properties of lamotrigine nanosuspension using fractional factorial design. Daru. 2010;18:1–8. | ||
Das S, Suresh PK. Nanosuspension: a new vehicle for the improvement of the delivery of drugs to the ocular surface. Application to amphotericin B. Nanomedicine. 2011;2:242–247. | ||
Du S, Zhu L, Du B, et al. Pharmacokinetic evaluation and antitumor activity of 2-methoxyestradiol nanosuspension. Drug Dev Ind Pharm. 2012;38:431–438. | ||
Hurtado-Lopez P, Murdan S. Zein microspheres as drug/antigen carriers: a study of their degradation and erosion, in the presence and absence of enzymes. J Microencapsul. 2006;23:303–314. |
 © 2015 The Author(s). This work is published and licensed by Dove Medical Press Limited. The full terms of this license are available at https://www.dovepress.com/terms.php and incorporate the Creative Commons Attribution - Non Commercial (unported, v3.0) License.
By accessing the work you hereby accept the Terms. Non-commercial uses of the work are permitted without any further permission from Dove Medical Press Limited, provided the work is properly attributed. For permission for commercial use of this work, please see paragraphs 4.2 and 5 of our Terms.
© 2015 The Author(s). This work is published and licensed by Dove Medical Press Limited. The full terms of this license are available at https://www.dovepress.com/terms.php and incorporate the Creative Commons Attribution - Non Commercial (unported, v3.0) License.
By accessing the work you hereby accept the Terms. Non-commercial uses of the work are permitted without any further permission from Dove Medical Press Limited, provided the work is properly attributed. For permission for commercial use of this work, please see paragraphs 4.2 and 5 of our Terms.