")
Back to Journals » International Journal of General Medicine » Volume 14
Optimization of the Radiation Dose of Digital Breast Tomosynthesis in Opportunistic Screening by Studying the Effect of Different Combinations of FFDM and DBT Views
Authors Sheng M, Ji J, Zhang C, Zhang Z, Gong S, Lu Y
Received 11 January 2021
Accepted for publication 26 February 2021
Published 30 March 2021 Volume 2021:14 Pages 1147—1154
DOI https://doi.org/10.2147/IJGM.S300584
Checked for plagiarism Yes
Review by Single anonymous peer review
Peer reviewer comments 2
Editor who approved publication: Dr Scott Fraser
Meihong Sheng,1 Juan Ji,1 Chenying Zhang,1 Zirui Zhang,1 Shenchu Gong,1 Yihua Lu2
1Department of Radiology, Affiliated Hospital 2 of Nantong University, Nantong First People’s Hospital, Nantong, Jiangsu, 226001, People’s Republic of China; 2Department of Epidemiology and Medical Statistics, School of Public Health, Nantong University, Nantong, 226019, Jiangsu, People’s Republic of China
Correspondence: Shenchu Gong Email [email protected]
Background: Full-field digital mammography (FFDM) and digital breast tomosynthesis (DBT) are used separately or in combination to identify small breast lesions. The dose of the examination depends on the density of the breast and the imaging (FFDM or DBT) performed. We have performed a retrospective review of FFDM and DBT in women with denser breasts in order to demonstrate how varying the combination of FFDM and DBT in CC and MLO views affects lesion detection and the average gland dose.
Methods: Eighty-one patients with dense breast received both full-field digital mammography (FFDM) and DBT bilateral screening. The recorded data included the display rates for small lesions or other positive lesions, the type of breast gland, the average gland dose (AGD), and the compression thickness of different collection methods. ANOVA was used to compare the AGD among different collection combinations, and t-test was used to perform pairwise comparison between groups with the same gland type. The relationship between AGD and compression thickness was analyzed by Pearson linear correlation, and the lesion display rates were compared using Chi-square test.
Results: We found that AGDs were significantly different among the 6 collection methods (F = 119.06, p< 0.01), but were not obviously different between groups with the same gland type (F = 0.848, p> 0.05). The types of dense glands were correlated with compression thickness, and the thickness was moderately to strongly correlated with AGD (r=0.596– 0.736). The combination of single-view DBT(CC-DBT) and FFDM showed significantly higher mass display rates than the two-view FFDM (p< 0.05), while the display rates for other positive lesions were similar (p> 0.05).
Conclusion: Our study showed that in opportunistic screening of patients with small breast masses that can be easily detected by ultrasound, MLO-FFDM+CC-DBT or CC-FFDM+MLO-DBT combinations can better balance the individual average gland dose and detection accuracy. The study result cannot be applied to the detection of non-mass lesions as the numbers are too small.
Keywords: breast, breast tomography, screening, digital mammography, average gland dose
Introduction
Breast cancer is the most common malignant tumor diagnosed in urban females, and the patient population is becoming increasingly younger. Mammography is currently considered as one of the most effective tools for breast cancer screening. It can effectively detect most breast tumors, but its sensitivity is limited in dense glandular breasts.1,2 Digital Breast Tomosynthesis (DBT) can improve the cancer detection rate in dense breasts3,4 and reduce the overlap effect; however, the average gland dose (AGD) used in DBT is higher. Therefore, we compared the radiation doses of Full-Field Digital Mammography (FFDM) and DBT in opportunistic screening in this study, and analyzed their display rates for small lesions, in order to optimize the DBT collection method and reduce the radiation dose.
Patients and Methods
Patients
We retrospectively analyzed the data of patients in our hospital from December 2015 to September 2016 who met the following criteria: (1) General ultrasound screening revealed a single breast mass with long and short diameters of less than 1.0 cm, and a clear clock orientation; (2) the patient with dense breast received FFDM and DBT examinations within two weeks after general ultrasound screening; (3) for those who did not undergo surgery, the mass still presented at the original location during follow-up, and the others were confirmed by pathology; (4) breast density was evaluated according to the ACR breast composition classification, with densities category c and d. The exclusion criteria were: (1) Incomplete image data; (2) poor image quality that affected diagnosis. A total of 81 cases were included in the study. All patients were females, aged 29–80 years old, with an average age of 46.43±8.85 years.
Examination Method
Mammography examinations (FFDM, DBT) were performed on Siemens Mammomat Inspiration digital mammography machine. The exposure mode was fully automatic. Under the same breast compression, FFDM and DBT image acquisitions were performed successively. FFDM and DBT examined the craniocaudal (CC) and medio-lateral-oblique (MLO) of the bilateral breast. The thickness of DBT image was 1 mm. The acquisition parameters included the AGDDBT, AGDFFDM of bilateral breast CC and MLO positions and the thickness of breast compression. The average dose per view was calculated as a ratio of the AGD of combined FFDM and DBT view compared to FFDM view (AGD combined view/AGDFFDM).1 Ultrasound inspection used SAMSUNG ultrasonic diagnostic equipment WS80A or Philips color ultrasonic diagnostic system EPIQ7. Bilateral breast ultrasonography included the parenchymal tissue of the breast and bilateral axilla, and the tumor was marked with clock positioning.
Image Analysis
The DBT and FFDM images were examined by two experienced radiologists working on breast imaging diagnosis. Images viewed on local PACS by the Barco 5M diagnostic workstation, and the lesions were searched according to the quadrant and adjacent quadrants of the ultrasound clock positioning. If there was any inconsistency, they would discuss and reach a consensus. The classification of breast gland composition and lesion diagnosis referred to the 5th edition ACR2013 breast imaging report and data system (BI-RADS).2 The lesions were described as mass, calcification, structural distortion and asymmetry.
ACR BI-RADS Density
In 5th edition of the ACR BI-RADS,2 the categories were defined as follows: category a=almost entirely fat, category b=scattered fibroglandular densities, category c=heterogeneously dense, which may obscure small masses, and category d=extremely dense, which lowers the sensitivity of mammography.
Ethical Considerations
The retrospective study was approved by the Ethical Review Board of Affiliated Hospital 2 of Nantong University (No. 2016KJ023) and was conducted according to the Declaration of Helsinki principles. All patients signed informed consent.
Statistical Analysis
Continuous measurement data with normal distribution were expressed as mean ± standard deviation (x̄±s). Qualitative data were expressed as numbers and rates. T-test was used to compare average gland dose (AGD) and compression thickness between the two groups with same dense gland type and different breast image collection methods. Analysis of variance (ANOVA) was used to compare the AGD among different collection combinations (Table 1). The AGD in ACR-c with MLO-FFDM+CC-DBT, ACR-c with CC-FFDM+ MLO-DBT, ACR-d with CC-FFDM+ MLO-DBT, and ACR-d with MLO-FFDM+CC-DBT was pairwise compared. Pearson linear correlation was performed to analyze the relationship between AGD and thickness; Chi-square test was used to compare the display rates for breast masses and other positive lesions. Correlation coefficient |r| between 0.8–1.0 indicated very strong correlation, 0.6–0.8 indicated strong correlation, 0.4–0.6 indicated moderate correlation, 0.2–0.4 indicated weak correlation, and 0.0–0.2 indicated extremely weak correlation or no correlation.
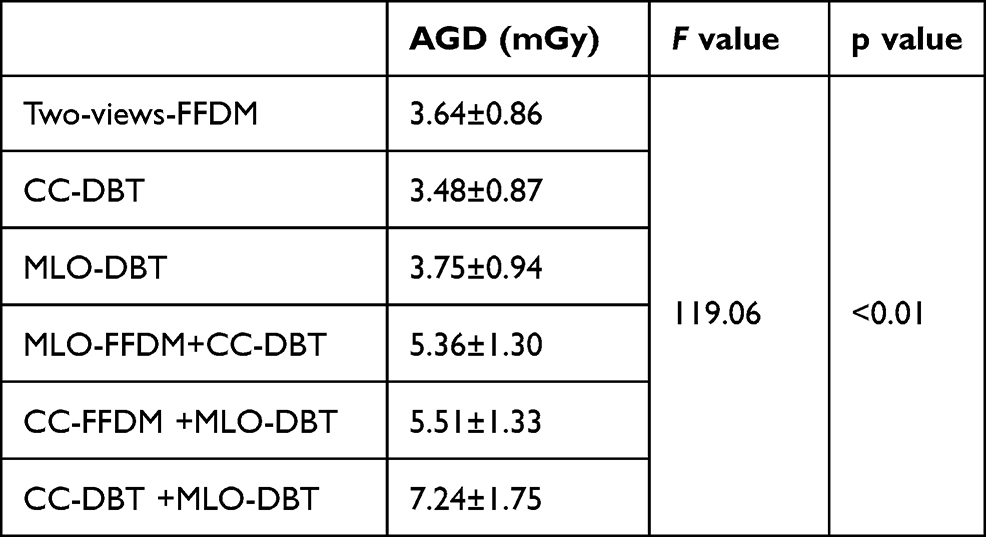 |
Table 1 Comparison of Average Gland Doses Among Different FFDM and DBT Methods |
Statistical analysis was performed using SPSS statistical analysis software (PASW Statistics, version 22.0; SPSS Inc, Chicago, IL, USA) and p < 0.05 was considered to be statistically significant.
Results
Comparison of the Average Gland Doses Among Different FFDM and DBT Methods
Our results showed that the AGD differences of which methods were statistically significant (Table 1, F = 119.06, p<0.01). Pairwise comparison showed that there was no significant difference in AGD between two-view-FFDM and single-view DBT (CC-DBT, MLO-DBT) (p=0.431, 0.546>0.05), CC-DBT and MLO-DBT (p =0.165>0.05), MLO-FFDM+CC-DBT and CC-FFDM+MLO-DBT (p=0.443>0.05). The relative dose rate of single-view DBT was 0.94–1.52, and the relative dose rate of two-views DBT was 1.97–2.0, which was significantly higher than that of two-views-FFDM, single-view DBT, as well as the combinations.
Comparison of the Average Gland Doses (AGD) and Thicknesses Among Different Breast Gland Types and Image Collection Methods
According to BI-RADS, the breast gland composition was the dense gland type, including heterogeneous dense gland type ACR c, and uniform dense gland type ACR d, both of which might mask lesions. Among all cases, there were 61 cases with ACR c and 20 cases with ACR d. The results showed that there was no significant difference in AGD between ACR c with MLO-FFDM+CC-DBT, ACR c with CC-FFDM+ MLO-DBT, ACR d with CC-FFDM+ MLO-DBT, and ACR d with MLO-FFDM+CC-DBT (F =0.848, p=0.469>0.05, Figure 1). The composition of dense glands was significantly correlated with the compression thickness (p=0.001 <0.01): the denser the gland, the higher the compression thickness; moreover, the thickness also had a moderate to strong correlation with AGD (r=0.596–0.736, Table 2).
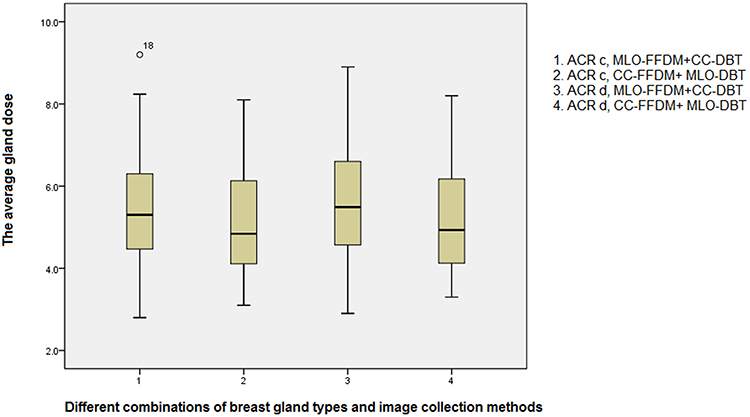 |
Figure 1 The relationship between the average gland dose and different combinations of breast gland types and image collection methods. |
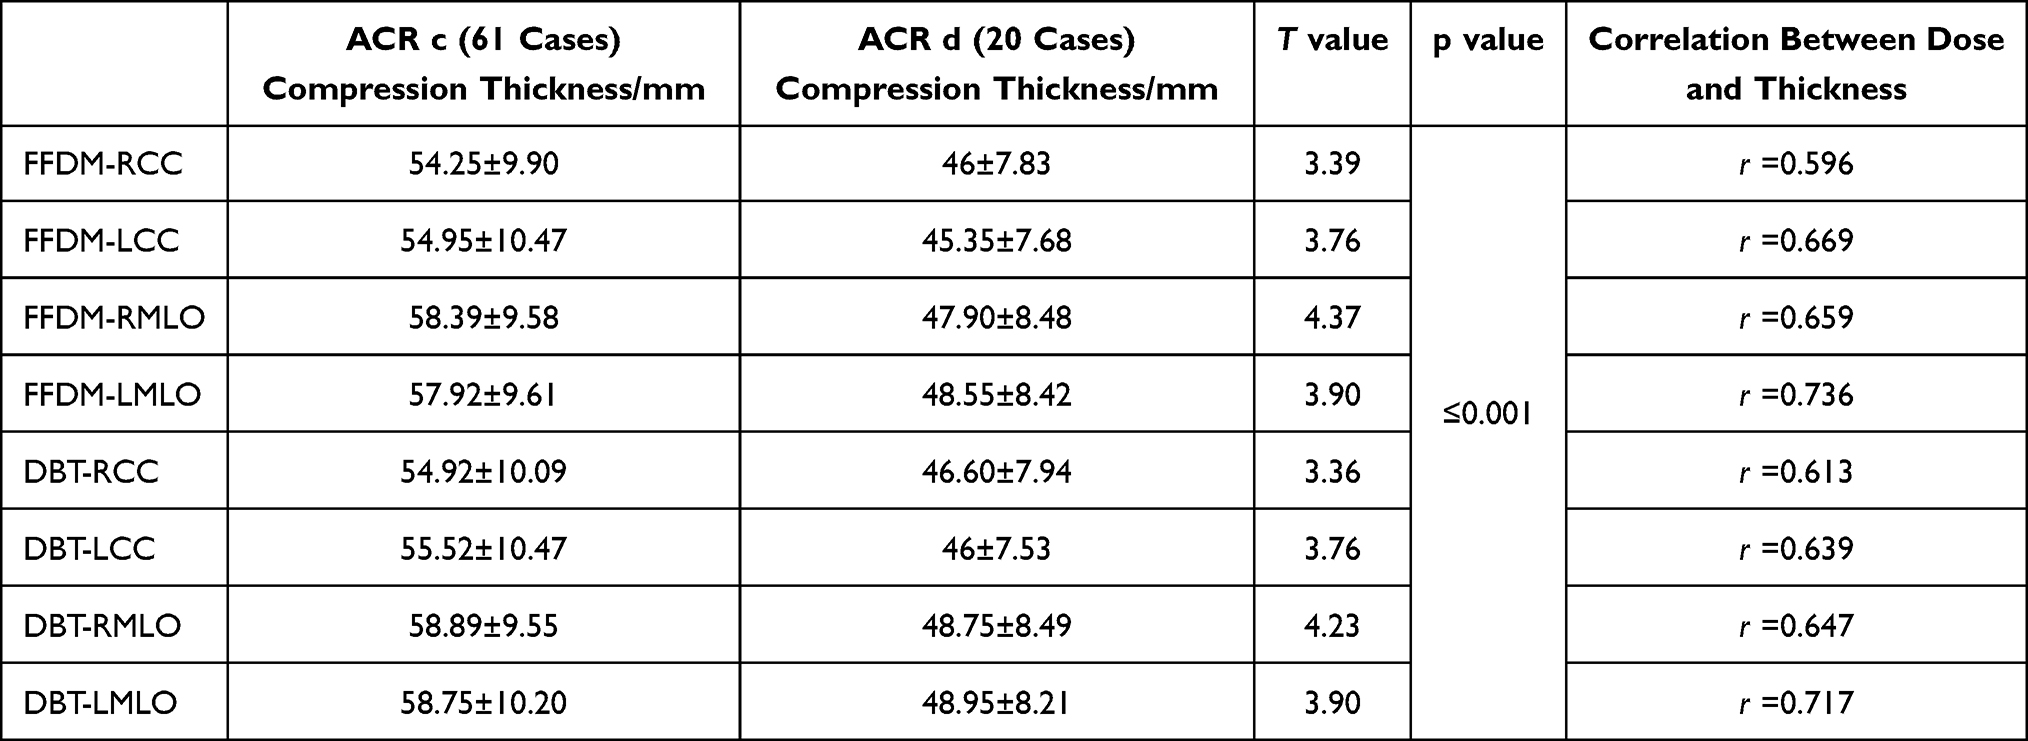 |
Table 2 The Relationship Between the Breast Gland Types, Compression Thickness, and Average Gland Dose |
The Detection of Masses of Less Than 1.0 cm by DBT and FFDM
Ultrasound screening revealed a total of 81 lesions with a hypoechoic mass less than 1.0 cm (Table 3). FFDM detected 25.93% masses (21/81), with 3.70% (3/81) of structural distortion, 1.23% (1/81) of asymmetric density, and 27.16% (22/81) of calcification; DBT detected 48.15% (39/81) masses, with 1.23% (1/81) of structural distortion, 2.47% (2/81) of asymmetry, and 28.4% (23/81) of calcification. The MLO-FFDM+CC-DBT combination showed 41.98% (34/81) masses, and CC-FFDM+ MLO-DBT showed 33.33% (27/81) masses. There were only 12 cases found by CC-DBT, and only 5 cases found by MLO-DBT, all of which were lesions on the axillary tail or upper chest wall. Other lesions were found by both CC and MLO. Among the mass cases, 1 case was invasive ductal carcinoma (Figure 2A–F), which was manifested spiculate mass. In the cases with structural distortion, 2 cases were invasive ductal carcinoma, and 1 case was breast disease. Among the cases with calcification, 2 cases were ductal carcinoma in situ. All the other cases were stable based on the follow-up. In terms of mass display, DBT had an advantage over FFDM (p<0.05, Table 4), and the CC-DBT combination showed a more obvious advantage in mass display (Table 4). There was no significant difference in the detection of additional calcification, asymmetry, and structural distortions between different collection methods (p>0.05).
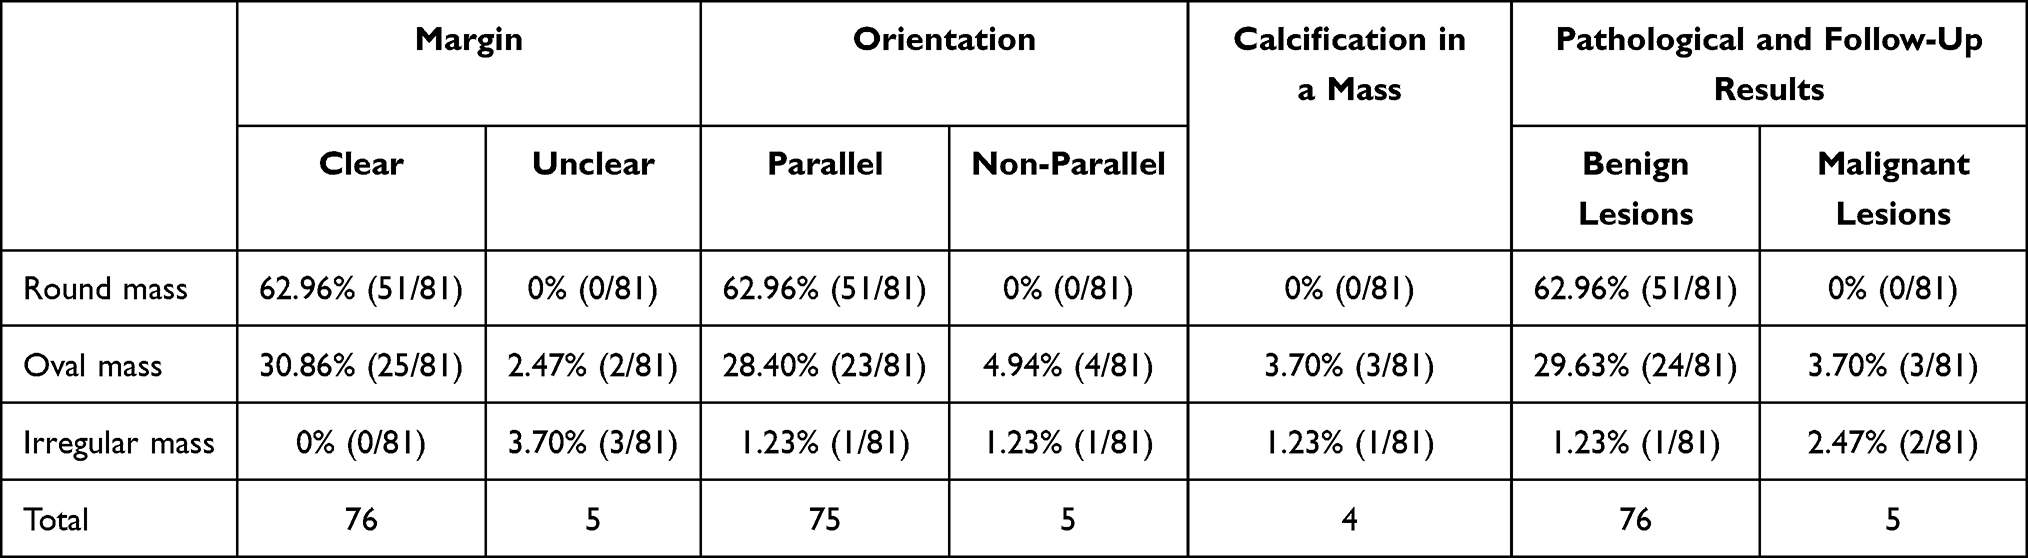 |
Table 3 Different Manifestations of Breast Lesions in Ultrasound Images |
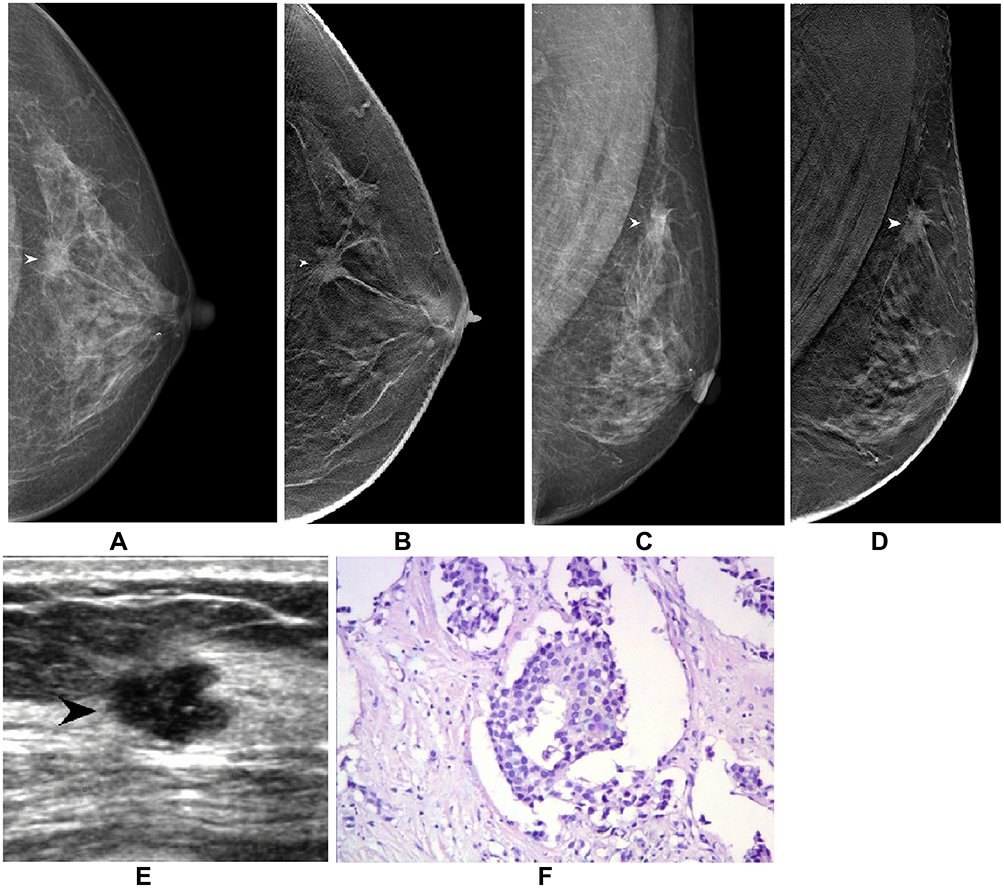 |
Figure 2 Images of a 61 years-old female patient with grade II invasive ductal carcinoma on the left breast. (A) CC-FFDM shows isometric irregular mass on the lateral side of left breast central area (white arrow). (B) CC-DBT shows spiculate mass (white arrow). (C) MLO-FFDM shows irregular mass on upper left breast with unclear border (white arrow). (D) MLO-DBT shows mass with spiculated margins (white arrow). (E) Ultrasound shows lobulated hypoechoic mass on the left breast (black arrow), located in the 2 o’clock direction. (F) 100×HE staining shows cancer cells growing in a nested invasion pattern with abnormal cell shape. |
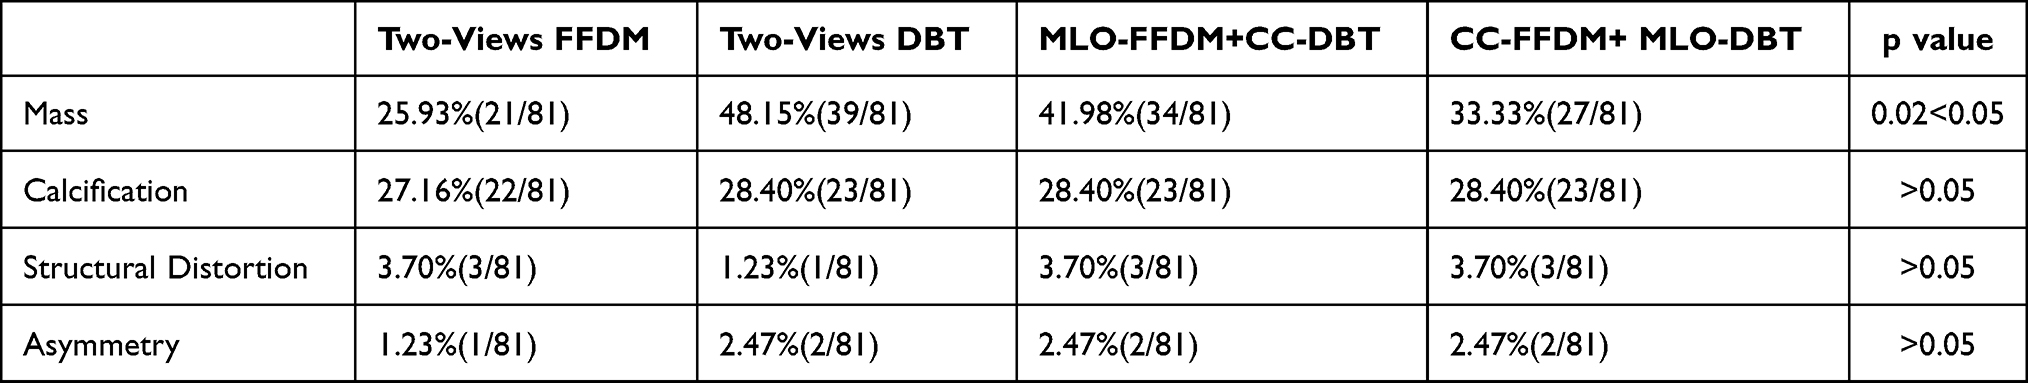 |
Table 4 Different Manifestations of Breast Lesions in FFDM and DBT Images |
Discussion
Currently, FFDM is the main method for breast cancer detection and diagnosis,3,4 but it can be affected by the overlap from glands in dense breast, which can cover up the lesion. DBT is an emerging mammography technology, which can display lesions that FFDM cannot show, thus improving the detection rate. Moreover, the edges and outlines of lesions are more clearly displayed in DBT.5–8 However, the imaging process of DBT includes a series of low-dose exposures, and each exposure dose is 5% to 10% of conventional mammography. Thus, DBT will increase the patient’s radiation dose, and the detection of small lesions needs to balance the display rate and the average gland dose.
The Influence of Dense Breast Gland Composition and Compression Thickness on the Average Gland Dose (AGD)
Mammary glands are sensitive to X-rays. AGD is the average absorbed dose of breast tissue in mammography and is the main indicator for evaluating breast radiation dose. Our results showed that, regardless of DBT or FFDM, the dense breast composition type was not related to AGD (p>0.05), but was related to the thickness of compression (p<0.01); moreover, the compression thickness was moderately to strongly correlated with AGD (r=0.596–0.736). This result was consistent with the study by Yang et al,9 in which AGD was shown to be positively correlated with breast density and compression thickness, and compression thickness had a larger effect on AGDDBT. Therefore, it is necessary to reduce the compression thickness based on patient’s maximum compression tolerance to reduce the average absorbed dose.
In addition, it is widely accepted that the dose of single-view DBT is equivalent to that of the two-view FFDM. Each additional view in FFDM or DBT will increase a portion of radiation dose. Svahn et al1 studied the AGD of FFDM and DBT to calculate the relative dose rate. The results showed that synthetic 2D images can reduce the radiation dose by about 45% and can replace FFDM, but most DBTs currently do not have the function of synthesizing 2D images. Considering that the two-view FFDM+two-view DBT is the combination with the highest radiation dose, it was not considered as a dose optimization combination in this study. Therefore, the AGD of the following six collection methods was pairwise compared: two-view FFDM, CC-DBT, MLO-DBT, MLO-FFDM+CC-DBT, CC- FFDM+MLO-DBT and CC-DBT+MLO-DBT. We found that the AGD between two-view-FFDM and single view DBT, CC-DBT and MLO-DBT, MLO-FFDM+CC-DBT and CC-FFDM + MLO-DBT were similar (p>0.05), indicating that any collection method within these three combinations can be used interchangeably. Moreover, the AGD of single view DBT was equal to or lower than that of two-view FFDM, which was consistent with the study from Asbeutah et al,10 but the lesion display efficiency of single view DBT was lower. On the other hand, MLO-FFDM+CC-DBT and CC-FFDM+MLO-DBT could provide rich image information for dense breasts, and the relative dose rates of the two combinations did not exceed 1.52 times of two-view FFDM; moreover, their radiation dose can be further reduced by reducing the compression thickness.
The Relationships Between Different Image Acquisition Methods and Dense Breast Types, Average Gland Dose, and Lesion Display
The combination of MLO-FFDM+CC-DBT or CC-FFDM+MLO-DBT is two-view acquisition, which can provide more image information. Particularly, for lesions at axillary tail, due to its rich local fat, FFDM can better display the lesions. The 81 patients enrolled in the study all had dense breasts. Distribution of differences is shown as box-plot (Figure 1). There was no significant difference in AGD between ACR-c with MLO-FFDM+CC-DBT, ACR-c with CC-FFDM+ MLO-DBT, ACR-d with MLO-FFDM+CC-DBT, and ACR-d with CC-FFDM+ MLO-DBT (F=0.848, p>0.05), indicating that the dense gland type had no effect on the average gland dose. However, the 18th patient appeared atypical as the patient had a large and dense breast, the compression thickness was up to 75mm, and the dose was significantly increased. Attention is needed for such patients to avoid higher radiation dose.
In terms of mass display, DBT was better than FFDM (p<0.05), and their mass display rates were 48.15% for DBT and 25.93% for FFDM. Moreover, single-view DBT (MLO-FFDM+CC-DBT, CC-FFDM+ MLO-DBT) was superior to two-view FFDM, and the mass display rates of MLO-FFDM+CC-DBT and CC-FFDM+ MLO-DBT were 41.98% (34/81) and 33.33% (27/81), respectively. The results also showed that CC-DBT had better mass display rate than MLO-DBT in breast except the axillary tail part which was consistent with the study by Katrina et al.11 The reason might be that the CC view can better compress the breast parenchyma, resulting in a reduction in tissue overlay and an increase in the mass display rate; while in MLO view, the pressure is usually the largest on the pectoralis major, instead of breast tissue. There was no significant difference in the display of additional calcification, asymmetry and structural distortion (p>0.05). Therefore, the two combinations of MLO-FFDM+CC-DBT and CC-FFDM+MLO-DBT can be freely switched according to the lesion location. They can be used as routine screening methods, which can better balance the radiation dose and the improved lesion display rate.
Limitations
This study only performed FFDM and DBT in opportunistic screening on patients with lesions of less than 1.0 cm as detected by ultrasound, so there might be selection bias. Moreover, the sample numbers are small, especially for non-mass lesions; there is a lack of detail around the imaging features, and most of the lesions had not been confirmed by pathology. The stability of lesions was determined only by 3-year follow-up, and there was no classification of benign or malignant lesions. Only the lesion display and the relationships between average gland dose and different imaging combinations were studied. In future studies, the role of DBT in the display of small lesions will be further investigated.
Conclusions
In summary, in the opportunistic screening of patients with breast masses of less than 1.0 cm that are easily detected by ultrasound, the combination of MLO-FFDM+CC-DBT or CC-FFDM+MLO-DBT can better balance the individual average gland dose and accurate detection. According to the clock position of the lesion, the appropriate collection method should be selected for the accurate display of the lesion.
Abbreviations
DBT, digital breast tomosynthesis; AGD, average gland dose; FFDM, full-field digital mammography; CC, craniocaudal; MLO, medio-lateral-oblique; BI-RADS, breast imaging report and data system; AGD, average gland dose; ANOVA, analysis of variance.
Data Sharing Statement
All data generated or analyzed during this study are available from the corresponding author Shenchu Gong upon reasonable request.
Ethics Approval and Informed Consent
The retrospective study was approved by the Ethical Review Board of Affiliated Hospital 2 of Nantong University (No. 2016KJ023).
Author Contributions
All authors made a significant contribution to the work reported, whether that is in the conception, study design, execution, acquisition of data, analysis and interpretation, or in all these areas; took part in drafting, revising or critically reviewing the article; gave final approval of the version to be published; have agreed on the journal to which the article has been submitted; and agree to be accountable for all aspects of the work.
Funding
This project was funded by the Young Medical Talents Program in Jiangsu Province (QNRC2016404), and the “Six One” Research Funding Program for high-level health talents in 2018 (LGY2018036).
Disclosure
The authors declare that they have no conflicts of interest.
References
1. Svahn TM, Houssami N. Digital breast tomosynthesis in one or two views as a replacement or adjunct technique to full-field digital mammography. Radiat Prot Dosimetry. 2015;165(1–4):314–320. doi:10.1093/rpd/ncv078
2. Sickles EA, d’Orsi CJ, Bassett LW, et al. ACR BI-RADS mammography. In: d’Orsi CJ, Sickles EA, Mendelson EB, Morris EA, editors. ACR BI-RADS Atlas, Breast Imaging Reporting and Data System.
3. An Q, Li J. Comparison of diagnostic performances of ultrasonography and digital breast tomosynthesis in dense breasts. Chin J Med Imag Technol. 2019;35(4):545–549. doi:10.13929/j.1003-3289.201810013
4. Rong X, Kang Y, Li Z, Wu Z, Wu Y, Zhao N. Comparison of the diagnostic accuracy between mammography and sonography in the prediction of breast cancer tumor size. J Pract Radiol. 2018;34(9):1376–1380. doi:10.3969/j.issn.1002-1671.2018.09.017
5. Su X, Lin Q, Cui C, Fei J, Li L, Ma J. Comparison of diagnostic accuracy of digital breast tomosynthesis, digital mammography, and ultrasonography for the non-calcified ductal carcinoma in situ of the breast. Chin J Radiol. 2018;52(1):15–19. doi:10.3760/cma.j.issn.1005-1201.2018.01.004
6. Dibble EH, Singer TM, Jimoh N, Baird GL, Lourenco AP. Dense breast ultrasound screening after digital mammography versus after digital breast tomosynthesis. AJR Am J Roentgenol. 2019;213(6):1397–1402. doi:10.1007/s12194-020-00576-1
7. Sharpe RE
8. Liu Y, Lu C, Zhu Z. Detection of mammary gland disease: performance comparison of digital breast tomosynthesis (DBT) plus full field digital mammography (FFDM) and FFDM. J Pract Radiol. 2017;33(8):1309–1312. doi:10.3969/j.issn.1002-1671.2017.08.039
9. Yang L, Song J, Li J, Zhou C. Relationship between AGDDBT and breast density or compressed breast thickness. Radiol Pract. 2017;23(5):494–497. doi:10.13609/j.cnki.1000-0313.2017.05.014
10. Asbeutah AM, AlMajran AA, Brindhaban A, Asbeutah SA. Comparison of radiation doses between diagnostic full-field digital mammography (FFDM) and digital breast tomosynthesis (DBT): a clinical study. J Med Radiat Sci. 2020;67(3):185–192. doi:10.1002/jmrs.405
11. Korhonen KE, Conant EF, Cohen EA, Synnestvedt M, McDonald ES, Weinstein SP. Breast cancer conspicuity on simultaneously acquired digital mammographic images versus digital breast tomosynthesis images. Radiology. 2019;292(1):69–76. doi:10.1148/radiol.2019182027
 © 2021 The Author(s). This work is published and licensed by Dove Medical Press Limited. The full terms of this license are available at https://www.dovepress.com/terms.php and incorporate the Creative Commons Attribution - Non Commercial (unported, v3.0) License.
By accessing the work you hereby accept the Terms. Non-commercial uses of the work are permitted without any further permission from Dove Medical Press Limited, provided the work is properly attributed. For permission for commercial use of this work, please see paragraphs 4.2 and 5 of our Terms.
© 2021 The Author(s). This work is published and licensed by Dove Medical Press Limited. The full terms of this license are available at https://www.dovepress.com/terms.php and incorporate the Creative Commons Attribution - Non Commercial (unported, v3.0) License.
By accessing the work you hereby accept the Terms. Non-commercial uses of the work are permitted without any further permission from Dove Medical Press Limited, provided the work is properly attributed. For permission for commercial use of this work, please see paragraphs 4.2 and 5 of our Terms.