")
Back to Journals » Pharmacogenomics and Personalized Medicine » Volume 14
Optimization of Busulfan Dosing Regimen in Pediatric Patients Using a Population Pharmacokinetic Model Incorporating GST Mutations
Authors Yuan J, Sun N, Feng X, He H, Mei D , Zhu G, Zhao L
Received 1 November 2020
Accepted for publication 11 January 2021
Published 15 February 2021 Volume 2021:14 Pages 253—268
DOI https://doi.org/10.2147/PGPM.S289834
Checked for plagiarism Yes
Review by Single anonymous peer review
Peer reviewer comments 3
Editor who approved publication: Dr Martin H Bluth
Jinjie Yuan,1,2 Ning Sun,1 Xinying Feng,3 Huan He,1 Dong Mei,1 Guanghua Zhu,4 Libo Zhao1
1Clinical Research Center, Beijing Children’s Hospital, Capital Medical University, Beijing, People’s Republic of China; 2School of Basic Medicine and Clinical Pharmacy, China Pharmaceutical University, Nanjing, People’s Republic of China; 3Phase I Clinical Trials Centre, Luoyang Central Hospital Affiliated to Zhengzhou University, Luoyang, People’s Republic of China; 4Hematology Oncology Center, Beijing Children’s Hospital, Capital Medical University, Beijing, People’s Republic of China
Correspondence: Libo Zhao
Clinical Research Center, Beijing Children’s Hospital, Capital Medical University, 56 Nanlishi Road, Xicheng District, Beijing, 100045, People’s Republic of China
Email [email protected]
Guanghua Zhu
Hematology Oncology Center, Beijing Children’s Hospital, 56 Nanlishi Road, Xicheng District, Beijing, 100045, People’s Republic of China
Email [email protected]
Purpose: The aim of this study was to develop a novel busulfan dosing regimen, based on a population pharmacokinetic (PPK) model in Chinese children, and to achieve better area under the concentration-time curve (AUC) targeting.
Patients and Methods: We collected busulfan concentration-time samples from 69 children who received intravenous busulfan prior to allogeneic hematopoietic stem cell transplantation (allo-HSCT). A population pharmacokinetic model for busulfan was developed by nonlinear mixed effect modelling and was validated by an external dataset (n=14). A novel busulfan dosing regimen was developed through simulated patients, and has been verified on real patients. Limited sampling strategy (LSS) was established by Bayesian forecasting. Mean absolute prediction error (MAPE) and relative root mean Squared error (rRMSE) were calculated to evaluate predictive accuracy.
Results: A one-compartment model with first-order elimination best described the data. GSTA1 genotypes, body surface area (BSA) and aspartate aminotransferase (AST) were found to be significant covariates of Bu clearance, and BSA had significant impact of the volume of distribution. Moreover, two equations were obtained for recommended dose regimens: dose (mg)=34.14×BSA (m2)+3.75 (for GSTA1 *A/*A), Dose (mg)=30.99×BSA (m2)+3.21 (for GSTA1 *A/*B). We also presented a piecewise dosage based on BSA categories for each GSTA1 mutation. A two-point LSS, two hours and four hours after dosing, behaved well with acceptable prediction precision (rRMSE=1.026%, MAPE=6.55%).
Conclusion: We recommend a GSTA1-BSA and BSA-based dosing (Q6 h) based on a PPK model for personalizing busulfan therapy in pediatric population. Additionally, an optimal LSS (C2h and C4h) provides convenience for therapeutic drug monitoring (TDM) in the future.
Keywords: busulfan, individualized therapy, population pharmacokinetics, HSCT, GST mutations
Introduction
Busulfan (Bu) is a common alkylating agent, which can bind to the guanine of intracellular DNA to damage its structure and function.1 Bu-based conditioning schemes are regarded as the cornerstone of allogeneic hematopoietic stem cell transplantation (allo-HSCT) and autologous transplantation because of their myeloablative activity.1,2 However, the IV treatment window of IV Bu recommended by FDA3 is narrow (900–1350 μM·min). Higher exposure (expressed as area-under-the-curve of 0–6 h, AUC0-6h) (>1350 μM·min) may lead to a higher probability of sinusoidal obstructive syndrome (SOS) and acute graft-vs-host disease (aGVHD), while low AUC0-6h (<900 μM·min) of Bu might increase the risk of graft failure.4–6 Therapeutic drug monitoring (TDM) for busulfan based on the first-dose pharmacokinetics (PK) has been confirmed to decrease the occurrence of toxicity and to improve efficacy.7,8
Bu is metabolized by the formation of a glutathione conjugate in the liver.9,10 This reaction is primarily catalyzed by glutathione S-transferase (GST) enzymes, such as GSTA1, GSTM1 and GSTP1.11 GSTA1 is the predominant GST enzyme involved in Bu metabolism, and the activity of GSTM1 is close to the half of GSTA1.12 However, the activity of GSTP1 is relatively weak.2,12 Hence, polymorphisms in the GSTA1 or GSTM1 isoenzymes would most likely affect Bu metabolism. It has been reported that nucleotide polymorphisms (SNPs) for GSTA1, which are linked and located within the proximal promoter of GSTA1 gene, with the *B haplotype resulting in the lower gene transcription.13
Studies about the relationships between GSTA1 mutations and Bu PK have yielded inconsistent results in adults. For example, Abbasi et al14 stated that GSTA1 was not significant influence factor of intravenous (IV) Bu clearance. However, Michaud et al15 reported that adult patients carrying GSTA1 loss of function *B allele were at increased risk of overdosing on their initial busulfan oral dose. Yin et al16 stated adult patients with the GSTA1 *A/*B genotype had a significantly higher AUC, higher peak concentration (Cmax) and lower clearance (CL).
Relationships between GSTA1 mutations and Bu PK in children has not been elucidated as well. According to the basic research, the expression of GST enzymes in children has been reported to be higher than that in adults.17 Furthermore, the activity of GST enzymes is also affected by race. Minor allele frequencies (MAF) taken from 1000 Genomes were reported to differ between Caucasian and Asian populations (https://www.ncbi.nlm.nih.gov/snp/rs3957356#frequency_tab). Until now, there has been only one population PK model for busulfan that successfully incorporated GSTA1 genotype in a Caucasian pediatric population.18 Little study has quantificationally analyzed GST mutations potentially affecting Bu PK in an Asian pediatric population.
In addition to GSTA1 genotypes, the influence of other factors on Bu PK could not be ignored. PPK models developed by Trame et al19 and Booth et al20 emphasized the non-negligible role of BSA and body weight (BW) on individualizing busulfan therapy in children. It has been also suggested that the effect of age,21 primary disease, hepatic function and drug interactions (fludarabine and phenytoin) may partly explain interindividual variability on Bu PK.22–24
The aim of this study was thus to build a population pharmacokinetic (PPK) model with data from pediatric patients, so as to present the PK feature of Bu, to reveal the variability of PK parameters, and to identify the potential contribution of covariates on the disposition of Bu. Then, we tried to develop a novel busulfan dosing regimen, based on the PPK model, to achieve better AUC0-6h targeting. Furthermore, maximum a posteriori (MAP) Bayesian forecasting made use of a PPK model and limited number of samples to forecast AUC0-6h and to formulate an optimal LSS, which is an alternative monitoring strategy.
Patients and Methods
Patients and Treatment Regimens
From March 2019 to April 2020, we collected 76 patients received allo-HSCT. This study followed the tenets of the Declaration of Helsinki promulgated in 1964. The research was approved by the Beijing’s Children Hospital and all patients/parents provided informed consent.
In the pretreatment regimen, intravenous infusion of busulfan (Busulfex, Otsuka Pharmaceutical Co. Ltd, Zhejiang, China) was once every six hours for three or four days, for a total of 12 or 16 doses, and infusion for each dose lasted for two hours. The first dose started seven-to-nine days before HSCT (ie day −7, −8, or −9). The dosage of Bu was based on weight (1 mg/kg for children less than 9 kg, 1.2 mg/kg for children within a 9–16 kg range, 1.1 mg/kg for children between 16 and 23 kg, 0.95 mg/kg for children between 23 and 34 kg, and 0.8 mg/kg for children more than 34 kg) in accordance with the European Medicines Agency (EMA).25 Different conditioning regimens were used dependent on the primary diseases and the types of donor. Briefly, Bu combined with cyclophosphamide (CTX) were the basic components of conditioning chemotherapy. For patients with malignant diseases, regimens containing cytarabine (Ara-C) were commonly applied, while fludarabine (FLU) was administrated for myeloablative treatment of patients with nonmalignant tumors. Specific dosage and duration of different conditioning regimens are shown in Supporting Information Table 1. Phenytoin (PHT) started 30 min before the initiation of Bu therapy in order to prevent central nervous system toxicity caused by Bu. Moreover, cyclosporine (CsA) with or without methotrexate (MTX)/mycophenolate mofetil (MMF) was given as GVHD prophylaxis.
Bu Determination and Genotyping
Blood samples for PK analysis and genotyping were withdrawn from central venous lines, in heparinized glass tubes, pre-infusion, 0.5, 1, 2, 2.5, 4 and 6 hours after the first infusion. Plasma concentrations of Bu were determined using a high performance liquid chromatography-tandem mass spectrometry (HPLC-MS/MS).1 The lower limit of quantitation was 10 ng/mL and the range of quantitation was from 10 to 10,000 ng/mL.
Pretransplant genomic DNA was isolated and extracted from whole blood prior to the first Bu infusion. Improve potassium iodide methods was applied for DNA extraction from whole blood. Ammonium chloride was used to destroy red blood cells, and potassium iodide was used to destroy white blood cells and their nuclear membranes for a short time. Then, proteins, lipids and residual cell debris are precipitated by chloroform/isopropanol. Finally, DNA is precipitated by isopropanol, and was washed by ethanol. The extracted genomic DNA was dissolved with TE. After confirming the DNA concentration and purity, PCR amplification and purification of PCR product were performed. GST genotypes of patients, GSTA1 (rs3957356 and rs3957357, which defines haplotype *A and *B) and GSTM1 (rs3754446), were detected with the ABI 3730XL DNA Analyzer (Applied Biosystem).26 Supporting Information Table 2 displays the primer sets and Tm used for the genotyping assays.
PPK Analysis
BU plasma concentration-time data was analyzed using a nonlinear mixed-effects (NLME) model implemented in Phoenix 8.0 (Certara USA Inc., Princeton, NJ, USA). Typical PPK parameters and their random interindividual variability (IIV) were estimated using a first-order conditional estimation method with extended least squares method (FOCE ELS). One- or two-compartment distribution with first-order elimination were tested as structural model. Exponential errors follows a log-normal distribution, assumed to describe the IIV in PK parameters by the equation Pi=P×  , where Pi is the individual PK parameter of the ith individual, P is the geometric average population value, and ηi is the subject-specific random effect value, normally distributed random variable with a mean of 0 and a variance of ω2.27 Additive, proportional, combined additive, and proportional models were evaluated to account for the intraindividual variability, which were shown by Equation 1~3:


Where  and
and  represented the observed and predicted ith concentration in the jth patient respectively.
  was additive error, and
  was proportional error. The selection of base model was based on changes in −2 log likelihood (−2LL) and on graphic analyses of the goodness-of-fit (GOF).
Based on scatter-plots of individual parameters estimated by base model vs covariates and clinical plausibility, we selected candidate covariates for each PK parameters.28 The influence of potential covariates ([sex, age, body weight, BSA, alanine transaminase (ALT), aspartate aminotransferase, AST; alkaline phosphatase, ALP; total bilirubin, TBIL; creatinine, CRE; creatinine clearance, CLcr; GSTA1 genotypes, *A/*A, *A/*B, *B/*B; GSTM1 genotypes; primary disease, malignant disease, nonmalignant disease; and drug interactions, FLU) on clearance (CL) and volume (V) were further investigated using a stepwise procedure. Categorical covariates were coded as number, and continuous covariates were centered on their median value.27 During forward selection, covariates were defined as significance if the −2LL decreased by at least 3.84 (p≤0.05) following their inclusion in the model. During backward elimination, one covariate could remain in the final model if the −2LL increased by at least 6.63 (p≤0.01) when removed at a time from the full model.
Model Validation
Shrinkage in individual random effects were evaluated in order to assess whether the final model could be capable to estimate individual PK parameters by taking advantage of population typical values and sparse PK data. Shrinkage values of less than 20% indicate that the individual data are rich enough to compute the PK parameters, whereas larger shrinkage values generally mean that individual Bayesian estimates are biased towards the population mean values.29
Graphical observation of the final model adopted GOF, including conditional weighted residuals (CWRES) over population predicted concentrations (PRED) or time after dose (TAD) and the relationship between observed (OBS) and PRED or individual predicted concentrations (IPRED).30 In addition, the final model was evaluated using visual predictive check (VPC) and bootstrap analysis. VPC was based on the final pharmacokinetic estimates and then calculated the 95%CI for concentrations by simulating 1000 individuals. And, VPC compared 5th, 50th, 95th percentiles of the simulated concentrations with those of the observed concentrations. In the bootstrap analysis,31 the 95%CI of the parameter estimates were derived from 1000 datasets of 69 subjects generated by random sampling using the Phoenix NLME.
External validation of the model was performed using an external dataset to evaluate the predictive performance of the final PPK model. The external dataset consisted of 81 busulfan concentrations from 14 children undergoing allo-HSCT. Busulfan plasma concentrations were predicted by fixing the population PK parameters to the final estimates of the previously established model and setting maximum evaluations to 0. From this study, measured concentrations of individual patients assigned to busulfan were compared with calculated concentrations of these individual patients at the same time with our PPK model using their BSA, ALT and GSTA1 genotypes of patients. Differences of <20% between calculated and measured concentrations were allowed.32
Dosing Regimen Optimization
A new dosage scheme using a simulated dataset was designed to achieve a targeted AUC0-6h of 1125 μM·min.25 The distributions of BSA and AST level in the simulated dataset were tried to be coincident with the clinical dataset. The BSA of actual patients were distributed from 0.2 m2 to 1.6 m2, which indicated that BSA of children almost fall within this range. So, the simulated BSA values were set as 0.2, 0.3, 0.4, …, 1.5, and 1.6. As to the simulation of AST, the first consideration is clinical significance. We assumed that every simulated patient (every BSA value) has the possibility of different AST levels, and the setting of simulated AST referred to the opinion of the hematologists. Based on this assumption that the ranges of BSA and AST level in simulated patients were similar between different genotypes, the number of patients carrying GSTA1 *A*A and *A*B was equivalent. A total of 480 simulated patients were included in simulation dataset. The Dosesimulated was designed according to EMA regimen and the simulated dosing frequency was once every six hours. AUC0-6h was the integral of concentration over time (0–6 h). One thousand simulations were conducted in per patient to take into account intraindividual variability. Then, 1000 simulated AUC0-6h values per patient and mean value of each patient were generated in Phoenix-NLME. Model-based doses were recommended according to the following Equation 4:

Then, AUC0-6h, recommended values were simulated according to the new recommended doses (Doserecommended). Variabilities of AUC0-6h, recommended were shown by the range between minimum and maximum values and the coefficient of variation (CV). The rate of achieving the targeted AUC window (900–1350 μM·min) was also listed. Finally, we plotted the relationship between recommended dose and BSA, and derived the regression equations. Meanwhile, in order to facilitate clinical application, we present a piecewise dosing nomogram based on BSA categories for each genotype.
In order to verify the application of new regimen, we explored how it worked for the real patients whose data was used in the development of PPK model (n=69) and its external validation (n=14). We calculated the recommended doses for the real patients based on regression equations. And, the relevant predicted AUC0-6h was calculated as follows: AUCpredicted=(AUCobserved/Doseadministrated)×Dosedesigned. Then, we checked whether the expected AUC0-6h fell within the therapeutic window (900–1350 µM∙min).
Moreover, we performed a comparison with other five analogous pediatric PPK models for busulfan. Doses were designed based on the individual Bu CL obtained from each publication18,20,21,33,34 and target AUC0-6h (1125 µM∙min). The detail dosing regimens have been demonstrated in Supporting Information Table 3. The predicted AUC0-6h was calculated as mentioned above and was checked.
Optimized Sampling Scheme
The final PPK model provides information on typical PK parameters and variabilities associated with these values as well as how specific covariates (eg BSA, AST, genotypes) influence the PK of Bu. After evaluating final model predictive performance, optimal LSS was considered to optimize the sampling scheme for TDM. Candidate sampling points included: (1) 2, 2.25, 4, and 6 h; (2) 2, 2.5, 4, and 6 h; (3) 2.25, 2.5, 4, and 6 h; (4) 2, 4, and 6 h; (5) 2.25, 4, and 6 h; (6) 2.5, 4, and 6 h; (7) 2, 2.25, and 4 h; (8) 2, 2.25, and 6 h; (9) 2, 2.5, and 4 h; (10) 2, 2.5, and 6 h; (11) 2.25, 2.5, and 4 h; (12) 2.25, 2.5, and 6 h; (13) 2, and 4 h; (14) 2, and 6 h; (15) 2.25, and 4 h; (16) 2.25, and 6 h; (17) 2.5, and 4 h; (18) 2.5, and 6 h after the beginning of the first infusion. The plasma drug concentration at 2.25 hs after administration was simulated by the final model. Each candidate LSS was tested by Bayesian method to obtain AUC0-6h of each patient. APE, MAPE and rRMSE were calculated by comparing the predicted AUC0-6h derived from the LSS with the actual AUC0-6h obtained from each patient’s full concentration-time samples, as according to Equation 5~7 to evaluate predictive accuracy:
The lower the MAPE value, the better the LSS. A sampling strategy was considered to display a good predictive performance when the 95%CI around the MAPE was less than 20% of the reference Bu AUC0-6h values.35 Bland–Altman plots were applied to assess the agreement between the predicted and the actual AUC0-6h, and the difference was expressed as a mean ±1.96 SD.
Definition of Clinical Outcomes
The definition of engraftment was absolute neutrophil count (ANC) ≥0.5×10⁹ per liter for the first three days in a row and platelet count (PLT) ≥20×109 per liter for the first one week after HSCT.8,16 Primary engraftment failure was defined as failing to reach an ANC of 0.5×10⁹/L within 30 days after HSCT.16 In brief, the diagnosis of SOS was according to the modified Seattle criteria.36 The Mount Sinai Acute GVHD International Consortium (MAGIC) was taken as the diagnostic criterion for aGVHD.37
Statistical Analysis
Associations with pharmacokinetics parameters (CL and AUC0-6h) and GSTA1 mutations were tested with t-test,38 whereas time-to-event data was compared by the log rank test. All statistical analyses were performed with SPSS version 21.0 (IBM Inc., IL, USA). In this study, P-values <0.05 are considered as statistical significance, and P-values <0.1 were deemed as trends.
Results
Population Characteristics
From March 2019 to April 2020, 76 patients underwent allo-HSCT and received IV busulfan. The GSTA1 genotypes for four patients and GSTM1 genotypes for six patients were missing because of samples being unavailable or detection failure. GSTA1-52C and T defined haplotype *A and *B, respectively. In relation to GSTA1-52T/C and −69A/G SNPs, a higher percentage of CC/GG (78.08%) vs TT/AA (1.37%) and CT/GA (20.55%) was found in our model-building patient cohort. There was only one patient with GSTA1 *B*B. Thus, 69 patients were included in our final PPK analysis. Table 1 summarizes characteristics of patients including demographics, primary diseases, donor types and conditioning regimens. Supporting Information Table 4 further elaborates patients’ diagnoses. The genotyping results are shown in Table 2.
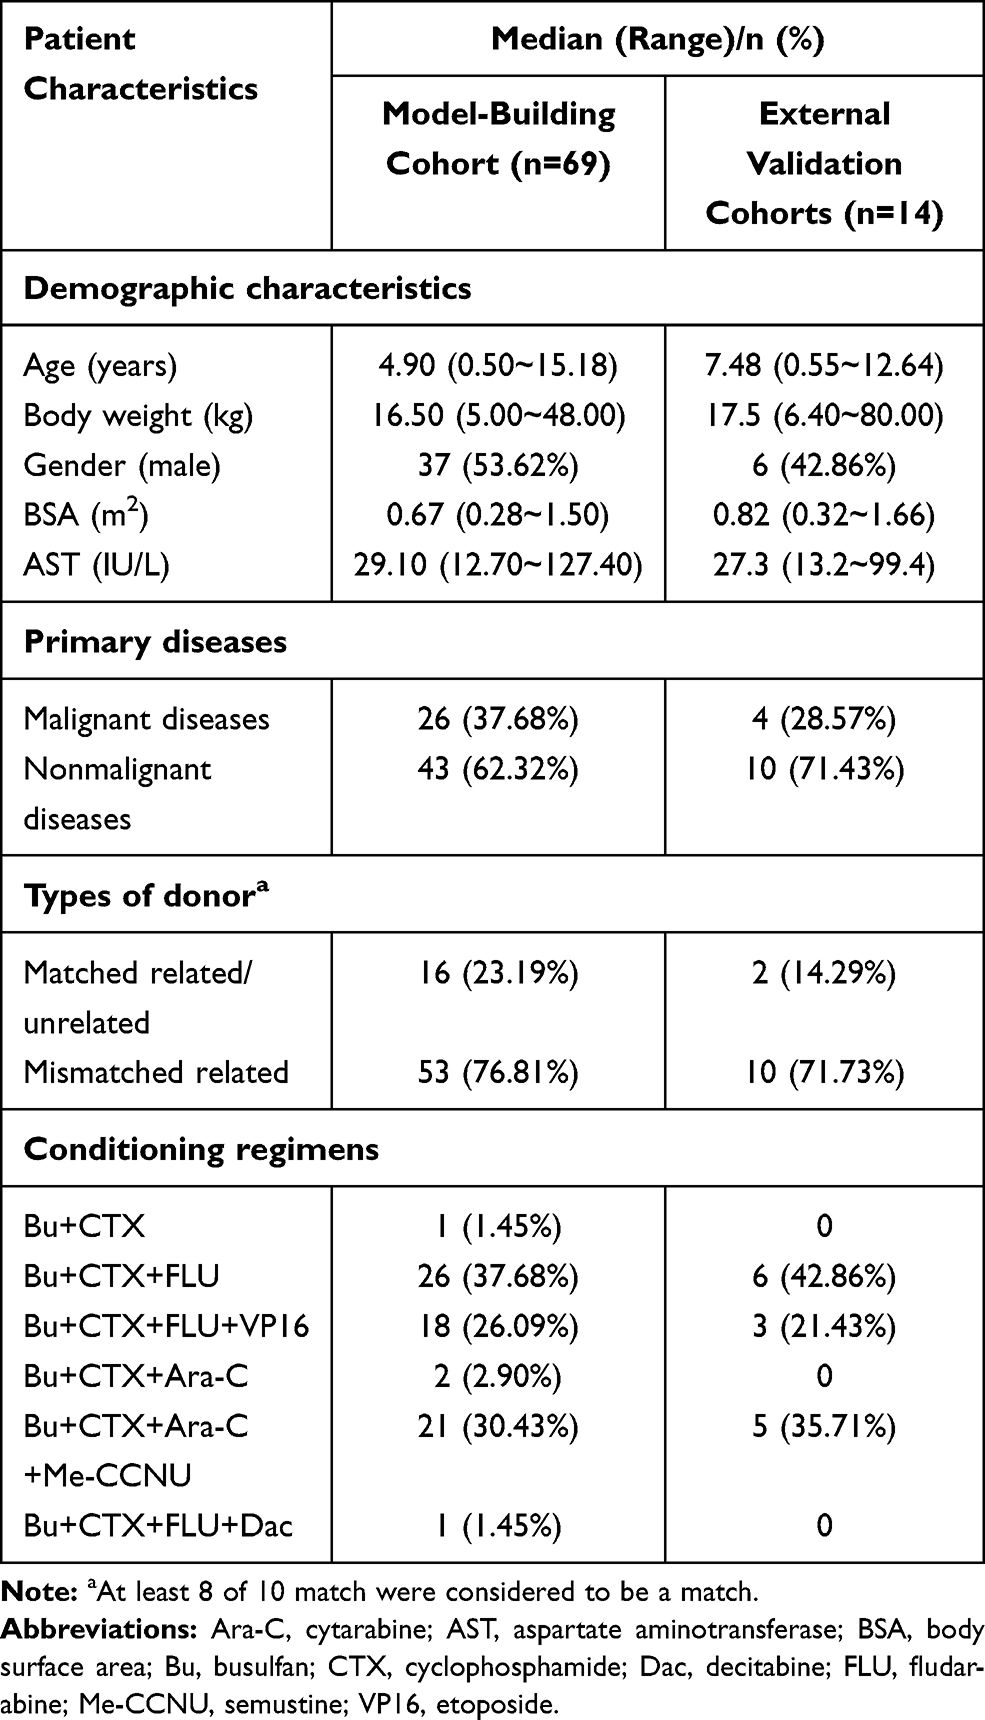 |
Table 1 Patients’ Demographic and Clinical Characteristics of Model-building |
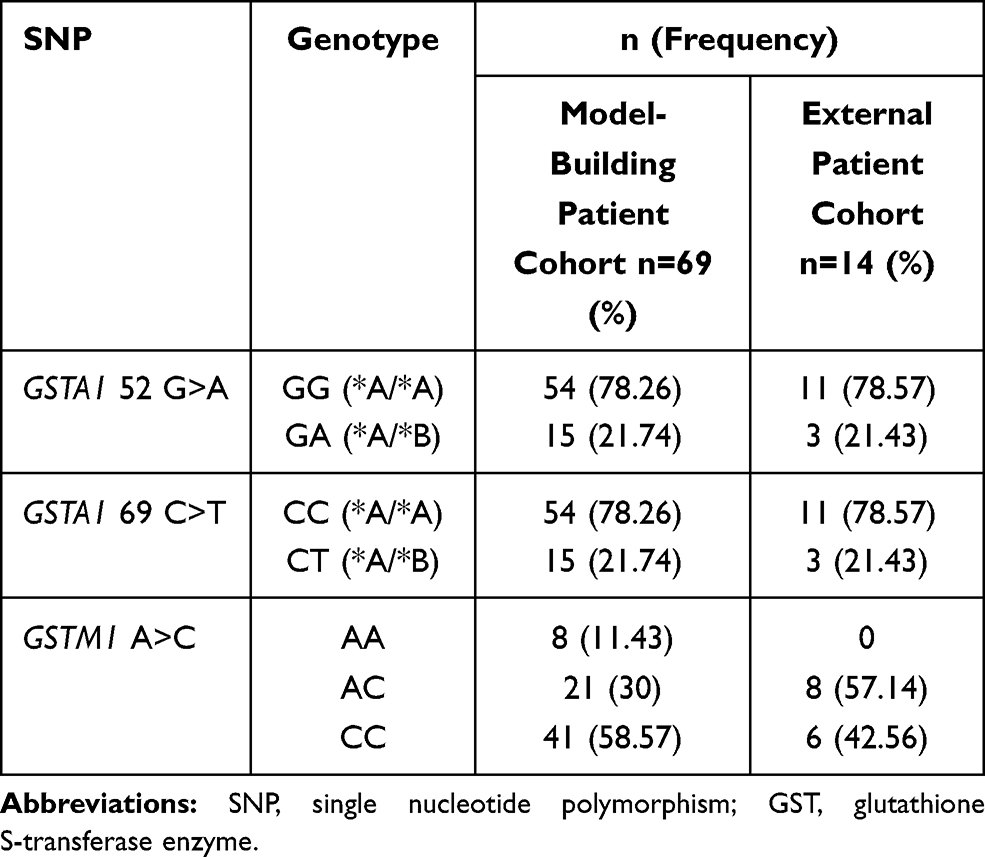 |
Table 2 Genetic Characteristics of Study Population |
PPK Model
A total of 398 blood samples were collected for the PPK analysis. Figure 1 plotted concentration–time profiles of Bu. A one-compartment model with first-order elimination was suitable to describe the profiles of busulfan pharmacokinetics, and the exponential model was feasible to estimate the interindividual variability. Neither proportional error model nor additive error model could perform well, while a combined proportional and additive residual error model provided an adequate fit (Δ-2LL >20, p<0.001).
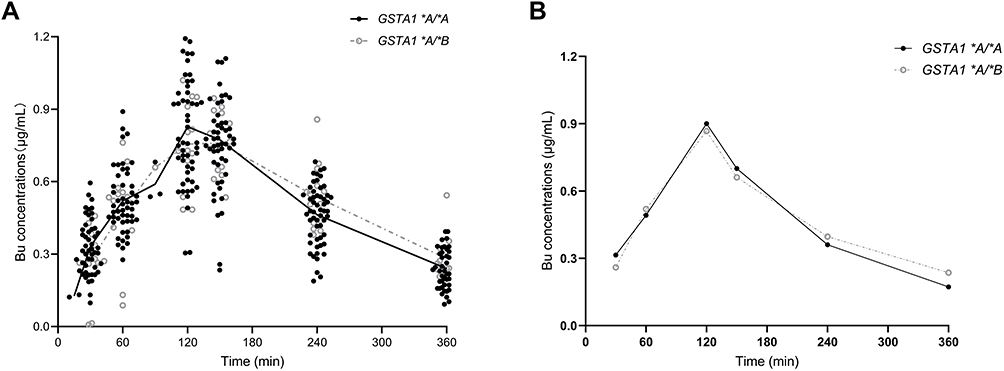 |
Figure 1 Observed busulfan concentrations plotted vs time. The filled dark dots represent the observed concentrations of patients with GSTA1 *A/*A. Gray circles represent the observed concentrations of patients with GSTA1 *A/*B. The solid black lines and gray dashed lines represent the mean (A) and “typical subjects” (B) of the observed concentrations of patients with GSTA1 *A/*A and GSTA1 *A/*B, respectively. “Typical subjects” of two genotypes were chosen based on the PPK model profile. Abbreviation: GST, glutathione S-transferase enzyme. |
In the forward model building step, BSA, AST, types of primary diseases and GSTA1 genotypes declined the value of −2LL by more than 3.84 (p<0.05) at each addition. The GSTA1 mutation, BSA and the level of AST significantly affected the clearance (CL) of busulfan. Meanwhile, the volume (V) of busulfan was influenced by BSA and types of primary diseases, while the GSTM1 genotypes had no significant effect on PK parameters.
During backward elimination, the value of −2LL increased significantly (Δ-2LL >6.63, p<0.01) when respectively removing the GSTA1 mutation, BSA and the level of AST out of the model. Thus, the three covariates mentioned above could remain in the final model. Types of primary diseases were eliminated in the final model because it failed to significantly increase the −2LL value (Δ-2LL=6.333, p>0.01). Table 3 presented the detailed PK parameters of the base and final model, which were standardized to the median BSA, median AST and GSTA1 *A/*A. The CL and V of busulfan were affected by the GSTA1 genotypes, BSA and AST as illustrated by the following Equations 8 and 9:
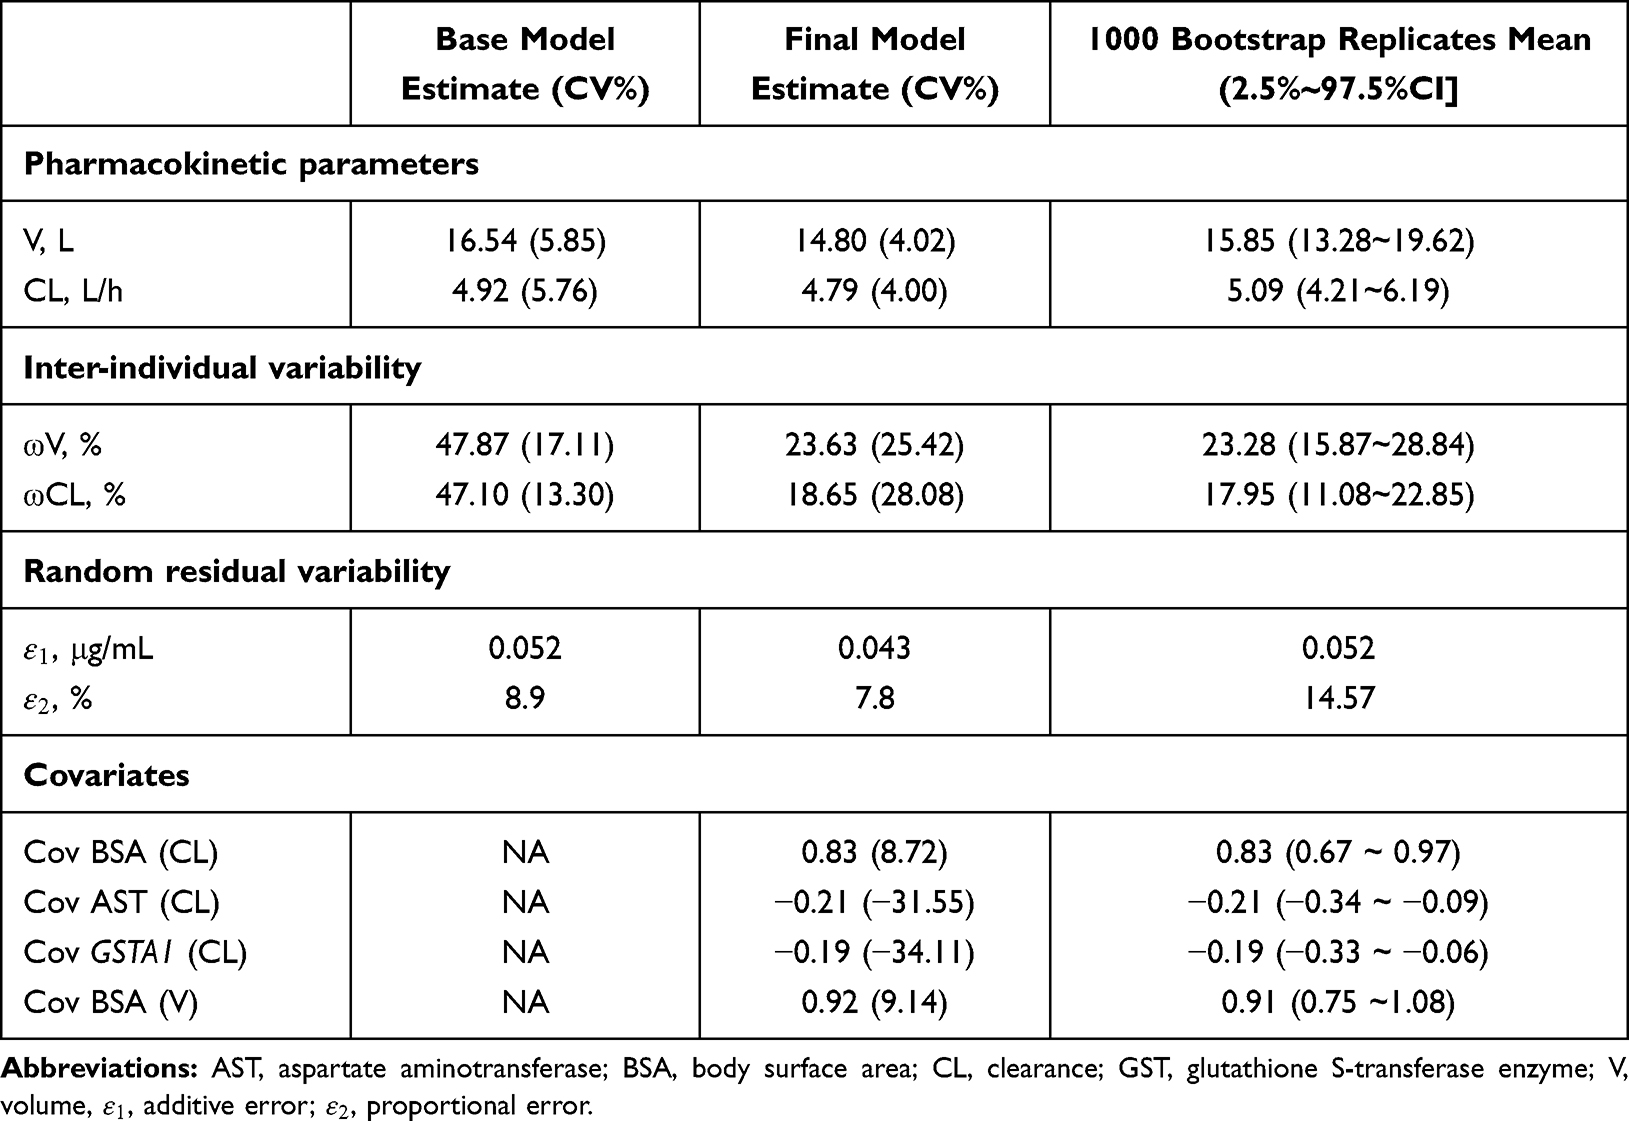 |
Table 3 Final PPK Model: Pharmacokinetic Parameter Estimates and Bootstrap Results |
When patients carried the GSTA1 *A/*B mutation, GSTA1 = 1, and when patients carried the *A/*A genotype, GSTA1 = 0.
Population estimates for a patient with median BSA with GSTA1 *A/*A were CL 4.79 L/h and V 14.8 L. The values of interindividual variability for CL and V were 18.65% and 23.63%, respectively. CL of patients carrying the GSTA1 *A/*B genotype was predicted to decline by 17.3% compared with those carrying GSTA1 *A/*A. As a result, CL/BSA between two genotypes had a significant difference (p=0.0103), in spite of AUC0-6h/BSA without significant difference (Figure 2).
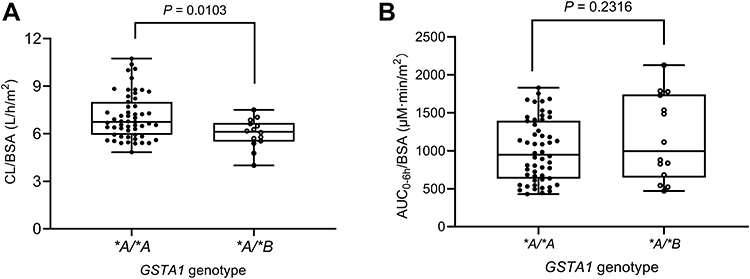 |
Figure 2 The effect of GSTA1 genotypes on CL/BSA (A) and AUC0-6h/BSA (B). AUC0-6h, area under the concentration-time curve of 0–6 h. Abbreviations: BSA, body surface area; CL, clearance; GST, glutathione S-transferase enzyme. |
Model Evaluation and Validation
Shrinkage values of clearance and volume were respectively 0.207 and 0.130, which manifested that the model-building dataset was rich enough to compute the PK parameters of busulfan in children.
Compared with the base model, the −2LL value of final model declined by 175.26, which indicated that the model improved substantially after incorporating covariates, BSA, AST and GSTA1 phenotype. As demonstrated in the scatter plots of OBS vs PRED (Figure 3A and B), the PRED strongly deviated from the OBS in the base model, but PRED agreed with the OBS in the final model. In addition, the CWRES in the final model were more uniformly distributed within the accepted range (y=±2) than that in the base model (Figure 3C and D). Supporting Information Figure 1 shown the OBS vs IPRED and CWRES vs TAD of final model. As a whole, the final model was visually improved in terms of the GOF and had a more accurate predictive performance.
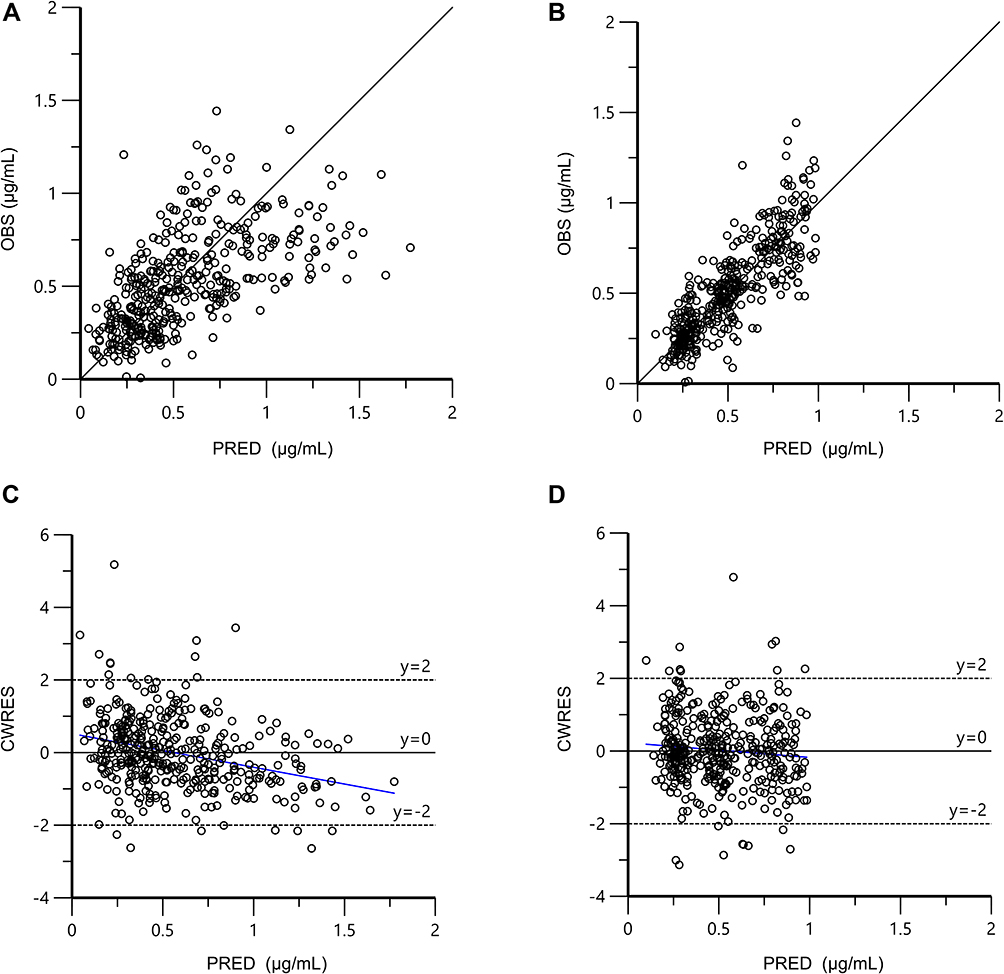 |
Figure 3 Goodness-of-fit plots of the base model and final model. (A) OBS vs PRED of base model; (B) OBS vs PRED of final model; (C) CWRES vs PRED of base model; (D) CWRES vs PRED of final model. The black solid lines are the reference lines, and blue solid lines are the linear regression lines. Abbreviations: CWRES, conditional weighted residuals; OBS, observed concentrations; PRED, population predicted concentrations. |
The estimated values generated by bootstrap analysis were close to the parameters in the final model, which also fell within 95%CIs (Table 3). Thus, it can be considered that the final model was accurate and robust. Figure 4 clearly displayed that 5th, 50th, and 95th percentiles of simulation values almost coincided with that of observed concentrations. The results of VPC combined with bootstrap analysis confirmed the exactitude of the parameter estimates and demonstrated the reliability of the final model. For external validation, a mean difference of 18.48% was observed in the simulated Bu concentrations generated using the established PPK model when compared with the observed Bu concentrations (Figure 5).
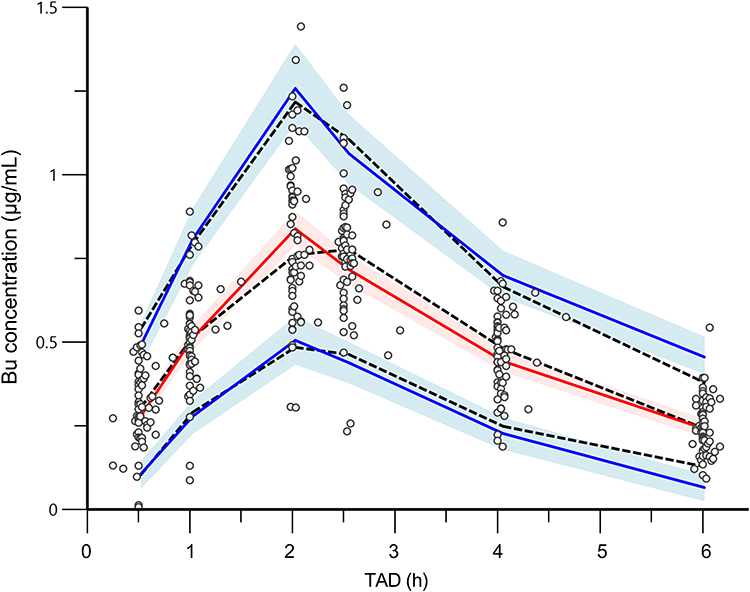 |
Figure 4 Visual prediction check of final model. The dots represent observed concentrations and dashed lines represent 5th, 50th, and 95th percentiles of observed concentrations; solid lines represent 5th, 50th, and 95th percentiles of simulated concentrations; shaded areas represent 95%CIof the 5th, 50th, and 95th prediction intervals. Abbreviation: TAD, time after closing. |
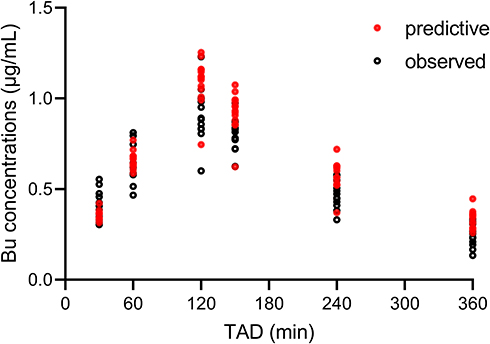 |
Figure 5 Comparison between the predictive and the observed busulfan concentrations by time from external population. Black circles represent the observed Bu concentrations; red dots represent the predictive Bu concentrations. Abbreviation: TAD, time after dosing. |
New Dosing Strategy and Simulations
Based on target AUC, recommended doses (Q6 h) of per BSA were obtained. There was a linear relationship between dose and BSA (Figure 6A). The linear Equation 10 and 11 for GSTA1 *A/*A and *A*B was respectively, in which the range of BSA was 0.2 m2 to 1.6 m2:


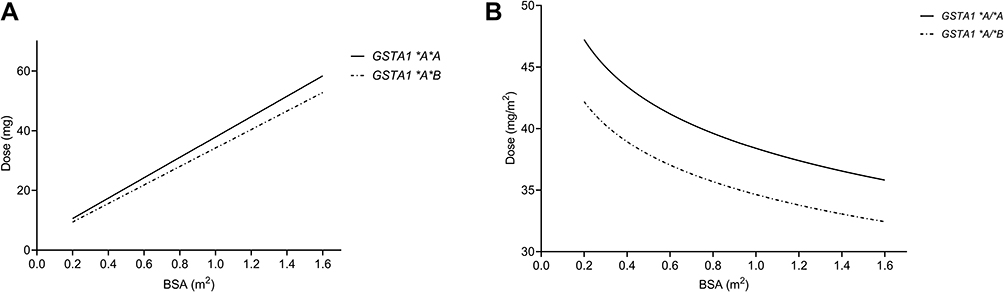 |
Figure 6 Dosing curves: total doses in mg (A) and doses in mg/m2 (B). The solid line and dashed line respectively represent dosage for patients with GSTA1 *A/*A and GSTA1 *A/*B. Abbreviations: BSA, body surface area; GST, glutathione S-transferase enzyme. |
The dosages were normalized by BSA (mg/m2) due to the fact that body size-based dosing is more familiar to pediatricians. As demonstrated in Figure 6B, the doses normalized by BSA (Dose/BSA) were shown to be a homographic function of BSA. Dosages according to this hyperbola would be inconvenient for application in clinical, so a nomogram of BSA categories was derived. Three dosages for each genotype were then defined according to selected BSA categories in order for convenient clinical application. Finally, a new dosing strategy (once every six hours) based on BSA normalization was listed in Table 4.
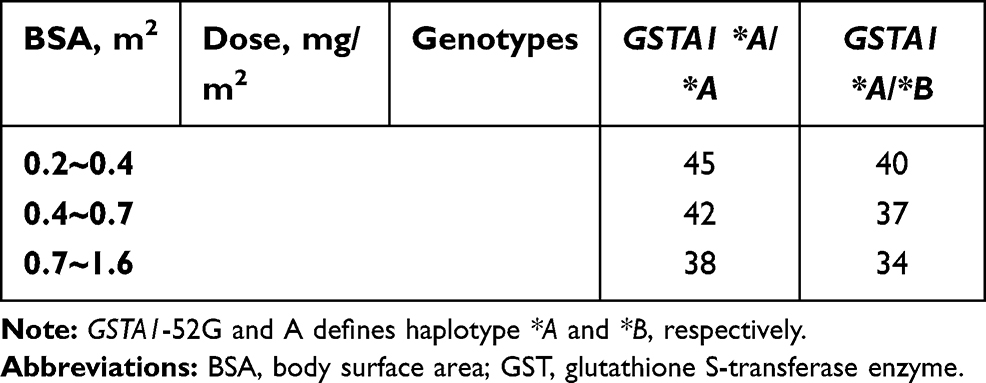 |
Table 4 New Dosing Strategy (Q6h) Based on BSA Normalization |
BSA-based dosing recommended by the final PPK model was helpful for targeting the patient AUC. The success rate of achieving the targeted AUC0-6h window (900–1350 μM·min) was 99.58% in simulated patients. The new dosage yielded homogeneous AUC0-6h values in different BSA categories, and the CV of 7.57% in AUC was low.
Approximate 80% of the predicted AUC0-6h of real patients fell within the therapeutic window, which verified the applicability and feasibility of the new regimen once again. As for the other five dosage schemes, their success rates were all below 50%.
Limited Sampling Strategies
Eighteen models with different sampling time points are all listed in Table 5. The relationship between the predicted and actual AUC0-6h for these models is shown in Supporting Information Figure 2. From two to four-point models, 83.33% LSSs fitted well with the correlation (r2) of more than 0.85. Prediction precision of LSSs expressed as rRMSE and MAPE is also given in Table 5. Model 2 (C2h, C2.5h, C4h and C6h) showed not only the best fit to the Bu AUC0-6h, but also better prediction precision (rRMSE=0.72% and MAPE=4.55%) than other LSSs. Among the three-point models, Model 9 (C2h, C2.5h, and C4h) and Model 10 (C2h, C2.5h, and C6h) both behaved well, and with similar prediction precision to Model 2. Within these models, no patients had an AUC0-6h lower than −15% or higher than +15% of the reference value. As for these two-sampling schemes, Model 13 (C2h and C4h), Model 14 (C2h and C6h), Model 17 (C2.5h and C4h), and Model 18 (C2.5h and C6h) had relatively low rRMSE and MAPE. As the Bland–Altman plots shown, the means difference between actual and predicted AUC0-6h were close to 0, and dots almost fell within the lines of mean ±1.96 SD, which indicated that the actual and predicted AUC0-6h agreed well in the seven models above (Supporting Information Figure 3).
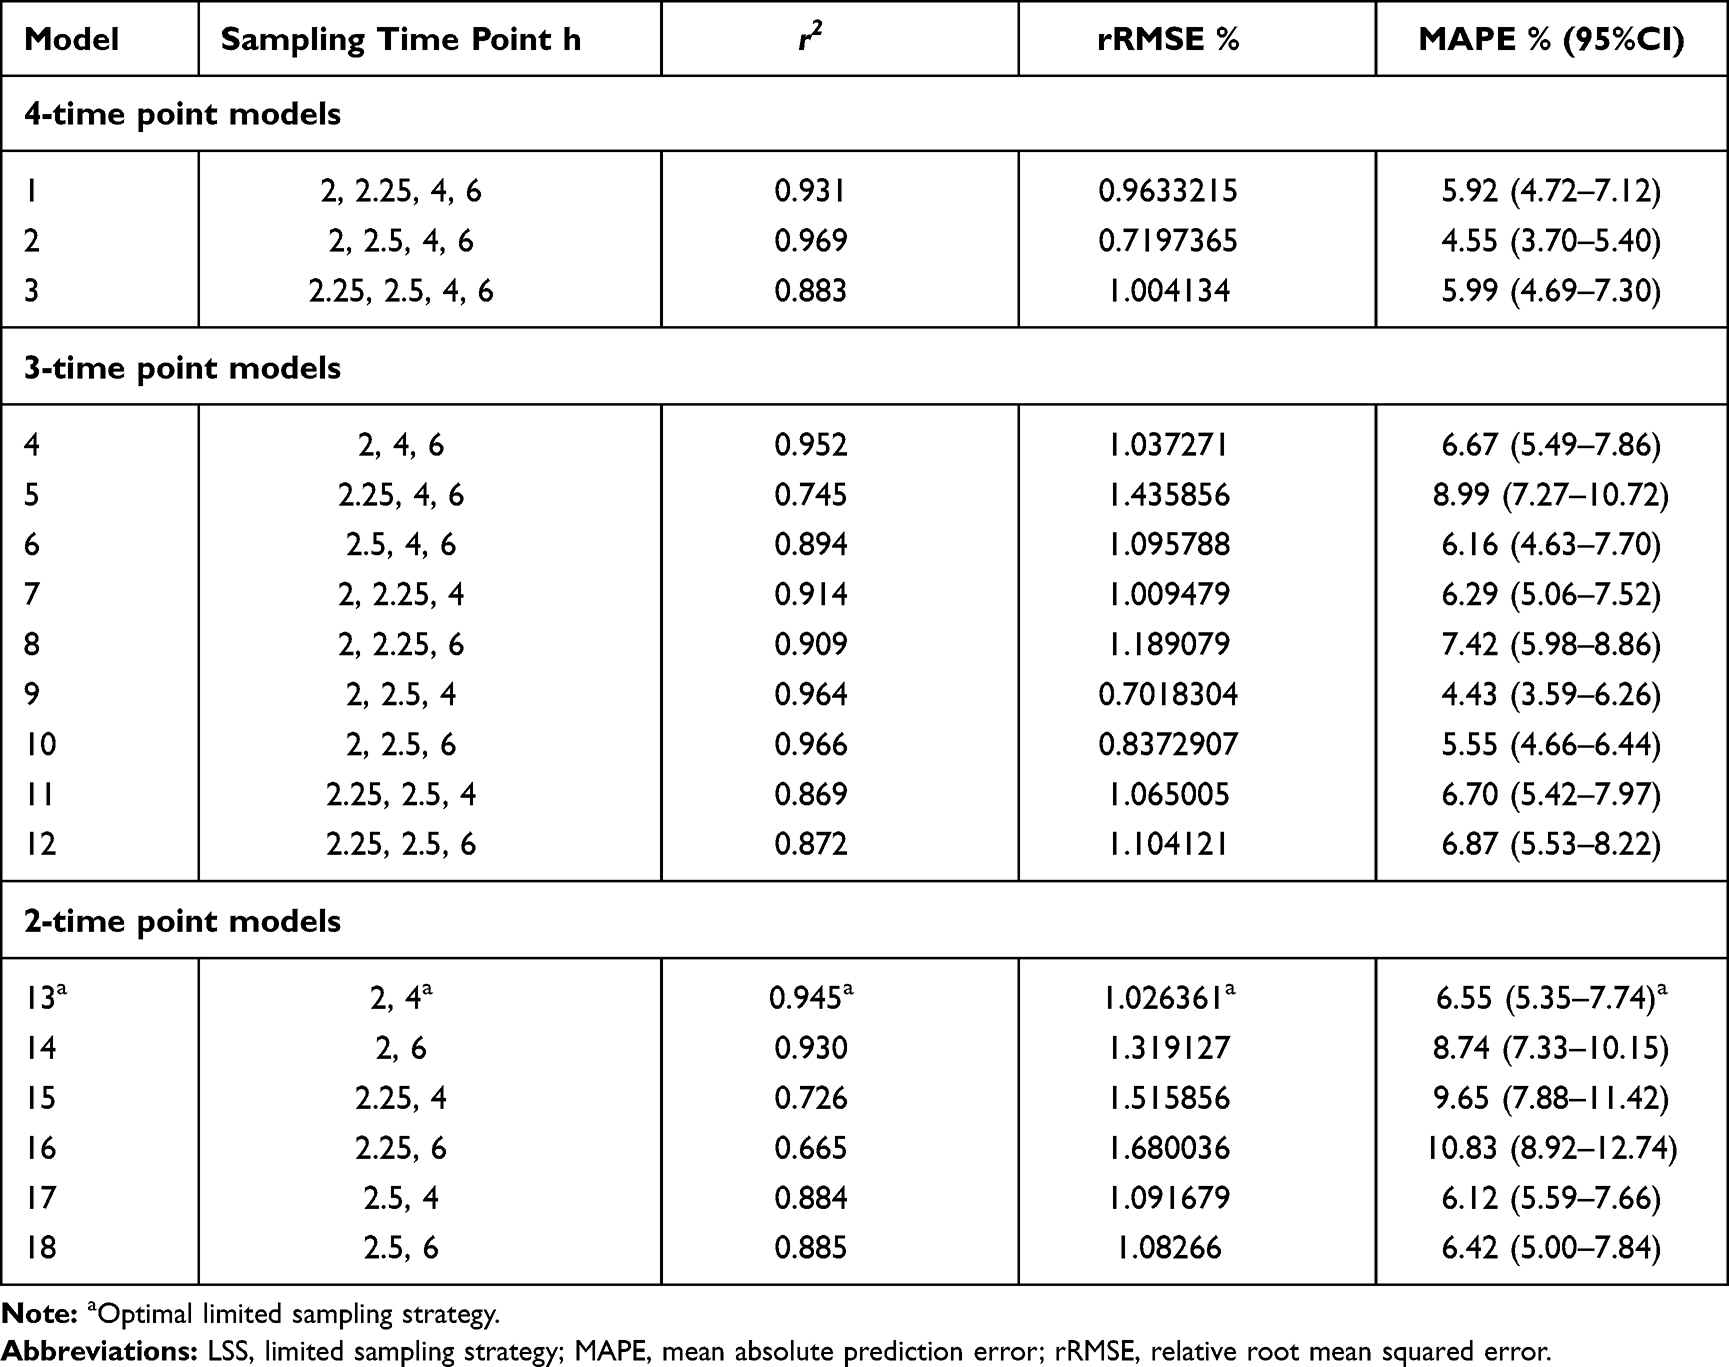 |
Table 5 LSSs for IV BU Determined by Bayesian Estimate After the First Dose |
Clinical Outcomes
Among the clinical outcomes analyzed (n=69), five patients died after HSCT, one of whom died of SOS and the other four died of severe infection. Graft failure occurred in two patients with AUC0-6h of 659.9 and 482.7 μM·min. Engraftment was achieved for 97.10% of patients (median time: 12 days, range: 10–19 days) for neutrophils within 30 days after transplantation and 59 patients achieved engraftment for platelets within a median of 15 days (range: 7–30). As shown in Figure 7, there were significant differences in ANC recovery and survival rate between patients with two GSTA1 genotypes (p<0.05). Seven patients (10.14%) developed SOS and aGVHD I–IV was documented in 57 patients (82.61%). The clinical outcomes of patients with two GSTA1 genotypes were compared in Supporting Information Table 5.
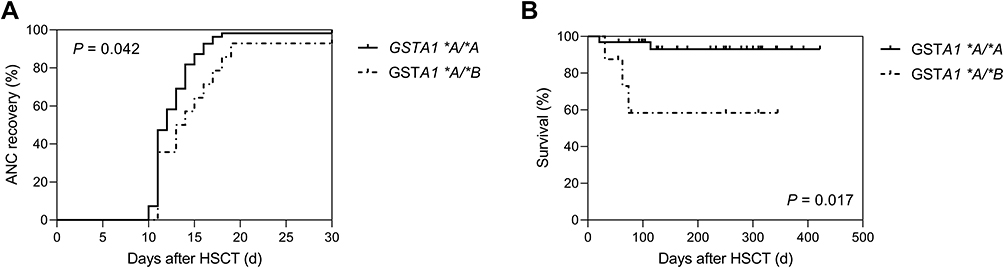 |
Figure 7 GSTA1 polymorphism and clinical outcomes of HSCT. ANC recovery (A) and survival rate (B) plotted against two GSTA1 genotypes. The solid line and dashed line respectively represent clinical outcomes of patients with GSTA1 *A/*A and GSTA1 *A/*B. P values are shown on the plots. Abbreviations: ANC, absolute neutrophil count; GST, glutathione S-transferase enzyme. |
The logistic regression model was put into use to investigate whether Bu AUC0-6h had an impact on the incidence of aGVHD I–IV, SOS or death, while Supporting Information Figure 4 revealed that no correlation between Bu AUC0-6h and regimen-related toxicity or mortality was observed.
Discussion
This study developed the first PPK model for busulfan that successfully incorporated GSTA1 genotypes in a Chinese pediatric population and partly explained the source of variability of busulfan clearance, suggesting that GST genotyping would be necessary for optimization of pediatric Bu treatment.
The literature until now has been controversial regarding the correlation between Bu clearance with genetic mutations.39 There have been several research studies supporting the positive association between GST mutations and Bu clearance. In a pediatric multicenter study, Ansari et al13 reported that the activity of GSTA1 promoter was significantly descended in the case of *B haplotype compared with *A haplotype. Another study succeeded in incorporating the GSTA1 genetic variants into a PPK model for Bu in a Caucasian pediatric population, and then tailored the dose according to the individual metabolic capacity.18 For Chinese adults, Yin et al16 concluded that patients with GSTA1 *A/*B genotype possessed a higher Cmax, higher AUC and lower clearance than the group with GSTA1 *A/*A genotype. Furthermore, in a recent study of Japanese pediatric population (n=20), Nishikawa et al40 stated the correlation between GST mutations and clearance was distinguished.
In our two cohorts (n=84), the frequency of GSTA1 *B haplotype was 11.9% (MAF=0.119). In other words, a minority of patients had the *B haplotype, of which 1.19% were homozygous (GSTA1 *B/*B). Therefore, the MAF of Chinese patients was lower than that of global population (MAF=0.306) taken from 1000 Genomes (https://www.ncbi.nlm.nih.gov/snp/rs3957356#frequency_tab). Apart from the significant discrepancy of the MAF between different populations, the distribution of haplotypes differences existed.13 Therefore, studies in Caucasians could not completely represent that in the Asian population. Besides, in a study conducted in patients with acute myeloid leukemia, Yee et al41 found that C allele in the GSTM1 locus (rs3754446) was associated with decreased Bu AUC of first dose and lower disease-free survival. Thus, GSTA1 and GSTM1 genotypes were taken into consideration in the present study when exploring the influence of GST mutations on Bu PK in Chinese children.
A population pharmacokinetic model of Bu was developed to test the influence of gene mutation on the pharmacokinetic characteristics. In the final model, the estimate value (per BSA of 0.67 m2) of CL was 4.79 L/h and of V was 14.8 L. Patients carrying the GSTA1 *A/*B genotype had a 17.3% lower clearance than those carrying GSTA1 *A/*A, which is consistent with previous studies reporting that the presence of the mutation allele probably resulted in the decreased activity of GST enzyme.12 It can be seen that GSTA1 mutations were associated with Bu CL either in Chinese children or in Caucasian children. According to the Stevenson formula [BSA (m2)=0.0061×height (cm)+0.0128×weight (kg)–0.1529], the BSA of normal adult of 70 kg and 180 cm was calculated as 1.8411 m2. The results of CL in the present study were normalized to 11.08 L/h (per BW of 70 kg) for GSTA1*A/*A. Nava et al18 reported that CL in Caucasian children was 14.66 L/h for rapid metabolizers, which was a little faster than that in Chinese children. However, genetic variation in GSTM1 showed no significant impact on Bu CL, likely because the function of the GSTM1 enzyme involved in Bu metabolism was less than the GSTA1 enzyme. In the further research, merging data from multiple studies may be helpful to more precisely estimate the busulfan PK.
As shown in Figure 1, the distribution phase (0–2 hs after dosing) shown large heterogeneity between two genotypes, which may slightly interfere the statistical analysis of AUC0-6h. Nevertheless, in the eliminate phase, it was obvious that patients with GSTA1 *A/*A appeared higher CL than those with GSTA1 *A/*B. Thus, as Figure 2 reflected, there was a significant difference in clearance per body surface area between the two GSTA1 genotypes, but there was no significant difference in AUC0-6h per body surface area. Theoretically, AUC depends on the dose as well as CL. The dose administered in this study was adjusted according to body weight and the actual dosage was usually based on rounding, which may contribute to some variability observed in the infusion phase. Generally, no significant difference of AUC0-6h seemed reasonable.
In the final PPK model constructed in this study, AST levels were negatively correlated with CL of Bu in pediatrics and CL declined 38.34% when AST increased from 12.7 to 127.4 U/L. This is unsurprising because busulfan is mainly eliminated by the liver as previously described. AST marks hepatocyte lesion, meaning that the higher the AST level, the more severe the liver damage. Consequently, patients with higher AST have a decreased ability to metabolize busulfan.
This study divided the patients into two subpopulations (malignant and nonmalignant diseases), which had no significant effect on the pharmacokinetic parameters of Bu. The conclusion was consistent with previous studies.42,43 In fact, malignant diseases could be subdivided into seven types according to pathology, and nonmalignant diseases included six types. Nevertheless, some of the pathologies, such as osteopetrosis, were rare and present in only a small number of patients, resulting in an impossible comprehensive evaluation of the impact of diseases on Bu PK. Hence, the number of different types of cases needs to be expanded in order to analyze the specific impact of every primary disease on Bu PK.
The medication interaction with fludarabine and busulfan has not been widely confirmed. Although Yeh et al44 reported that CL of IV Bu decreased significantly in patients receiving concomitant fludarabine administration, majority of studies did not observe changes in busulfan CL between patients with or without fludarabine.45,46 Not surprisingly, in this PPK model, the inclusion of fludarabine as a covariate failed to significantly reduce the value of −2LL during the forward selection. In fact, patients in our cohort received one of the two regimens, Bu/CTX/FLU and Bu/CTX/Ara-C, as basic conditioning therapies. Although we only regarded FLU as a candidate covariate, in fact the influence of Ara-C has been also reflected in the model. When FLU=1, the impact of FLU was added to the model, and when FLU=0, the effect of Ara-C was included.
BSA was the most predictive covariate for CL and V, explaining 25.50% and 24.17% of the observed IIV, respectively. Weight-based dosing schedules were calculated with five fixed doses, however the model established by this study showed that body weight is not a significant predictor of Bu PK in children. In addition, in a retrospective study, SOS and early infectious complications occurred more frequently in the weight-based dosing group.47 Besides, a PPK model, developed among patients of all ages, revealed that the maturation of Bu clearance reaches half of adult values at six weeks after birth.42 Furthermore, in children, Bu concentration did not show an obvious trend of change with postnatal age, which strongly supported the conclusion drawn from our cohort that BSA explained interindividual difference better than age. According to the PPK model established with Chinese pediatric patients, BSA-based dosing scheme was recommended. When compared with weight-based dosage, the new dosing scheme not only took the influence of GSTA1 mutation into consideration, but could also be applied to patients with varying degrees of liver damage. More importantly, in weight-based dosing regimens, only eight patients reached the window of 900–1350 μM·min. The validation analysis demonstrated that the new BSA-based dosage enabled almost all of the simulated patients to achieve the target AUC0-6h, and greatly improved the success rate of obtaining the therapeutic window in real patients. Since this new dosing regimen was based on a retrospective analysis, a prospective study is necessary to confirm the benefits in terms of efficacy and safety.
Based on the final PPK model, Bu Bayesian estimation of individual AUC0-6h values were performed by using various combinations of two-to-four sampling times within six hours following busulfan administration. Until this point, several LSS strategies have been established to predict BU exposure. Most LSS strategies published were estimated by using the trapezoidal rule (TR) or multiple linear regression (MLR), which usually reduced the accuracy of estimation. For example, Vaughan et al48 concluded that four-to-five sampling points (3, 4, 5, and 6 h or 2, 3, 4, 5, and 6 h after dosing) could predict well in adult patients receiving IV Bu four times daily. Teitelbaum et al49 developed an LSS with four sampling points (0, 2, 3, and 4 h after the start of the second infusion). To achieve a more accurate estimate of AUC of every LSS, PPK models, considered to be the gold standard, should be applied.
Theoretically, there is no absorption phase of IV Bu and Cmax usually occurs at the infusion end. During the actual clinical nursing process, the infusion pump completes the titration in two hours, but there is still a little of the drug solution in the infusion tube, which may lead to the delay of Tmax (the time to peak concentration). Assuming the peak concentration fell within 2~2.5 h, we tried to choose optimal Tmax among 2, 2.25, and 2.5 h. C4h and C6h were regarded as time points of elimination phase. Since the metabolism of busulfan conformed to the one-compartment model, selecting C4h or C6h on behalf of elimination phase had a similar predictive function. Model 9 (C2h, C2.5h, and C4h) and Model 10 (C2h, C2.5h, and C6h) elevated the accuracy and precision of prediction while increasing medical costs and pain for children. Model 13 (C2h and C4h) not only had a better predictive performance by rRMSE, MAPE and Bland–Altman analysis, but was also more in line with the clinical requirement of reducing sampling points for TDM. Finally, considering the accuracy of prediction and the feasibility of pediatric clinical practice synthetically, Model 13 was selected as the optimal LSS.
The relationship between pharmacokinetics and outcome or toxicity of busulfan reported previously are summarized in Supporting Information Table 6. It can be seen that conclusions drawn out from different research studies were discrepant. In the current study, no relationship between busulfan PK and toxicity was observed (Supporting Information Figure 4).
In terms of ANC recovery and survival rate, there were significant differences between patients with two GSTA1 genotypes (p<0.05) in our study (Figure 7). Until now, no research has reported the relationship between GST mutations and engraftment. Ansari et al reported that individuals with poorer metabolism of Bu had also lower overall survival (OS) and GSTA1 *B haploid was associated with higher incidence of treatment-related toxicity.13 To confirm the long-term efficacy and toxicity of busulfan and explore their influencing factors, research with a larger sample size would be necessary.
Conclusion
In summary, this study was the first PPK model for busulfan that successfully incorporated GSTA1 genotypes in a Chinese pediatric population, suggesting that genotypes would be necessary for optimization of pediatric Bu treatment. Moreover, a BSA-based dosing regimen has been recommended for individual busulfan therapy in order to weaken variability in busulfan exposure and to enhance the safety and efficacy of Bu treatment. Finally, an optimal LSS (C2h and C4h) would be convenient for TDM in the future.
Data-sharing Statement
The data sets generated during and/or analyzed during the current study are available from the corresponding author (Libo Zhao) on reasonable request.
Ethics Statement and Consent
This study followed the tenets of the Declaration of Helsinki promulgated in 1964. The research was approved by the Beijing’s Children Hospital and all patients/parents provided informed consent.
Acknowledgments
This project was supported by grants from the major projects of the Ministry of Science and Technology, Number 2018ZX09721003; Capital Medical University basic clinical research cooperation project, number: 17JL08; Beijing Excellent Talents Training Fund (No. 2018000021469G279).
Author Contributions
All authors made substantial contributions to conception and design, acquisition of data, or analysis and interpretation of data; took part in drafting the article or revising it critically for important intellectual content; agreed to submit to the current journal; gave final approval of the version to be published; and agree to be accountable for all aspects of the work.
Disclosure
The authors report no conflicts of interest in this work.
References
1. Jinjie Y, Sun N, Zhang S, et al. A rapid HPLC-MS/MS method for determining busulfan in hemolysis samples from children with hematopoietic stem cell transplantation. Biomed Chromatogr. 2020;34(9):e4898. doi:10.1002/bmc.4898
2. Ten Brink MH, Zwaveling J, Swen JJ, Bredius RG, Lankester AC, Guchelaar HJ. Personalized busulfan and treosulfan conditioning for pediatric stem cell transplantation: the role of pharmacogenetics and pharmacokinetics. Drug Discov Today. 2014;19(10):1572–1586. doi:10.1016/j.drudis.2014.04.005
3. Bartelink IH, Lalmohamed A, van Reij EM, et al. Association of busulfan exposure with survival and toxicity after haemopoietic cell transplantation in children and young adults: a multicentre, retrospective cohort analysis. Lancet Haematol. 2016;3(11):e526–e536. doi:10.1016/s2352-3026(16)30114-4
4. Dix SP, Wingard JR, Mullins RE, et al. Association of busulfan area under the curve with veno-occlusive disease following BMT. Bone Marrow Transplant. 1996;17(2):225–230.
5. Geddes M, Kangarloo SB, Naveed F, et al. High busulfan exposure is associated with worse outcomes in a daily i.v. busulfan and fludarabine allogeneic transplant regimen. Biol Blood Marrow Transplant. 2008;14(2):220–228. doi:10.1016/j.bbmt.2007.10.028
6. Bartelink IHLA, Elisabeth ML. Association of busulfan exposure with survival and toxicity after haemopoietic cell transplantation in children and young adults: a multicentre, retrospective cohort analysis. Lancet Haematol. 2016;3(11):e526–e536. doi:10.1016/S2352-3026(16)30114-4
7. Malar R, Sjoo F, Rentsch K, Hassan M, Gungor T. Therapeutic drug monitoring is essential for intravenous busulfan therapy in pediatric hematopoietic stem cell recipients. Pediatr Transplant. 2011;15(6):580–588. doi:10.1111/j.1399-3046.2011.01529.x
8. Wall DA, Chan KW, Nieder ML, et al. Safety, efficacy, and pharmacokinetics of intravenous busulfan in children undergoing allogeneic hematopoietic stem cell transplantation. Pediatr Blood Cancer. 2010;54(2):291–298. doi:10.1002/pbc.22227
9. Czerwinski M, Gibbs JP, Slattery JT. Busulfan conjugation by glutathione S-transferases alpha, mu, and pi. Drug Metab Dispos. 1996;24(9):1015–1019.
10. Gibbs JP, Czerwinski M, Slattery JT. Busulfan-glutathione conjugation catalyzed by human liver cytosolic glutathione S-transferases. Cancer Res. 1996;56(16):3678–3681.
11. Huezo-Diaz P, Uppugunduri CR, Tyagi AK, Krajinovic M, Ansari M. Pharmacogenetic aspects of drug metabolizing enzymes in busulfan based conditioning prior to allogenic hematopoietic stem cell transplantation in children. Curr Drug Metab. 2014;15(3):251–264. doi:10.2174/1389200215666140202214012
12. Choi B, Kim MG, Han N, et al. Population pharmacokinetics and pharmacodynamics of busulfan with GSTA1 polymorphisms in patients undergoing allogeneic hematopoietic stem cell transplantation. Pharmacogenomics. 2015;16(14):1585–1594. doi:10.2217/pgs.15.98
13. Ansari M, Curtis PH, Uppugunduri CRS, et al. GSTA1 diplotypes affect busulfan clearance and toxicity in children undergoing allogeneic hematopoietic stem cell transplantation: a multicenter study. Oncotarget. 2017;8(53):90852–90867. doi:10.18632/oncotarget.20310
14. Abbasi N, Vadnais B, Knutson JA, et al. Pharmacogenetics of intravenous and oral busulfan in hematopoietic cell transplant recipients. J Clin Pharmacol. 2011;51(10):1429–1438. doi:10.1177/0091270010382915
15. Michaud V, Tran M, Pronovost B, et al. Impact of GSTA1 polymorphisms on busulfan oral clearance in adult patients undergoing hematopoietic stem cell transplantation. Pharmaceutics. 2019;11(9):440. doi:10.3390/pharmaceutics11090440
16. Yin J, Xiao Y, Zheng H, Zhang YC. Once-daily i.v. BU-based conditioning regimen before allogeneic hematopoietic SCT: a study of influence of GST gene polymorphisms on BU pharmacokinetics and clinical outcomes in Chinese patients. Bone Marrow Transplant. 2015;50(5):696–705. doi:10.1038/bmt.2015.14
17. Gibbs JP, Murray G, Risler L, Chien JY, Dev R, Slattery JT. Age-dependent tetrahydrothiophenium ion formation in young children and adults receiving high-dose busulfan. Cancer Res. 1997;57(24):5509–5516.
18. Nava T, Kassir N, Rezgui MA, et al. Incorporation of GSTA1 genetic variations into a population pharmacokinetic model for IV busulfan in paediatric hematopoietic stem cell transplantation. Br J Clin Pharmacol. 2018;84(7):1494–1504. doi:10.1111/bcp.13566
19. Trame MN, Bergstrand M, Karlsson MO, Boos J, Hempel G. Population pharmacokinetics of busulfan in children: increased evidence for body surface area and allometric body weight dosing of busulfan in children. Clin Cancer Res. 2011;17(21):6867–6877. doi:10.1158/1078-0432.Ccr-11-0074
20. Booth BP, Rahman A, Dagher R, et al. Population pharmacokinetic-based dosing of intravenous busulfan in pediatric patients. J Clin Pharmacol. 2007;47(1):101–111. doi:10.1177/0091270006295789
21. Long-Boyle JR, Savic R, Yan S, et al. Population pharmacokinetics of busulfan in pediatric and young adult patients undergoing hematopoietic cell transplant: a model-based dosing algorithm for personalized therapy and implementation into routine clinical use. Ther Drug Monit. 2015;37(2):236–245. doi:10.1097/ftd.0000000000000131
22. Kusama M, Kubota T, Matsukura Y, et al. Influence of glutathione S-transferase A1 polymorphism on the pharmacokinetics of busulfan. Clin Chim Acta. 2006;368(1–2):93–98. doi:10.1016/j.cca.2005.12.011
23. Rocha V, Porcher R, Fernandes JF, et al. Association of drug metabolism gene polymorphisms with toxicities, graft-versus-host disease and survival after HLA-identical sibling hematopoietic stem cell transplantation for patients with leukemia. Leukemia. 2009;23(3):545–556. doi:10.1038/leu.2008.323
24. Bertholle-Bonnet V, Bleyzac N, Galambrun C, et al. Influence of underlying disease on busulfan disposition in pediatric bone marrow transplant recipients: a nonparametric population pharmacokinetic study. Ther Drug Monit. 2007;29(2):177–184. doi:10.1097/FTD.0b013e318039b478
25. Nguyen L, Fuller D, Lennon S, Leger F, Puozzo C. I.V. busulfan in pediatrics: a novel dosing to improve safety/efficacy for hematopoietic progenitor cell transplantation recipients. Bone Marrow Transplant. 2004;33(10):979–987. doi:10.1038/sj.bmt.1704446
26. Tarlykov P, Raiymbek D, Zholdybayeva E, Ramanculov E. ABO blood group genotyping by real-time PCR in Kazakh population. Cent Asian J Glob Health. 2014;3(Suppl):177. doi:10.5195/cajgh.2014.177
27. Aouri M, Barcelo C, Guidi M, et al. Population pharmacokinetics and pharmacogenetics analysis of rilpivirine in HIV-1-infected individuals. Antimicrob Agents Chemother. 2017;61(1). doi:10.1128/aac.00899-16
28. Ette EI, Ludden TM. Population pharmacokinetic modeling: the importance of informative graphics. Pharm Res. 1995;12(12):1845–1855. doi:10.1023/a:1016215116835
29. Karlsson MO, Savic RM. Diagnosing model diagnostics. Clin Pharmacol Ther. 2007;82(1):17–20. doi:10.1038/sj.clpt.6100241
30. Hooker AC, Staatz CE, Karlsson MO. Conditional weighted residuals (CWRES): a model diagnostic for the FOCE method. Pharm Res. 2007;24(12):2187–2197. doi:10.1007/s11095-007-9361-x
31. Ette EI. Stability and performance of a population pharmacokinetic model. J Clin Pharmacol. 1997;37(6):486–495. doi:10.1002/j.1552-4604.1997.tb04326.x
32. van der Galiën R, Boveneind-Vrubleuskaya NV, Peloquin C, Skrahina A, Touw DJ, Alffenaar JC. Pharmacokinetic modeling, simulation, and development of a limited sampling strategy of cycloserine in patients with multidrug-/extensively drug-resistant tuberculosis. Clin Pharmacokinet. 2020;59(7):899–910. doi:10.1007/s40262-020-00860-8
33. Paci A, Vassal G, Moshous D, et al. Pharmacokinetic behavior and appraisal of intravenous busulfan dosing in infants and older children: the results of a population pharmacokinetic study from a large pediatric cohort undergoing hematopoietic stem-cell transplantation. Ther Drug Monit. 2012;34(2):198–208. doi:10.1097/FTD.0b013e31824c2f60
34. Bartelink IH, Boelens JJ, Bredius RG, et al. Body weight-dependent pharmacokinetics of busulfan in paediatric haematopoietic stem cell transplantation patients: towards individualized dosing. Clin Pharmacokinet. 2012;51(5):331–345. doi:10.2165/11598180-000000000-00000
35. Nankivell BJ, Gruenewald SM, Allen RD, Chapman JR. Predicting glomerular filtration rate after kidney transplantation. Transplantation. 1995;59(12):1683–1689. doi:10.1097/00007890-199506270-00007
36. Jones RJ, Lee KS, Beschorner WE, et al. Venoocclusive disease of the liver following bone marrow transplantation. Transplantation. 1987;44(6):778–783. doi:10.1097/00007890-198712000-00011
37. Harris AC, Young R, Devine S, et al. International, multicenter standardization of acute graft-versus-host disease clinical data collection: a report from the mount sinai acute GVHD international consortium. Biol Blood Marrow Transplant. 2016;22(1):4–10. doi:10.1016/j.bbmt.2015.09.001
38. Ten Brink MH, Wessels JA, den Hartigh J. Effect of genetic polymorphisms in genes encoding GST isoenzymes on BU pharmacokinetics in adult patients undergoing hematopoietic SCT. Bone Marrow Transplant. 2012;47(2):190–195. doi:10.1038/bmt.2011.55
39. Kim MG, Kwak A, Choi B, Ji E, Oh JM, Kim K. Effect of glutathione S-transferase genetic polymorphisms on busulfan pharmacokinetics and veno-occlusive disease in hematopoietic stem cell transplantation: a meta-analysis. Basic Clin Pharmacol Toxicol. 2019;124(6):691–703. doi:10.1111/bcpt.13185
40. Nishikawa T, Yamaguchi H, Ikawa K, et al. Influence of GST polymorphisms on busulfan pharmacokinetics in Japanese children. Pediatr Int. 2019;61(6):558–565. doi:10.1111/ped.13859
41. Yee SW, Mefford JA, Singh N, et al. Impact of polymorphisms in drug pathway genes on disease-free survival in adults with acute myeloid leukemia. J Hum Genet. 2013;58(6):353–361. doi:10.1038/jhg.2013.38
42. McCune JS, Bemer MJ, Barrett JS, Scott Baker K, Gamis AS, Holford NH. Busulfan in infant to adult hematopoietic cell transplant recipients: a population pharmacokinetic model for initial and Bayesian dose personalization. Clin Cancer Res. 2014;20(3):754–763. doi:10.1158/1078-0432.CCR-13-1960
43. McCune JS, Baker KS, Blough DK, et al. Variation in prescribing patterns and therapeutic drug monitoring of intravenous busulfan in pediatric hematopoietic cell transplant recipients. J Clin Pharmacol. 2013;53(3):264–275. doi:10.1177/0091270012447196
44. Yeh RF, Pawlikowski MA, Blough DK, et al. Accurate targeting of daily intravenous busulfan with 8-hour blood sampling in hospitalized adult hematopoietic cell transplant recipients. Biol Blood Marrow Transplant. 2012;18(2):265–272. doi:10.1016/j.bbmt.2011.06.013
45. de Lima M, Couriel D, Thall PF, et al. Once-daily intravenous busulfan and fludarabine: clinical and pharmacokinetic results of a myeloablative, reduced-toxicity conditioning regimen for allogeneic stem cell transplantation in AML and MDS. Blood. 2004;104(3):857–864. doi:10.1182/blood-2004-02-0414
46. Russell JA, Tran HT, Quinlan D, et al. Once-daily intravenous busulfan given with fludarabine as conditioning for allogeneic stem cell transplantation: study of pharmacokinetics and early clinical outcomes. Biol Blood Marrow Transplant. 2002;8(9):468–476. doi:10.1053/bbmt.2002.v8.pm12374451
47. Gürlek Gökçebay D, Azik F, Ozbek N, et al. Clinical comparison of weight- and age-based strategy of dose administration in children receiving intravenous busulfan for hematopoietic stem cell transplantation. Pediatr Transplant. 2015;19(3):307–315. doi:10.1111/petr.12430
48. Vaughan WP, Carey D, Perry S, Westfall AO, Salzman DE. A limited sampling strategy for pharmacokinetic directed therapy with intravenous busulfan. Biol Blood Marrow Transplant. 2002;8(11):619–624. doi:10.1053/bbmt.2002.v8.abbmt080619
49. Teitelbaum Z, Nassar L, Scherb I, et al. Limited sampling strategies supporting individualized dose adjustment of intravenous busulfan in children and young adults. Ther Drug Monit. 2020;42(3):427–434. doi:10.1097/ftd.0000000000000700
 © 2021 The Author(s). This work is published and licensed by Dove Medical Press Limited. The full terms of this license are available at https://www.dovepress.com/terms.php and incorporate the Creative Commons Attribution - Non Commercial (unported, v3.0) License.
By accessing the work you hereby accept the Terms. Non-commercial uses of the work are permitted without any further permission from Dove Medical Press Limited, provided the work is properly attributed. For permission for commercial use of this work, please see paragraphs 4.2 and 5 of our Terms.
© 2021 The Author(s). This work is published and licensed by Dove Medical Press Limited. The full terms of this license are available at https://www.dovepress.com/terms.php and incorporate the Creative Commons Attribution - Non Commercial (unported, v3.0) License.
By accessing the work you hereby accept the Terms. Non-commercial uses of the work are permitted without any further permission from Dove Medical Press Limited, provided the work is properly attributed. For permission for commercial use of this work, please see paragraphs 4.2 and 5 of our Terms.