")
Back to Archived Journals » Open Access Medical Statistics » Volume 7
Optimal look back period and summary method for Elixhauser comorbidity measures in a US population-based electronic health record database
Authors Fortin Y , Crispo JAG, Cohen D, McNair DS, Mattison DR, Krewski D
Received 23 August 2016
Accepted for publication 23 November 2016
Published 31 January 2017 Volume 2017:7 Pages 1—13
DOI https://doi.org/10.2147/OAMS.S120426
Checked for plagiarism Yes
Review by Single anonymous peer review
Peer reviewer comments 2
Editor who approved publication: Dr Dongfeng Wu
Yannick Fortin,1,2 James AG Crispo,1–4 Deborah Cohen,2,5,6 Douglas S McNair,7 Donald R Mattison,1,8 Daniel Krewski1,2,8
1McLaughlin Centre for Population Health Risk Assessment, 2School of Epidemiology, Public Health and Preventive Medicine, University of Ottawa, Ottawa, ON, Canada; 3Fulbright Canada, 4Department of Neurology, Perelman School of Medicine, University of Pennsylvania, Philadelphia, PA, USA; 5Canadian Population Health Initiative, Canadian Institute for Health Information, Ottawa, 6Institute for Health Policy, Management and Evaluation, University of Toronto, Toronto, ON, Canada; 7Cerner Corporation, Kansas City, MO, USA; 8Risk Sciences International, Ottawa, ON, Canada
Background: Comorbidity risk-adjustment tools are widely used in health database research to control for clinical differences between individuals, but they need to be validated a priori. This study aimed to identify the optimal parameters for predicting all-cause inhospital mortality using Quan’s enhanced Elixhauser comorbidity measures (ECMs) in the US-based Cerner Health Facts® (HF) electronic health record database.
Methods: Health care recipients aged 18–89 years between 2002 and 2011 were included. Prevalent comorbidities recorded, 1) during the index encounter; 2) in the prior year; and 3) in the prior 2 years were identified using the ECMs. Multiple logistic regression models, with inhospital mortality at index and at 1 year as the predicted outcomes, were fitted with comorbidities summarized as binary indicators, total counts, or weighted scores for the three look back periods. Baseline variables included sex and age. The receiver operating characteristic (ROC) curves of the competing models were compared with a non-parametric Mann–Whitney U test to identify the optimal parameters.
Results: A sample of 3,273,298 unique health care recipients were included, of whom 31,298 (1.0%) and 50,215 (1.5%) died during the index encounter and within the 1-year follow-up, respectively. Models of comorbidity based on binary and weighted indicators had near-identical performance and were statistically better than the models based on total counts (p < 0.0001). Discrimination of inhospital mortality was highest with a look back period limited to the index encounter, while inhospital mortality at 1 year was best predicted with 1 year of look back (p < 0.0001).
Conclusion: In Cerner HF, the binary and weighted methods for summarizing the Quan ECM were the best predictors of all-cause inhospital mortality at index and at 1 year. Observed differences in predictive performance between models with diagnostic ascertainment periods of up to 2 years of look back were statistically significant but not practically important.
Keywords: comorbidity, ICD-9, electronic health records, risk adjustment, mortality, statistical modeling
Introduction
Risk-adjustment measures of patient comorbidity are commonly used in health database research and are associated with short- and long-term mortality, hospital costs, inpatient length of stay (LOS), physician visits, and hospital readmissions.1–9
The strong discriminatory performance of two Elixhauser comorbidity measure (ECM) variants, by Quan et al10 and the Agency for Healthcare Research and Quality (AHRQ),11 for predicting inhospital mortality was recently confirmed in the Cerner Health Facts® (HF) database.12 HF is a longitudinal electronic health record (EHR) data source populated by health care centers located across the continental US in compliance with the US Health Insurance Portability and Accountability Act (HIPAA). HIPAA-compliant data repositories must adhere to strict patient de-identification procedures to ensure the privacy and protection of personal information.13 These operational constraints preclude any possibility of subsequent data linkage to national registries such as the National Death Index or to other health provider data sources that are not covered under a common HIPAA network. EHR databases such as HF are therefore limited in their ability to fully capture the utilization of health services of their constitutive patients, possibly leading to missing information about health outcomes and health service use happening outside their privacy network. How this potential missing information affects the performance of comorbidity risk assessment tools in HF and similar health data sources deserves investigation, if only for the interpretation of studies derived from them.
Selecting an appropriate ascertainment look back period (henceforth, look back) is a standard decision researchers have to make prior to relying on comorbidity risk-adjustment tools. A look back period is the length of a patient’s medical history available for the assessment of prevalent comorbidities. When look back is expanded to include health encounters preceding an index encounter, additional diagnoses, possibly unreported during the index, are more likely to be detected. One reason cited for expanding the look back period beyond a single health encounter is to limit discharge coding bias, whereby existing and less serious chronic health conditions are less likely to be recorded within EHRs during acute health encounters and vice versa.1,14 In a recent systematic review, Yurkovich et al15 concluded that combining health data from outpatient and inpatient encounters yields comorbidity indices with better predictive performance for mortality outcomes than inpatient data alone. Evidence also suggests that longer look back is associated with comorbidity indices with better predictive performance for a wide array of health outcomes.4,16 However, performance increases beyond 1 year of look back may be insignificant.17 In HF and similar sources of health data in which patient follow-up cannot be confirmed with complete accuracy, the selection of an optimal look back period should be confirmed through empirical investigation.
The comorbidity status of patients, inferred from the health conditions recorded in EHRs, can be summarized in several ways. Unlike the Charlson8 comorbidity index and its variants,18–21 which summarize overall comorbidity in a single score on a continuous scale, ECMs consist of 30 binary indicators.1,10 This makes ECMs impractical when conducting association studies or when matching cases to controls based on health status. Fortunately, several approaches are available for improving the manageability of ECMs. The simplest method is to count the total number of prevalent comorbidities identified during the look back period (henceforth, the total method). Comorbidities can also be assigned relative weights based on the strength of their association with an outcome of interest, e.g., inhospital mortality. Once these relative weights are derived, they can be added to produce a single comorbidity score for each patient. The ECM point system developed and validated by van Walraven et al22 (henceforth, the weighted method) is based on this approach but has yet to be validated in a US health data source. The principal and arguably questionable assumption of the total method is that every ECM health condition has the same strength of association with the outcome of interest. The weighted method addresses this limitation by producing a weighted comorbidity score that accounts for the relative ability of each ECM condition to predict an outcome.
Alternative methods for summarizing overall comorbidity in patients result in comorbidity risk-adjustment tools with divergent predictive performances.16 In a recent meta-analysis, Sharabiani et al16 tested the discrimination performance of comorbidity measures for predicting short- and long-term outcomes with different comorbidity summary methods. When predicting inpatient and short-term mortality (<30 days), model performance ranked in increasing order from the binary method to the total method and then to the weighted method. For predicting long-term outpatient mortality (>30 days), the performance of comorbidity summary methods ranked differently. They improved from the total method to the weighted method and then to the binary method. The predictive performance of competing ECM summary methods has not been compared in the HF database, and it is unclear if one approach outperforms the others in this type of data source.
The primary objective of this study was to identify the optimal look back period (index encounter alone versus 1 year versus 2 years) for the Quan ECM when predicting all-cause inhospital mortality and inhospital mortality at 1 year in HF. The secondary objective was to ascertain which comorbidity summary method, the binary, total, or weighted, best predicts the mortality outcomes.
Methods
Source of health data
The study is based on EHRs from the Cerner HF (Kansas City, MO, USA) data repository and relies on inpatient, outpatient, and emergency care encounters recorded between January 2000 and December 2012. Cerner is a global provider of health informatics solutions, and HF is managed in accordance with the HIPAA. To date, >500 health care facilities have contributed patient-level data to HF, including details on hospital admissions, diagnoses, medication orders, laboratory tests, medical procedures, and surgical interventions.23 Data-contributing health care facilities are located in all US census regions and are categorized by teaching status, urban/rural setting, and bed size. Participating data sources are primarily located in the Northeast census region (36%) and ~60% of HF health encounters are recorded by university-affiliated teaching hospitals. Permission to access and analyze HF data was granted by Cerner Corporation, Kansas City, MO, USA.
HIPAA compliance by the Cerner Corporation ensures complete de-identification and anonymization of HF patients. Ethical approval for this study was granted by the University of Ottawa’s Office for Research Ethics and Integrity who deemed patient consent unnecessary due to the de-identification process.
Study population
Individuals aged 18–89 years with one or more inpatient or emergency department (ED) visits between January 2002 and December 2011 were admissible for inclusion in the study. For each admissible patient, a single health care encounter was selected at random and assigned as the index encounter. Random selection of the index encounter was completed to limit systematic information bias while allowing for the possibility of look back and follow-up time. The study inclusion dates were selected to ensure index encounters had 2 years of available look back time and 1 year of follow-up. Individuals younger than 18 years were excluded due to the low prevalence of ECM conditions and mortality in this age group. Individuals aged 90 years or older were excluded because age is treated as a continuous variable in this study and age values are pooled in a single category beyond 89 years in HF due to HIPAA requirements. To avoid bias resulting from missing information, we excluded index encounters in which individuals were admitted from or transferred to an outside health care facility.22 Individual characteristics included sex (male and female), race limited to the four highest frequency categories (Caucasian, African American, Hispanic, and Asian), and age captured during the index encounter. Primary health insurance status at the index encounter was classified based on recommendations from the AHRQ24 as private, Medicaid, Medicare, uninsured/self-pay, other Tricare (formerly known as the Civilian Health and Medical Program of the Uniformed Services [CHAMPUS]), (international plan, research funded, Title V, worker’s compensation), or missing. An important proportion of health insurance status values were expected to be missing since data contributors often elect to retain this type of information from being transferred to external data repositories such as HF.
ECMs
Quan et al’s10 enhanced International Classification of Diseases, Ninth Edition (ICD-9), ECM was selected to identify the prevalence of 30 health conditions. This choice was based on prior evidence of superior performance by this ECM for predicting inhospital mortality in HF compared to version 3.7 of the AHRQ ECM.25 The Quan ECM relies on specific combinations of ICD-9 diagnostic codes to identify cases of congestive heart failure, cardiac arrhythmia, valvular disease, pulmonary circulation disorders, peripheral vascular disorders, hypertension (un/complicated), paralysis, neurological disorders, chronic pulmonary disease, uncomplicated diabetes, complicated diabetes, hypothyroidism, renal failure, liver disease, peptic ulcer disease without bleeding, AIDS/HIV, lymphoma, metastatic cancer, solid tumor without metastasis, rheumatoid arthritis/collagen vascular diseases, coagulopathy, obesity, weight loss, fluid and electrolyte disorders, blood loss anemia, deficiency anemia, alcohol abuse, drug abuse, psychoses, and depression, from electronic health data.26,27
Look back periods
To test the consequences of varying the diagnostic ascertainment look back period on the predictive performance of the ECM, prevalent health conditions were identified during the index encounter alone (index only), during the index encounter and any encounter recorded in the preceding year (1-year look back), and during the index encounter and any encounter recorded during the previous 2 years (2-year look back). Prior studies have reported that when the objective is to predict mortality, disease prevalence captured from multiple health care settings generally performs better (higher c-statistic values) than disease prevalence assessments limited to a single health care setting.4,15,28,29 For this reason, diagnostic ascertainment in this study included information recorded in inpatient, outpatient, and emergency care settings.
ECM summary methods
The overall comorbidity status of patients was summarized using three approaches. The binary method reflected the original Elixhauser format, and the 30 health conditions assessed were coded as binary indicators (present or absent). In the total method, each health condition identified was assigned a value of 1 and a total count was derived to produce a continuous variable ranging from 0 to 30. For the weighted method, the van Walraven (VW)22 point system was implemented and relative weights were calculated based on HF data. The VW point system is principally founded on the methodology from the Framingham Heart Study for compiling risk score for developing coronary heart disease over time.30 To begin, a random number generator based on the Bernoulli distribution was used to divide the HF encounters into two subsamples. The first dataset (derivation) was reserved to generate the VW weights and the second dataset (validation) was retained to conduct the comparative statistical analyses. In the VW approach, backward stepwise logistic regression was used to predict the outcome of interest (e.g., inhospital mortality) using the ECM binary indicators as parameters. Conditions significantly associated (p < 0.05) with the dependent in the best-fitted model were retained and parameter estimates were divided by the absolute value of the parameter with the lowest admissible estimate. ECM conditions not significantly associated with the dependent were assigned a weight of zero. A weighted summary score was then compiled for each patient by adding the relative weight of each positively identified health condition during the diagnostic ascertainment step. Since this study has three look back periods and two outcomes, six sets of VW weights were generated.
Statistical analysis
The study outcomes were all-cause inhospital mortality during the index encounter and at 1 year. Inhospital mortality at 1 year was defined as a death recorded during an HF encounter (inpatient stay or emergency visit) in the 365 days that followed the admission date of the index encounter. Deaths occurring during the index encounter are therefore included in the inhospital mortality at 1-year outcome. Because deaths occurring in outpatient settings are rare relative to those occurring in acute care settings,31,32 they were excluded from the study.
Patient demographic and index encounter characteristics for the derivation, validation, and complete datasets are reported as counts and percentages for categorical variables and as mean and standard error (SE) values for continuous variables. Observed differences between the derivation and validation datasets were compared with Pearson’s chi-squared test for the categorical variables and with Student’s t-test for the continuous variables. Multiple logistic regression was used to fit the six combinations of look back and comorbidity summary method and to predict the mortality outcomes. Since the weights required by the VW point system were produced from the derivation dataset, the comparative analyses were conducted with the validation dataset as opposed to the complete sample. The baseline model was limited to sex and age at index to allow for comparisons with prior studies.4,25,33
Statistical analyses were completed with SAS version 9.4 (SAS Institute Inc., Cary, NC, USA), which allowed for concordance index (c-statistic) values to be outputted from the logistic regression function using the receiver operating characteristic (ROC) option.34 Interpretation of the c-statistics follows recommendations by Hosmer Jr, Lemeshow, and Sturdivant,35 whereby values >0.7 are considered reasonable, those >0.8 are strong, and those >0.9 are exceptional. Differences in the capacity of each model to discriminate between the mortality outcomes were compared using the ROCCONTRAST option, which relies on a variation of the non-parametric Mann–Whitney U test developed by DeLong et al.36
Results
A dataset based on the inclusion of 3,273,298 unique health care recipients was randomly parsed to create a derivation and a validation dataset containing 1,637,572 and 1,635,726 patients, respectively (Table 1). In the complete dataset, the majority were females (53.8%) and Caucasians (72.3%). The mean age was 41.1 years (SE = 0.01), and 31,298 (1.0%) deaths of any cause were recorded during the index. At 1 year, 50,215 (1.5%) deaths were recorded. A larger percentage of index encounters originated from health care facilities located in the Northeast (36.1%) census region compared to the Midwest (19.8%), South (32.9%), and West (11.2%). Forty-one percent of health insurance statuses were missing (41.0%), and the privately insured (24.3%) made up the majority of non-missing values. The observed differences between the derivation and validation samples were not significant.
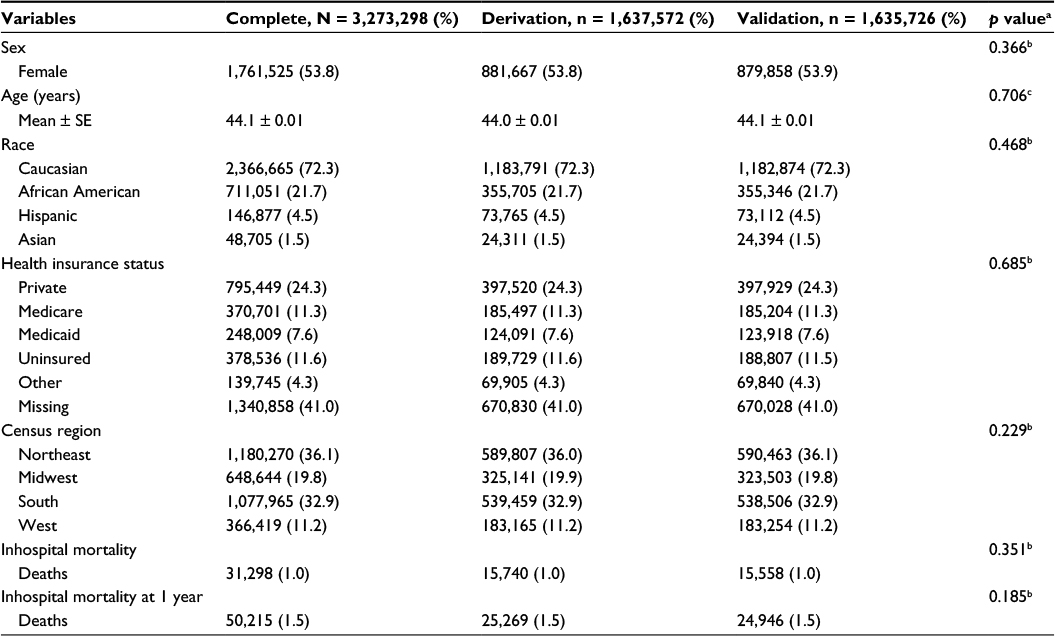 | Table 1 Patient demographic and encounter characteristics, for the complete, derivation, and validation datasets Notes: ap value resulting from the significance tests used to evaluate the difference between the derivation and validation subsamples. bStatistical significance derived using Pearson’s chi-squared test. cStatistical significance derived using Student’s t-test. Abbreviation: SE, standard error. |
The prevalence of the health conditions ascertained ranked consistently across all look back periods and was led by hypertension (17.5–19.5%), chronic pulmonary disease (7.8–9.2%), diabetes without complications (6.9–7.8%), fluid and electrolyte disorders (5.7–7.0%), and cardiac arrhythmia (5.3–6.2%; Table 2). The greatest increase in prevalence between the index encounter and 2 years of look back were for hypertension (2.0%), chronic pulmonary disease (1.3%), and fluid and electrolyte disorders (1.3%). The adjusted odds and relative weight of each health condition derived during the implementation of the VW point system are reported in Table 3 for inhospital mortality and in Table 4 for inhospital mortality at 1 year. In the models retained for predicting inhospital mortality, uncomplicated diabetes and blood loss anemia were excluded for all look back periods, while the rheumatoid arthritis/collagen disease group was excluded from the models based on 1 and 2 years of look back. The parameters retained in the models predicting inhospital mortality at 1 year differed. Valvular disease was excluded across all look back periods, while diabetes with complications and alcohol abuse were excluded from the 1- and 2-year look back models. Relative points (weights) attributed to health conditions ranged from -6 to 11 across the three look back periods when predicting inhospital mortality, and neurological disorders, metastatic cancer, and fluid and electrolyte disorders had the largest weights. For inhospital mortality at 1 year, health conditions exhibited a broader range of points, from -11 to 27, across the look back periods, with liver disease, lymphoma, and metastatic cancer having the largest weights.
 | Table 2 Prevalence of comorbid conditions by look back period, N = 3,273,298 |
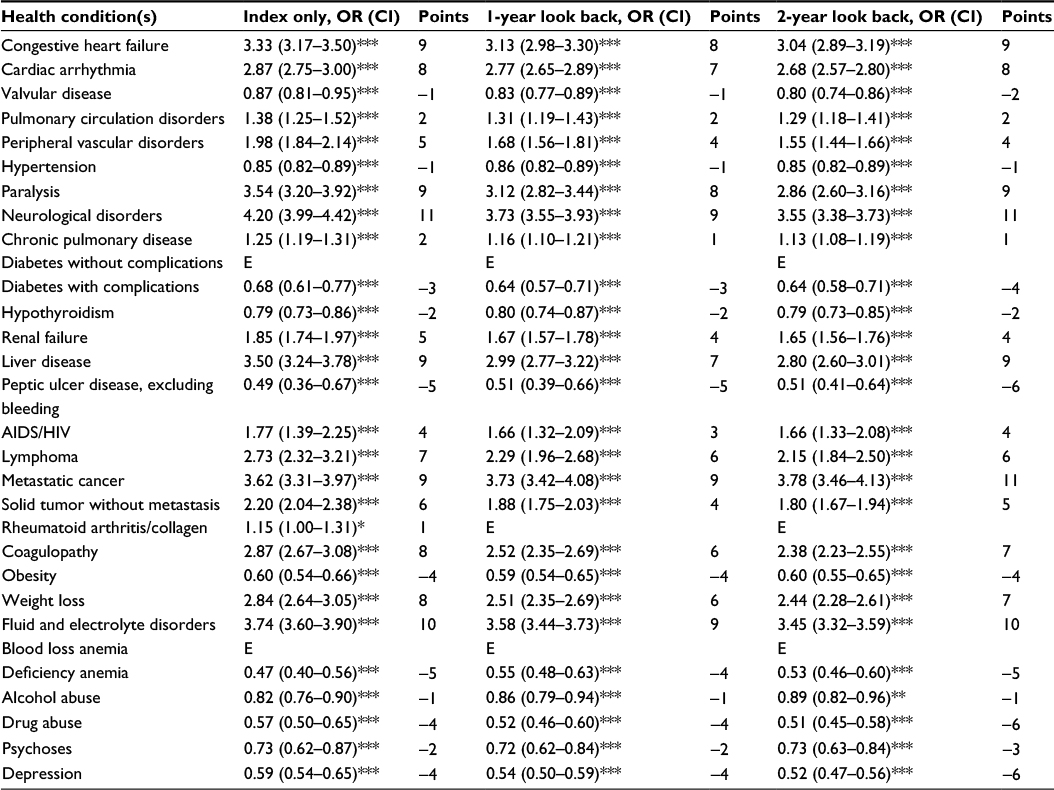 | Table 3 Adjusted odds of inhospital mortality and relative points by health condition(s) and look back period, n = 1,637,572 Note: *p < 0.05, **p < 0.01, ***p < 0.001. Abbreviations: OR, odds ratio; CI, 95% confidence interval; E, eliminated from the model. |
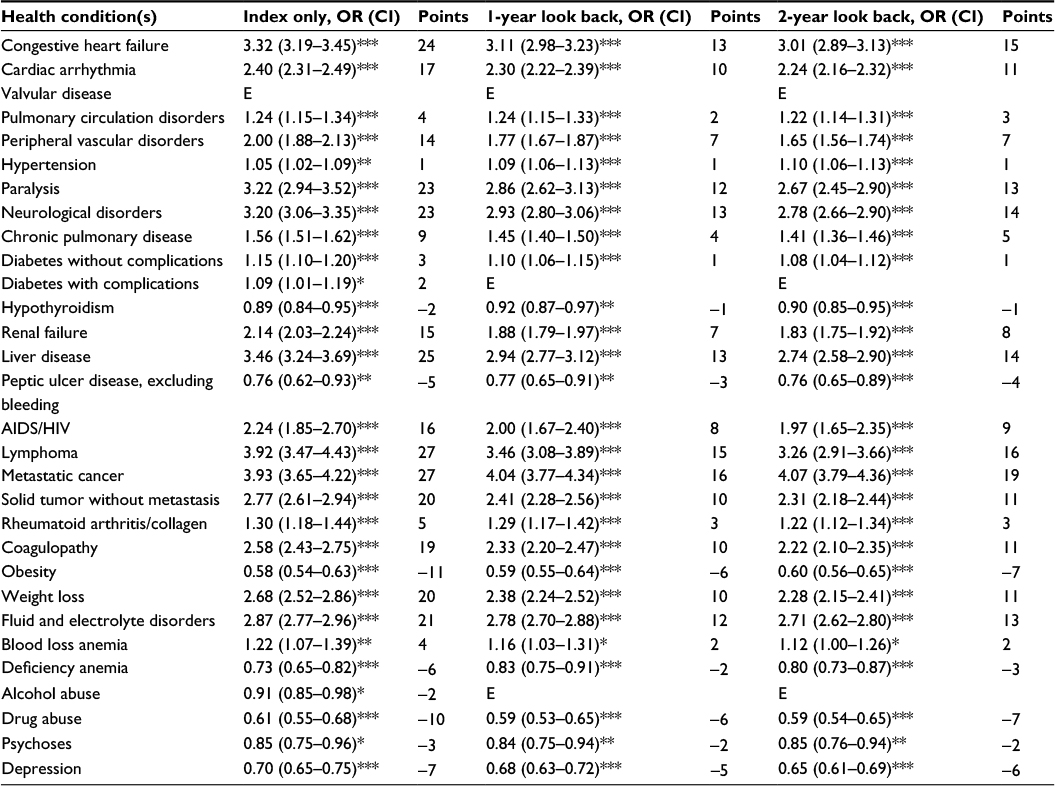 | Table 4 Adjusted odds of inhospital mortality at 1 year and relative points by health condition(s) and look back period, n = 1,637,572 Note: *p < 0.05, **p < 0.01, and ***p < 0.001. Abbreviations: OR, odds ratio; CI, 95% confidence interval; E, eliminated from the model. |
Model performance comparisons based on the validation dataset showed that irrespective of the look back period and the outcome predicted, the combination of the baseline variables with any of the summary methods improved on the predictive performance of the baseline model alone (p < 0.0001) (Table 5). For inhospital mortality, the average performance improvement on the baseline model across the look back periods was 6.6%, 3.4%, and 6.4% for the binary, total, and weighted summary methods, respectively. For inhospital mortality at 1 year, the equivalent improvements in c-statistics were 5.9%, 3.7%, and 5.7%.
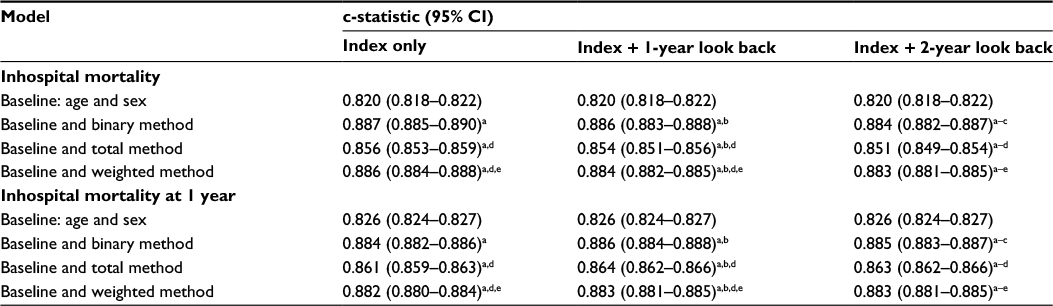 | Table 5 Predictive performance by mortality outcome, look back period, and comorbidity summary method, n = 1,635,726 Notes: c-statistic differences were evaluated using the non-parametric Mann–Whitney U statistical method for comparing ROC curves developed and described by DeLong et al.36 aReference = baseline: age and sex, statistically significant, p < 0.0001. bReference = index only, statistically significant, p < 0.0001. cReference = index + 1-year look back, statistically significant, p < 0.0001. dReference = baseline and binary method, statistically significant, p < 0.0001. eReference = baseline and total method, statistically significant, p < 0.0001. Abbreviations: CI, 95% confidence interval; ROC, receiver operating characteristic. |
For both mortality outcomes, the predictive performance of models improved consistently and significantly in the following order of summary method for every look back period: total < weighted < binary. Irrespective of the look back period and outcome, the predictive performances of the binary and weighted summary methods were nearly identical (0.882 ≤ c-statistics ≤ 0.887), varying by less than a percent in direct comparisons. The most noticeable performance improvement across the look back periods was the outperformance of the total method by the binary and weighted methods, which averaged approximately 3% for inhospital mortality at index and ≈2% for inhospital mortality at 1 year. The c-statistic confidence intervals of every direct comparison between the binary and the weighted methods overlapped, yet differences in model performance between the methods were statistically significant (p < 0.0001).
When predicting inhospital mortality, the best performing look back period across all summary methods was the diagnostic assessment limited to the index encounter alone. For predictions of inhospital mortality at 1 year, the best look back period was the index encounter supplemented with 1 year of look back. While the differences in predictive performance across look back periods for each summary method were statistically different, performance improvements were negligible and rarely exceeded more than two-tenths of a percent. ROC curves are available as supplementary materials (Figures S1 and S2).
Discussion
The goal of this study was to advance methodologies for conducting observational studies founded on privacy-protected data warehouses. More specifically, we aimed to identify the optimal look back period and comorbidity summary method for the Quan ECM when predicting inhospital mortality at index and inhospital mortality at 1 year in Cerner HF. We found that the optimal comorbidity risk-adjustment parameters differed minimally across the mortality outcome. The Quan ECM model based on the binary method with diagnostic ascertainment limited to the index encounter performed the best for predicting inhospital mortality. When predicting inhospital mortality at 1 year, the binary method with 1 year of look back had the highest c-statistic. A recent study by Thompson et al37 conducted using the AHRQ National Inpatient Sample and the Maryland State Inpatient Database showed that the binary method (c = 0.809, 95% CI: 0.808–0.810) for the original Elixhauser comorbidities performed slightly better than the VW method (c = 0.802, 95% CI: 0.801–0.804), albeit the cardiac arrhythmia group was excluded from both models. During the validation of the original VW point system, van Walraven et al22 observed a similar but inverse performance between the binary (c = 0.760, 95% CI: 0.756–0.764) and weighted (c = 0.763, 95% CI: 0.759–0.766) methods when predicting inhospital mortality for a Canadian population. Our findings pertaining to the best method for summarizing Elixhauser conditions fit somewhere between the above studies. While the binary method was statistically superior, when holding the look back period constant, we found that improvements in predictive performance between the binary and weighted methods were not likely clinically important. As for the total method, it performed significantly worse on average than the other methods. Relatively lower performance by the total method was recently demonstrated37 and was expected because it is unrealistic to assume that every ECM condition has an equivalent relationship to the outcome of interest.
This study asked if the length of the ascertainment look back period affected the capacity of models to discriminate between mortality statuses. Previous studies had shown that longer look back periods are better predictors of long-term mortality and that look back periods limited to the index encounter are better predictor of inhospital mortality at index.4,16,17 In this study, every direct comparison between look back periods proved highly statistically different (p < 0.0001), yet varying the look back period appeared practically irrelevant. For inhospital mortality, we observed statistically significant decreases in predictive performance with increasing look back. For predicting inhospital mortality at 1 year, the 1-year look back option was statistically the best option. Complementary results from sensitivity analyses based on 3-, 4-, and 5-year look back periods (not reported) failed to demonstrate any improvement in predictive performance and did not challenge the main study findings. Within comorbidity summary methods, the statistically significant difference in predictive performance between the look back periods are not likely to have any clinical relevance since they rarely exceeded half a percent. In this study, mortality outcomes were selected because they are the most commonly used end points in validation studies of comorbidity measures and allow for cross-study comparisons.15 However, alternative outcomes, such as hospital readmissions, have been shown to be better predicted by longer look back periods and would require additional validation.17
While implementing the VW point system, we observed an inverse relationship between several comorbidity groups and the mortality outcomes. This led to ECM conditions having negative weights. Notably, more than one-third of the Quan ECM, including valvular disease, hypertension, diabetes with complications, hypothyroidism, peptic ulcer disease without bleeding, obesity, depression, psychoses, drug abuse, alcohol abuse, and deficiency anemia, had negative weights when predicting inhospital mortality at the index with 1 year of look back. According to Elixhauser et al,1 conditions negatively associated with mortality possibly reflect the fact that during acute encounters, conditions possibly considered irrelevant to the provision of care are less frequently recorded. In other words, conditions negatively associated with mortality may not be protective as much as they are the result of a combination of clinical relevance and inconsistent data collection. It could also be hypothesized that comorbidities such as drug and alcohol abuse, psychoses, and depression are less likely recorded in medical records because they are stigmatized conditions with a lower likelihood of voluntary disclosure by health care recipients.
The strengths of this study include its broad geographic coverage, numerous contributing health care facilities, and the large and diverse population of US health care recipients in the data source. This afforded the selection of a study sample with complete demographic profiles and available diagnostic information without compromising study power. While studies with enormous sample sizes are prone to being overpowered, the resulting resource utilization consequences are somewhat inconsequential and ethical concerns are irrelevant in administrative database research. The ability to ascertain diagnoses across multiple care settings in HF, i.e., outpatient clinics, ED visits, hospital care, is likely to have improved the accuracy and completeness of individual comorbidity profiles. The study design was based on random encounters over episodes of care. Episodes of care were initially defined by Solon et al38 as the grouping of health services data from one or more health encounters related to the management of a principal health condition or problem. In the context of validating measures of comorbidity without selecting a primary health condition of interest, as was the case for this study and those to which it should be compared,22,39 the episode of care approach not only increases complexity but also raises methodological concerns. For instance, in highly comorbid individuals, the aggregation of a larger number of health encounters into a single episode of care is likely to lead to increased opportunities for identifying prevalent health conditions, when compared to people with lower overall morbidity and narrower episodes of care. This situation could result in greater exposure misclassification based on the characteristics of the episode of care itself. The reader is referred to the seminal paper by Wingert et al40 for further discussion of the theoretical motives supporting the episodes of care methodology.
This study is also the first to validate the performance of the VW approach using the Quan ECM in a US data source. Our findings highlight the relevance of internal validation prior to selecting comorbidity risk-adjustment parameters. In HF, the choice of look back period is not as critical as the choice of comorbidity summary method compared to other data sources. While the total summary method should be avoided, the consequences of limiting ECM diagnostic ascertainment to the index encounter, the least complex and resource-intensive approach available, is not likely to practically affect the performance of the Quan ECM in HF. We also confirmed the practical equivalence of the weighted and binary methods for predicting inhospital mortality outcomes. This highlights a real advantage for future epidemiological studies since weighted scores are much easier to manipulate, interpret, and could help avoid problems related to overfitting that arise during regression analyses when too many variables are included in a model.22
Limitations of this study included our inability to separate conditions present on admission from complications in care typically identified using diagnostic-type indicators. In HF, the diagnostic-type indicator was not consistently available, which prevented further investigation of this parameter. Thus, we could not test the hypothesis by Quan et al10 that including conditions emerging from complications in care is likely to benefit predictions for long-term mortality but not necessarily inhospital mortality. In HF, care recipients are tracked as they seek care from Cerner participating institutions. However, not all US health care institutions are Cerner clients and data contributors. Even in cases where patients received care from two Cerner health facilities, it would only be possible to track patients across time if these facilities were covered under the same privacy (HIPAA) network. Likewise, care recipients in HF may have the option of seeking health services from non-Cerner-affiliated health facilities. In such instances, the clinical encounter data would not be captured in HF and details about health services participation, including diagnoses and health outcomes, would be lost. These limitations are characteristic of observational research conducted with HIPAA-compliant administrative databases and necessitate consideration in experimental design. Notably, evidence of mortality had to be limited to deaths captured in Cerner hospitals since mortality status could not be verified against other sources of vital statistics through data linkage. Therefore, deaths were certainly underrepresented, and this likely introduced some biases. Another possible source of confounding relates to how health care organizations elect to record the discharge outcome of people transferred to hospice care.41 Findings from Kozar et al41 based on data from US Trauma Quality Improvement Program centers suggest that transfers to hospice care assign a survivor status to patients and that in some cases, the more appropriate discharge status might be diseased. The authors also found that patients with two or more comorbidities were more likely to be coded as hospice care transfers than inhospital deaths.
Results of this study must be contrasted against the possibility of lead time and retention biases, which could vary by condition, by condition latency or intermittency, by condition severity, by services rendered, by age, by health insurance status, and other factors.42,43 People with certain conditions or comorbidities could theoretically expedite or delay seeking care and experience different lead times till their first encounter with an HIPAA-covered entity source institution in HF. Such factors could crucially affect whether one will or will not have, 1) antecedent encounters in the data warehouse, at 1 year or other look back intervals, and 2) subsequent encounters, at 1 year or other follow-up times, wherein mortality or comorbidities can be ascertained.
Often, comparative studies of comorbidity indices or measures are performed in a population defined by a specific primary diagnosis, e.g., cancer,44–46 from which comorbid conditions are defined. This study is aligned with the seminal Quan et al10 study and was conducted with an undifferentiated patient general population. For this reason and until evidence to the contrary is available, it is advised that VW-based weights be rederived for each study population based on a different primary diagnosis. We completed secondary database research in a data source primarily designed for documenting clinical practice, health services, and billing.23 Hence, our results are subject to the typical biases and limitations accompanying administrative database research,47,48 which include risks of missing clinical and demographic information, the misclassification of diagnoses during data abstraction, linkage errors related to interoperability issues, and record duplication.
Finally, we confirmed the excellent predictive performance of the Quan ECM for predicting inhospital mortality and inhospital mortality at 1 year in Cerner HF, a large longitudinal US multi-payer health database that complies with US HIPAA regulations and limitations. The performance of the Quan ECM expressed as binary indicators and the weighted scores were practically equivalent and both surpassed the total method. Differences in diagnostic ascertainment look back period up to 2 years were statistically but not clinically associated with significant differences in predictive performance for inhospital mortality.
Acknowledgments
This study was supported by the Fonds de recherche du Québec – Santé (FRQS), the McLaughlin Centre for Population Health Risk Assessment, and the University of Ottawa’s admission and excellence scholarship programs. The authors would like to thank the Cerner Corporation for generously allowing their team to conduct research using the HF database. They also want to acknowledge the journal reviewers for their valuable comments and suggestions.
Disclosure
YF, JAGC, and DC report no competing interests. DSM is the president of Cerner Math Inc. and has ownership interest in the Cerner Corporation. This paper reflects the opinions of the authors and not necessarily those of the Canadian Institute for Health Information or the Cerner Corporation. DRM serves as chief medical officer of Risk Sciences International (RSI), a company formed in partnership with the University of Ottawa in 2006. RSI undertakes risk assessment work for public and private sector clients in Canada and abroad. RSI has not conducted prior work on the subject of the present research paper. DK is chief risk scientist and CEO of RSI. Since 2002, DK has held a Natural Sciences and Engineering Research Council of Canada (NSERC) Industrial Research Chair in Risk Science, through a peer-reviewed university–industry partnerships program administered by NSERC. The scientific opinions and conclusions expressed in research publications by the chair are the responsibility of the chair alone. The authors report no other conflicts of interest in this work.
References
Elixhauser A, Steiner C, Harris DR, Coffey RM. Comorbidity measures for use with administrative data. Med Care. 1998;36(1):8–27. | ||
Tadrous M, Gagne JJ, Stürmer T, Cadarette SM. Disease risk score as a confounder summary method: systematic review and recommendations. Pharmacoepidemiol Drug Saf. 2013;22(2):122–129. | ||
Dominick KL, Dudley TK, Coffman CJ, Bosworth HB. Comparison of three comorbidity measures for predicting health service use in patients with osteoarthritis. Arthritis Care Res (Hoboken). 2005;53(5):666–672. | ||
Li P, Kim MM, Doshi JA. Comparison of the performance of the CMS Hierarchical Condition Category (CMS-HCC) risk adjuster with the Charlson and Elixhauser comorbidity measures in predicting mortality. BMC Health Serv Res. 2010;10(1):245. | ||
Schneeweiss S, Wang PS, Avorn J, Maclure M, Levin R, Glynn RJ. Consistency of performance ranking of comorbidity adjustment scores in Canadian and US utilization data. J Gen Intern Med. 2004;19(5p1):444–450. | ||
Stukenborg GJ, Wagner DP, Connors AF Jr. Comparison of the performance of two comorbidity measures, with and without information from prior hospitalizations. Med Care. 2001;39(7):727–739. | ||
Charlson ME, Wells MT, Ullman R, King F, Shmukler C. The Charlson comorbidity index can be used prospectively to identify patients who will incur high future costs. PLoS One. 2014;9(12):e112479. | ||
Charlson ME, Pompei P, Ales KL, MacKenzie CR. A new method of classifying prognostic comorbidity in longitudinal studies: development and validation. J Chronic Dis. 1987;40(5):373–383. | ||
Chu Y-T, Ng Y-Y, Wu S-C. Comparison of different comorbidity measures for use with administrative data in predicting short- and long-term mortality. BMC Health Serv Res. 2010;10(1):140. | ||
Quan H, Sundararajan V, Halfon P, et al. Coding algorithms for defining comorbidities in ICD-9-CM and ICD-10 administrative data. Med Care. 2005;43(11):1130–1139. | ||
AHRQ [webpage on the Internet]. Comorbidity Software, Version 3.7. 2014. Available from: http://www.hcup-us.ahrq.gov/toolssoftware/comorbidity/comorbidity.jsp. Accessed October 31, 2014. | ||
Fortin Y, Crispo J, Emons M, Mattison D, Krewski D. Comparing the predictive performance of two variants of the Elixhauser comorbidity measures for all-cause in-hospital mortality in a large multi-payer US Administrative database. Paper presented at: Value in Health; 2015; Philadelphia, PA. | ||
US Department of Health Human Services. Summary of the HIPAA Privacy Rule. U.S. Department of Health & Human Services. Washington; 2013. | ||
Hughes JS, Iezzoni LI, Daley J, Greenberg L. How severity measures rate hospitalized patients. J Gen Intern Med. 1996;11(5):303–311. | ||
Yurkovich M, Avina-Zubieta JA, Thomas J, Gorenchtein M, Lacaille D. A systematic review identifies valid comorbidity indices derived from administrative health data. J Clin Epidemiol. 2015;68(1):3–14. | ||
Sharabiani MT, Aylin P, Bottle A. Systematic review of comorbidity indices for administrative data. Med Care. 2012;50(12):1109–1118. | ||
Preen DB, Holman CAJ, Spilsbury K, Semmens JB, Brameld KJ. Length of comorbidity lookback period affected regression model performance of administrative health data. J Clin Epidemiol. 2006;59(9):940–946. | ||
D’Hoore W, Sicotte C, Tilquin C. Risk adjustment in outcome assessment: the Charlson comorbidity index. Methods Inf Med. 1993;32(5):382–387. | ||
Deyo RA, Cherkin DC, Ciol MA. Adapting a clinical comorbidity index for use with ICD-9-CM administrative databases. J Clin Epidemiol. 1992;45(6):613–619. | ||
Romano PS, Roos LL, Jollis JG. Presentation adapting a clinical comorbidity index for use with ICD-9-CM administrative data: differing perspectives. J Clin Epidemiol. 1993;46(10):1075–1079. | ||
Ghali WA, Hall RE, Rosen AK, Ash AS, Moskowitz MA. Searching for an improved clinical comorbidity index for use with ICD-9-CM administrative data. J Clin Epidemiol. 1996;49(3):273–278. | ||
van Walraven C, Austin PC, Jennings A, Quan H, Forster AJ. A modification of the Elixhauser comorbidity measures into a point system for hospital death using administrative data. Med Care. 2009;47(6):626–633. | ||
B.R.I.D.G.E. to Data [webpage on the Internet]. Cerner Health Facts® Database (USA). 2014. Available from: http://www.bridgetodata.org/node/1789. Accessed October 28, 2014. | ||
Barrett M, Lopez-Gonzalez L, Hines A, Andrews R, Jiang J [webpage on the Internet]. An examination of expected payer coding in HCUP databases. In: U.S. Agency for Healthcare Research and Quality, editor. HCUP Methods Series Report # 2014–03. 2014. Available from: http://www.hcup-us.ahrq.gov/reports/methods/methods.jsp. Accessed October 7, 2015. | ||
Fortin Y, Crispo J, Emons M, Mattison D, Krewski D. PRM20-comparing the predictive performance of two variants of the Elixhauser comorbidity measures for all-cause in-hospital mortality in a large multi-payer US administrative database. Value Health. 2015;18(3):A13. | ||
CDC. Classification of Diseases, Functioning, and Disability: International Classification of Diseases, Ninth Revision (ICD-9). Atlanta, GA: Centers for Disease Control and Prevention; 2009. | ||
Manitoba Centre for Health Policy [webpage on the Internet]. Concept: Complications and Comorbidities. 2010. Available from: http://mchp-appserv.cpe.umanitoba.ca/viewConcept.php?conceptID=1099#a_sas. Accessed October 3, 2015. | ||
Kurichi JE, Stineman MG, Kwong PL, Bates BE, Reker DM. Assessing and using comorbidity measures in elderly veterans with lower extremity amputations. Gerontology. 2007;53(5):255–259. | ||
Baldwin L-M, Klabunde CN, Green P, Barlow W, Wright G. In search of the perfect comorbidity measure for use with administrative claims data: does it exist? Med Care. 2006;44(8):745–753. | ||
Sullivan LM, Massaro JM, D’Agostino RB. Presentation of multivariate data for clinical use: the Framingham Study risk score functions. Stat Med. 2004;23(10):1631–1660. | ||
Raymond EG, Grossman D, Weaver MA, Toti S, Winikoff B. Mortality of induced abortion, other outpatient surgical procedures and common activities in the United States. Contraception. 2014;90(5):476–479. | ||
Keyes GR, Singer R, Iverson RE, et al. Mortality in outpatient surgery. Plast Reconstr Surg. 2008;122(1):245–250. | ||
Zhu H, Hill MD. Stroke the Elixhauser Index for comorbidity adjustment of in-hospital case fatality. Neurology. 2008;71(4):283–287. | ||
Downer RG, Richardson P. Illustrative Logistic Regression Examples Using PROC LOGISTIC: New Features in SAS/STAT® 9.2. Paper SP03-2009. 2009. | ||
Hosmer DW Jr, Lemeshow S, Sturdivant RX. Applied Logistic Regression. Vol. 398. 3rd ed. Hoboken, NJ: John Wiley & Sons; 2013. | ||
DeLong ER, DeLong DM, Clarke-Pearson DL. Comparing the areas under two or more correlated receiver operating characteristic curves: a nonparametric approach. Biometrics. 1988;44(3):837–845. | ||
Thompson NR, Fan Y, Dalton JE, et al. A new Elixhauser-based comorbidity summary measure to predict in-hospital mortality. Med Care. 2015;53(4):374–379. | ||
Solon JA, Feeney JJ, Jones SH, Rigg RD, Sheps CG. Delineating episodes of medical care. Am J Public Health Nations Health. 1967;57(3):401–408. | ||
Quan H, Li B, Duncan Saunders L, et al. Assessing validity of ICD-9-CM and ICD-10 administrative data in recording clinical conditions in a unique dually coded database. Health Serv Res. 2008;43(4):1424–1441. | ||
Wingert TD, Kralewski JE, Lindquist TJ, Knutson DJ. Constructing episodes of care from encounter and claims data: some methodological issues. Inquiry. 1995;32(4):430–443. | ||
Kozar RA, Holcomb JB, Xiong W, Nathens AB. Are all deaths recorded equally? The impact of hospice care on risk-adjusted mortality. J Trauma Acute Care Surg. 2014;76(3):634–641. | ||
Jensen ET, Cook SF, Allen JK, et al. Enrollment factors and bias of disease prevalence estimates in administrative claims data. Ann Epidemiol. 2015;25(7):519–525.e2. | ||
Tunnell R, Millar B, Smith G. The effect of lead time bias on severity of illness scoring, mortality prediction and standardised mortality ratio in intensive care – a pilot study. Anaesthesia. 1998;53(11):1045–1053. | ||
Klabunde CN, Legler JM, Warren JL, Baldwin L-M, Schrag D. A refined comorbidity measurement algorithm for claims-based studies of breast, prostate, colorectal, and lung cancer patients. Ann Epidemiol. 2007;17(8):584–590. | ||
Hollenbeak CS, Stack BC, Daley SM, Piccirillo JF. Using comorbidity indexes to predict costs for head and neck cancer. Arch Otolaryngol Head Neck Surg. 2007;133(1):24–27. | ||
Khan NF, Perera R, Harper S, Rose PW. Adaptation and validation of the Charlson Index for Read/OXMIS coded databases. BMC Fam Pract. 2010;11(1):1. | ||
van Walraven C, Austin P. Administrative database research has unique characteristics that can risk biased results. J Clin Epidemiol. 2011;65(2):126–131. | ||
Esposito D, Migliaccio-Walle K, Molsen E. Reliability and Validity of Data Sources for Outcomes Research & Disease and Health Management Programs. Lawrenceville, NJ: ISPOR; 2013:467. |
Supplementary materials
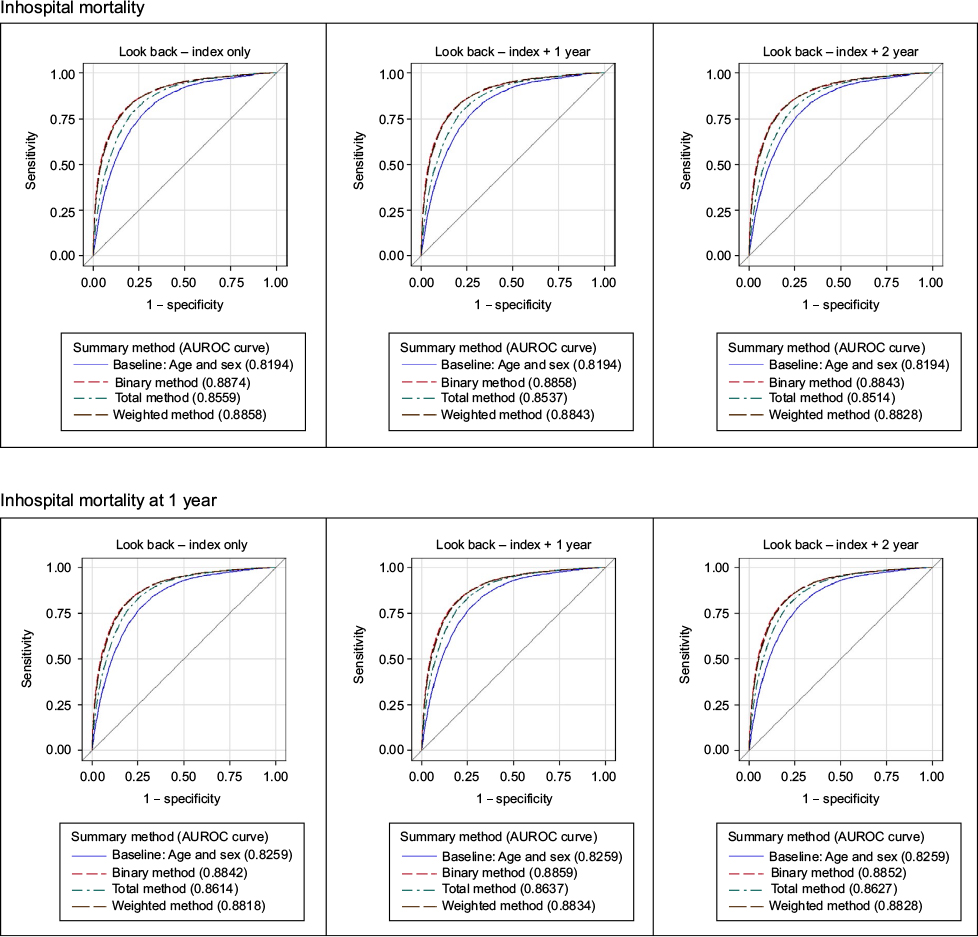 | Figure S1 Comparisons of ROC curves across comorbidity summary methods by mortality outcome and look back period. Abbreviations: ROC, receiver operating characteristic; AUROC, area under the receiver operating characteristic. |
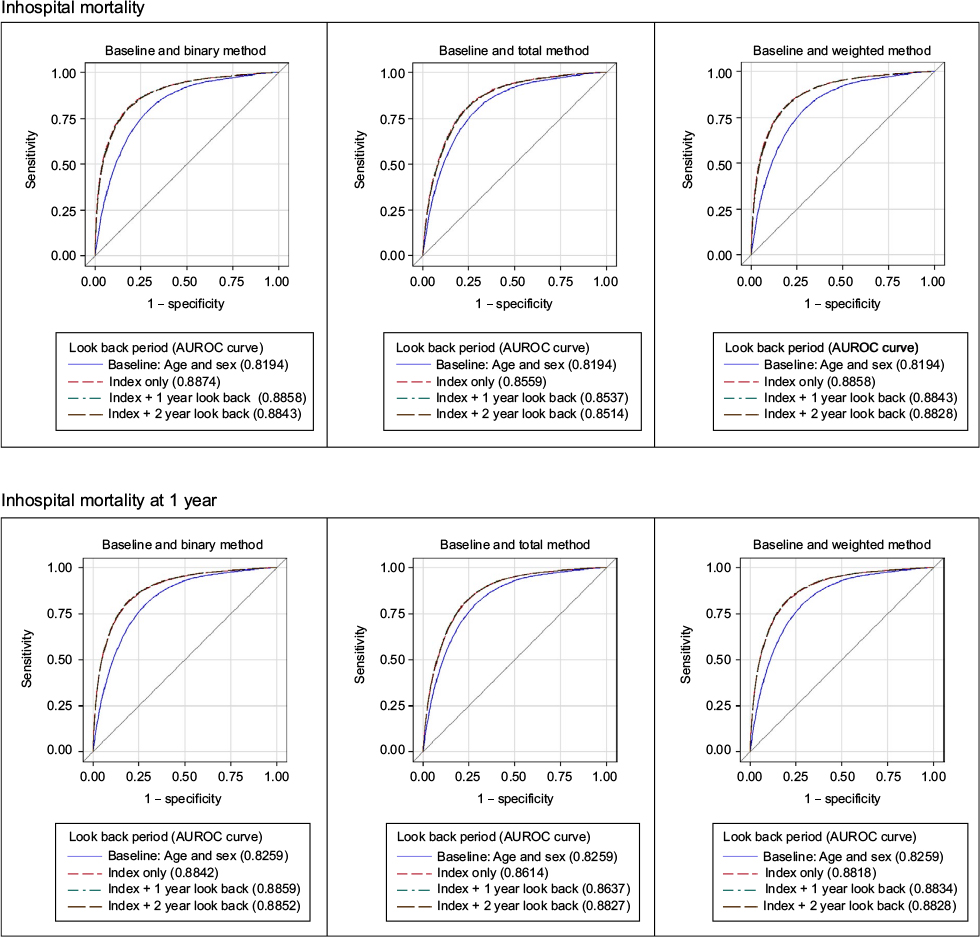 | Figure S2 Comparisons of ROC curves across look back periods by mortality outcome and comorbidity summary method. Abbreviations: ROC, receiver operating characteristic; AUROC, area under the receiver operating characteristic. |
 © 2017 The Author(s). This work is published and licensed by Dove Medical Press Limited. The full terms of this license are available at https://www.dovepress.com/terms.php and incorporate the Creative Commons Attribution - Non Commercial (unported, v3.0) License.
By accessing the work you hereby accept the Terms. Non-commercial uses of the work are permitted without any further permission from Dove Medical Press Limited, provided the work is properly attributed. For permission for commercial use of this work, please see paragraphs 4.2 and 5 of our Terms.
© 2017 The Author(s). This work is published and licensed by Dove Medical Press Limited. The full terms of this license are available at https://www.dovepress.com/terms.php and incorporate the Creative Commons Attribution - Non Commercial (unported, v3.0) License.
By accessing the work you hereby accept the Terms. Non-commercial uses of the work are permitted without any further permission from Dove Medical Press Limited, provided the work is properly attributed. For permission for commercial use of this work, please see paragraphs 4.2 and 5 of our Terms.