")
Back to Journals » Diabetes, Metabolic Syndrome and Obesity » Volume 13
Optimal Cut-Offs of Body Mass Index and Waist Circumference to Identify Obesity in Chinese Type 2 Diabetic Patients
Authors Zhao Q, Chen X, Wu J, Gong L, Hu J, Yang S, Li Q, Wang Z
Received 27 February 2020
Accepted for publication 13 May 2020
Published 3 June 2020 Volume 2020:13 Pages 1899—1909
DOI https://doi.org/10.2147/DMSO.S251574
Checked for plagiarism Yes
Review by Single anonymous peer review
Peer reviewer comments 2
Editor who approved publication: Professor Ming-Hui Zou
Qinying Zhao,* Xiangjun Chen,* Jinshan Wu, Lilin Gong, Jinbo Hu, Shumin Yang, Qifu Li, Zhihong Wang
Department of Endocrinology, The First Affiliated Hospital of Chongqing Medical University, Chongqing, People’s Republic of China
*These authors contributed equally to this work
Correspondence: Zhihong Wang
Department of Endocrinology, The First Affiliated Hospital of Chongqing Medical University, Yuzhong District, Chongqing, People’s Republic of China
Tel/ Fax +86 023 89011552
Email [email protected]
Purpose: The prevalence of general obesity (commonly defined by body mass index (BMI) in kg/m2) and abdominal obesity (commonly assessed by waist circumference (WC)) has increased rapidly in China. The aim of this study was to investigate the diagnostic accuracy of traditional cut-offs for BMI or WC to identify general or abdominal obesity in Chinese type 2 diabetic patients and propose optimal cut-offs.
Patients and Methods: BMI and WC were obtained from 1539 type 2 diabetic patients. Body fat percentage and visceral fat area measured by dual-energy x-ray absorptiometry were set as the gold standard to identify general and abdominal obesity. We assessed the diagnostic power of traditional cut-offs for BMI and WC to define obesity, and analyzed receive operating characteristic (ROC) curves to obtain the optimal cut-offs to identify obesity in Chinese type 2 diabetic patients.
Results: In Chinese type 2 diabetic patients, the optimal BMI was 25 kg/m2 with the best trade-off between sensitivity and specificity (men: 74.6% (95% CI: 70.7– 78.2%) and 65.1% (95% CI: 59.7– 70.3%), AUC 0.78 (95% CI: 0.75– 0.81), p< 0.05; women: 65.8% (95% CI: 60.3– 71.0%) and 80.3% (95% CI: 75.7– 84.3%), AUC 0.80 (95% CI: 0.77– 0.83), p< 0.05) in both genders. The optimal WC was 93 cm in men and 90 cm in women with the best trade-off between sensitivity and specificity (men: 87.2% (95% CI: 84.3– 89.8%) and 80.2% (95% CI: 74.9– 84.8%), AUC 0.91 (95% CI: 0.88– 0.92), p< 0.05; women: 81.0% (95% CI: 76.9– 84.6%) and 88.7% (95% CI: 83.9– 92.4%), AUC 0.92 (95% CI: 0.90– 0.94), p< 0.05).
Conclusion: For the Chinese patients with type 2 diabetes, the optimal cut-offs for BMI or WC to identify general or abdominal obesity need to be reconsidered.
Keywords: diagnostic test, type 2 diabetes, body mass index, waist circumference, dual-energy X-ray absorptiometry
Introduction
Obesity is associated with the increased risks of type 2 diabetes mellitus (T2DM), cardiovascular diseases (CVDs), cancer and premature mortality.1–3 T2DM is one of the most common obesity-associated complications.4 Approximately half of the patients with diabetes are overweight or obese.5,6 Obesity can not only cause insulin resistance and damage islet function but also lead to metabolic abnormalities,7 which can further aggravate the occurrence and development of chronic complications in the diabetes. Therefore, identifying obesity as a disease in a clinical care setting is critical to the management of such T2DM patients.
General obesity and abdominal obesity are the major subtypes of obesity. General obesity, commonly defined by body mass index (BMI) in kg/m2, has increased dramatically in China during the past decades.8 However, BMI did not represent only fat mass, but also lean mass and bone density. The characteristics of body composition in T2DM, including the increase in total fat mass9,10 and the decrease of muscle mass or bone density,11,12 which might lead to a normal BMI even with an increase in fat mass. The traditional cut-offs of BMI in general population might underestimate the degree of general obesity in patients with T2DM. Also, current studies have demonstrated that traditional cut-offs of BMI poorly predict diabetes, CVDs and death.13–16 Abdominal obesity, commonly assessed by measuring waist circumference (WC), is more strongly associated with the risk of T2DM and all-cause mortality than general obesity.17 However, in the diabetes, an imbalance in glucose metabolism might severely affect lipid metabolism, leading to a mass of fat accumulation, especially the deposition of abdominal fat.9,18,19 Eventually, it resulted in the significant increase in WC than general population. However, it was unclear the cut-offs of WC for general population could correctly judge whether the diabetes were combined with abdominal obesity or not. Of note, the current cut-offs of BMI and WC to diagnose obesity for general population have not been validated for the population with T2DM. Few studies have been performed to determine the optimal cut-offs of BMI and WC for identifying obesity for the patients with T2DM.
Therefore, our study aimed to investigate the diagnostic accuracy of traditional cut-offs for BMI or WC to identify general or abdominal obesity in Chinese type 2 diabetic patients and propose optimal cut-offs. The golden-standard for identifying abdominal obesity is CT and MRI,20 however, they are unsuitable for clinical practices because of high cost and waste time. Advances in dual-energy X-ray absorptiometry (DXA) suggested that this method provides reliable estimates of total body fat21–25 and visceral fat.26,27 Therefore, body fat percentage (BF%) and visceral fat area (VFA) measured by DXA were set as the gold criteria to identify general and abdominal obesity in our study.
Patients and Methods
Subjects
This study was performed at the Chongqing Diabetes Center, which relies on the First Affiliated Hospital of Chongqing Medical University, from September 2015 to December 2018. Participants with the following conditions were included: (1) aged from 20 to 85 years; (2) achieved the 1999 World Health Organization (WHO)’s diagnostic criteria for type 2 diabetes mellitus;28 (3) had complete data of body compositions measured by DXA. The exclusion criteria were as follows: (1) secondary obesity: endocrine and metabolic diseases (such as hyperthyroidism, hypothyroidism, Cushing’s syndrome, acromegaly, etc.) or drug use (such as exogenous glucocorticoids, antidepressants, teaching psychotropic drugs, etc.); (2) presence of malignant tumor. We screened 1640 individuals including inpatients and outpatients, of whom 101 patients were excluded due to unavailable data or meeting exclusion criteria. Eventually, a total of 1539 subjects (men 870 and women 669) were recruited (Figure 1). Informed consent was obtained from all individual participants included in the study. The study protocol was approved by the Ethics Committee of the First Affiliated Hospital of Chongqing Medical University [2018 Scientific Research Ethics (2018–042)]. This study was conducted in accordance with the Declaration of Helsinki.
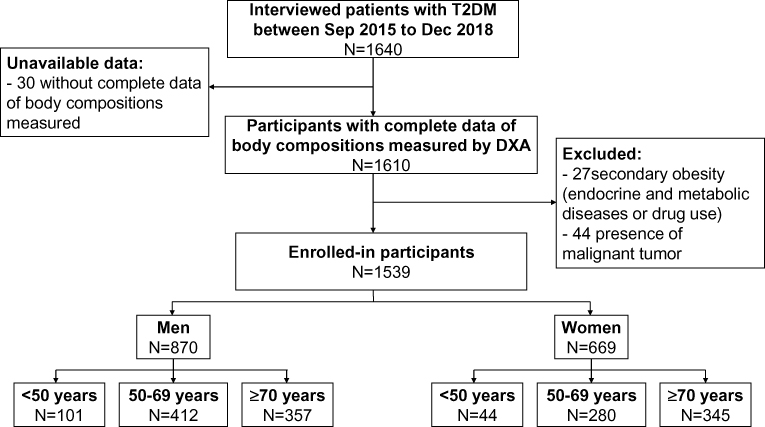 |
Figure 1 Flow chart of study population in the study. Abbreviations: T2DM, type 2 diabetes mellitus; Sep, September; Dec, December; DXA, dual-energy X-ray absorptiometry. |
Clinical Procedures
The medical history of all patients was documented in detail, such as sex, age and medication including oral hypoglycemic agent (OHA), insulin, antihypertensive drugs and lipid-lowering drugs (LLDs). Anthropometric measurements, including height, weight, WC, systolic blood pressure (SBP), and diastolic blood pressure (DBP), were performed on all participants. Height (m, electronic human scale (HLZ-48, OMROM, Japan)) and weight (kg, electronic human scale (HLZ-48, OMROM, Japan)) were measured by patients standing without shoes and hats, and in light attire. BMI was calculated as weight divided by the square of height. WC was measured at the horizontal plane between the inferior costal margin and the iliac crest on midaxillary line. Glycosylated hemoglobin (HbA1c) was measured by a high-performance liquid chromatography analyzer. Fasting plasma glucose (FPG), 2h plasma glucose (2hPG), total cholesterol (TC), low-density lipoprotein cholesterol (LDL-C), high-density lipoprotein cholesterol (HDL-C), and triglyceride (TG) were measured enzymatically by an automatic analyzer (Model 7080; Hitachi, Tokyo, Japan) with reagents purchased from Leadman Biochemistry Co. Ltd. (Beijing, China). Serum creatinine (SCr) was measured with an automatic biochemical analyzer (Modular DDP, Roche). And the estimated glomerular filtration rate (eGFR) was calculated using the Modification of Diet in Renal Disease (MDRD) Study equation (male: eGFR=186×SCr−1.154×year−0.203; female: eGFR=186×SCr−1.154×year−0.203×0.724).29
Dual-Energy X-Ray Absorptiometry (DXA)
The DXA (Hologic Discovery QDR ®Series, Bedford, USA) was used to measure the BF% and VFA by a skilled technician. All standard procedures were performed according to previous studies.25,30 The subject was reclined in a supine position and was scanned from head to foot in the standard mode. The scanning range width was fixed at 60 cm, and the scanning time was approximately 20 mins. The Hologic Whole Body DXA Reference Database Software and Hologic Visceral Fat Software were used to estimate the BF% and VFA.31,32
Definition of General and Abdominal Obesity
BF% and VFA measured by DXA were set as the gold criteria to identify general and abdominal obesity in our study. Diagnostic definition of general obesity was BF% ≥25% for men or 35% for women,33,34 according to the values recommended by the WHO and American Association for Clinical Endocrinology.21,22,25 And the cut-off for BF% was also appliable to the Chinese population, which was verified in Chinese population by Weiping Jia et al.35 Diagnostic criterion for abdominal obesity followed the Examination Committee of Criteria for “Obesity Disease” in Japan 2002 (VFA ≥100 cm2),36 which was same to the standard of NHANES.37
In our population with T2DM, we tested the diagnostic accuracy of the traditional cut-offs for BMI or WC to identify general or abdominal obesity (based on general population) followed by 1993 World Health Organization (WHO) and 2004 Chinese Diabetes Society (CDS) definition, respectively: definition for general obesity in the WHO was BMI≥30 kg/m2, and definition for abdominal obesity was WC ≥102 cm in men and ≥88 cm in women; Diagnosis of general obesity in the CDS was BMI≥28 kg/m2, and diagnosis of abdominal obesity was WC ≥90 cm in men and 85 cm in women.38
Statistical Analysis
Statistical analysis was performed using the Statistical Package for Social Science, version 20.0 (IBM SPSS, Armonk, New York). We divided the subjects into two groups of obesity and non-obesity based on the golden standard. The Kolmogorov–Smirnov test was used to verify the normal distribution of data. For normally distributed variables, data were presented as mean ± SD and tested by Student’s t-test; for non-normally distributed variables, data were presented as the medians (interquartile range) and tested by the Mann–Whitney U-test. Categorical variables were reported as frequencies (proportions), and chi-square tests were used for group comparisons. All reported p values were two-tailed, and significance level was 0.05 for all the statistical tests. Subjects were also classified according to the traditional cut-offs for BMI or WC representing general or abdominal obesity. Diagnostic performance was assessed by determining sensitivity, specificity, positive and negative predictive values. We plotted an receiver-operator characteristics (ROC) curves to find the optimal cut-offs of BMI or WC in identifying general or abdominal obesity. The optimal cut-offs of BMI and WC were obtained from the Youden index [maximum (sensitivity + specificity – 1)] by ROC curves. Greater accuracy is selected by a larger Youden index.
Results
Clinical Characteristics of the Participants
The clinical characteristics of our participants with or without obesity were shown in Tables 1 and 2. In 870 men there were 543 (62.4%) defined as general obesity, and 603 (69.3%) diagnosed as abdominal obesity. In 669 women there were 319 (47.7%) diagnosed as general obesity, and 431 (64.4%) defined as abdominal obesity. Both men and women with general obesity had significantly higher age, weight, TG, BF%, VFA, BMI and WC, while significantly lower HDL-C than those without general obesity (p < 0.05). Compared to patients without abdominal obesity in both genders, the levels of weight, DBP, FPG, SCr, TG, BF%, VFA, BMI and WC increased significantly (p < 0.05) in subjects with abdominal obesity, while the levels of eGFR and HDL-C decreased significantly (p < 0.05). And there were no significant difference in medication for group comparisons (Tables 1 and 2).
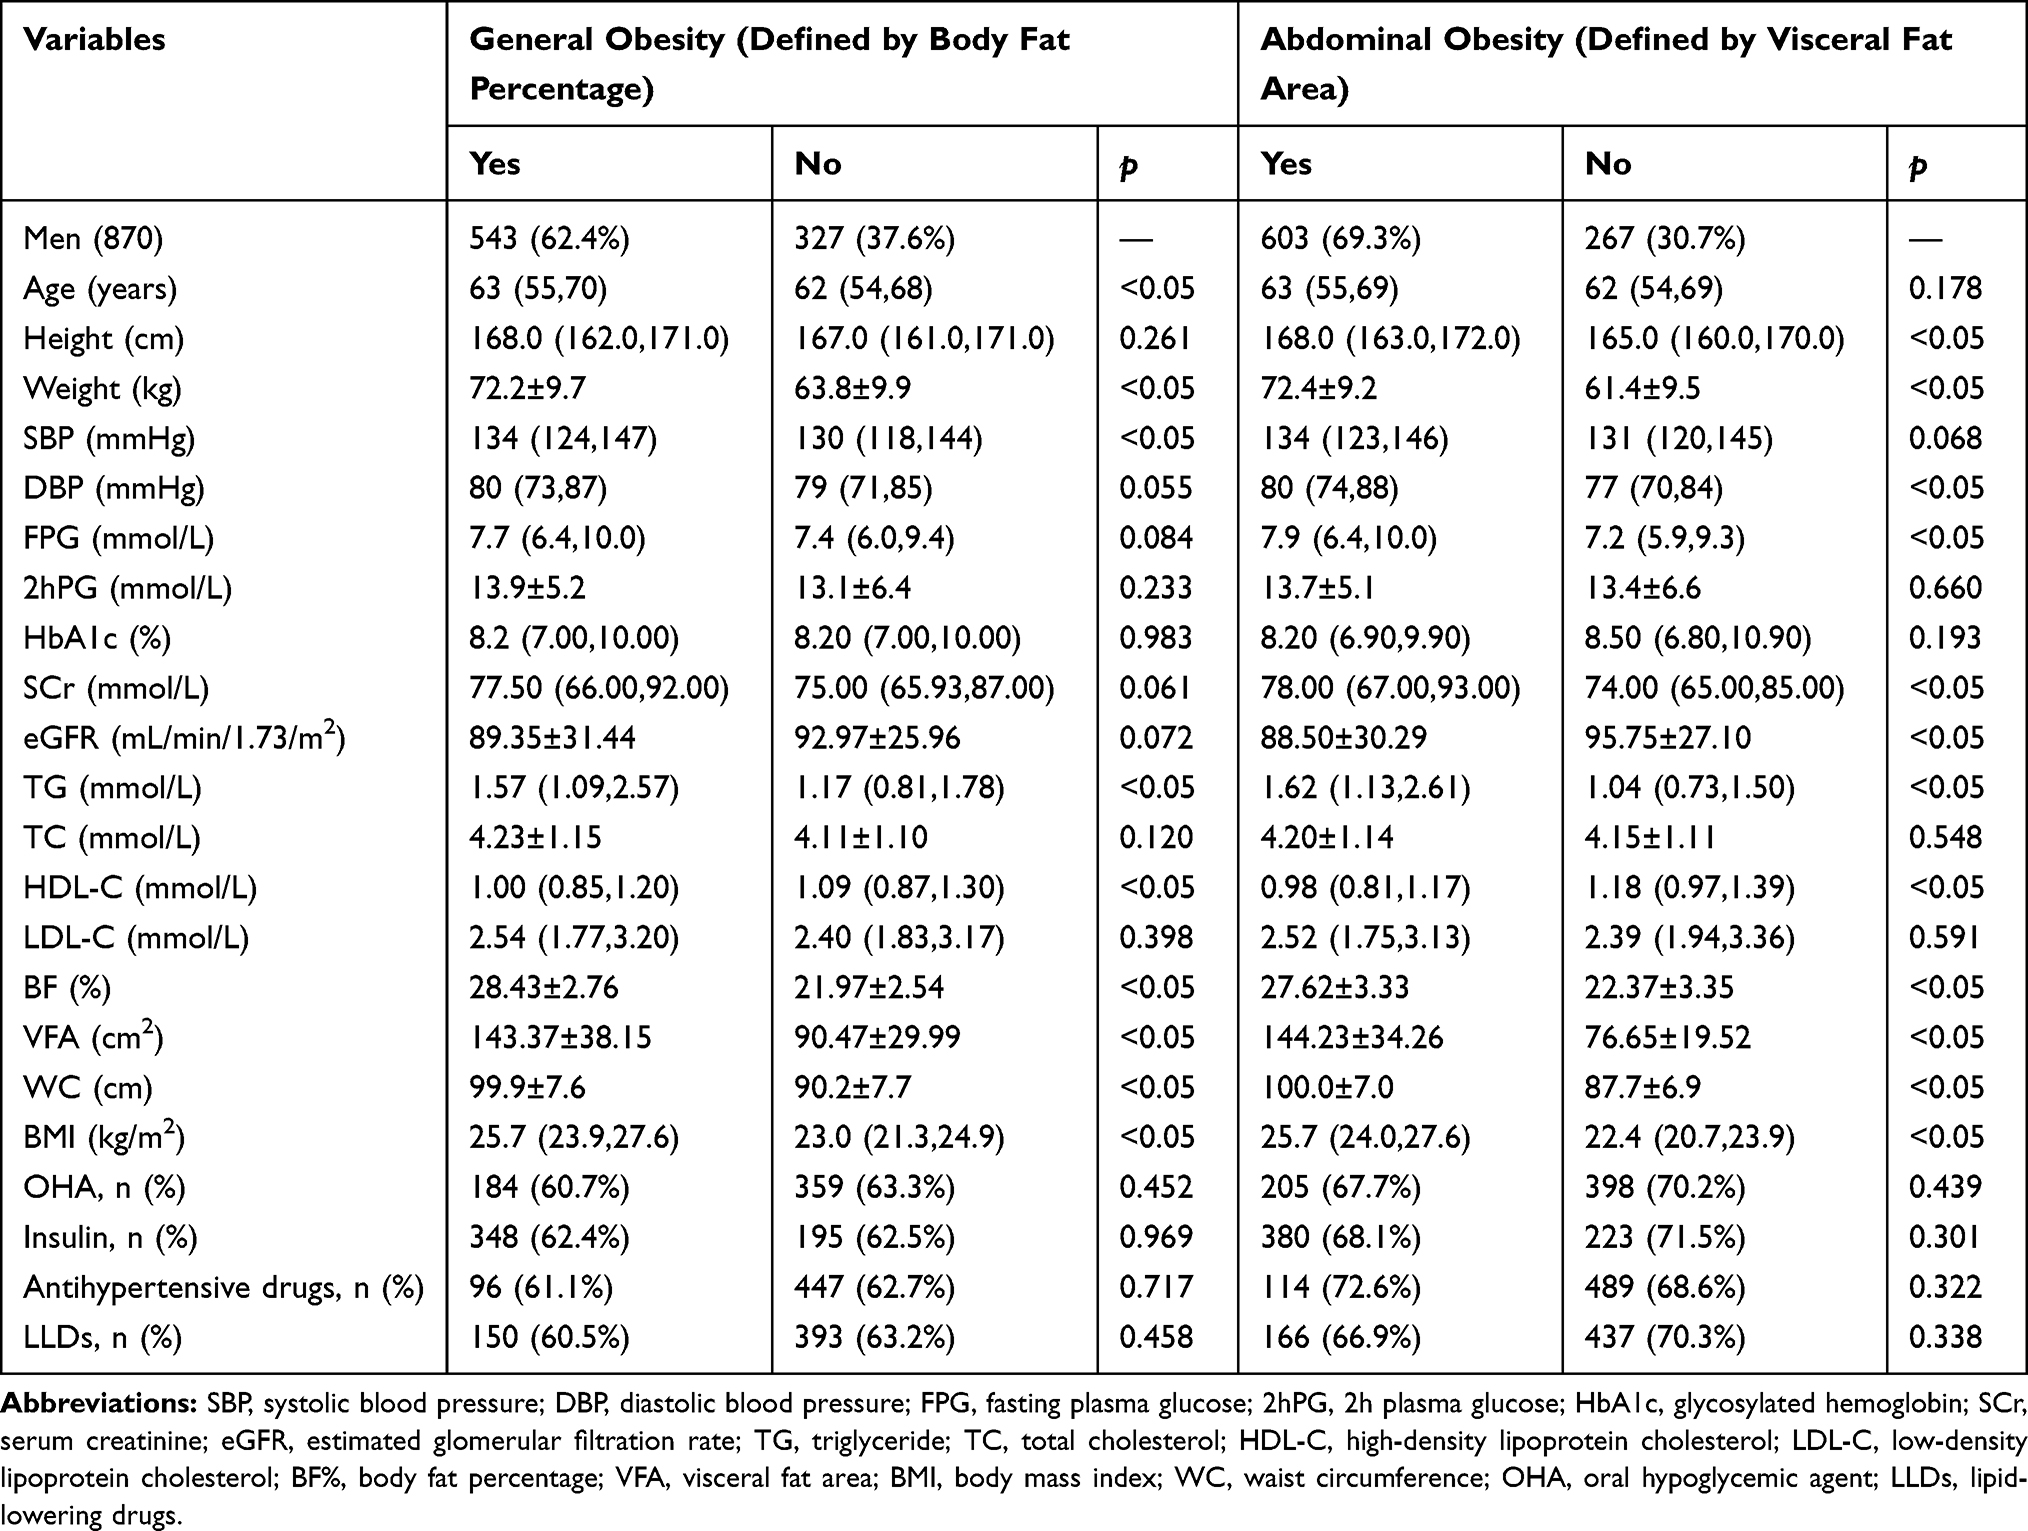 |
Table 1 Clinical Characteristics of the Subjects in Men |
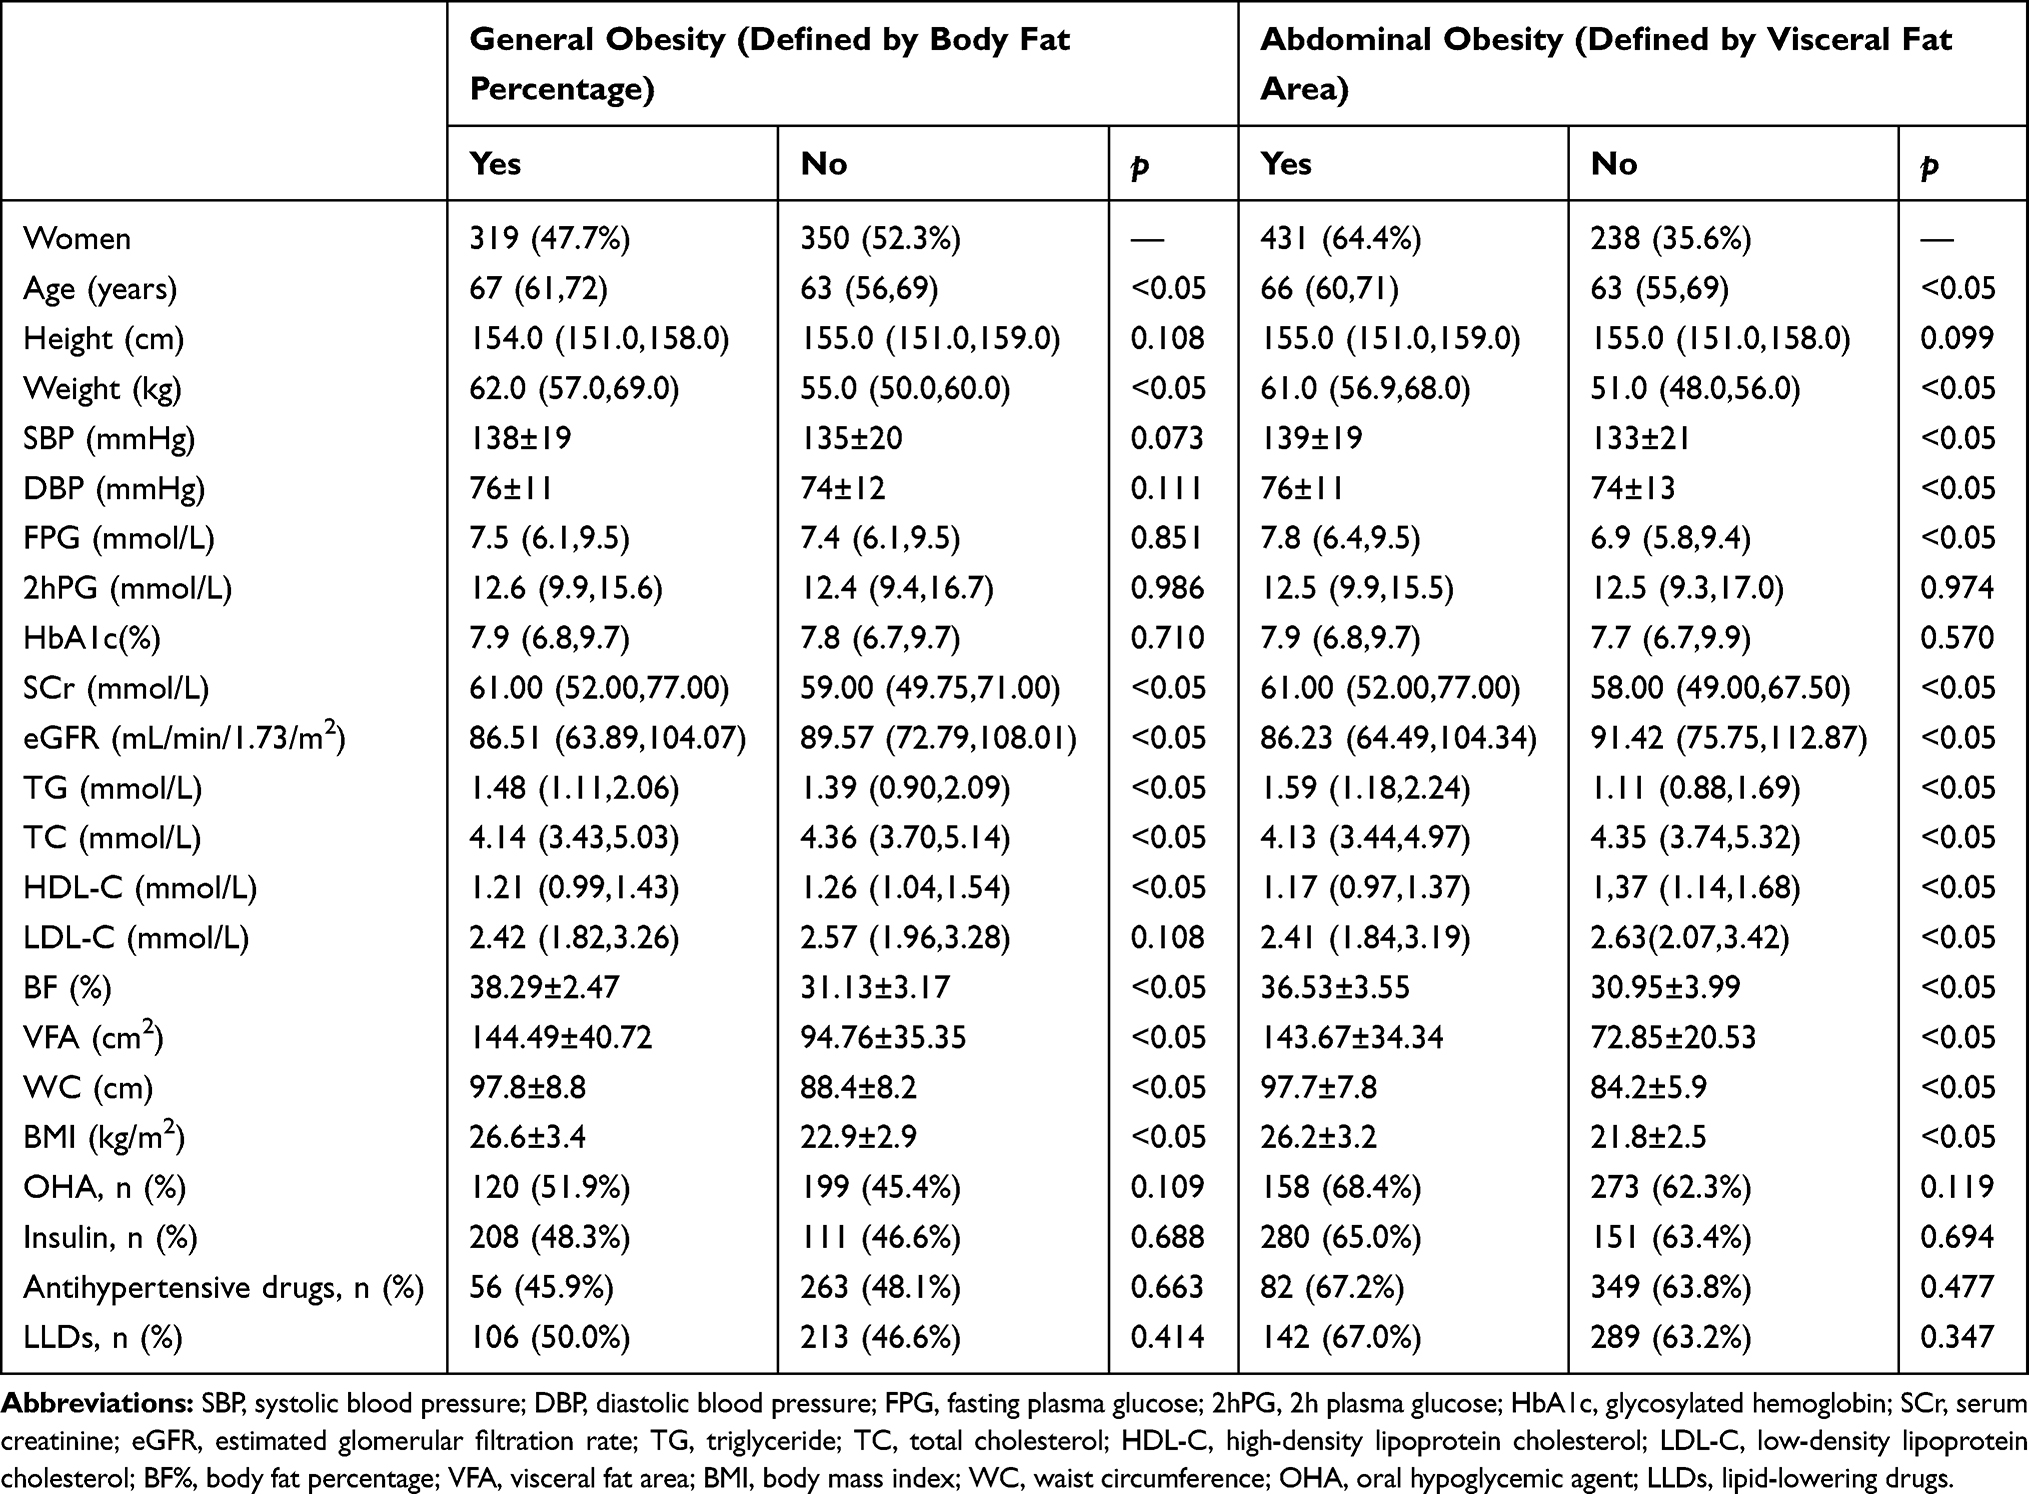 |
Table 2 Clinical Characteristics of the Subjects in Women |
Diagnostic Accuracy of the Traditional Cut-Offs of BMI and WC in Chinese Patients with T2DM
The diagnostic accuracy of the traditional cut-offs for BMI to identify general obesity is shown in Table 3, (Supplemental Table 1a and 1b). A BMI of 28 kg/m2 (CDS criteria for general obesity) showed a sensitivity of 22.1%, and a specificity of 96.9% for men. However, with this cut-off, the BMI showed a sensitivity of 31.3%, and a specificity of 96.6% for women. As the cut-off for BMI increased from 28 to 30 kg/m2 (WHO criteria for general obesity), the sensitivity dropped and the specificity increased in both genders. In this study, subjects were also stratified into subgroups by the age <50 years, 50–69 years and ≥70 years. Using a BMI of 28 kg/m2 or 30 kg/m2 as the cut-off value, the highest rate of missed diagnosis was found in patients older than 70 years old in both genders.
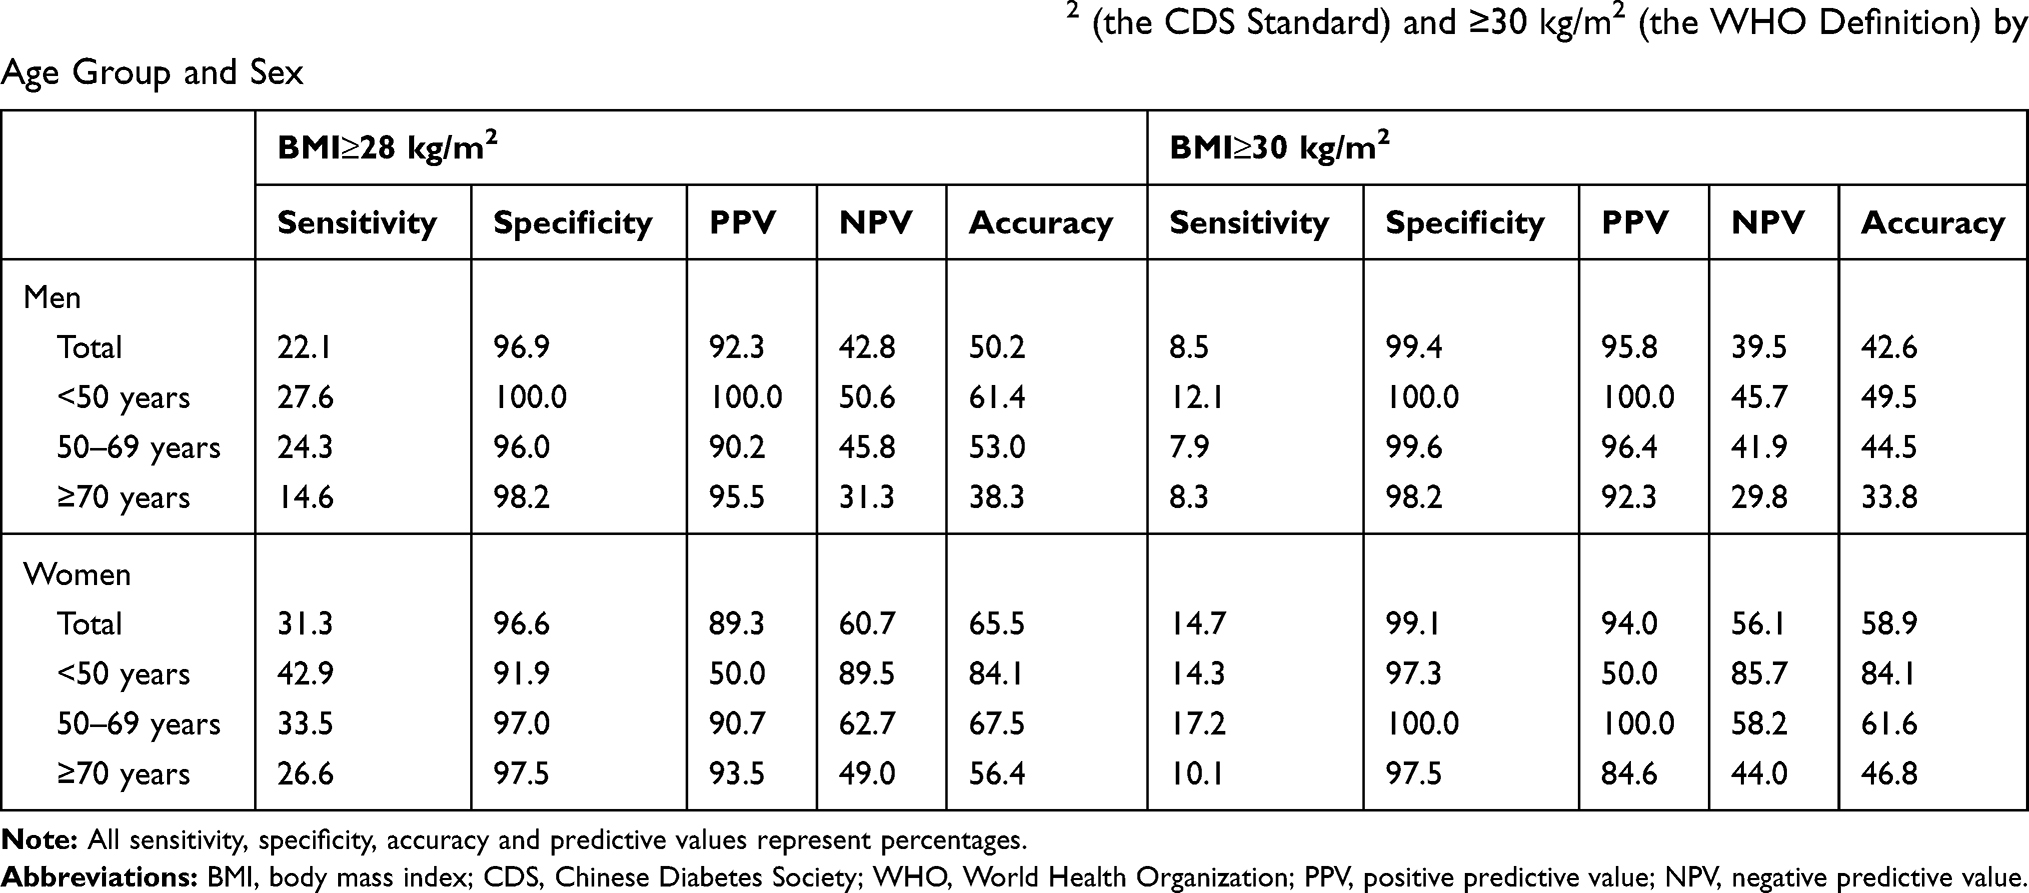 |
Table 3 Diagnostic Performance for BMI Using Cut-Offs of ≥28 kg/m2 (the CDS Standard) and ≥30 kg/m2 (the WHO Definition) by Age Group and Sex |
A WC of 90 cm in men and 85 cm in women (CDS criteria for abdominal obesity) had a high sensitivity (men: 95.0%; women: 97.4%) and a moderately low specificity (men: 63.7%; women: 58.4%) to identify abdominal obesity. When the cut-off for WC was set according to the WHO standard (WC ≥102 cm in men and 88 cm in women), the sensitivity was decreased to 37.0% in men and 90.3% in women, and the specificity was increased to 98.5% in men and 76.5% in women. The Chinese patients with T2DM older than 70 years old had higher diagnostic accuracies of WC in both genders either by the CDS or the WHO standard (Table 4, Supplemental Table 1c and 1d).
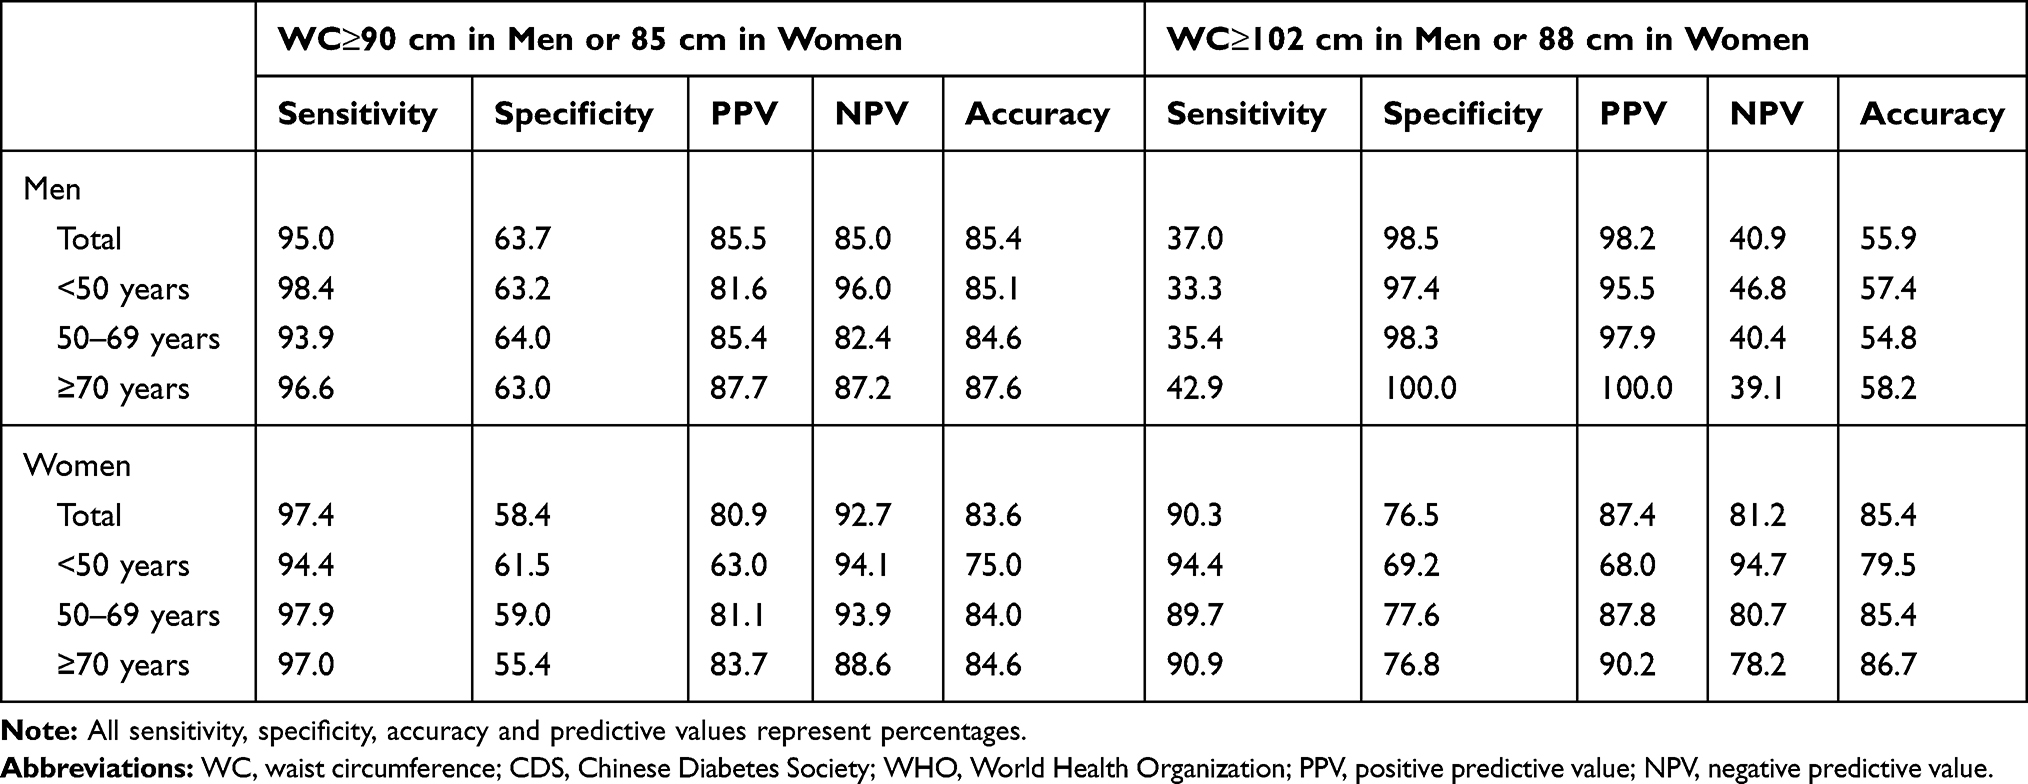 |
Table 4 Diagnostic Performance for WC Using Cut-Offs of ≥90 cm in Men or 85 cm in Women (the CDS Standard) and ≥102 cm in Men or 88 cm in Women (the WHO Definition) by Age Group and Sex |
The Optimal Cut-Offs of BMI and WC for General and Abdominal Obesity
Using BMI to confirm general obesity, the ROC curve analysis showed that the AUC of the BMI was 0.78 (95% confidence interval (CI), 0.75–0.81) for men (Figure 2A) and 0.80 (95% CI, 0.77–0.83) for women (Figure 2C). As shown in Table 5 and Supplemental Table 2a, the ideal BMI was 24.0 kg/m2 for men (sensitivity: 74.6% (95% CI: 70.7–78.2%); specificity: 65.1% (95% CI: 59.7–70.3%)) and 25.1 kg/m2 for women (sensitivity: 65.8% (95% CI: 60.3–71.0%); specificity: 80.3% (95% CI: 75.7–84.3%)) with the best trade-off between sensitivity and specificity, which was round to 25 kg/m2 in both genders. For the older patients (more than 70 years old), the optimal BMI cut-off needed to be lower than younger patients (<50 years old and 50–69 years old).
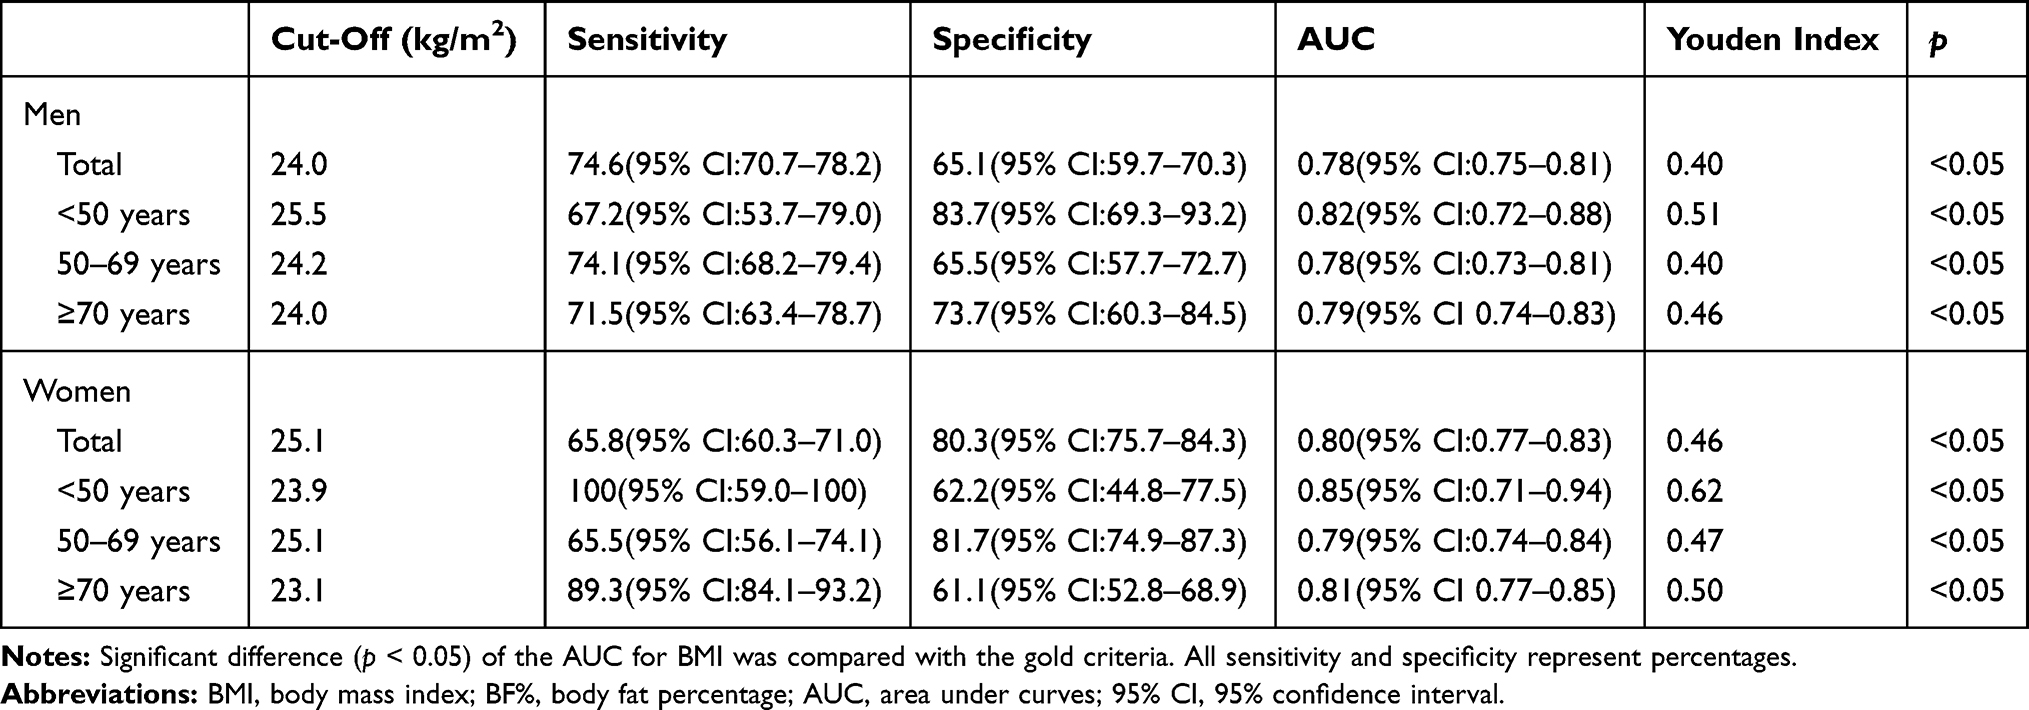 |
Table 5 Sensitivity, Specificity, AUC and Youden Index of BMI to Identify BF% in Association with General Obesity |
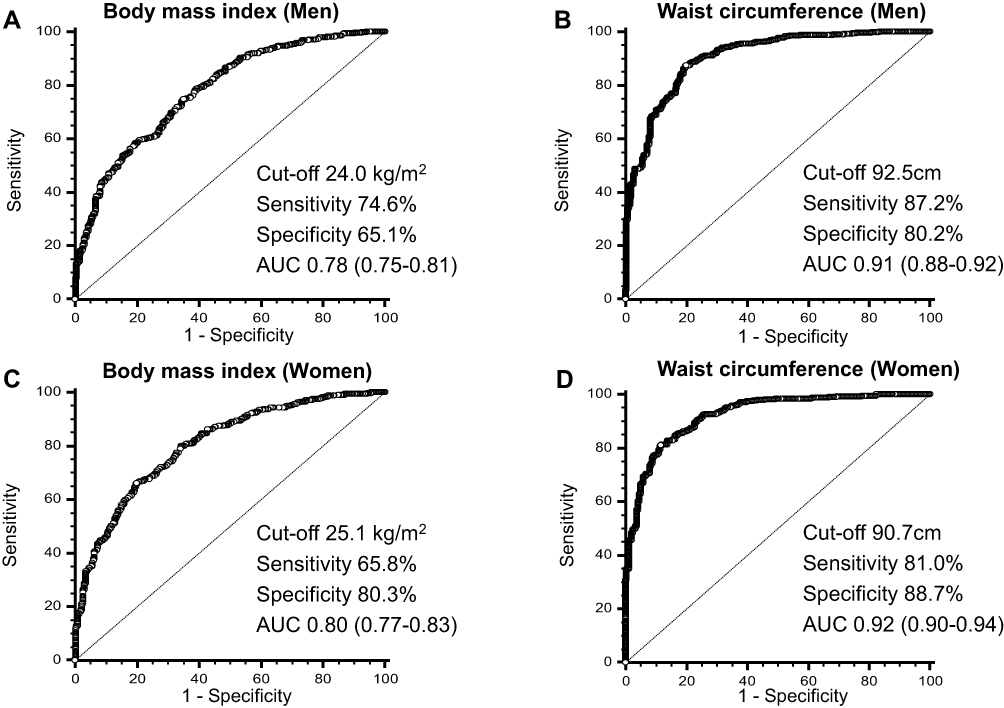 |
Figure 2 Receiver-operator characteristics (ROC) curves of body mass index (BMI) and waist circumference (WC) to detect body fat percentage and visceral fat area by sex. ROC curves of BMI for all subjects included in this analysis to detect body fat percentage by sex. Notes: (A) Men and (C) women; ROC curves of WC for all subjects included in this analysis to detect visceral fat area by sex. (B) Men and (D) women. Abbreviation: AUC, area under curves. |
Using WC to confirm abdominal obesity, the ROC curve analysis showed that the AUC of the WC was 0.91 (95% CI, 0.88–0.92) for men (Figure 2B) and 0.92 (95% CI, 0.90–0.94) for women (Figure 2D). As shown in Table 6 and Supplemental Table 2b, the optimal WC was 93 cm for men and 90 cm for women with the best trade-off between sensitivity (men: 87.2% (95% CI: 84.3–89.8%); women: 81.0% (95% CI: 76.9–84.6%)) and specificity (men: 80.2 % (95% CI: 74.9–84.8%); women: 88.7% (95% CI: 83.9–92.4%)). In age subgroup, the optimal cut-off for WC in younger patients (<50 years old and 50–69 years old) was similar to that in older patients (≥70 years old).
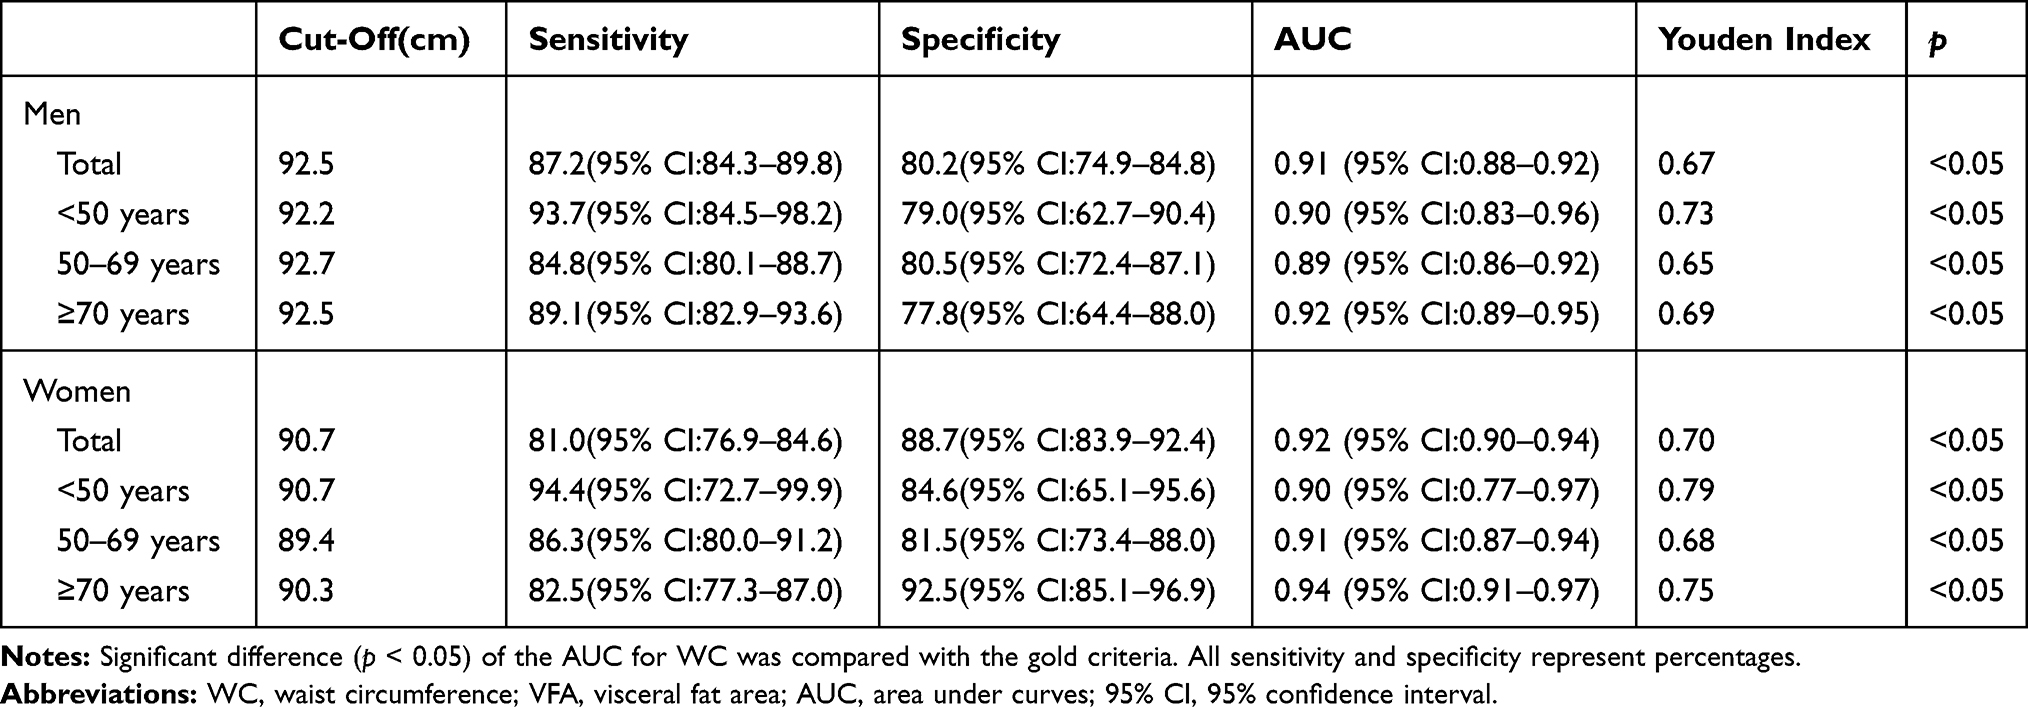 |
Table 6 Sensitivity, Specificity, AUC and Youden Index of WC to Identify VFA in Association with Abdominal Obesity |
Discussion
Our study suggested that the traditional cut-offs of BMI and WC underestimate the degree of obesity in Chinese patients with T2DM. In order to strengthen the diagnosis and management of obesity in Chinese patients with T2DM, we proposed the optimal cut-offs of BMI (25 kg/m2) or WC (men: 93cm; women: 90cm) for defining general or abdominal obesity through ROC curves analysis.
Obesity, and especially abdominal obesity, is considered one of the most important risk factors for T2DM39 and is also consistently associated with marked reductions in insulin sensitivity.40 Therefore, it is crucial to accurately identify obesity in patients with T2DM. Nowadays, patients with T2DM are usually diagnosed as obese followed the criteria applicable to the general population. But the current cut-offs of BMI and WC to diagnose obesity for general population have not been validated for the population with T2DM. Therefore, the primary objective of our study is to investigate the diagnostic accuracy of the BMI or WC cut-offs (CDS and WHO standard) for identifying general or abdominal obesity in patients with T2DM. We found that if we chose the BMI cut-off recommended by CDS or WHO criterion, respectively, the BMI showed a low sensitivity (men: 22.1%, women: 31.3% followed CDS criterion; men: 8.3%, women: 14.7% followed WHO criterion). There were some obese patients to be missed. The phenomenon might partially be caused by the difference in body composition between diabetes and general population. For T2DM patients, the decreased mass of muscle and bone might lead to weight loss,11 resulting in their BMI to some extent lower. Therefore, the BMI cut-off needed to be lowered for T2DM patients. Additionally, in the age subgroup analysis, our analysis suggested that the diagnostic power of BMI decreased in both genders with increased age. It could be explained by the changes observed in body composition occurring with aging, including the gradual increase in fat mass, the decrease in muscle mass and quality or sarcopenia.25 If we chose the WC cut-off recommended by CDS criterion, a high sensitivity (men: 95.0%; women: 97.4%) and a relative low specificity (men: 63.7%; women: 58.4%) were observed. On contrary, followed the WC cut-off by WHO criterion, a lower sensitivity (men: 37.0%; women: 90.3%) and a higher specificity (men: 98.5%; women: 76.5%) were observed. Additionally, in the age subgroup analysis, the older patients (≥70 years old) had higher diagnostic accuracies of WC to identify abdominal obesity than the younger ones (<50 years old and 50–69 years old) in both genders. It could be explained by the increase of visceral fat with aging.41 And this phenomenon might be caused by the reduced secretion of sex hormones and growth hormones, and the decrease of basal metabolism.41,42 In conclusion, the traditional cut-offs for BMI and WC could not accurately identify obesity for patients with T2DM.
There were very few studies studying the optimal cut-offs of BMI and WC to identify general and abdominal obesity for the patients with T2DM. In our study, the best cut-offs of BMI and WC were selected by the largest Youden index by ROC curves. The optimal cut-off of BMI was round to 25 kg/m2 with the best trade-off between sensitivity and specificity (men: 74.6% and 65.1%, AUC0.78; women: 65.8% and 80.3%, AUC 0.80) in both sexes. And the optimal cut-off of WC was 93 cm in men and 90 cm in women with the best trade-off between sensitivity and specificity (men: 87.2% and 80.2%, AUC 0.91; women: 81.0% and 88.7%, AUC 0.92). In the age subgroup analysis, the optimal BMI mostly decreased in both genders with increased age. Younger Chinese patients with T2DM (<50 years old and 50–69 years old) had higher BMI cut-off than older Chinese patients with T2DM (age ≥70 group). While the optimal cut-off of WC in younger patients (<50 years old and 50–69 years old) was similar to that in older patients (≥70 years old). It suggested age should be taken into consideration when using BMI and WC to indicate obesity.
Our study has the following strengths. First, as far as we know, this study was the first to propose the BMI and WC cut-offs for the diagnosis of obesity in Chinese patients with T2DM. Our work is expected to find more obese patients from T2DM population; Second, the population studied with a relatively large sample size (1539 patients had detailed data of DXA), which ranged from 20 to 85 years, were relatively comprehensive. Several limitations should be mentioned. First, BF% and VFA measured by DXA were set as the gold criteria to identify general and abdominal obesity in our study. Although MRI and CT provide the most accurate measurement of abdominal obesity, the DXA method for measuring VFA has been validated against direct measures using CT26 and MRI27 (with R2 ranging between 0.82 and 0.96). DXA is also used to quantitate the total body fat, and body fat percentage (BF%) is recommended to diagnose general obesity which has been validated in previous studies.21–25 Besides, subjects in our study were selected from a single center. Considering the difference of lifestyles and living standards among the regions in China, our results may not represent the whole population, so the results needed to be verified by a larger sample size from a multicenter population.
Conclusion
In summary, the BMI of 25 kg/m2 in both genders may be the optimal cut-off to diagnose general obesity, and the appropriate cut-off of WC for identifying abdominal obesity is 93 cm for men and 90 cm for women for Chinese type 2 diabetic patients. The diagnostic power of the optimal cut-offs for BMI and WC were superior to that of traditional cut-offs in both genders. In Chinese patients with T2DM, the optimal cut-offs of BMI and WC may improve the early identification and intervention of general and abdominal obesity for reducing obesity-associated complications.
Data Sharing Statement
The datasets used and/or analysed during the current study are available from the corresponding author on reasonable request.
Ethics Approval and Informed Consent
The study protocol was approved by the Ethics Committee of the First Affiliated Hospital of Chongqing Medical University [2018 Scientific Research Ethics (2018-042)]. Written informed consent was obtained from all individual participants included in the study. This study was conducted in accordance with the Declaration of Helsinki. All authors and individual participants provided consent for publication.
Acknowledgments
We thank the Chongqing Medical University for their support towards publishing this article. We also thank the staff and patients of the First Affiliated Hospital of Chongqing Medical University for their contributions during the study. Special thanks to Prof. Bin Peng from Statistics Department of Chongqing Medical University for instruction on the statistical method. We especially thank Shichao Han from the College of Letters and Science, University of California, Berkeley for helping us revise the English language.
Author Contributions
The first draft of the manuscript was written by Qinying Zhao and Xiangjun Chen. All authors made substantial contributions to conception and design, acquisition of data, or analysis and interpretation of data; took part in revising the article for important intellectual content; gave final approval of the version to be published; and agree to be accountable for all aspects of the work.
Funding
This work was supported by the National Natural Science Foundation of China (grant number 81700754); the Technological Innovation and Application Development Project of Chongqing (grant number cstc2019iscx-msxmX0207); Chongqing Science and Health Joint Medical Research Project (grant number 2018GDRC004); High-end Medical Talents of Middle-aged and Young People in Chongqing (yuweiren (2015)49). Bethune Merck diabetes research fund (grant number G2018030).The author reported non-financial interests in this work.
Disclosure
The authors report no conflicts of interest in this work.
References
1. Flegal KM, Graubard BI, Williamson DF, Gail MH. Excess deaths associated with underweight, overweight, and obesity. JAMA. 2005;293(15):1861–1867. doi:10.1001/jama.293.15.1861
2. Gregg EW, Cheng YJ, Cadwell BL, et al. Secular trends in cardiovascular disease risk factors according to body mass index in US adults. JAMA. 2005;293(15):1868–1874. doi:10.1001/jama.293.15.1868
3. Seidell JC, Kahn HS, Williamson DF, Lissner L, Valdez R. Report from a Centers for Disease Control and Prevention Workshop on Use of Adult Anthropometry for Public Health and Primary Health Care. Oxford University Press; 2001.
4. Shaw JE, Sicree RA, Zimmet PZ. Global estimates of the prevalence of diabetes for 2010 and 2030. Diabetes Res Clin Pract. 2010;87(1):4–14. doi:10.1016/j.diabres.2009.10.007
5. Yang W, Lu J, Weng J, et al. Prevalence of diabetes among men and women in China. N Engl J Med. 2010;362(12):1090–1101. doi:10.1056/NEJMoa0908292
6. Xu Y, Wang L, He J, et al. Prevalence and control of diabetes in Chinese adults. JAMA. 2013;310(9):948–959. doi:10.1001/jama.2013.168118
7. Greenberg A, McDaniel M. Identifying the links between obesity, insulin resistance and β‐cell function: potential role of adipocyte‐derived cytokines in the pathogenesis of type 2 diabetes. Eur J Clin Invest. 2002;32(s3):24–34. doi:10.1046/j.1365-2362.32.s3.4.x
8. Dearth-Wesley T, Wang H, Popkin B. Under-and overnutrition dynamics in Chinese children and adults (1991–2004). Eur J Clin Nutr. 2008;62(11):1302–1307. doi:10.1038/sj.ejcn.1602853
9. Heshka S, Ruggiero A, Bray GA, et al. Altered body composition in type 2 diabetes mellitus. Int J Obes. 2008;32(5):780–787. doi:10.1038/sj.ijo.0803802
10. Choi SI, Chung D, Lim JS, et al. Relationship between regional body fat distribution and diabetes mellitus: 2008 to 2010 Korean national health and nutrition examination surveys. Diabetes Metab J. 2017;41(1):51–59. doi:10.4093/dmj.2017.41.1.51
11. Akeroyd JM, Suarez EA, Bartali B, et al. Differences in skeletal and non-skeletal factors in a diverse sample of men with and without type 2 diabetes mellitus. J Diabetes Complications. 2014;28(5):679–683. doi:10.1016/j.jdiacomp.2014.05.007
12. Park SW, Goodpaster BH, Lee JS, et al. Excessive loss of skeletal muscle mass in older adults with type 2 diabetes. Diabetes Care. 2009;32(11):1993–1997. doi:10.2337/dc09-0264
13. Flegal KM, Carroll MD, Ogden CL, Johnson CL. Prevalence and trends in obesity among US adults, 1999–2000. JAMA. 2002;288(14):1723–1727. doi:10.1001/jama.288.14.1723
14. Cowie C, Rust K, Holt DB, Eberhardt M. Prevalence of diabetes and impaired fasting glucose in adults-United States, 1999–2000. MMWR Morb Mortal Wkly Rep. 2003;52(35):833.
15. Wilson PW, D’Agostino RB, Sullivan L, Parise H, Kannel WB. Overweight and obesity as determinants of cardiovascular risk: the Framingham experience. Arch Intern Med. 2002;162(16):1867–1872. doi:10.1001/archinte.162.16.1867
16. Expert Panel on Detection E. Executive summary of the third report of the National Cholesterol Education Program (NCEP) expert panel on detection, evaluation, and treatment of high blood cholesterol in adults (Adult treatment panel III). JAMA. 2001;285(19):2486. doi:10.1001/jama.285.19.2486
17. Janssen I, Katzmarzyk PT, Ross R. Waist circumference and not body mass index explains obesity-related health risk. Am J Clin Nutr. 2004;79(3):379–384. doi:10.1093/ajcn/79.3.379
18. Fujioka S, Matsuzawa Y, Tokunaga K, Tarui S. Contribution of intra-abdominal fat accumulation to the impairment of glucose and lipid metabolism in human obesity. Metab Clin Exp. 1987;36(1):54–59. doi:10.1016/0026-0495(87)90063-1
19. Nordström A, Hadrévi J, Olsson T, Franks PW, Nordström P. Higher prevalence of type 2 diabetes in men than in women is associated with differences in visceral fat mass. J Clin Endocrinol Metab. 2016;101(10):3740–3746. doi:10.1210/jc.2016-1915
20. Alberti KGMM, Zimmet P, Shaw J. Metabolic syndrome—a new world‐wide definition. A consensus statement from the international diabetes federation. Diabet Med. 2006;23(5):469–480. doi:10.1111/j.1464-5491.2006.01858.x
21. Batsis JA, Sahakyan KR, Rodriguez-Escudero JP, Bartels SJ, Somers VK, Lopez-Jimenez F. Normal weight obesity and mortality in United States subjects≥ 60 years of age (from the third national health and nutrition examination survey). Am J Cardiol. 2013;112(10):1592–1598. doi:10.1016/j.amjcard.2013.07.014
22. Romero-Corral A, Somers VK, Sierra-Johnson J, et al. Accuracy of body mass index in diagnosing obesity in the adult general population. Int J Obes. 2008;32(6):959–966. doi:10.1038/ijo.2008.11
23. Romero-Corral A, Somers VK, Sierra-Johnson J, et al. Diagnostic performance of body mass index to detect obesity in patients with coronary artery disease. Eur Heart J. 2007;28(17):2087–2093. doi:10.1093/eurheartj/ehm243
24. Phillips CM, Tierney AC, Perez‐Martinez P, et al. Obesity and body fat classification in the metabolic syndrome: impact on cardiometabolic risk metabotype. Obesity. 2013;21(1):E154–E161. doi:10.1002/oby.20263
25. Batsis JA, Mackenzie TA, Bartels SJ, Sahakyan KR, Somers VK, Lopez-Jimenez F. Diagnostic accuracy of body mass index to identify obesity in older adults: NHANES 1999–2004. Int J Obes. 2016;40(5):761–767. doi:10.1038/ijo.2015.243
26. Kaul S, Rothney MP, Peters DM, et al. Dual‐energy X‐ray absorptiometry for quantification of visceral fat. Obesity. 2012;20(6):1313–1318. doi:10.1038/oby.2011.393
27. Neeland IJ, Grundy SM, Li X, Adams-Huet B, Vega GL. Comparison of visceral fat mass measurement by dual-X-ray absorptiometry and magnetic resonance imaging in a multiethnic cohort: the dallas heart study. Nutr Diabetes. 2016;6(7):e221–e221. doi:10.1038/nutd.2016.28
28. Organization WH. Definition, Diagnosis and Classification of Diabetes Mellitus and Its Complications: Report of a WHO Consultation. Part 1, Diagnosis and Classification of Diabetes Mellitus. Geneva: World health organization; 1999.
29. Ma Y-C, Zuo L, Chen J-H, et al. Modified glomerular filtration rate estimating equation for Chinese patients with chronic kidney disease. J Am Soc Nephrol. 2006;17(10):2937–2944. doi:10.1681/ASN.2006040368
30. Micklesfield LK, Goedecke JH, Punyanitya M, Wilson KE, Kelly TL. Dual‐energy X‐ray performs as well as clinical computed tomography for the measurement of visceral fat. Obesity. 2012;20(5):1109–1114. doi:10.1038/oby.2011.367
31. Goldberg EK, Fung EB. Precision of the hologic DXA in the assessment of visceral adipose tissue. J Clin Densitom. 2019. doi:10.1016/j.jocd.2019.03.005
32. Kanran W, Xiaoqi Y, Yue W, et al. Correlation between body compositions and diabetic microvascular complications in type 2 diabetic patients. Chin J Diabetes Mellitus. 2018;10(4).
33. Dickey RA, Bartuska D, Bray GW, et al. AACE/ACE position statement on the prevention, diagnosis, and treatment of obesity (1998 revision). Endocr Pract. 1998;4(5):297–350.
34. Organization WH. Physical Status: The Use of and Interpretation of Anthropometry, Report of a WHO Expert Committee. 1995.
35. Li L, Wang C, Bao Y, Peng L, Gu H, Jia W. Optimal body fat percentage cut‐offs for obesity in Chinese adults. Clin Exp Pharmacol Physiol. 2012;39(4):393–398. doi:10.1111/j.1440-1681.2012.05684.x
36. Japan ECoCfODi. New criteria for’obesity disease’in Japan. Circ J. 2002;66(11):987. doi:10.1253/circj.66.987
37. Brown JC, Harhay MO, Harhay MN. Anthropometrically‐predicted visceral adipose tissue and mortality among men and women in the third national health and nutrition examination survey (NHANES III). Am J Hum Biol. 2017;29(1):e22898. doi:10.1002/ajhb.22898
38. Society MsscgoCd. Suggestions about metabolic syndrome of Chinese diabetes society. Chin J Diab. 2004;12:156–161.
39. Yan LL, Daviglus ML, Liu K, et al. Midlife body mass index and hospitalization and mortality in older age. JAMA. 2006;295(2):190–198. doi:10.1001/jama.295.2.190
40. Caro JF. Clinical review 26: insulin resistance in obese and nonobese man. J Clin Endocrinol Metab. 1991;73(4):691–695. doi:10.1210/jcem-73-4-691
41. Ze Y, Hong Z, Pulin Y, et al. Obesity in 12 regions in 1997–1998. Chin J Geriatrics. 2003;22(3):176–179.
42. Vermeulen A, Goemaere S, Kaufman J. Testosterone, body composition and aging. J Endocrinol Invest. 1999;22(5 Suppl):110–116.
 © 2020 The Author(s). This work is published and licensed by Dove Medical Press Limited. The full terms of this license are available at https://www.dovepress.com/terms.php and incorporate the Creative Commons Attribution - Non Commercial (unported, v3.0) License.
By accessing the work you hereby accept the Terms. Non-commercial uses of the work are permitted without any further permission from Dove Medical Press Limited, provided the work is properly attributed. For permission for commercial use of this work, please see paragraphs 4.2 and 5 of our Terms.
© 2020 The Author(s). This work is published and licensed by Dove Medical Press Limited. The full terms of this license are available at https://www.dovepress.com/terms.php and incorporate the Creative Commons Attribution - Non Commercial (unported, v3.0) License.
By accessing the work you hereby accept the Terms. Non-commercial uses of the work are permitted without any further permission from Dove Medical Press Limited, provided the work is properly attributed. For permission for commercial use of this work, please see paragraphs 4.2 and 5 of our Terms.