")
Back to Journals » Breast Cancer: Targets and Therapy » Volume 7
Optical imaging for breast cancer prescreening
Authors Godavarty A, Rodriguez S, Jung Y, Gonzalez S
Received 1 December 2014
Accepted for publication 21 January 2015
Published 20 July 2015 Volume 2015:7 Pages 193—209
DOI https://doi.org/10.2147/BCTT.S51702
Checked for plagiarism Yes
Review by Single anonymous peer review
Peer reviewer comments 3
Editor who approved publication: Professor Pranela Rameshwar

Anuradha Godavarty,1 Suset Rodriguez,1 Young-Jin Jung,2 Stephanie Gonzalez1
1Optical Imaging Laboratory, Department of Biomedical Engineering, Florida International University, Miami, FL, USA; 2Department of Radiological Science, Dongseo University, Busan, South Korea
Abstract: Breast cancer prescreening is carried out prior to the gold standard screening using X-ray mammography and/or ultrasound. Prescreening is typically carried out using clinical breast examination (CBE) or self-breast examinations (SBEs). Since CBE and SBE have high false-positive rates, there is a need for a low-cost, noninvasive, non-radiative, and portable imaging modality that can be used as a prescreening tool to complement CBE/SBE. This review focuses on the various hand-held optical imaging devices that have been developed and applied toward early-stage breast cancer detection or as a prescreening tool via phantom, in vivo, and breast cancer imaging studies. Apart from the various optical devices developed by different research groups, a wide-field fiber-free near-infrared optical scanner has been developed for transillumination-based breast imaging in our Optical Imaging Laboratory. Preliminary in vivo studies on normal breast tissues, with absorption-contrasted targets placed in the intramammary fold, detected targets as deep as 8.8 cm. Future work involves in vivo imaging studies on breast cancer subjects and comparison with the gold standard X-ray mammography approach.
Keywords: diffuse optical imaging, near-infrared, hand-held devices, breast cancer, prescreening, early detection
Introduction: breast cancer statistics
One in eight women in the USA is at the risk of developing breast cancer.1 In 2013, approximately 232,340 new cases of invasive breast cancer developed.1 Annually, 1.3 million new cases of breast cancer are diagnosed worldwide,2 and 1.38 million new cases developed in 2011 worldwide.3 Half of the breast cancer cases occur in economically developing countries.3 Since 1990, death rates related to breast cancer have dropped by 34%.1 About 60% of breast cancer deaths occur in economically developing countries.3 Mortality has seen a decrease in developed countries due to earlier diagnosis and greater treatment options.2
American Cancer Society has set guidelines for detecting breast cancer in women aged 40 and older, which include an annual mammogram, an annual clinical breast examination (CBE), and an optional self-breast examination (SBE).1 Details of these various examinations are described in the “Different modalities used to image breast cancer” section. Prior to the description of the different examination or imaging tools used in breast cancer, the physiology and stages of breast cancer are described in the following section.
Breast cancer stages and imaging
The disease of breast cancer occurs when there are malignant cancer cells in the breast tissue.4 The causes of breast cancer are either external or internal. External causes include tobacco, chemicals, radiation, and infectious organisms. Internal factors are mutations that are inherited as well as those that occur from metabolism, hormones, and immune conditions. Combinations of external and internal factors may lead to the initiation or promotion of breast cancer. It may take as long as 10 years of experiencing external factors before the cancer is detected.5
Stages of breast cancer
The different stages of detecting breast cancer are screening, diagnosis, and prognosis. Screening is performing exams on individuals who do not show symptoms of breast cancer in order to determine whether there is cancer. Screening helps to detect the cancer early before symptoms manifest and prior to spreading to other tissues. Common modalities used in breast cancer screening are SBEs, CBE, and mammograms.
Having screened for breast cancer, further diagnostic tests are performed to confirm the disease and also to determine if the tumor(s) observed is benign or malignant. Being diagnosed with breast cancer, the patient then requires other tests to determine the prognosis and decide on treatment options. Some of these tests include estrogen and progesterone receptor test, human epidermal growth factor type 2 receptor test, and multigene tests. Some of the imaging techniques used in the diagnostic stage are ultrasonography and magnetic resonance imaging (MRI).6 These tests give specific information to help identify the stage of the tumor and whether it is growing rapidly or slowly. Staging is then performed in order to classify the cancer into a stage ranging from zero to four, with four being the most advanced. Some imaging modalities used throughout this stage are chest X-rays, computerized tomography (CT) scans, and bone scans.4
After being diagnosed, the patient may undergo neoadjuvant therapy or primary therapy. Neoadjuvant therapy is a means to decrease tumor size if the tumor is too large to successfully remove. Primary therapy follows neoadjuvant therapy or may be the first step taken after diagnosis. It typically consists of surgery, more specifically mastectomies or lumpectomies, to remove the tumor. Following primary therapy, there is an adjuvant therapy which aims to prevent the recurrence of the cancer and promote longevity of the patient.7 Post-adjuvant therapy patients require periodic monitoring to ascertain that they are tumor free. The prognostic stage is monitoring using imaging modalities that include mammograms, breast MRI, ultrasound (US), positron emission tomography (PET), and/or CT scans.8
Different modalities used to image breast cancer
The conventional prescreening/screening imaging modalities, along with the emerging imaging modalities for breast cancer, are given in Table 1.9–48,50
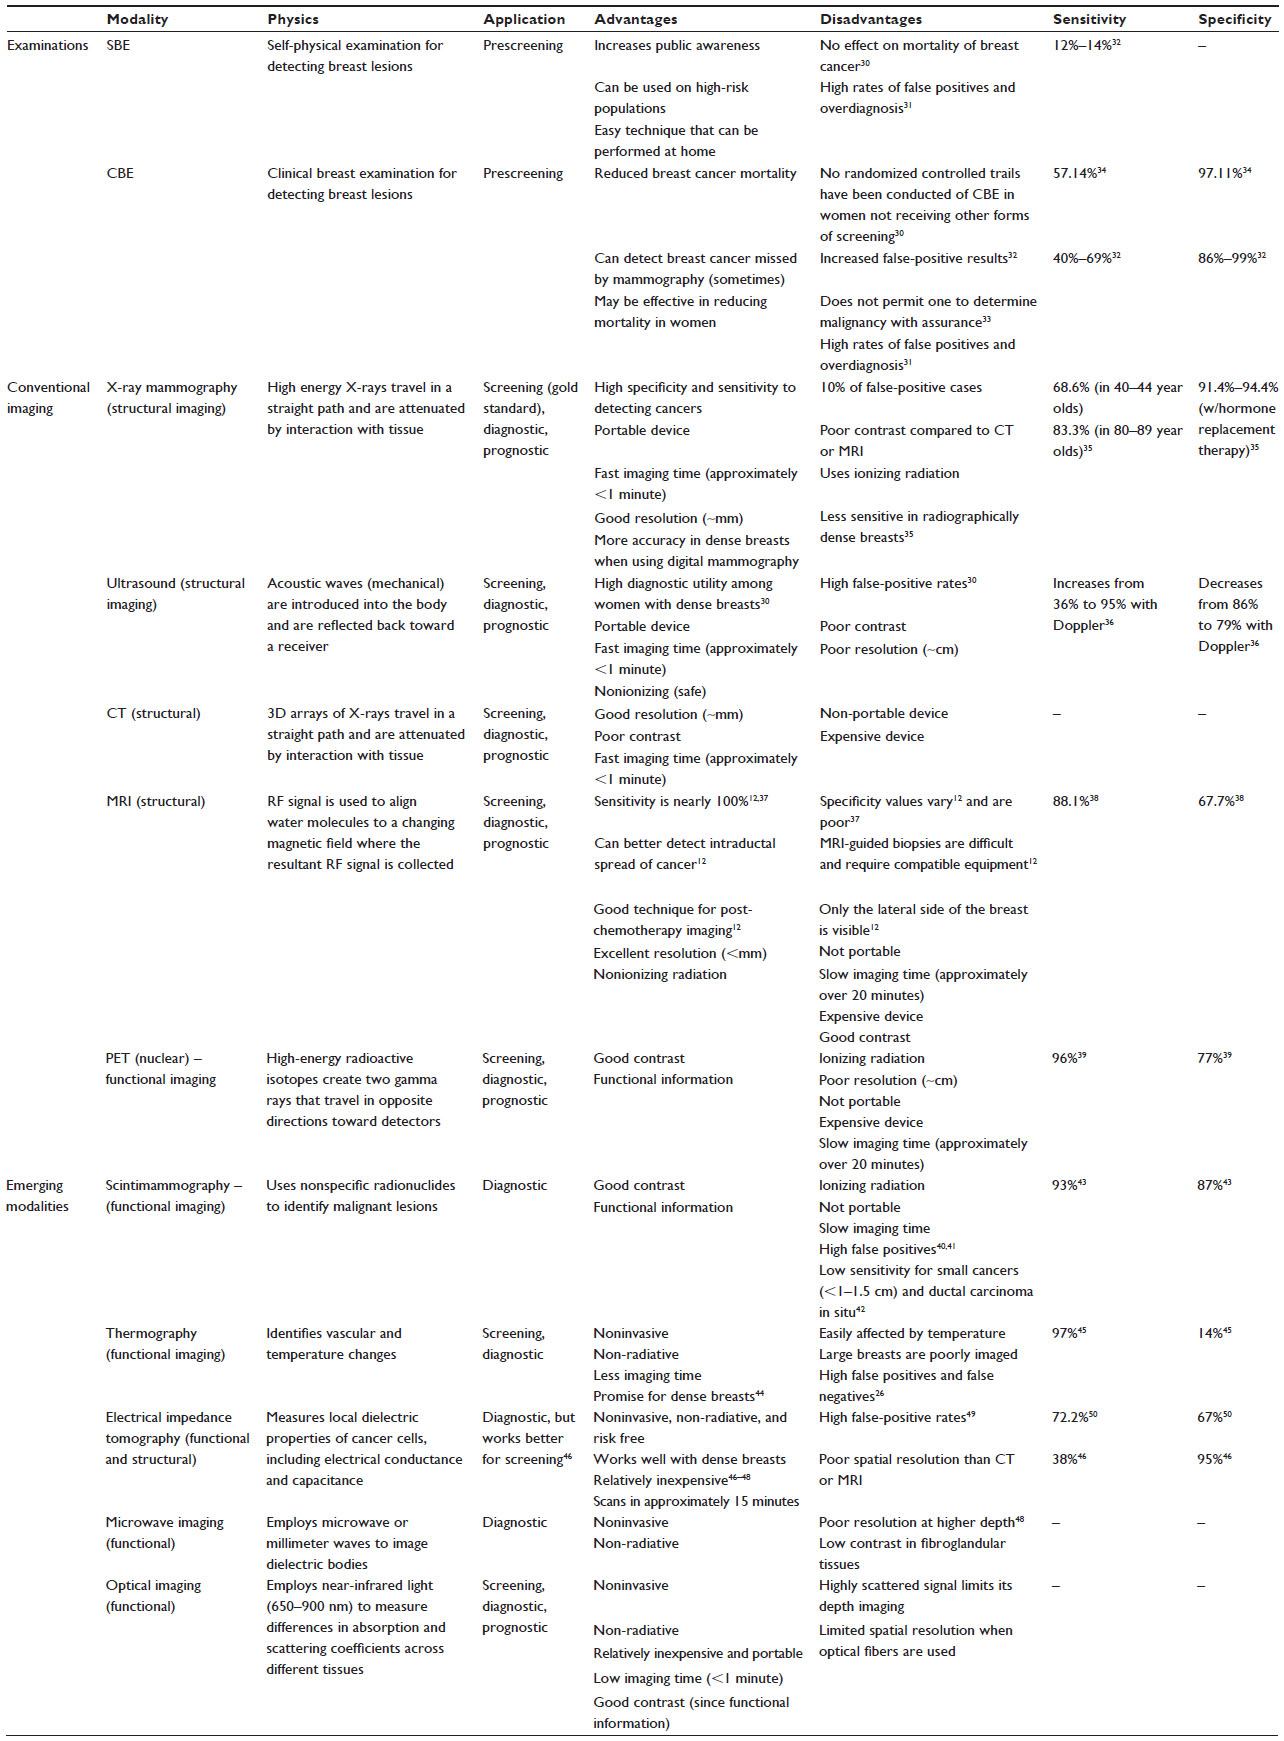 | Table 1 Conventional breast cancer prescreening/screening and emerging imaging modalities |
SBE and CBE
Breast cancer prescreening is carried out prior to the gold standard screening using X-ray mammography and/or US. Prescreening is typically carried out using CBE or SBEs. CBE is carried out by the physician for early detection of skin irregularities9 or abnormalities in the breast tissue. Breast self-examination is carried out by women to increase public awareness and to become familiar with appearance and feel of their breasts.9,10 Approximately two thirds of women older than 40 years undergo periodic CBE. However, there exists minimal evidence to measure the effectiveness of CBE in detecting breast cancer. The advantage of SBE is that the patients can become familiar with their anatomy and perform the screening modality in a private setting at home. While CBE demonstrated a maximum sensitivity of 40%–69%, SBE had a low sensitivity of 12%–14%.32 Furthermore, it has been shown in randomized control trial that SBE has no positive effect compared to not performing it and that it actually leads to false positives. In general, both CBE and SBE have high false-positive rates and overdiagnose, that there is a need for an objective imaging modality at the prescreening stage.
X-ray mammography
Breast cancer screening involves screen-film and digital mammography, computer-aided detection, US, and MRI. Screen-film mammography involves using X-rays to obtain images that are captured on a film, while digital mammography captures the X-rays through digital means which can then be read on a printed film or electronically on a computer. Digital mammograms are convenient to the radiologist interpreting the X-ray by allowing him/her to change the values of brightness, contrast, and magnification; however, they are at a greater price to the patients. Studies have demonstrated screen-film mammography to have a higher sensitivity than that of digital film mammography. Although computer-aided detection is supported by a small amount of data, it can locate lesions, such as calcifications, on mammograms, thereby increasing the amount of cancer detected as well as increasing the accuracy of radiologists.11 In general, mammography reduces the risk of dying from breast cancer by 15%–20%, which can lead to a greater number of treatment options.9 The advanced applications of digital mammography include tomosynthesis and contrast-enhanced digital mammography. In tomosynthesis, multiple digital X-ray images are obtained at multiple angles of the X-ray tube in order to yield 3D images or individual slices in dynamic cine.12–14 In contrast-enhanced digital mammography, a contrast agent (generally iodine based) is injected intravenously, and multiple X-ray images are obtained with a high contrast-to-noise ratio, which in turn reduce the visibility of microcalcifications.15,16
Magnetic resonance imaging
Not commonly used for screening but more so for diagnosing, MRI uses a combination of a magnetic field, radio waves, and computer processing in order to create images. Occasionally, it is used for screening young women with known increased risk of breast cancer due to gene mutations when mammograms are not ideal. A study has also shown that using MRI in the screening stage leads to unnecessary biopsies and further examinations when compared to mammography screening.11 The disadvantages of using MRI is its high cost of about ten times the cost of a mammogram, its low specificity relative to mammograms, the need for contrast agents (in some cases), and the long amount of time required to image a patient, especially exacerbated by a patient with low tolerance to enclosed spaces.11 The advanced applications of MRI for breast cancer imaging include diffusion and perfusion imaging, proton magnetic resonance spectroscopy (MRS), and MR elastography. While the diffusion perfusion imaging offers information related to tissue microstructure from focusing on water protons, perfusion imaging follows the flow of blood to show the microvasculature.17 Proton MRS measures the resonance of protons to provide a spectrum in order to identify choline, a biomarker for cancer. In MR elastography, electromechanical drivers vibrate the breast to generate acoustic shear waves that are further imaged by MRI.12
Ultrasounds
USs have recently been approved by the Food and Drug Administration to aid in screening of breast cancer in patients with dense breast tissue, apart from its application as a diagnostic imaging tool. US employs sound waves to create images of the tissue features.18 The advantages of US are that it can differentiate benign and malignant masses as well as cysts and solid masses. The main drawback is that its effectiveness varies depending on the skill of the US technician. US also has a greater amount of false positives compared to mammography, up to 12.9% compared to 6%, respectively.11 In the clinic, the most common mode of US imaging is to obtain 2D images from B-mode scanning. In certain cases, compound imaging is carried out by combining multiple US images into one. Although compound imaging is better in quality than B-mode imaging, it suppresses the shadows that can be used to determine malignancy.12 On the other hand, Doppler US uses the Doppler effect to track blood flow in order to find malignant tumors through their neoangiogenesis.19,20 The advanced applications of US imaging at preclinical stage include sonoelastography (SE), tissue harmonic imaging, and US spiral computed tomography. While in SE, US images of the breast are obtained during its displacement, frequencies are filtered appropriately in tissue harmonic imaging in order to improve the contrast. US spiral CT is a combination of US and CT imaging used to obtain volumetric 3D images of the breast, although it can miss tumors located proximal to the chest wall.21
Nuclear imaging
Nuclear imaging yields functional images based on molecular properties, unlike the anatomical images as in X-ray, US, and MRI. Also, this technique involves radiation and is expensive, requires little or no breast compression, and shows promise in detecting cancer, especially in high-risk patients.12 In radio-immunoscintigraphy, tumor-associated antigens are targeted by an injected radiopharmaceutical agent, with antigen expression differing between normal and cancer cells. Scintimammography (SMM) is an imaging technique used in the diagnostic phase. It uses nonspecific radionuclides to identify malignant lesions. Usually, it follows a mammogram and identifies the lesions found in the mammogram. It is also a useful postprimary and post-adjuvant therapy because it identifies tumor changes and recurrence as well as necrosis in the specific area.22 SMM has higher specificity than MRI, which makes it clinically applicable to detect lesions larger than 1 cm in diameter. PET, generally using 18F-fluorodeoxyglucose, uses glucose metabolism to detect cancer, especially in detection of malignancies and metastatic disease in solid organ tumors.12 The advanced applications of nuclear breast imaging include positron emission mammography (PEM) and PET/CT. PEM focuses on imaging only the breast tissues unlike the entire body as in PET imaging, and serves as the best screening tool in high-risk patients.23 PET/CT is a multimodal imaging approach that combines PET (for functional information) and CT (for anatomical information).24
Emerging modalities (experimental stage)
Some of the emerging technologies for breast cancer imaging include thermography, microwave imaging, electrical impedance imaging spectroscopy (EIS), Raman spectroscopy, and diffuse optical imaging (DOI).
Thermography is another imaging technique used in the diagnostic phase. It identifies vascular and temperature changes noninvasively and without radiation.25 A study performed by Sterns et al has proven this modality to result in a large amount of false positives and false negatives. The study also reported inconsistent interpretation of the thermograph.26 Another study states thermograph findings to be more evident of the metabolic rate and expansion state as opposed to its actual size and depth. The advantage of demonstrating metabolic and growth rate is that a prediction can be made that determines risk of the patient. For instance, one study reports that 38% of false-positive patients develop breast cancer within 4 years.10
EIS is also used in the diagnostic phase of breast cancer. This modality measures local dielectric properties of cancer cells, including electrical conductance and capacitance. This is performed by applying current to the patient with varying frequency, current, flow, and voltage. The values gained from cancer cells are different than those of normal cells. A study performed by Malich et al shows a sensitivity of 80.5% and a specificity of 64.7%. The features in the patient’s anatomy, such as scars, hairs, and bone, can result in false positives. A high amount of false positives along with an effectiveness that varies with the conductor of the EIS results in limited clinical use.27 In a review article by Vreugdenburg et al, it was found that only one study used EIS for screening, whereas the other studies focused on women with already diagnosed breast cancer. The study focusing on screening did not use a valid reference test to ascertain if the patients were healthy or had cancer. The study did not recommend the use of EIS for screening due to lack of data regarding the ability of EIS to detect cancer in asymptomatic women.28
Microwave imaging employs microwave or millimeter waves to image dielectric bodies.29 This modality offers low contrast between healthy fibroglandular tissues, where the majority of breast tumors occur, and malignant tumors pose as a challenge for microwave imaging of the breast tissue. The challenges of high tissue attenuation resulting in limited depth of wave penetration, and loss of resolution with higher penetration depth limit its immediate clinical translation for breast cancer.
The various other emerging modalities (not described here) include DOI, Raman spectroscopy, diffraction techniques (eg, diffraction-enhanced imaging and small angle X-ray scattering), compression and palpation method (via piezoelectric sensing), X-ray diffraction of hair, breath detection using gas chromatography and mass spectroscopy, and canine scent detection.12
DOI: physics and breast cancer application
In the past three decades, DOI is emerging as a breast cancer imaging device with applicability at both diagnostic and prognostic stages of breast cancer imaging. DOI uses near-infrared (NIR) light between 650 nm and 900 nm to image the differences in the blood oxygenations between the tumor and normal breast tissues. Based on the nature of the optical imaging instrument, its applicability for early-stage breast cancer detection is also attempted by various research groups, as described in the following sections.
Wavelengths of light from 650 nm to 900 nm are minimally absorbed and preferentially scattered upon interaction with tissue allowing for deeper light penetration than possible at other optical wavelengths (Figure 1).51 The technology that uses light in this NIR wavelength region to noninvasively image deep tissues is called as NIR optical imaging (or DOI). The low absorption occurs due to the main absorbers in physiological tissue, that is, water and oxy- and deoxy-hemoglobin, which absorb less light than at other optical wavelengths.52 The difference in optical properties (ie, absorption and scattering of the light) between normal and diseased tissues is used to characterize tissues and detect abnormalities.
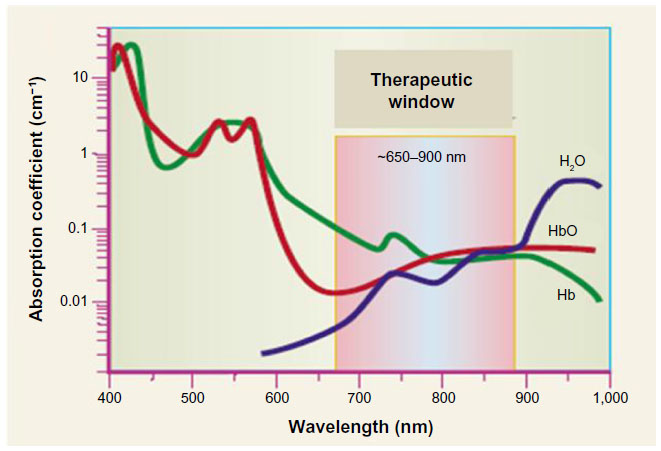 | Figure 1 Spectrum of absorption from 400 nm to 1,000 nm. |
Deeper tissue penetration allows optical imaging to be implemented as an imaging technology for breast cancer detection, diagnosis, and/or prognosis. Optical imaging provides a functional imaging approach with decent spatial resolution and contrast. Optical imaging also requires less imaging time compared to MRI, and is also less expensive. The combination of benefits offered by optical imaging in terms of less imaging time (<1 minute), good spatial and excellent temporal resolution, good contrast (from functional imaging), and relatively inexpensive instrumentation suggests that optical imaging is potentially an emerging technology for future clinical applications in the areas of breast cancer imaging, brain mapping, and any noninvasive body tissue imaging. Additionally, the source powers employed during optical imaging are within the safe limits (typically <50 mW), and NIR light is non-radiative in nature.
Optical imaging and breast cancer
Optical imaging has been utilized toward various aspects of clinical breast imaging: i) measurement of optical and physiological properties of healthy breast tissue; ii) detecting the presence of abnormal tissue (ie, tumors); iii) distinguishing between benign and malignant tumors; iv) monitoring response to neoadjuvant chemotherapy; v) sentinel lymph node mapping; and vi) tomographic imaging of the entire breast.54 These breast imaging applications in some cases involved the use of external fluorescent contrast agents to improve the optical contrast of the diseased regions from the normal breast tissue.55,56
Optical imaging uses NIR light as a continuous-wave (CW), frequency (frequency domain, FD), or pulse (time domain) signals. In CW imaging, the source light intensity remains constant in time and attenuates as it propagates through the tissue due to absorption and (indirectly) to scattering. FD imaging uses time-dependent intensity-modulated light that becomes attenuated and phase shifted as it propagates through the tissue. Time-domain imaging uses time-dependent (pico- or nanosecond) pulses of light that broaden and attenuate as it propagates through the tissue. Different types of optical devices developed for breast cancer detection employing one or more of these measurement techniques have been developed toward DOI of breast tissue. The most commonly employed sources in these devices include laser diodes and light-emitting diodes (LEDs), and the detectors being silicon photodiodes, photon multiplier tubes, avalanche photo diodes, or CCD cameras. The optical devices using one of these sources/detectors can be grouped into three major kinds of devices: bed-based imagers, parallel plate imagers, and hand-held imagers. The hand-held imagers54,57–94 are capable of only reflectance imaging, while parallel and bed-based imagers are capable of transillumination and reflectance imaging. Hand-held imagers are generally smaller, less expensive, and portable devices which have the benefit of being placed easily by a technician. The small device ensures that all breast shapes and sizes can be imaged with minimal patient discomfort and lack of tissue compression. Bed-based imagers95–105 are a category of imagers which require a subject to lie down and suspend the breast tissue to be imaged in special imaging bins or enclosures, which facilitate data collection and 3D tomographic imaging. Parallel plate imagers106–112 are similar to bed-based imagers, but instead of relying on circular bins, they implement compressive plates similar to X-ray mammography systems. This reduces the exclusion of subjects by reducing their tissue thickness via compression. While the focus of the bed-based and parallel plate imagers has been predominantly for 3D tomographic imaging of breast cancer, the hand-held optical devices have focused on spectroscopic information of the breast at both the diagnostic and prognostic stages.
In general, optical breast imaging in the clinic has not been systematic, and various research groups have focused on technological developments of their devices.56 When focusing only on clinically oriented optical mammography studies with approximately 2,000 women, it was observed that ~85% of breast lesions are detectable.56 Additional dimensionality to the optical mammography is provided by integrating and co-registering the functional information of diffuse optical spectroscopy and imaging with X-ray mammography and MRI, which provide structural information or vascular flow information, respectively. One of the goals of the optical breast imaging research community is to develop DOI platforms that can be used as stand-alone devices or in conjunction with MRI, mammography, or US. These platforms would potentially assist in detecting the breast cancer disease in mammographically dense tissues, distinguishing between malignant and benign lesions, and understanding the impact of neoadjuvant chemotherapies. More recently, hand-held optical devices are developed with a focus on early-stage detection of breast cancer as a first-response device.
Optical imaging for breast prescreening
Role of optical imaging in breast prescreening
Prescreening of the breast typically involves: i) breast self-examination – a recommendation for all women to become familiar with both appearance and feel of their breasts and report any changes to their physician; and ii) CBE – an examination performed by a clinician in which he/she utilizes the pads of the fingers to feel the breasts, assessing the shape, texture, and the presence of any bumps. Conventionally and clinically used screening approaches include mammography, US, and MRI,11 as described in the Introduction section. Optical imaging is an emerging prescreening or screening tool in the area of breast cancer.113
Various research groups have developed hand-held optical devices (or scanners) for breast cancer imaging,54,57 for detection, diagnosis, and/or prognosis. The optical devices that focus on early detection (for potential prescreening) of breast cancer are tabulated in Table 2 and shown in Figure 2. The concept of developing portable, low-cost, hand-held optical devices for early-stage detection of breast cancer began in the late 1990s64 by Tromberg’s research group. Tromberg’s device (Device #1) employed laser diodes (of multiple wavelengths) and avalanche photodiodes (as detectors) to obtain FD-based optical spectroscopic information from breast tissues and compare the optical properties of a normal breast with that of the benign lesions. Device #1 (Table 1) was also used in several studies (for a total of ~100 subjects) to compare healthy and tumor-containing breast tissue.71,72,75 The results showed differences in the optical properties of the tissue based on subject age, tumor size, and tumor pathology. The second device (Device #2) developed by researchers at University of California Irvine was also based on FD diffuse optical spectroscopic imaging using laser diodes (at multiple wavelengths) and avalanche photodiodes. Based on the measured differences in the absorption coefficients between the diseased (ie, tumor) and normal breast tissue, the device detected the presence of a lesion in in vivo human breast tissue.77–79 The only other FD-based optical device (Device #6) was that developed by Zhu and her group at University of Connecticut.61,87,114 Unlike other hand-held optical devices, Zhu’s device performed multimodal optical and US imaging to obtain 3D diffuse optical tomographic imaging of the breast. This device imaged the benign and malignant breast lesions in human subjects.
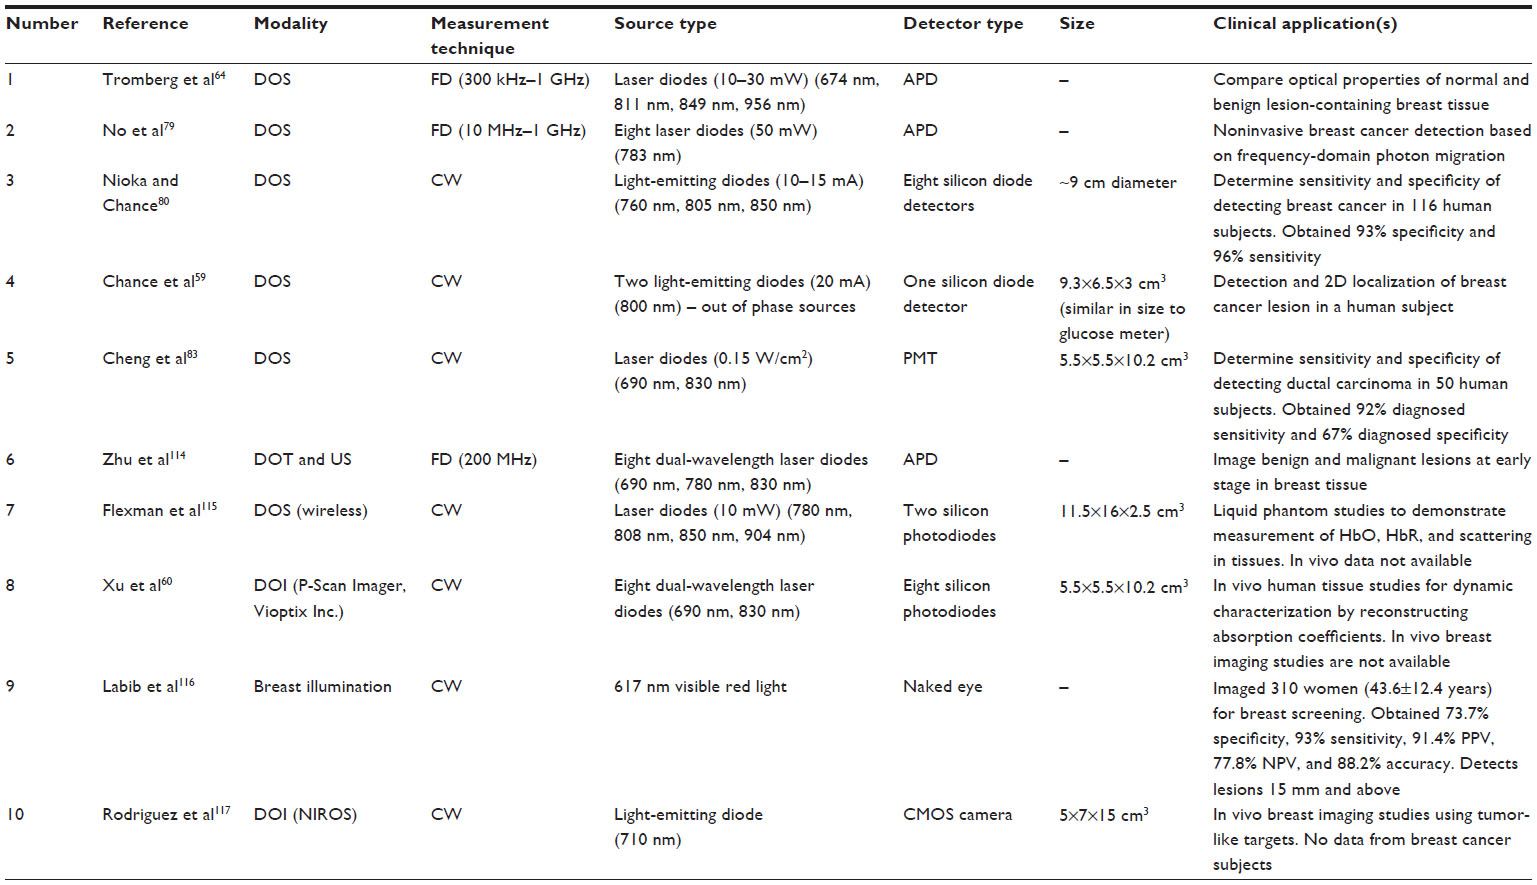 | Table 2 Optical imaging devices developed for prescreening or early-stage breast cancer imaging |
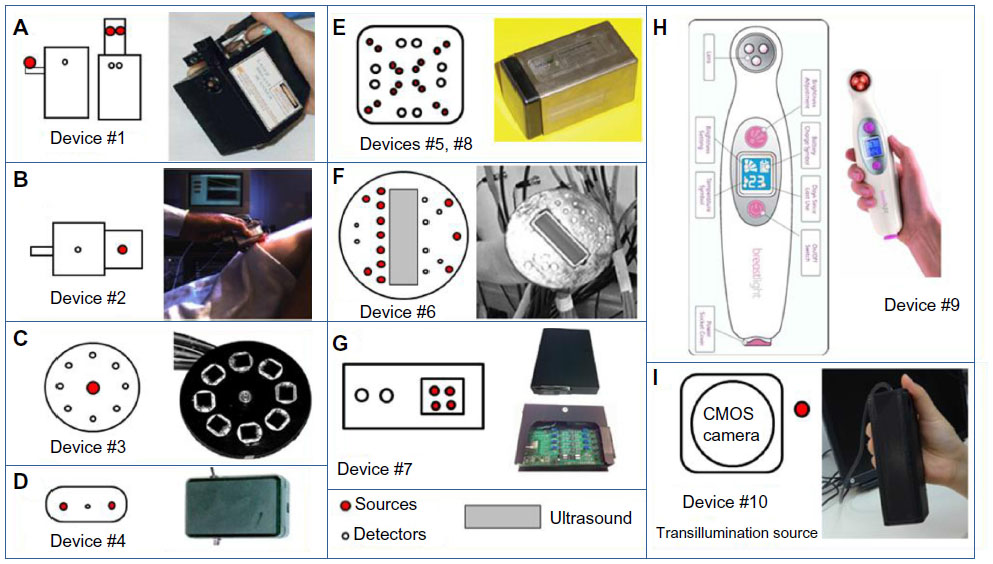 | Figure 2 Different hand-held probes developed for early detection of breast cancer, showing their source–detector layouts and the actual device. |
Many hand-held optical devices (Devices #3–5, #7–10) were based on CW imaging mode. Chance and his group developed two portable devices (Devices #3 and #4) of different source–detector configurations and each using LEDs as sources and silicon photodiodes as detectors.59,80 Device #3 was used in an extensive study to show the differences in the biochemical and physiological properties of breast tissue containing growing cancers, compared to corresponding normal tissue in the contralateral breast.80 In a 6-year study on 116 patients with 44 confirmed malignancies, they reported the ability to distinguish cancerous from noncancerous breast tissue with a sensitivity of 96% and specificity of 93%. The second device from Chance’s group (Device #4) employed two LEDs that were out of phase in order to generate destructive interference signals.59 The detected signal at the detector placed mid-way between the two sources provided a null signal, which shifts in the presence of any abnormality. This principle was used in detection and 2D localization of any breast lesions/abnormalities.59 Another spectroscopic-based hand-held device (Device #5 in Table 2), which used laser diodes as sources, was used to detect breast cancer in 50 females who have been indicated of suspected breast cancer from X-ray mammography.83 The device used in these studies (Device #5, P-Scan Imager) was developed by Vioptix Inc. as a CW-based NIR spectroscopic device that provides real-time 2D mapping of blood oxygen saturation and total hemoglobin. From their preliminary studies, the device provided 92% diagnostic sensitivity and 67% diagnostic specificity in detecting ductal carcinoma.83 Another research group from Ohio State University, Xu et al, also used the same P-Scan imager (Device #8 in Table 2) for phantom and in vivo human subject studies to dynamically characterize the tissue in response to dynamic compression stimuli.60 The device demonstrated that it can detect tissue optical, mechanical, and physiological changes under the dynamic loading condition, although requiring further evaluation for breast cancer studies. One of the latest devices employing laser diodes as sources was made wireless.115 However, to date, only liquid phantom studies using Device #7 were performed to demonstrate the measurements of HbO, HbR, and scattering properties of the tissue.
On the contrary to the NIR-based hand-held devices, a breast illuminator employed visible red light (617 nm wavelength) to transmit the breast tissues and visualize the optical contrast using the naked eye.116 In a study at the National Cancer Institute at Cairo University, BreastLight (Device #9) was employed on 310 women, and the results were compared to X-ray mammography and histopathology (when suspicious cases were found in mammography). Breast illumination using BreastLight device and X-ray mammography were concordant in 277/310 cases (89.4%). The breast illumination device provided a sensitivity of 93%, specificity of 73.7%, a positive predictive value of 91.4%, and a negative predictive value of 77.8%, demonstrating the device as a potential breast cancer prescreening tool.
At our Optical Imaging Laboratory at Florida International University, a portable hand-held wide-field NIR optical scanner (NIROS) (Device #10) was developed for DOI of breast tissues via transillumination mode of imaging.117 The details of this device and the preliminary in vivo studies are described in the following section.
Our ongoing efforts in breast prescreening using optical imaging
Most of the hand-held optical imagers available to date, whether for prescreening/screening or diagnostic/prognostic applications, employ optical fibers to illuminate/detect NIR signals. The use of optical fibers allows precise launching and collection of NIR optical signals at point locations on the tissue surface. The intensity and location of these source and detector points using optical fibers when measured allow 3D tomographic imaging. However, the use of optical fibers can also be disadvantageous. Many optical fibers or fiber bundles are required to enhance the spatial resolution of the imaging system, but at the cost of increased bulkiness, reduced flexibility (especially in hand-held devices), and instrumentation expense. In recent years, a few research groups have developed fiber-free NIR imaging systems using wide-field detectors (eg, CCD or complementary metal oxide semiconductor [CMOS] camera) for noncontact imaging.118–137 These imagers employ either reflectance or transmittance mode to image tissue phantoms, blood vessels, and/or veins of the skin surface. Unlike the fiber-based devices (with contact) that can image deep tissues as in breast imaging, the fiber-free noncontact optical devices developed to date have been used for sub-surface imaging (≤1 cm deep).
In our Optical Imaging Laboratory, a fiber-free hand-held NIROS has been developed toward deep tissue imaging (>1 cm target depth) in both reflectance and transmittance mode. Preliminary in vivo breast imaging studies using the scanner as a noncontact device were performed to determine its deep target detectability and its potential applicability as a breast cancer prescreening tool.
Instrumentation
The fiber-free noncontact hand-held NIROS comprises a hand-held probe (Figure 2, Device #10), a controller box, and a computer with custom-developed image acquisition/processing toolbox. The hand-held probe (weighing <1 lb) consists of a 710 nm LED source light for area illumination and an NIR-sensitive CMOS camera for area detection. The LED source encased in a heat sink is driven by an LED driver (placed in the controller box) that controls the radiating power of the source. The LED driver and the CMOS camera are synchronized in the data acquisition timing via a microcontroller unit, and both the source and detector are powered by the computer’s USB port. The diffuse reflected/transilluminated NIR signals from the tissue surface are detected by the camera after the signals have been filtered using a 645-nm long-pass optical filter and focused using an 8.5 mm focusing lens. A MATLAB-based imaging software was developed in order to automate the data acquisition, data storage, and data processing. For the breast imaging studies, two transparent parallel acrylic plates were used to hold the breast tissue during transillumination-based imaging using NIROS (Figure 3).
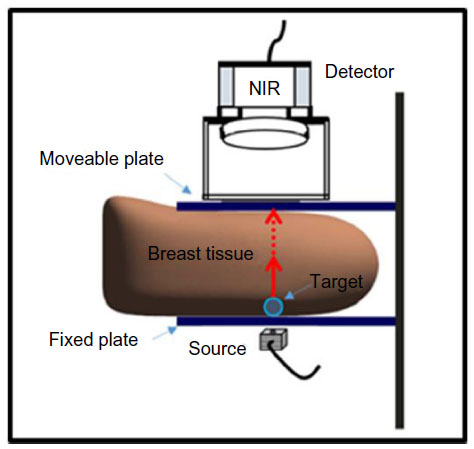 | Figure 3 Setup for breast imaging studies consisting of the breast tissue placed in between two transparent plates. |
In vivo breast imaging studies using NIROS
The Florida International University IRB-approved studies imaged ten healthy female subjects over the age of 21 years with no known history of breast cancer. The breast imaging studies were performed with the breast tissue placed in between the two transparent plates to provide for transmission imaging mode. As seen in Figure 3, the top plate is adjustable in order to perform studies with or without applied pressure and to accommodate different breast tissue sizes. The detector is placed above the top plate, and the LED source is placed beneath the bottom fixed plate. A 0.46 cm3 target was filled with a solution of 0.8% India ink in Liposyn in order to create a tumor-like agent with high-absorption properties. The target was positioned beneath the breast tissue and above the bottom plate and moved to different locations (noted by clock positions) throughout the study.
The goal of the studies was to qualitatively determine the ability of NIROS to detect the targets when both the applied pressure and target locations were varied. Images were acquired with and without pressure by adjusting the top moveable plate and also by moving the target to various clock locations in order to assess NIROS’s capacity to determine where the targets were placed. The studies were performed in transmission mode with the source below the tissue and the detector above the breast tissue. The images were acquired without external light; only the laptop was on with the screen brightness at the minimum setting, in order to minimize noise. The power of the LED was measured several times throughout the study, and the CMOS exposure time was adjusted for each subject as well as the focus.
Image processing was carried out using a custom-developed MATLAB-based software. The first step was to co-register the raw NIR images, so that the two images are aligned on the same coordinate system. This was followed by subtraction of the NIR image of the breast tissue obtained without the target from the NIR image obtained with the target present. The regions outside the breast tissue were masked (or cropped) in order to improve the image contrast by removing the noise. Finally, minimum and maximum pixel values were set by the user in order to distinguish areas of increased or decreased absorption in the image, allowing for the recognition of the target with improved contrast. The targets were seen as areas with increased absorption.
Experimental results from two different subjects are shown below in Figures 4 and 5. Figure 4 shows a set of images from subject #1’s left breast at a constant pressure. Figure 4B has the target, and Figure 4A does not have a target. Figure 4C is the final image after data processing including co-registration, subtraction, and masking. The region of increased absorption in the final image reveals where the target was placed.
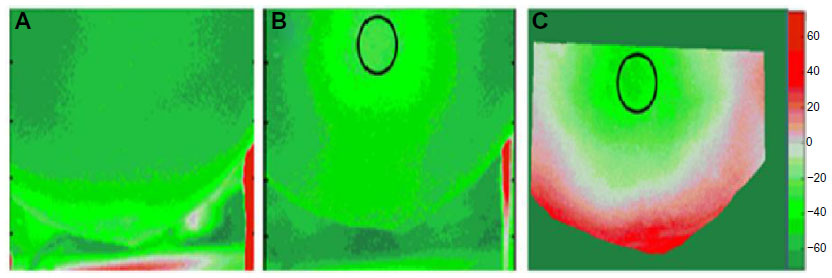 | Figure 4 Transmitted NIR optical images of the left breast from subject #1 that were captured at a constant pressure applied on the breast (in all images). |
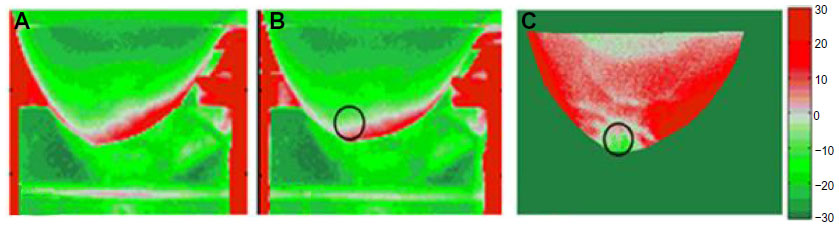 | Figure 5 Transmitted NIR optical images of the left breast from subject #2 that were captured at a constant pressure applied on the breast (in all images). |
Figure 5 also shows a set of images from subject #2 with applied pressure and with the target in the 6 o’clock location. The target can be distinguished in the last picture (Figure 5C) as the region in green in the bottom portion of the breast. It was also noticed that when the target was placed furthest away from the source, as in Figure 5, the target was still detectable due to its higher absorption. The greatest distance between the target and the top plate at which a target was able to be detected was at 8.8 cm. Hence, while the raw images do not reveal information about the location of the target, the target’s location can indeed be seen in the final image once image processing has been performed.
The preliminary in vivo studies on the normal breast tissues with a superficially placed target in the intramammary fold have shown that an increased absorption was clearly observed from the target site (up to 8.8 cm deep) when (maximum comfortable) pressure was applied. To date, an area illumination and area detection-based NIR device have demonstrated only sub-surface imaging (1 cm or less). NIROS has demonstrated detection of deep targets using area illumination/detection approach, along with post-processing techniques to improve the target detection greater than 8 cm deep. Although the images cannot precisely locate the target in 2D, their detected location was close to the true clock location as seen in Figures 4 and 5.
In an actual breast cancer case, NIROS may translate to imaging the contralateral breast and comparing the differences in the absorption across the two tissues, via symmetric clockwise imaging of the breast (as in an US approach). Currently, work is carried out to image both the left and right breast tissues and compare the two, as there are structural differences between the two. These structural differences can lead to differences in NIR images (from physiological differences). Hence, understanding the hemodynamic differences between normal left and right breasts can help differentiate between the breast abnormalities with respect to the contralateral breast (acting as a reference) in the future. There are ongoing efforts to perform extensive in vivo studies under various experimental conditions to determine the capabilities of the noncontact hand-held NIROS in detecting smaller and deeper targets.
Studies in the past have revealed that only half of the insured women over the age of 40 are claiming annual mammogram screenings, despite medical recommendations endorsed across the USA and the world. Reasons for noncompliance suggested from various studies include discomfort during the exam, concern over radiation exposure, access to facilities, inconvenience/lack of time, embarrassment/cultural barriers, and denial. Thus, to improve breast cancer screening compliance, a need exists for a safe, comfortable, accessible, and convenient breast cancer prescreening tool to better triage the subjects for early detections/treatment options. There is a potential for a functional imaging tool to provide additional information to the CBE or SBEs at the prescreening stage that may provide more information to the clinicians. Although the hand-held noncontact NIROS cannot determine the accurate location of a target, as other 3D tomography-based optical imagers, it may have the potential to detect the presence of any abnormalities (or target(s)) as an initial assessment to breast prescreening. The ability to perform deep tissue imaging using a portable hand-held NIROS allows for in vivo breast studies. Following the extensive in vivo studies on normal subjects, studies will be performed on breast cancer subjects to validate the above-stated hypothesis and determine the capabilities of the device for breast cancer prescreening. In this effort, NIROS is currently modified to allow hemodynamic imaging (using a dual-wavelength source system) such that the changes in oxy- and deoxy-hemoglobin from breast tissues can be determined apart from changes in absorption alone.
Conclusion
In this review, the existing and clinically applied breast cancer prescreening tools and screening imaging modalities are described. With a need for a systematic prescreening or early detection of breast cancer, the application of optical imaging modality is described. Although various research groups have developed many optical imaging devices for detection, diagnosis, and prognosis of breast cancer, a few of these devices have focused on early detection or prescreening. While a few of these hand-held optical devices have performed in vivo clinical studies on breast cancer subjects, there still remains extensive work to be performed to assess optical devices as potential future breast prescreening devices.
Acknowledgment
A part of the work has been supported by NIH (R15 CA 119253) funds and FIU Division of Research Seed Funds.
Disclosure
The authors report no conflicts of interest in this work.
References
DeSantis C, Ma J, Bryan L, Jemal A. Breast cancer statistics, 2013. CA Cancer J Clin. 2014;64:52–62. | |
Panieri E. Breast cancer screening in developing countries. Best Pract Res Clin Obstet Gynaecol. 2012;26:283–290. | |
Jemal A, Bray F, Center M, Ferlay J, Ward E, Forman D. Global cancer statistics. CA Cancer J Clin. 2001;61(2):69–90. | |
Cancer.gov. PDQ® Breast Cancer Treatment. Bethesda, MD: National Cancer Institute; 2014. Available from: http://cancer.gov/cancertopics/pdq/treatment/breast/Patient. Accessed Nov 2014. | |
Cancer.org. Cancer Facts and Figures 2014. Georgia: American Cancer Society, Inc.; 2014. Available from: http://www.cancer.org/acs/groups/content/@research/documents/webcontent/acspc-042151.pdf. Accessed Nov 2014. | |
Andreea GI, Pegza R, Lascu L, Bondari S, Stoica Z, Bondari A. The role of imaging techniques in diagnosis of breast cancer. Curr Health Sci J. 2011;37(2):55–61. | |
Cancer.gov. Adjuvant and Neoadjuvant Therapy for Breast Cancer. National Institutes of Health; [reviewed June 16, 2009]. Available from: http://www.cancer.gov/cancertopics/factsheet/Therapy/adjuvant-breast. Accessed November 3, 2014. | |
Graham LJ. Current approaches and challenges in monitoring treatment responses in breast cancer. J Cancer. 2014;5(1):58–68. | |
Cancer.org. Breast Cancer Facts and Figures 2013–2014. Georgia: American Cancer Society, Inc.; 2013. Available from: http://www.cancer.org/acs/groups/content/@research/documents/document/acspc-042725.pdf. Accessed Nov 2014. | |
Nationalbreastcancer.org. Clinical Breast Exam: The National Breast Cancer Foundation. National Cancer Institute. Available from: http://www.nationalbreastcancer.org/breast-self-exam. Accessed November 3, 2014. | |
Elmore J, Armstrong K, Lehman C, Fletcher S. Screening for breast cancer. J Am Med Assoc. 2005;293(10):1245–1256. | |
Nover AB, Jagtap S, Anjum W, et al. Modern breast cancer detection: a technological review. Int J Biomed Imaging. 2009;2009:1–14. | |
Niklason LT, Christian BT, Niklason LE, et al. Digital tomosynthesis in breast imaging. Radiology. 1997;205(2):399–406. | |
Smith A. Full-field breast tomosynthesis. Radiol Manage. 2005;27(5):25–31. | |
Pisano ED, Yaffe M. Digital mammography. Breast Dis. 1998;10(3–4):127–135. | |
Diekmann F, Bick U. Tomosynthesis and contrast-enhanced digital mammography: recent advances in digital mammography. Eur Radiol. 2007;17(12):3086–3092. | |
Sinha S, Sinha U. Functional magnetic resonance of human breast tumors: diffusion and perfusion imaging. Ann N Y Acad Sci. 2002;980:95–115. | |
Cancer.org. American Cancer Society. [updated September 25, 2014]; 2014. Available from: http://www.cancer.org/cancer/breastcancer/detailedguide/breast-cancer-diagnosis. Accessed November 2, 2014. | |
Planche K, Vinnicombe S. Breast imaging in the new era. Cancer Imaging. 2004;4(2):39–50. | |
Del Cura JL, Elizagaray E, Zabala R, Legórburu A, Grande D. The use of unenhanced Doppler sonography in the evaluation of solid breast lesions. AJR Am J Roentgenol. 2005;184(6):1788–1794. | |
Azhari H, Sazbon D. Volumetric imaging with ultrasonic spiral CT. Radiology. 1999;212(1):270–275. | |
Newman J. Scintimammography in breast cancer diagnosis. Radiol Technol. 1998;70(2):153. | |
Tafra L. Positron emission mammography: a new breast imaging device. J Surg Oncol. 2008;97(5):372–373. | |
Von Schulthess GK. Cost considerations regarding an integrated CT-PET system. Eur Radiol. 2000;10(Suppl 3):S377–S380. | |
Kane RL. Breast thermography: helping make breast cancer prevention possible. Orig Internist. 2010:135–138. | |
Sterns EE, Curtis AC, Miller S, Hancock JR. Thermography in breast diagnosis. Cancer. 1982;50(2):323–325. | |
Malich A, Böhm T, Facius M, et al. Electrical impedance scanning as a new imaging modality in breast cancer detection – a short review of clinical value on breast application, limitations and perspectives. Nucl Instrum Methods Phys Res A. 2003;497(1):75–81. | |
Vreugdenburg TD, Willis CD, Mundy L, Hiller JE. A systematic review of elastography, electrical impedance scanning, and digital infrared thermography for breast cancer screening and diagnosis. Breast Cancer Res Treat. 2013;137(3):665–676. | |
Nikolova NK. Microwave imaging for breast cancer. Microwave Mag IEEE. 2011;12(7):78–94. | |
Al-Forheidi M, Al-Mansour MM, Ibrahim EM. Breast cancer screening: a review of benefits and harms and recommendations for developing and low-income countries. Med Oncol. 2013;30(2):471. | |
Miller AB, Baines CJ. The role of clinical breast examination and breast self-examination. Preventative Med. 2011;53(3):118–120. | |
Ma I, Dueck A, Gray R, et al. Clinical and self breast examination remain important in the ear of modern screening. Ann Surg Oncol. 2012;19(5):1484–1490. | |
Khalili AF, Shahnazi M. Breast cancer screening (breast self-examination, clinical breast exam, and mammography) in women referred to health centers in Tabriz, Iran. Indian J Med Sci. 2010;64(4):149–162. | |
Ratanachaikanont T. Clinical breast examination and its relevance to diagnosis of palpable breast lesion. J Med Assoc Thai. 2005;88(4):505–507. | |
Carney PA, Miglioretti DL, Yankaskas BC, et al. Individual and combined effects of age, breast density, and hormone replacement therapy use on the accuracy of screening mammography. Ann Intern Med. 2003;138(3):168–175. | |
Moon WK, Im GJ, Noh DY, Han MC. Nonpalpable breast lesions: evaluation with power Doppler US and a microbubble contrast agent-initial experience. Radiology. 2000;217(1):240–246. | |
Saslow D, Boetes C, Burke W, for the American Cancer Society Breast Cancer Advisory Group, et al. American Cancer Society guidelines for breast screening with MRI as an adjunct to mammography. CA Cancer J Clin. 2007;57:75–89. | |
Bluemke DA, Gatsonis CA, Chen MH, et al. Magnetic resonance imaging of the breast prior to biopsy. J Am Med Assoc. 2004;292(22):2735–2742. | |
Lind P, Igerc I, Beyer T, Reinprecht P, Hausegger K. Advantages and limitations of FDG PET in the follow-up of breast cancer. Eur J Nucl Med Mol Imaging. 2004;31(Suppl 1):S125–S134. | |
Liberman M, Sampalis F, Mulder DS, Sampalis JS. Breast cancer diagnosis by scintimammography: a meta-analysis and review of the literature. Breast Cancer Res Treat. 2003;80(1):115–126. | |
Klaus AJ, Klingensmith WC 3rd, Parker SH, Stavros AT, Sutherland JD, Aldrete KD. Comparative value of 99mTc-sestamibi scintimammography and sonography in the diagnostic workup of breast masses. AJR Am J Roentgenol. 2000;174(6):1779–1783. | |
Khalkhali I, Itti E. Functional breast imaging using the single photon technique. Nucl Med Commun. 2002;23(7):609–611. | |
Sampalis FS, Denis R, Picard D, et al. International prospective evaluation of scintimammography with t99mechnetium sestamibi. Am J Surg. 2001;182(4):399–403. | |
Arora N, Martins D, Ruggerio D, et al. Effectiveness of a noninvasive digital infrared thermal imaging system in the detection of breast cancer. Am J Surg. 2008;196(4):523–526. | |
Parisky YR, Sardi A, Hamm R, et al. Efficacy of computerized infrared imaging analysis to evaluate mammographically suspicious lesions. AJR Am J Roentgenol. 2003;180(1):263–269. | |
Ng EYK, Fok SC, Peh YC, Ng FC, Sim LSJ. Computerized detection of breast cancer with artificial intelligence and thermograms. J Med Eng Technol. 2002;26(4):152–157. | |
Stojadinovic A, Nissan A, Gallimidi Z, et al. Electrical impedance scanning for the early detection of breast cancer in young women: preliminary results of a multicenter prospective clinical trial. J Clin Oncol. 2005;23(12):2703–2715. | |
Brown BH. Electrical impedance tomography (EIT): a review. J Med Eng Technol. 2003;27(3):97–108. | |
Martín G, Martín R, Brieva MJ, Santamaría L. Electrical impedance scanning in breast cancer imaging: correlation with mammographic and histologic diagnostic. Eur Radiol. 2002;12(6):1471–1478. | |
Melloul M, Paz A, Ohana G, et al. Double-phase 99mTc-sestamibi scintimammography and trans-scan in diagnosing breast cancer. J Nucl Med. 1999;40(3):376–380. | |
Boas DA, Brooks DH, Miller EL, et al. Imaging the body with diffuse optical tomography. IEEE Signal Process Mag. 2001;18(6):57–75. | |
Wang LV, Wu H. Biomedical Optics: Principles and Imaging. Hoboken: Wiley; 2007. | |
Weissleder R. A clearer vision for in vivo imaging. Nat Biotechnol. 2001; 19(4):316–317. | |
Hsiang D, Shah N, Yu H, et al. Hand-held optical devices for breast cancer: spectroscopy and 3D tomographic imaging. IEEE J Sel Top Quantum Electron. 2011;18(4):1298–1312. | |
Tromberg B, Pogue BW, Paulsen KD, Yodh AG, Boas DA, Cerussi AE. Assessing the future of diffuse optical imaging technologies for breast cancer management. Med Phys. 2008;108(1):9–22. | |
Leff DR, Warren OJ, Enfield LC, et al. Diffuse optical imaging of the healthy and diseased breast: a systematic review. Breast Cancer Res Treat. 2008;108(1):9–22. | |
Erickson SJ, Godavarty A. Hand-held based near-infrared optical imaging devices: a review. Med Eng Phys. 2009;31(5):495–509. | |
Hsiang D, Shah N, Yu H, et al. Coregistration of dynamic contrast enhanced MRI and broadband diffuse optical spectroscopy for characterizing breast cancer. Technol Cancer Res Treat. 2005;4(5):549–558. | |
Chance B, Zhao Z, Wen S, Chen Y. Simple ac circuit for breast cancer detection and object detection. Rev Sci Instrum. 2006;77:064301. | |
Xu RX, Qiang B, Mao JJ, Povoski SP. Development of a handheld near-infrared imager for dynamic characterization of in vivo biological tissue systems. Appl Opt. 2007;46(30):7442–7451. | |
Zhu Q, Chen NG, Piao DQ, Guo PY, Ding XH. Design of near infrared imaging probe with the assistance of ultrasound localization. App Opt. 2001;40(19):3288–3303. | |
Tromberg BJ. Optical scanning and breast cancer. Acad Radiol. 2005; 12(8):923–924. | |
Pham TH, Coquoz O, Fishkin JB, Anderson E, Tromberg BJ. Broad bandwidth frequency domain instrument for quantitative tissue optical spectroscopy. Rev Sci Instrum. 2000;71(6):2500–2513. | |
Tromberg BJ, Coquoz O, Fishkin JB, et al. Non-invasive measurements of breast tissue optical properties using frequency-domain photon migration. Philos Trans R Soc Lond B Biol Sci. 1997;352:661–668. | |
Lanning R, Tromberg B. Non-invasive characterization of breast cancer using near infrared optical spectroscopy. UCI Undergraduate Res J. 1999;II:43–49. | |
Tromberg BJ, Shah N, Lanning R, et al. Noninvasive in vivo characterization of breast tumors using photon migration spectroscopy. Neoplasia. 2000;2(1–2):26–40. | |
Holboke MJ, Tromberg BJ, Li X, et al. Three-dimensional diffuse optical mammography with ultrasound localization in a human subject. J Biomed Opt. 2000;5(2):237–247. | |
Cerussi AE, Berger AJ, Bevilacqua F, et al. Sources of absorption and scattering contrast for near-infrared optical mammography. Acad Radiol. 2001;8(3):211–218. | |
Shah N, Cerussi A, Eker C, et al. Noninvasive functional optical spectroscopy of human breast tissue. Proc Natl Acad Sci U S A. 2001;98(8):4420–4425. | |
Shah N, Cerussi AE, Jakubowski D, Hsiang D, Butler J, Tromberg BJ. Spatial variations in optical and physiological properties of healthy breast tissue. J Biomed Opt. 2004;9(3):534–540. | |
Bevilacqua F, Berger AJ, Cerussi AE, Jakubowski D, Tromberg BJ. Broadband absorption spectroscopy in turbid media by combined frequency-domain and steady-state methods. Appl Opt. 2000;39(34):6498–6507. | |
Cerussi AE, Jakubowski D, Shah N, et al. Spectroscopy enhances the information content of optical mammography. J Biomed Opt. 2002;7(1):60–71. | |
Jakubowski DB, Cerussi AE, Bevilacqua F, et al. Monitoring neoadjuvant chemotherapy in breast cancer using quantitative diffuse optical spectroscopy: a case study. J Biomed Opt. 2004;9(1):230–238. | |
Shah N, Gibbs J, Wolverton D, Cerussi A, Hylton N, Tromberg BJ. Combined diffuse optical spectroscopy and contrast-enhanced magnetic resonance imaging for monitoring breast cancer neoadjuvant chemotherapy: a case study. J Biomed Opt. 2005;10(5):051503. | |
Cerussi A, Shah N, Hsiang D, Durkin A, Butler J, Tromberg BJ. In vivo absorption, scattering, and physiologic properties of 58 malignant breast tumors determined by broadband diffuse optical spectroscopy. J Biomed Opt. 2006;11(4):044005. | |
Cerussi A, Hsiang D, Shah N, et al. Predicting response to breast cancer neoadjuvant chemotherapy using diffuse optical spectroscopy. Proc Natl Acad Sci U S A. 2007;104(10):4014–4019. | |
No KS, Chou PH. Mini-FDPM and heterodyne mini-FDPM: handheld non-invasive breast cancer detectors based on frequency-domain photon migration. IEEE Trans Circ Syst I Reg Papers. 2005;52(12):2672–2685. | |
No KS, Xie Q, Kwong R, Cerussi A, Tromberg BJ, Chou P. HBS: a handheld breast cancer detector based on frequency domain photon migration with full heterodyne. In: Proceedings of the IEEE BioCAS; November 29–December 1, 2006; London. 2006:114–117. | |
No KS, Xie Q, Kwong R, et al. In vivo breast cancer measurement with a handheld laser breast scanner. In: Proceedings of the 50th IEEE International Midwest Symposium on Circuits and Systems; August 5–8, 2007; Montreal, Quebec, Canada. 2007:1–4. | |
Nioka S, Chance B. NIR spectroscopic detection of breast cancer. Technol Cancer Res Treat. 2005;4(5):497–512. | |
Sao V, Pourrezaei K, Akin A, Ayaz H. Breast tumor imaging using NIR LED based handheld continuous-wave imager. In: Proceedings of the IEEE 29th Annual North East Bioengineering Conference; March 22–23, 2003; Newark, NJ. 2003:55–56. | |
Liu Q, Luo Q, Chance B. 2D phased array fluorescence wireless localizer in breast cancer detection. In: Proceedings of the IEEE/EMBS International Summer School Medical Devices Biosensors; June 26–July 2, 2004; Hong Kong, China. 2004:71–73. | |
Cheng X, Mao J, Bush R, Kopans DB, Moore RH, Chorlton M. Breast cancer detection by mapping hemoglobin concentration and oxygen saturation. Appl Opt. 2003;42:6412–6421. | |
Xu R, Qiang B, Mao J. Near infrared imaging of tissue heterogeneity: probe design and sensitivity analysis. In: Proceedings of the 27th Annual Conference on IEEE Engineering and Medicine Biology; September 1–4, 2005; Shanghai, China. 2005:278–281. | |
Xu RX, Olsen JO, Povoski SP, Yee LD, Mao J. Localization and functional parameter reconstruction of suspicious breast lesions by near infrared/ultrasound dual mode imaging. In: Proceedings of the 27th Annual Conference on IEEE Engineering and Medicine Biology; September 1–4, 2005; Shanghai, China. 2005:4473–4476. | |
Durduran T, Choe R, Yu G, et al. Diffuse optical measurement of blood flow in breast tumors. Opt Lett. 2005;30(21):2915–2917. | |
Xu C, Zhu Q. Optimal probe design for dual-modality breast imaging. In: Proceedings of the SPIE; Optical Tomography and Spectroscopy of Tissue VII; February 13, 2007; San Jose, CA. 2007:64340B. | |
Ge J, Zhu B, Regalado S, Godavarty A. Three-dimensional fluorescence-enhanced optical tomography using a hand-held probe based imaging system. Med Phys. 2008;35(7):3354–3363. | |
Erickson SJ, Ge J, Sanchez A, Godavarty A. Two-dimensional fast surface imaging using a hand-held optical device: in-vitro and in-vivo fluorescence studies. Trans Oncol. 2010;3(1):16–22. | |
Erickson SJ, Martinez S, DeCerce J, Romero A, Caldera L, Godavarty A. Fast coregistered breast imaging in vivo using a hand-held optical imager. In: Proceedings of the SPIE; Advanced Biomedical and Clinical Diagnostic Systems VIII; February 19, 2010; San Francisco, CA. 7555:75550P-1-75550P-6. | |
Solomon M, White BR, Bauer AQ, Perry G, Culver JP. Handheld video rate fluorescence diffuse optical tomography. In: OSA Biomedical Optics; April 11–14, 2010; Miami, FL; 2010:BTuD9. | |
Zhou C, Choe R, Shah N, et al. Diffuse optical monitoring of blood flow and oxygenation in human breast cancer during early stages of neoadjuvant chemotherapy. J Biomed Opt. 2007;12(5):051903. | |
Gonzalez J, Decerce J, Erickson SJ, et al. Hand-held optical imager (Gen-2): improved instrumentation and target detectability. J Biomed Opt. 2012;17(8):081402. | |
Gonzalez J, Roman M, Hall M, Godavarty A. Gen-2 hand-held optical imager towards cancer imaging: reflectance and transillumination phantom studies. Sensors. 2012;12:1885–1897. | |
Eppstein MJ, Hawrysz DJ, Godavarty A, Sevick-Muraca EM. Three-dimensional near-infrared fluorescence tomography with Bayesian methodologies for image reconstruction from sparse and noisy data sets. Proc Natl Acad Sci U S A. 2002;99:9619–9624. | |
Godavarty A, Eppstein MJ, Zhang C, et al. Fluorescence-enhanced optical imaging in large tissue volumes using a gain modulated ICCD camera. Phys Med Biol. 2003;48:1701–1720. | |
Godavarty A, Thompson AB, Roy R, et al. Diagnostic imaging of breast cancer using fluorescence-enhanced optical tomography: phantom studies. J Biomed Opt. 2004;9(3):488–496. | |
Floery D, Helbich TH, Riedl CC, et al. Characterization of benign and malignant breast lesions with computed tomography laser mammography (CTLM): initial experience. Invest Radiol. 2005;40(6):328–335. | |
Schmitz CH, Klemer DP, Hardin R, et al. Design and implementation of dynamic near-infrared optical tomographic imaging instrumentation for simultaneous dual-breast measurements. Appl Opt. 2005;44(11):2140–2153. | |
Schmitz CH, Löcker M, Lasker JM, Hielscher AH, Barbour RL. Instrumentation for fast functional optical tomography. Rev Sci Instrum. 2002;73:429. | |
Al Abdi RM, Schmitz C, Ansari R, et al. A dual-mode simultaneous bilateral optical imaging system for breast cancer detection. In: OSA Biomedical Optics; April 11–14, 2010; Miami, FL. 2010:BSuB5. | |
AlAbdi R, Graber HL, Xu Y, Barbour RL. Optomechanical imaging system for breast cancer detection. J Opt Soc Am A Opt Image Sci Vis. 2011;28(12):2473–2493. | |
Yates T, Hebden JC, Gibson A, Everdell N, Arridge SR, Douek M. Optical tomography of the breast using a multi-channel time-resolved imager. Phys Med Biol. 2005;50:2503. | |
Hebden JC, Yates TD, Gibson A, et al. Monitoring recovery after laser surgery of the breast with optical tomography: a case study. Appl Opt. 2005;44(10):1898–1904. | |
Enfield LC, Gibson AP, Everdell NL, et al. Three-dimensional time-resolved optical mammography of the uncompressed breast. Appl Opt. 2007;46(17):3628–3638. | |
Culver JP, Choe R, Holboke MJ, et al. Three-dimensional diffuse optical tomography in the parallel plane transmission geometry: evaluation of a hybrid frequency domain/continuous wave clinical system for breast imaging. Med Phys. 2003;30:235. | |
Choe R, Konecky SD, Corlu A, et al. Differentiation of benign and malignant breast tumors by in-vivo three-dimensional parallel-plate diffuse optical tomography. J Biomed Opt. 2009;14(2):024020. | |
Choe R, Corlu A, Lee K, et al. Diffuse optical tomography of breast cancer during neoadjuvant chemotherapy: a case study with comparison to MRI. Med Phys. 2005;32(4):1128–1139. | |
Ntziachristos V, Yodh AG, Schnall M, Chance B. Concurrent MRI and diffuse optical tomography of breast after indocyanine green enhancement. Proc Natl Acad Sci U S A. 2000;97(6):2767. | |
Fang Q, Carp SA, Moore RH, Kopans DB, Boas DA. Benign and malignant breast lesions with combined optical imaging and tomosynthesis. In: OSA Biomedical Optics; April 11–14, 2010; Miami, FL. 2010:BSuB. | |
Fang Q, Selb J, Carp SA, et al. Combined optical and X-ray tomosynthesis breast imaging. Radiology. 2011;258(1):89–97. | |
Fang Q. Quantitative diffuse optical tomography using a mobile phone camera and automatic 3D photo stitching. In: OSA Biomedical Optics; April 28–May 2, 2012; Miami, FL. 2012:BSu3A-96. | |
Hadjipanayis CG, Jiang H, Roberts DW, Yang L. Current and future clinical applications for optical imaging of cancer: from intraoperative surgical guidance to cancer screening. Semin Oncol. 2011;38(1):109–118. | |
Zhu Q, Huang M, Chen N, et al. Ultrasound-guided optical tomographic imaging of malignant and benign breast lesions: initial clinical results of 19 cases. Neoplasia. 2003;5(5):379–388. | |
Flexman ML, Kim HK, Stoll R, Khalil MA, Fong CJ, Heilscher AH. A wireless handheld probe with spectrally constrained evolution strategies for diffuse optical imaging of tissue. Rev Sci Instrum. 2012;83:033108. | |
Labib NA, Ghobashi MM, Moneer MM, Helal MH, Abdalgaleel SA. Evaluation of BreastLight as a tool for early detection of breast lesions among females attending National Cancer Institute, Cairo University. Asian Pac J Cancer Prev. 2013;18(8):4647–4650. | |
Rodriguez S, Kaliada H, Gabrielle C, Jung Y-J, Godavarty A. In-vivo breast imaging using an ultra-portable hand-held near-infrared optical scanner (NIROS). In: OSA J Biomed Opt; April 26–30, 2014; Miami, FL. 2014:BM3A.66. | |
Palmer MR, Shibata Y, Kruskal JB, Lenkinski RE. In Vivo Imaging of Small Animals with Optical Tomography and Near-Infrared Fluorescent Probes. Proceedings of SPIE; Biomedical Nanotechnology Architectures and Applications; June 19, 2002; San Jose, CA. 2002:166–169. | |
Wieringa FP, Mastik F, Ten Cate FJ, Neumann HM, van der Steen FW. Remote non-invasive stereoscopic imaging of blood vessels: first in-vivo results of a new multispectral contrast enhancement technology. Ann Biomed Eng. 2006;34(12):1870–1878. | |
Han X, Lui H, McLean DI, Zeng H. A technique for near-infrared autofluorescence imaging of skin: preliminary results. In: Proceedings of SPIE; Photonic Therapeutics and Diagnostics II; February 22, 2006; San Jose, CA. 2006:60780S–60780S–3. | |
Matsushita T, Miyati T, Nakayama K, et al. Development of qualitative near infrared vascular imaging system with tuned aperture computed tomography. In: Proceedings of SPIE; Medical Imaging 2007: Physics of Medical Imaging; March 16, 2007; San Diego, CA. 2007:65103G. | |
Han X, Lui H. Near-infrared autofluorescence imaging of cutaneous melanins and human skin in vivo. J Biomed Opt. 2009;14(2):024017. | |
Abookasis D. Imaging cortical absorption, scattering, and hemodynamic response during ischemic stroke using spatially modulated near-infrared illumination. J Biomed Opt. 2009;14(2):1–19. | |
Bouzida N, Bendada AH, Maldague XP. Near-infrared image formation and processing for the extraction of hand veins. J Mod Opt. 2010; 57(18):1731–1737. | |
Mizuno Y, Katayama T, Nakamachi E. Development of an accurate 3D blood vessel searching system using NIR light. In: Proceedings of SPIE; Advanced Biomedical and Clinical Diagnostic Systems VIII; February 19, 2010; San Francisco, CA. 2010:755506. | |
Lee BBT, Matsui A, Hutteman M. Intraoperative near-infrared fluorescence imaging in perforator flap reconstruction: current research and early clinical experience. J Reconstr Microsurg. 2010;26(1):59–65. | |
Chen P, Chang M, Chiu F, Li C, Law ABL. Quantitative measurements of blood vessel of diabetic extremity based on near-infrared image technique. In: IFMBE Proceedings, Volume 31; August 1–6, 2010; Singapore. 2010:1311–1314. | |
Jakovels D, Spigulis J, Saknite I. Multi-spectral mapping of in-vivo skin hemoglobin and melanin. In: Proceedings of SPIE; Biophotonics: Photonic Solutions for Better Health Care II; May 18, 2010; Brussels, Belgium. 2010:77152Z. | |
Shao X, Zheng W, Huang Z. Polarized near-infrared autofluorescence imaging combined with near-infrared diffuse reflectance imaging for improving colonic cancer detection. Opt Express. 2010;18(23):24293–24300. | |
Shimawaki S, Sakai N. Change in blood vessel images of the human finger using near-infrared radiation while compressing the upper arm. In: IFMBE Proceedings; August 1–6, 2010; Singapore. 2010:1262–1265. | |
Matsushita T, Miyati T, Nakayama K, et al. Qualitative near-infrared vascular imaging system with tuned aperture computed tomography. J Biomed Opt. 2011;16(7):076004. | |
Lin ZJ, Niu H, Liu Y, Su J, Liu H. CCD-camera-based diffuse optical tomography to study ischemic stroke in preclinical rat models. In: Proceedings of SPIE; Optical Tomography and Spectroscopy; February 17, 2011; San Francisco. 2011:78960R–78960R–8. | |
Liu Y, Bauer AQ, Akers W, et al. Compact intraoperative imaging device for sentinel lymph node mapping. In: Proceedings of SPIE; Reporters, Markers, Dyes, Nanoparticles, and Molecular Probes for Biomedical Applications III; February 11, 2011; San Francisco, CA. 2011:79100D–79100D–7. | |
Mieog JS, Troyan SL, Hutteman M, et al. Toward optimization of imaging system and lymphatic tracer for near-infrared fluorescent sentinel lymph node mapping in breast cancer. Ann Surg Oncol. 2011; 18(9):2483–2491. | |
Mieog JS, Hutteman M, van der Vorst JR, et al. Image-guided tumor resection using real-time near-infrared fluorescence in a syngeneic rat model of primary breast cancer. Breast Cancer Res Treat. 2011;128(3):679–689. | |
Kuzmina I, Diebele I. Multi-spectral imaging analysis of pigmented and vascular skin lesions: results of a clinical trial. In: Proceedings of SPIE; Photonic Therapeutics and Diagnostics VII; February 17, 2011; San Francisco, CA. 2011:788312–788312. | |
Osaki R, Ding M, Hyodo H, Soga K, Takemura H, Mizoguchi H. 3D bioimaging sensor of breast cancer cell using rare-earth-doped ceramic nanophosphors and near-infrared. In: Proceedings of IEEE Sensors; October 28–31, 2011; Limerick, Ireland. 2011:1784–1787. | |
Chance B, Nioka S, Zhang J, et al. Breast cancer detection based on incremental biochemical and physiological properties of breast cancers: a six-year, two-site study. Acad Radiol. 2005;12(8):925–933. |
 © 2015 The Author(s). This work is published and licensed by Dove Medical Press Limited. The full terms of this license are available at https://www.dovepress.com/terms.php and incorporate the Creative Commons Attribution - Non Commercial (unported, v3.0) License.
By accessing the work you hereby accept the Terms. Non-commercial uses of the work are permitted without any further permission from Dove Medical Press Limited, provided the work is properly attributed. For permission for commercial use of this work, please see paragraphs 4.2 and 5 of our Terms.
© 2015 The Author(s). This work is published and licensed by Dove Medical Press Limited. The full terms of this license are available at https://www.dovepress.com/terms.php and incorporate the Creative Commons Attribution - Non Commercial (unported, v3.0) License.
By accessing the work you hereby accept the Terms. Non-commercial uses of the work are permitted without any further permission from Dove Medical Press Limited, provided the work is properly attributed. For permission for commercial use of this work, please see paragraphs 4.2 and 5 of our Terms.