")
Back to Journals » International Journal of Nanomedicine » Volume 14
Optical fiber-based sensing method for nanoparticle detection through supervised back-scattering analysis: a potential contributor for biomedicine
Authors Paiva JS, Jorge PAS , Ribeiro RSR, Sampaio P , Rosa CC , Cunha JPS
Received 11 October 2018
Accepted for publication 10 January 2019
Published 2 April 2019 Volume 2019:14 Pages 2349—2369
DOI https://doi.org/10.2147/IJN.S174358
Checked for plagiarism Yes
Review by Single anonymous peer review
Peer reviewer comments 2
Editor who approved publication: Prof. Dr. Anderson Oliveira Lobo
Joana S Paiva,1–3 Pedro AS Jorge,1,2 Rita SR Ribeiro,1 Paula Sampaio,4 Carla C Rosa,1,2 João PS Cunha1,3
1INESC Technology and Science, Porto, Portugal; 2Physics and Astronomy Department, Faculty of Sciences, University of Porto, Porto, Portugal; 3Faculty of Engineering, University of Porto, Porto, Portugal; 4Institute for Molecular and Cell Biology, i3S – Institute for Innovation and Research in Health, Porto, Portugal
Background: In view of the growing importance of nanotechnologies, the detection/identification of nanoparticles type has been considered of utmost importance. Although the characterization of synthetic/organic nanoparticles is currently considered a priority (eg, drug delivery devices, nanotextiles, theranostic nanoparticles), there are many examples of “naturally” generated nanostructures – for example, extracellular vesicles (EVs), lipoproteins, and virus – that provide useful information about human physiology or clinical conditions. For example, the detection of tumor-related exosomes, a specific type of EVs, in circulating fluids has been contributing to the diagnosis of cancer in an early stage. However, scientists have struggled to find a simple, fast, and low-cost method to accurately detect/identify these nanoparticles, since the majority of them have diameters between 100 and 150 nm, thus being far below the diffraction limit.
Methods: This study investigated if, by projecting the information provided from short-term portions of the back-scattered laser light signal collected by a polymeric lensed optical fiber tip dipped into a solution of synthetic nanoparticles into a lower features dimensional space, a discriminant function is able to correctly detect the presence of 100 nm synthetic nanoparticles in distilled water, in different concentration values.
Results and discussion: This technique ensured an optimal performance (100% accuracy) in detecting nanoparticles for a concentration above or equal to 3.89 µg/mL (8.74E+10 particles/mL), and a performance of 90% for concentrations below this value and higher than 1.22E03 µg/mL (2.74E+07 particles/mL), values that are compatible with human plasmatic levels of tumor-derived and other types of EVs, as well as lipoproteins currently used as potential biomarkers of cardiovascular diseases.
Conclusion: The proposed technique is able to detect synthetic nanoparticles whose dimensions are similar to EVs and other “clinically” relevant nanostructures, and in concentrations equivalent to the majority of cell-derived, platelet-derived EVs and lipoproteins physiological levels. This study can, therefore, provide valuable insights towards the future development of a device for EVs and other biological nanoparticles detection with innovative characteristics.
Keywords: optical fiber sensors, light scattering effects, nanoparticles detection, extracellular vesicles (EVs) detection, lipoproteins detection, virus detection, nanoparticles, Brownian motion, diffusive analysis
Introduction
Nanoparticles, independent of their nature (synthetic or biological), are currently a “hot” R&D topic in several fields, including material sciences (ceramics), cosmetics (eg, nano-liposome-based skin care products), paints, medicine (eg, drug delivery devices, theranostic nanoparticles), textiles, military technology, food industry (eg, non-permeable membranes), etc.1–6 With the advent of nanotechnologies, a vast range of synthetic nanoparticles has been proposed for biomedicine applications, including cell targeting for drug or genetic material delivery, tissue engineering, biosensing, among others.1 In particular, it is important to highlight the great interest that has been observed in developing organic nanoparticles able to incorporate both imaging and therapeutic properties, the theranostic nanoparticles.2,3 Usually, a theranostic nanoparticle results from the conjugation of therapeutic agents (such as anticancer drugs and photosensitizers, such as porphyrins, chlorins, or cyanines) with existing imaging nanoparticles (eg, quantum dots, gold nanocages, organic dyes, fluorescent proteins).2,3 More precisely, the association of a nanoparticle imaging vehicle with a photosensitizer has been the main principle of the photodynamic therapy (PDT) to treat cancer, which therapeutic effect results from the combined action of the photosensitizer, light, and molecular oxygen.3 PDT-based theranostic nanoparticles have shown excellent therapeutic efficacy, due to characteristics such as negligible dark toxicity, rapid cellular uptake, and high-energy photoirradiation, among others.2,7 However, there are still some difficulties in understanding the behavior of synthetically generated nanoparticles, even the organic ones, in biologically relevant environments, mainly at a basic level. This is currently considered a limitation, since such knowledge is highly relevant for accurately determining the limitations, risks, and advantages of each nanomaterial considering its subsequent medical application.1 Additionally, several public health international organizations including the European Commission Council and the National Institutes of Health have been highlighting the urge of developing nanoparticles exposure risk assessment assays. Several concerns related to public safety and health and safety of workers and users have been raised, since very little is known about the physiological impact to their exposure.4–6,8
Although the identification and characterization of synthetically produced nanoparticles are considered a priority, there are also many examples of “naturally” generated nanostructures that provide useful information about human physiology, for example extracellular vesicles (EVs) – that can be excreted by cells, platelets, or even by the placenta of pregnant women – and lipoproteins.9–11 These biological nanostructures can be found in circulating physiological fluids; most of them have diameters between 100 and 150 nm and have been considered as suitable biomarkers for the early diagnosis of certain chronic diseases (eg, cancer, autoimmune, cardiovascular, infectious, and metabolic diseases), as well as acute conditions,4–6,9,11 such as pre-eclampsia in pregnant women.10 Another interesting targets with similar characteristics to EVs that could contribute with important information for human disease are the virus and viral particles.12 The majority of these structures also have sizes at the nanometer scale (between 20 and 200 nm) and can be used to study their pathogenic impact on the human DNA, or can be manipulated to lose their viral cargo, and used as vehicles and templates for bioimaging and drug delivery for applications in biomedicine.12 For these reasons, there is a growing interest in developing novel methods for detecting and quantifying EVs and other “clinically relevant” nanoparticles.4–6 However, despite all the recent advances in this area, scientists have struggled to find a simple and fast method to accurately detect the presence of nanostructures and EVs, since their size is far beyond the light diffraction limit.1,4
In fact, EVs such as exosomes, characterized by nanoscale dimensions, have been associated with significant roles in cancer diagnosis and prognosis.4–6,13 Recently, evidences that there are specific kinds of tumors whose cells excrete malignant exosomes, and that these tumor-derived exosomes, by expressing specific proteins or glycoconjugates,13 can contribute to an early cancer diagnosis, were found.5,6 This range of cancer types includes melanomas, pancreas cancer, or breast cancer.13 Additionally, since exosomes play a major role in the interaction phenomena between both distant and surrounding cells, recent studies showed that they can also provide useful information about cancer metastasis state in an early stage.4 In summary, the early detection of tumor-specific or metastatic-specific EVs in physiological fluids can be a significant contribution to avoid tumor spread into healthy organs and poor prognosis. However, EVs are not only important for early cancer assessment. In fact, there are other biological structures that also secrete EVs, such as platelets9 and endothelium, among others.10
Although the EVs secreted from nucleated cells have been much more extensively studied in comparison to platelet-derived EVs, the latter constitute the major fraction of EVs in the circulating plasma, being considered suitable biomarkers of thrombosis or inflammation.9 Additionally, recent evidence that the placenta of pregnant women can secrete syncytiotrophoblast EVs into the maternal circulation, which may contribute to the systemic inflammation characteristic of pre-eclampsia, causing endothelial dysfunction, activating neutrophils, and triggering thrombin generation.10 Thus, the detection and study of such nanoparticles prove to be of utmost importance for pregnancy risk assessment in early stages. However, the few instruments currently available and compatible with the detection of such small structures (including platelet-, endothelium-derived EVs, and vesicles from other biological sources) are costly, complex, and, in some cases, time-consuming.4–6,13
There are other “clinically relevant” and naturally occurring nanoparticles that, if detected in physiological fluids, can provide important information for health state assessment. This is the case of plasma lipoproteins,11 such as, the Intermediate-Density Lipoprotein, which is a precursor of the Low-Density Lipoprotein, and which has been associated with the development of atherosclerosis. Its accurate detection/quantification on physiological plasma could provide valuable information about its atherogenic implications. Another example are viral agents.12 They have physical and biochemical characteristics similar to EVs and lipoproteins in terms of size and polydispersity degree.14 Its early detection in physiological fluids and further characterization has been considered the gold-standard approach for avoiding disease dissemination.12 However, the detection of lipoproteins or viruses are both also diffraction-limited tasks.14
The current methods employed for nanoparticles detection and identification include Electron Microscopy, Conventional and High-resolution Flow Cytometry, Nanoparticle Tracking Analysis, Affinity-based Assays and Dynamic Light Scattering (DLS).1,5,15 High-resolution flow cytometry is used in ~90% of the EVs and other biological nanoparticles characterization assays.1,15 Despite the improvements in resolution included in this new method in comparison with conventional flow cytometry, it is still based on bulky and even more expensive equipment (requiring high-powered lasers, with a smaller focused beam spot size, detectors with higher sensitivity, and smaller collection optical apertures in comparison with conventional flow cytometry).5 Additionally, as the former version, high-resolution flow cytometry still needs to analyze two kinds of signal: the scattering and fluorescence signals, acquired upon sample irradiation. This, therefore, increases the amount of specialized lab equipment needed and the cost of computational and control systems.5 Alternatively, the DLS, by taking advantage from the information generated by the Brownian motion of nanoparticles, that is translated into the light that is scattered by the ensemble of nanotargets, is considered a suitable nanoparticle detection technique.1,5 It is based on the time-dependent fluctuations in light scattering intensity caused by constructive and destructive interference phenomena.16 These fluctuations are due to frequency shifts which are imparted by the time-dependent position or velocity of the suspended nanoparticles that scatter the light.16 In terms of data processing and analysis, the DLS is based on the application of the Photon Autocorrelation Function (PAF) to the scattered light intensity and in the calculation of PAF exponential decay.1,5,16 However, in the majority of the cases, the DLS requires the sampling of the acquired scattered signal at multiple rates, in order to obtain an adequate fitting of the correlation function exponential decay to accurately determine the diffusion coefficient and associated measures.17 Additionally, the correlation function is measured discretely only over an incomplete range of time increments between time samples, and there is always noise associated with the data.1,5,17 Globally, DLS also needs highly time-consuming and costly equipment, control, and data analysis systems.
For the above-mentioned reasons, any kind of affordable, fast, simple, highly sensitive, and specific technique that is able to detect the presence of nanoparticles as small as 100 nm in diameter would be a significant contribution toward the development of a “lab-on-chip” device for EVs and other nanoparticles detection and characterization with innovative characteristics. With this in mind, we examined if the time and frequency domain characteristics of the back-scattered signal provided from a 100 nm polystyrene nanoparticles suspension are able to detect their presence (for different concentration values) only by dipping a polymeric lensed optical fiber tip in the solution. The attributes chosen to characterize each class considered – “presence of nanoparticles” vs “no particles” classes – were based on our recent studies on particles identification through back-scattering light phenomena.18–21 By applying a supervised discriminant analysis method – the Linear Discriminant Analysis (LDA) – we were able to detect the presence of nanoparticles in different concentration values in distilled water vs “blank” solutions (only containing water), by projecting an original set of >50 attributes into two final ones, and find the most suitable line between classes, considering the newly projected features. Since one of the most important parameters of a biosensor is its Limit of Detection (LOD) – the smallest concentration of the analyte that the biosensor is able to detect – we also evaluated the classes distinction performance of the LDA-derived separation line for decreasing analyte concentration values.
The proposed method was able to correctly distinguish all samples (100% accuracy) for analyte concentrations above or equal to 3.89 μg/mL (8.74E+10 particles/mL) and 90% of the total number of evaluated samples for an analyte concentration of 1.22E−03 μg/mL (2.74E+07 particles/mL). Thus, our method does not require bulky equipment, fluorescent probes, or antibodies, being mainly characterized by a spherical polymeric lens on the top of an optical fiber and a photodetector. Despite being validated just for the particular case of synthetic nanoparticles with similar size, physical properties and considering matching physiological concentration values, this study can provide useful information, as a preliminary validation step of a possible method for the biological nanostructures differentiation method. We postulate that the present study could be the first step towards the future development of a novel device for EVs and other biologic nanoparticles detection and classification.
Materials and methods
In the following sections, the fabrication method of the polymeric micro-lens on the top of a cleaved end of an optical fiber, the optical setup mounted to collect the back-scattered signal, as well as the nanoparticles detection method through signal analysis will be detailed. The optical fiber used along the study was a Thorlabs single mode fiber (SMF @ 980 nm) with the reference SM 980–5.8-125 (Thorlabs, Newton, NJ, USA). Polystyrene nanoparticles from NANOCS® with a diameter of 100±10 nm were used in the experiments. These nanoparticles were supplied by NANOCS® as 1% suspensions in aqueous solution, and were stored at 4°C when not used to avoid any damage.
Polymeric micro-lens fabrication method
The spherical lens on the top of an optical fiber used to tightly focus the laser beam was fabricated through a self-guided photopolymerization method previously developed by our lab in collaboration with Soppera and colleagues.22–25 According to previous studies also conducted by our lab,18,19,21 these lenses are able to simultaneously trap and capture enough information through the light scattered by the trapped particle to identify its type, for particles with diameters above 1 μm. However, considering that the total optical force exerted on a given particle results from the sum of the scattering and the gradient forces, and that both depend on the particle diameter, the optical trapping of nanoparticles (with diameters below 1 μm and, therefore, beyond the light diffraction limit) is not expected.26 The strong decrease of trapping forces with the nanoparticle radius is not compatible with its stable immobilization.26 Although the trapping of nanoparticles using this type of lenses is not expected, taking into account its geometry and properties, there is previous evidence that they are able to capture significant information for the detection of nanostructures.18,19,21 Thus, the same fabrication method as the one employed to fabricate the spherical lenses for simultaneous trapping and sensing in our previous studies was applied here. It consisted of the assembly of cross-linked polymeric structures through monomers linking, triggered by light of a specific wavelength. Since pentaerythriol triacrylate and the solution commercially known as Irgacure 819 were used as monomer and photo-initiator in this polymerization reaction, respectively, and the latter is sensitive to wavelength values between 375 and 450 nm, a violet 405 nm laser was used to trigger the chain reaction. The fabrication method is composed of several steps. In the first stage, an optical fiber is cleaved at one of its extremities and is positioned vertically in a moving stage, in a way to inject the violet laser light at its distal end. After the laser is correctly aligned, the fiber extremity to be polymerized is slowly dipped into a solution of 0.2% of photo-initiator relative to the monomer. After this, the end of the fiber was carefully removed from the solution, and a liquid drop was formed in its extremity. Then, the laser was turned on and the drop cured. After washing out the non-polymerized remaining liquid on the fiber extremity with ethanol, a waveguide-like tip aligned to the fiber core with a spherical shape is possible to obtain on the top of the optical fiber. The visual aspect of this structure is depicted in Figure 1.22–24 This micro-lens is assembled on the top of the fiber due to a self-guiding effect, since, during photopolymerization, the refractive index of the growing tip increases, creating a self-assembly effect, reaching a value of 1.52 when completely polymerized. The most delicate procedure from all the fabrication method was the injection of light from the laser into the optical fiber. Considering that the fiber employed behaves as a multimode fiber at the photopolymerization wavelength, the fiber mode to be excited must be carefully chosen. Considering that, by exciting the optical fiber fundamental mode, a spherical tip whose diameter perfectly matched to the fiber core could be obtained at the cleaved extremity of the fiber,22–24 this was the mode selected to excite in this experiment. However, there are other factors that could influence the final geometry of the micro-lens.27 Polymerization laser exposure time, laser intensity, or the length/curvature radius of the monomer/initiator solution drop are parameters which determine the final geometry of the tip. Such attributes were already optimized in previous studies.21–24 The optimal parameters of an exposure time of 60 seconds and a laser irradiation power of 5 μW at 405 nm were employed in the fiber tip fabrication process.
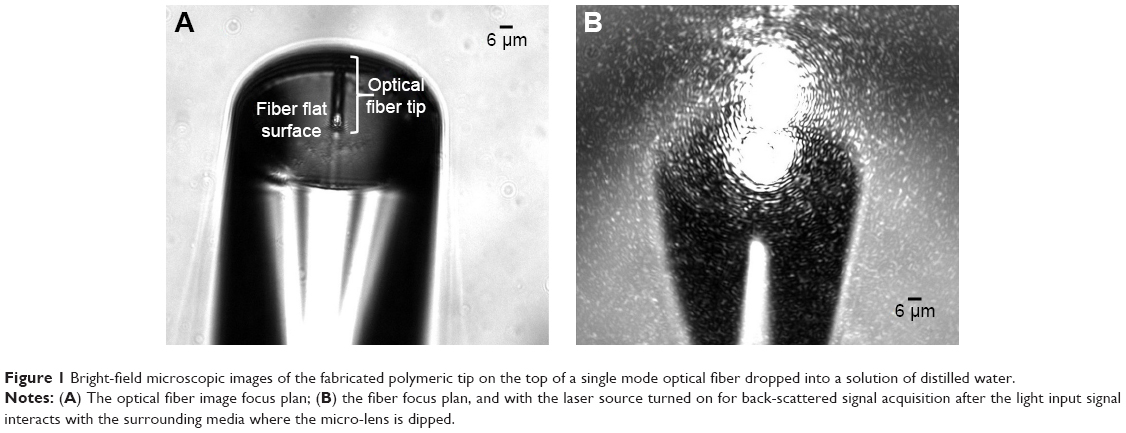 | Figure 1 Bright-field microscopic images of the fabricated polymeric tip on the top of a single mode optical fiber dropped into a solution of distilled water. |
Optical setup for back-scattered signal acquisition
The optical setup mounted to manipulate the fabricated fiber tool with the polymeric micro-lens on its top is depicted in Figure 2. consists of an inverted microscope (Zeiss Axiovert 200M microscope, from Carl Zeiss®, Oberkochen, Germany) controlled via a computer using the dedicated software Micro-Manager 1.3 and equipped with a digital camera (CoolSnap HQ from Roper Scientific, Sarasota, FL, USA) for visualization and image acquisition.
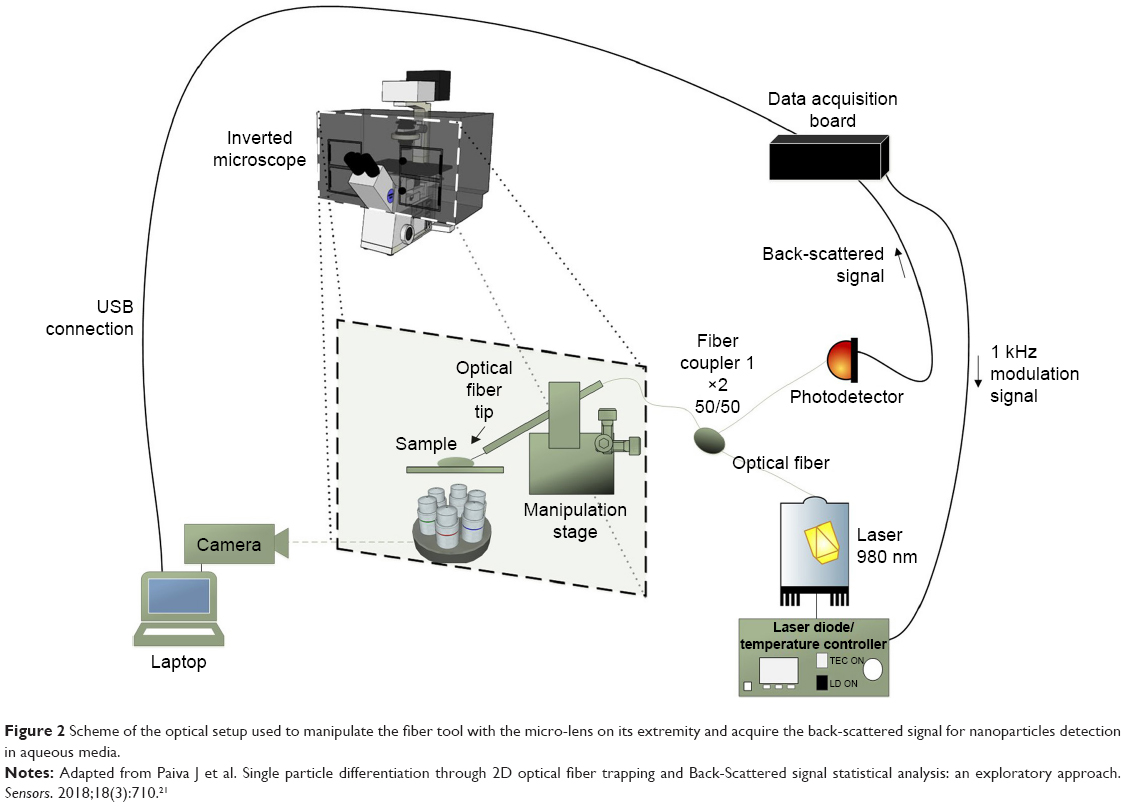 | Figure 2 Scheme of the optical setup used to manipulate the fiber tool with the micro-lens on its extremity and acquire the back-scattered signal for nanoparticles detection in aqueous media. |
A motorized micromanipulator from Eppendorf® (Hamburg, Germany) with four degrees of freedom (x, y, z, and angular) was included in the setup to hold a capillary with the fiber tool inside. A 980 nm laser (500 mW, Lumics, ref. LU0980M500) – linearly polarized light – was used to irradiate each sample (distilled water or distilled water containing polystyrene nanoparticles in different concentrations). An optical fiber coupler (configuration type 1×2, 50/50@980 nm) was used to connect the laser to the fiber tip on the top of the optical fiber and to a photodetector (PDA 36A-EC, Thorlabs) to acquire the back-scattered signal. One of the ports of the optical coupler from the double extremity side was connected to the laser, while the other port was connected to the photodetector that was connected to the laptop. The other single port from the opposite side of the coupler was spliced to the optical fiber with the polymeric tip, which was previously inserted into the metallic capillary positioned into the motorized micromanipulator tilted at an angle of 50°.
This bi-directional configuration allowed the light to be transmitted in both the directions through the optical fiber, at the same time: from the laser source to the micro-lens on the top of the fiber; and from the surrounding environment (scattered radiation) collected at the end of the polymeric tip towards the photodetector. An acquisition board (DAQ) from National Instruments (Austin, TX, USA) was used to connect the photodetector to the computer for signal acquisition and to modulate the laser source, using a 1 KHz sinusoidal signal, to allow synchronous detection of the back-scattered signal in a frequency band with lower electronic noise.21,28 Both the modulation and back-scattered signals were generated and recorded, using custom-built MATLAB® scripts that use functions from the Data Acquisition Toolbox from MATLAB®2015a. The laser power at the output of the micro-lens was set to 105±3 mW.
After the above setup was mounted, the signal acquisition procedure to obtain the data model for nanoparticles detection in aqueous solution was based on a simple assay. A 4 mL drop of each one of the solutions described in Table 1 (distilled water only – Solution 1 – and distilled water with 100 nm polystyrene nanoparticles from NANOCS® (New York, NY, USA) in suspension in different concentrations) was placed over a 35 mm Ibidi® micro rounded dish mounted over the inverted microscope. Then, the polymeric fiber tip was immersed in each solution, the laser was turned on, and the back-scattered signal acquired. A more detailed description about the signal acquisition and processing procedures is provided in the following section.
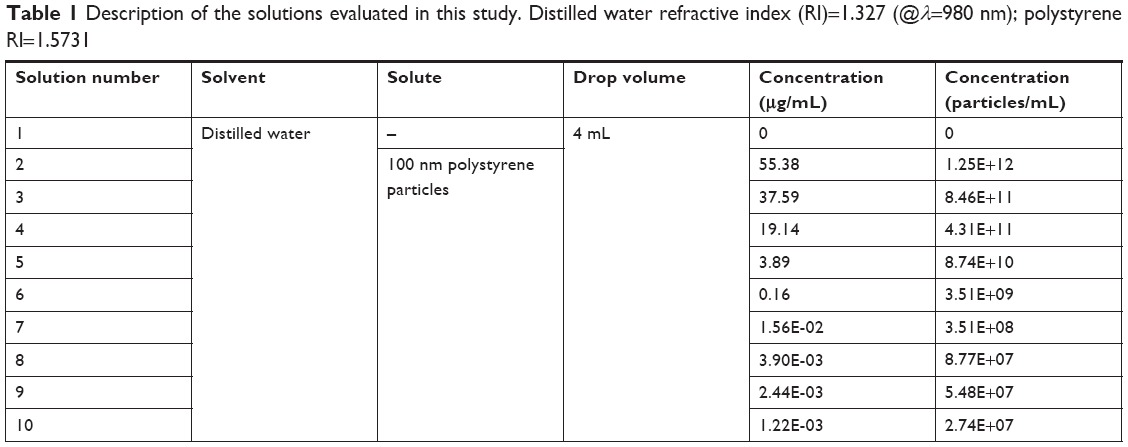 | Table 1 Description of the solutions evaluated in this study. Distilled water refractive index (RI)=1.327 (@λ=980 nm); polystyrene RI=1.5731 |
Nanoparticles detection using the polymeric micro-lens
Both the signal acquisition and nanoparticles detection model calculation procedures were performed using custom-built MATLAB® R2015a scripts, using functions provided from the Signal Processing and Statistics Toolboxes from MATLAB®.
Back-scattered signal acquisition and processing steps
Once the polymeric tip was immersed in each one of the solutions of Table 1 and the laser turned on at a power 105±3 mW @980 nm, 60 seconds of back-scattered signal were continuously acquired for 10 different fiber tip positions within the sample. In order to simulate a real scenario, the polymeric fiber tip was randomly displaced (toward any of the three x, y, and z directions) within the sample between different acquisitions for the same solution. Considering that, in a real situation, the proposed method should be able to identify the presence of nanoparticles from a specific type independent of the location where the fiber probe was dipped into the sample, several acquisitions were, therefore, performed for different positions of the probe, even at different micro-lens height relative to the micro dish bottom or to the solution surface. The back-scattered signal acquisitions were recorded via a photodetector connected to the laptop through the data acquisition board (DAQ from National Instruments, Austin, TX, USA) at a sampling rate of 5 KHz. At the end of the experiment, a total of 6,000 seconds of back-scattered signal were acquired.
The signal processing procedure applied here was already successfully adopted in previous studies to differentiate types of microparticles, bacteria, and cells.18,19,21 It consists of a sequence of stages that were applied to each acquisition with a duration of 60 seconds considering each fiber tool position and solution from Table 1, resulting in a dataset composed of short-term signal portions of 2 seconds (please consult Figure 3 for a scheme explaining all the steps performed since signal acquisition to class differentiation). Two classes were considered to allow nanoparticles identification in a solution: “No polystyrene nanoparticles present in the solution” – Solution 1 from Table 1 – and “Polystyrene nanoparticles present” – solutions 2–10 from Table 1. According to this scheme, each 60 seconds acquisition is at first segmented in 2-second signal portions (after signal processing procedure). Then, a set of 53 features including time- and frequency-domain parameters representing each 2-second segment is extracted from the recently generated dataset. As it would be difficult to design an interrogation system able to read, at the same time, all the 53 parameters for sensing purposes or to build a decision function taking into account so many attributes, we applied a features dimensionality reduction method – the LDA29–32 – to obtain the two most representative features from the entire dataset. Each feature resulted from a weighted linear contribution of the original 53 parameters. After creating these two novel features for each 2-second signal portion, fiber tool position and solution (from the ones characterized in Table 1), the discriminant function corresponding to the LDA-derived 2-classes separation line was calculated.31,32 In order to determine the LOD of the proposed method, the number/percentage of fiber tool position spots analyzed that were misclassified, taking into account the previously calculated separation line, was evaluated for the several nanoparticles concentration values tested (Table 1). The following section contains a more detailed description about the LDA and the calculation of the linear discriminant function.
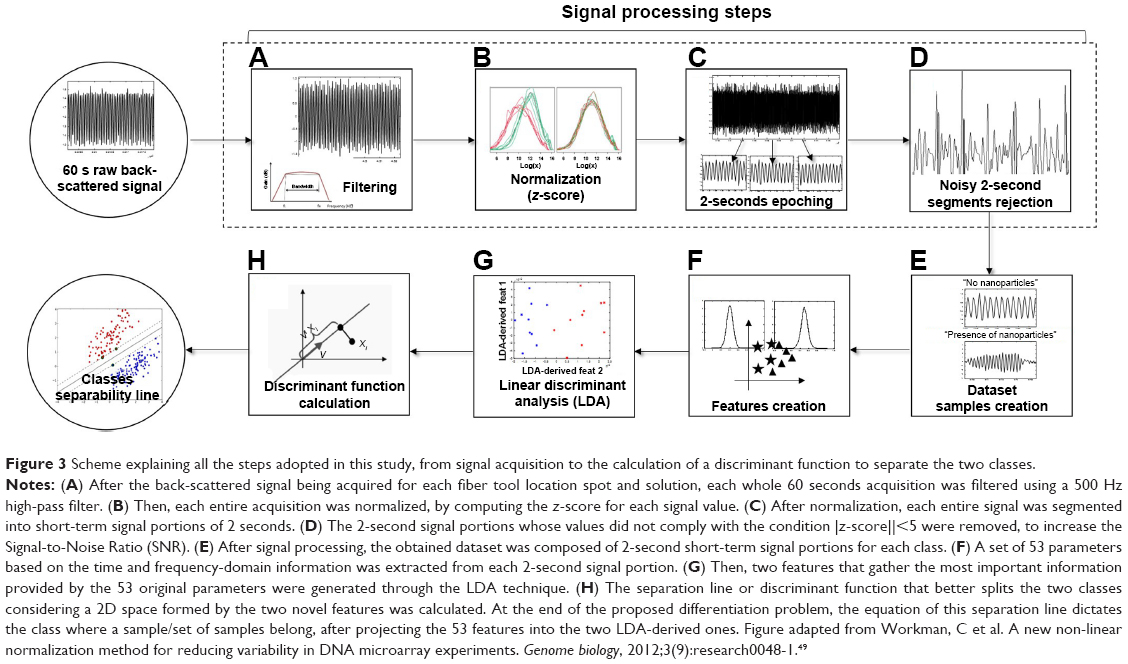 | Figure 3 Scheme explaining all the steps adopted in this study, from signal acquisition to the calculation of a discriminant function to separate the two classes. |
The signal processing method consisted of the following steps: filtering, normalization, epoching, and artifact rejection (stages A, B, C, and D of Figure 3, respectively). The signal was, at first, filtered using a Butterworth high-pass filter with a cutoff frequency of 500 Hz to remove low-frequency interferences, since the input laser signal was modulated using a 1 kHz sinusoidal function. This type of filter was already successfully applied in previous microparticles type differentiation problems using the light scattered by the immobilized target by optical trapping.18,19,21,28 In order to standardize comparisons, the z-score for each 60-seconds acquisition for each fiber location acquisition and solution was computed, by subtracting the mean over the 60-seconds signal to each signal value and dividing the obtained result by the SD of the whole 60-seconds acquisition. This reduced the influence of possible differences on signal amplitude due to the amount of light collected by the lensed tip, considering the acquisition spots located at different heights. Then, the z-scored signal was split into 2-second short-term signal portions. In order to improve the Signal-to-Noise Ratio, the noisy 2-second segments of the back-scattered signal were removed from the dataset if some of their values exceeded, in magnitude, the threshold of |z-score||=5.
Plots of signal portions for each class (“no nanoparticles present in media” vs “nanoparticles present”) are provided in Figure 4. Frequency amplitude spectrum profiles for each class and considering different nanoparticles concentration values are provided in Figure 5. After signal processing, we obtained a final dataset composed of 2-second back-scattered signal portions (see Table 2 for a characterization of the final dataset obtained).
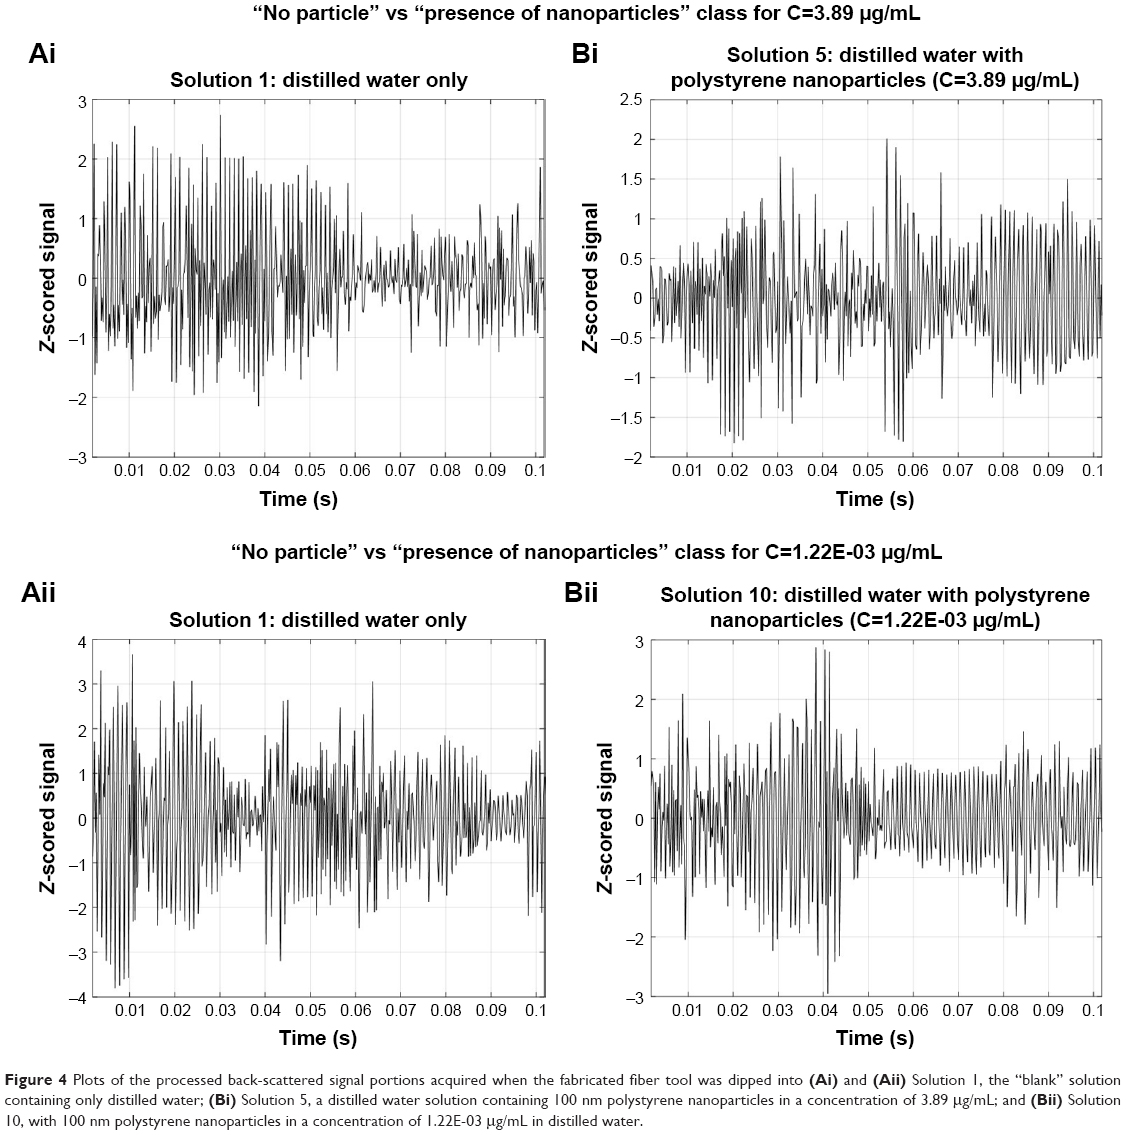 | Figure 4 Plots of the processed back-scattered signal portions acquired when the fabricated fiber tool was dipped into (Ai) and (Aii) Solution 1, the “blank” solution containing only distilled water; (Bi) Solution 5, a distilled water solution containing 100 nm polystyrene nanoparticles in a concentration of 3.89 μg/mL; and (Bii) Solution 10, with 100 nm polystyrene nanoparticles in a concentration of 1.22E-03 μg/mL in distilled water. |
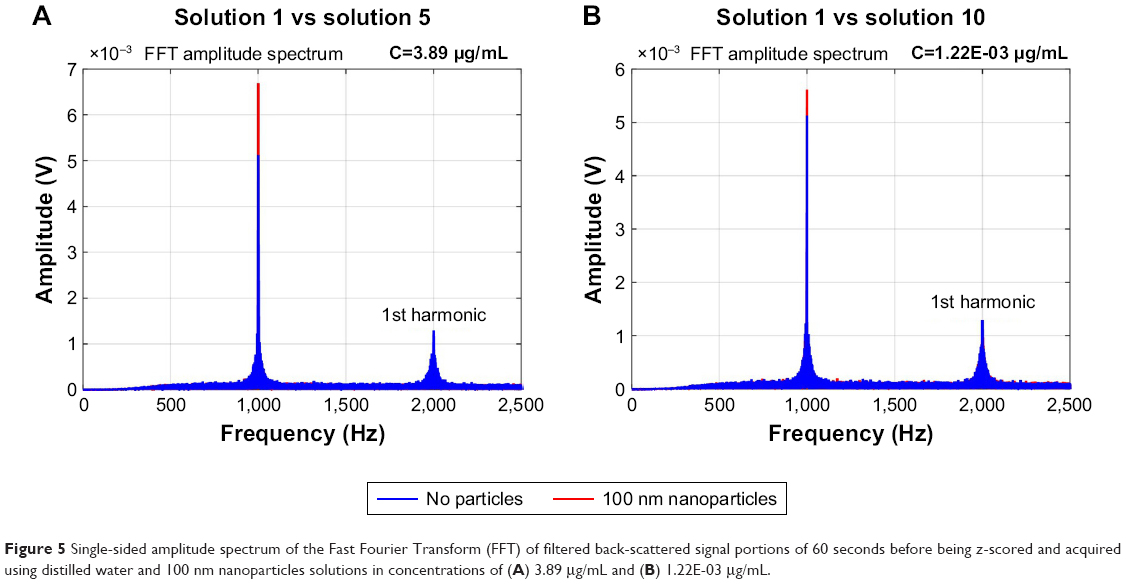 | Figure 5 Single-sided amplitude spectrum of the Fast Fourier Transform (FFT) of filtered back-scattered signal portions of 60 seconds before being z-scored and acquired using distilled water and 100 nm nanoparticles solutions in concentrations of (A) 3.89 μg/mL and (B) 1.22E-03 μg/mL. |
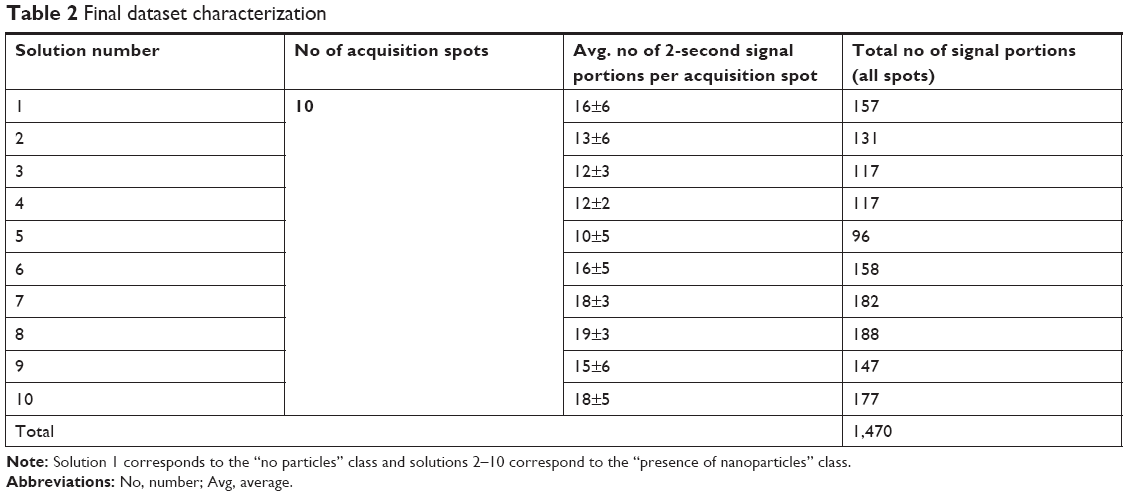 | Table 2 Final dataset characterization |
Nanoparticles detection using short-term back-scattered signal portions
After signal processing and dataset creation, a set of 53 frequency- and time-domain features were extracted from each of the 2-second back-scattered signal portions. These parameters are enumerated in Table 3 and described in the following sub-section. Its relevance for target type differentiation was already assessed in previous studies, however considering scatterers with dimensions higher than or equal to 1 μm.18–21
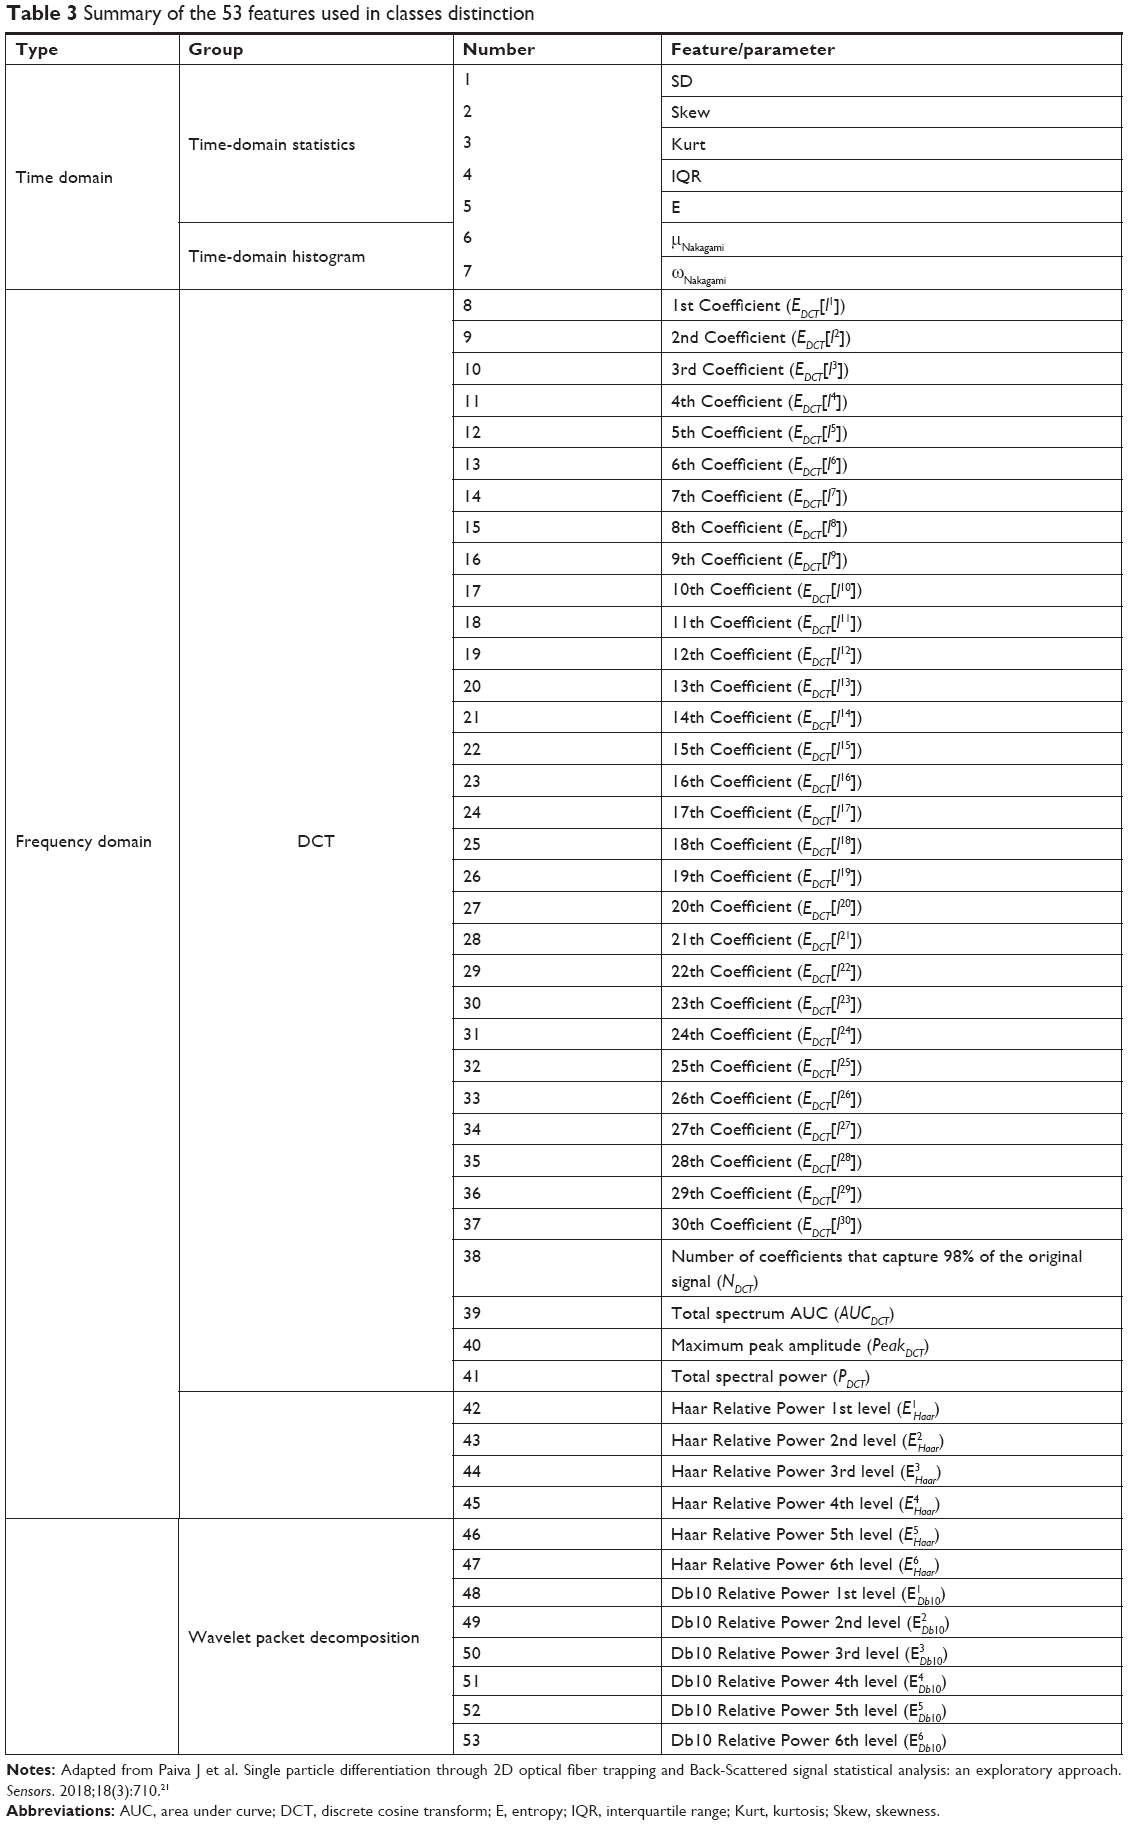 | Table 3 Summary of the 53 features used in classes distinction |
Back-scattered signal-based features
Both time- and frequency-domain signal-derived features were used. The original 53 features set can be divided into four categories: time-domain statistics; time-domain histogram; frequency-domain Discrete Cosine Transform (DCT); and frequency-domain wavelet-derived parameters. The following attributes were considered within the scope of the time-domain statistics: SD, Skewness (Skew), Kurtosis (Kurt), IQR, and Entropy (E).
Taking into account the adequacy of the Nakagami distribution in describing biological-derived back-scattered echos in statistical terms,33 the two parameters μNakagami and ωNakagami, derived from the Nakagami distribution Probability Density Function, were also included in the features set. Both parameters were tuned to better fit the approximation corresponding to each 2-second signal portion distribution to the Nakagami distribution. In total, seven time-domain features were created to characterize each short-term signal portion.
In order to extract frequency-domain information from the back-scattered signal, the DCT was used in detriment of the widely used Fast Fourier Transform. The latter injects high-frequency artifacts in the transformed data, mainly when applied to short-term signals, thus generating parameters that contain noisy information. In contrast, the DCT is able to capture minimal periodicities of the analyzed signal and export that information into uncorrelated coefficients that can be used as non-redundant features.34 Taking into consideration that the first n coefficients of the DCT of a scattered signal are defined by the following equation:35
|
|
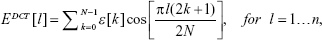
where ε is the signal envelope calculated using the Hilbert transform; by sorting the DCT coefficients from the highest to the lowest magnitude value and obtaining the following vector:
|
|

in which EDCT[l1] represents the highest DCT coefficient in magnitude, it is possible to determine the percentage of the total amount of the signal energy that each set of coefficients represents (organized from the highest to the lowest one). The percentage of the total of the signal energy represented by the first to the nth coefficient of the vector number two can be obtained by dividing the norm of the vector formed by the first till the nth coefficient by the norm of the vector comprising all the coefficients. After calculating the DCT for each 2-second back-scattered signal portion, the following parameters were extracted: the number of coefficients needed to represent 98% of the total energy of the original signal (NDCT), the first 20 DCT coefficients extracted from the vector defined in equation (2), the Area Under the Curve (AUC) of the DCT spectrum (from 0–2.5 kHz) (AUCDCT), the maximum amplitude of the DCT spectrum (PeakDCT), and the signal power spectrum obtained through the DCT considering all the values within the frequency range analyzed (PDCT) (Table 3). The remaining 12 frequency features were derived from short-term signal portion decomposition using wavelets.35 Frequency information extraction through wavelets is a widely used signal processing technique, mainly in underwater species, and targets recognition through scattered echos.35 Two types of mother wavelets were considered, taking into account their simplicity degree: the Haar and Daubechies (Db10).35 Six features were then created per mother wavelet, for each short-term signal portion, based on the relative power of the corresponding wavelet packet-derived reconstructed signal (one to six levels) (see Table 3).
The LDA for features of dimensionality reduction
The LDA, also known as Fisher Linear Discriminant method, is a simple and widely used multivariate statistical technique.29,36 Fisher LDA is currently used both for dimensionality reduction and classes distinction (classification).29,36 It aims to find the linear combination of a set of features that best separates two or more classes in a pattern recognition problem.36 This linear combination is represented in a subspace of lower dimension, in comparison to the original dataset, in a form of a separation curve/hyperplane, in relation to which the data points of the original problem are “separable”. Since the inclusion of redundant features in a binary/multiclass differentiation problem could introduce noisy information in the classification decision task, we applied the LDA to the original set of 53 features, in order to find their best projection onto a final set of two LDA-derived attributes that separates the two classes considered. Then, we verified the interclass distinction power associated to the separation line of the projected final features.
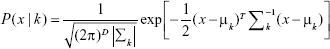
The original LDA/Fisher Discriminant Analysis algorithm was, at first, proposed for binary problems. Then, several generalizations were proposed for multiclass approaches.29,36 Starting with the most simple case, suppose we are observing a sample of data – D-dimensional, with mean vector μ and covariance matrix Σ drawn from two classes, each described by a multivariate normal density, defined by:37
|
|
for classes k=1, 2. Fisher, who derived the discriminant analysis, started to search for a direction q, maximizing the separation between the two classes, according to:37
|
|
The separation between classes is then maximized for q=Σ−1(μ1−μ2), corresponding to maximize the distance between the means between the two classes and, at the same time, to minimize the variance in each class. Considering a two-dimensional (2D) space (two features characterizing each class), the separation hyperplane would, therefore, be a one-dimensional (1D) line, and the values corresponding to the original data samples would be converted into the distance to the separation line (Figure 6).36
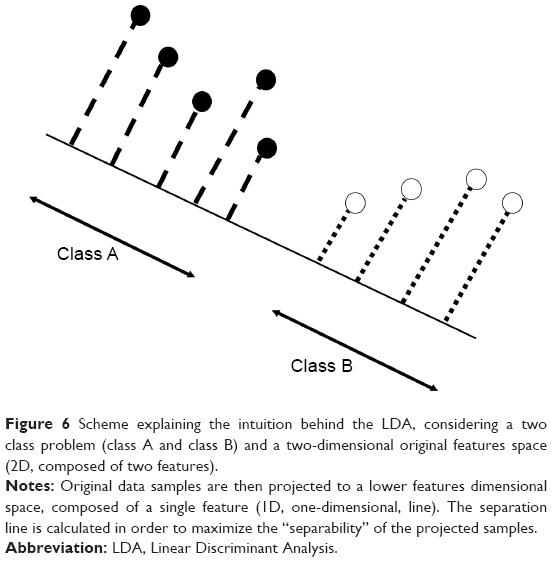 | Figure 6 Scheme explaining the intuition behind the LDA, considering a two class problem (class A and class B) and a two-dimensional original features space (2D, composed of two features). |
The LDA-derived hyperplane was then used in this particular problem for several purposes: dimensionality reduction, classification and interpretation of the importance of the set of features originally chosen (by calculating the corresponding coefficient of the projection line for each feature).29,36 However, due to intrinsic amplitude differences between features and in order to project them to the same values space range, a normalization procedure had to be applied to each sample of the original dataset, before performing the LDA. The samples average value across each feature was subtracted to each data sample from that feature, and then divided by the corresponding feature SD.29
In this particular binary separation problem, since our final aim was to determine the most suitable 1D separation line for each solid phase concentration value evaluated (for facilitating visual interpretation and to reduce computational complexity), we projected the original set of 53 time- and frequency-domain features into two final ones. The performance evaluation method regarding each LDA-derived separation line calculated for each nanoparticle concentration is described in the following paragraph. The LDA was performed using the Statistical Pattern Recognition Toolbox38 for Matlab®.
Classes separation performance evolution with nanoparticles concentration using linear discriminant functions
After normalizing each data sample according to each feature’s mean and SD values as described above, and projecting the original 53 features into the two final LDA-derived features, for each nanoparticles concentration value evaluated (solutions 2–9 from Table 1), the “separability” performance/efficiency of the calculated projection line was evaluated.
Taking into account the simplest case (two dimensions/two features – x and y space – and two classes), we can determine the best projection vector – slope of the separation line – resultant from the LDA, starting by considering the mean vector of each class in the x-space and y-space by:29,36
|
|

|
|
Since Fisher suggested to maximize the difference between the means, normalized by a measure of the within-class scatter to find the best separation line, we can define, for each class, the scatter, an equivalent of the variance, as:29,36
|
|
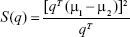
Thus, the equation of the Fisher linear discriminant function (eg, the equation that defines the separation line) is defined by the linear function wTx that maximizes the criterion function:29,36
|
|
in which  represents the within-class scatter of the projected samples. If we consider that the within-class scatter matrix SW and the between-class scatter matrix SB are correlated with both the projected means and scatter values
  and
and  , respectively, by:25,32
|
|

|
|
Then, the Fisher criterion is given by:25,32
|
|

By solving the generalized eigenvalue problem (SW−1SBw = Jw), it is possible to determine the direction (w*) of the optimal separation hyperplane by taking:25,32
|
|
Note that, for the simplest case considered (2D space – two features, two classes) such hyperplane is a line.
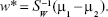
The above equations and assumptions were, therefore, considered in this particular binary problem. After calculating the values of the two projected LDA-features (LDA-derived features 1 and 2) for each data sample (for each class and solution), the data points corresponding to each acquisition spot and class were averaged and its mean represented in the 2D graphical space (corresponding to the graphical representation of LDA-derived feature 1 vs feature 2) containing the LDA-based separation line calculated using equations 5–12, and all the mean values of the remaining acquisition locals for each class (see Figure 7). Then, the number of signal acquisition spots (from 1–10, see Table 2) whose class assignment (“no particles” vs “presence of nanoparticles”) was correctly performed, was determined for concentration value. This was done by considering the geometrical representation of each data sample 2D mean point in relation to the LDA-derived 1D line separation, and to the other mean points belonging to the same class. The separation performance of the two projected LDA-derived features as well as the separation line was evaluated for each nanoparticles concentration value, in order to determine the nanoparticles concentration corresponding to the LOD for this technique and binary separation problem in particular. Classes separation was evaluated, by verifying if the LDA-derived separation line was able to correctly split data samples into two different classes and assign each sample to the correct one. Nine binary distinction problems were therefore performed: solutions 1 vs 2; solutions 1 vs 3; solutions 1 vs 3; solutions 1 vs 4; solutions 1 vs 5; solutions 1 vs 6; solutions 1 vs 7; solutions 1 vs 8; and solutions 1 vs 9.
 | Figure 7 2D representation of the mean projected values considering each different acquisition spots and classes for the two final LDA features and corresponding separation line for nanoparticles concentration values (A) 55.38 μg/mL; (B) 37.59 μg/mL; (C) 19.14 μg/mL; (D) 3.89 μg/mL; (E) 0.16 μg/mL; (F) 1.56E-02 μg/mL; (G) 3.90E-03 μg/mL; (H) 2.44E-03 μg/mL; and (I) 1.22E-03 μg/mL. Red dots represent the class “no particles” and blue squares represent the class “presence of nanoparticles”. |
Results and discussion
Dimensionality reduction through LDA
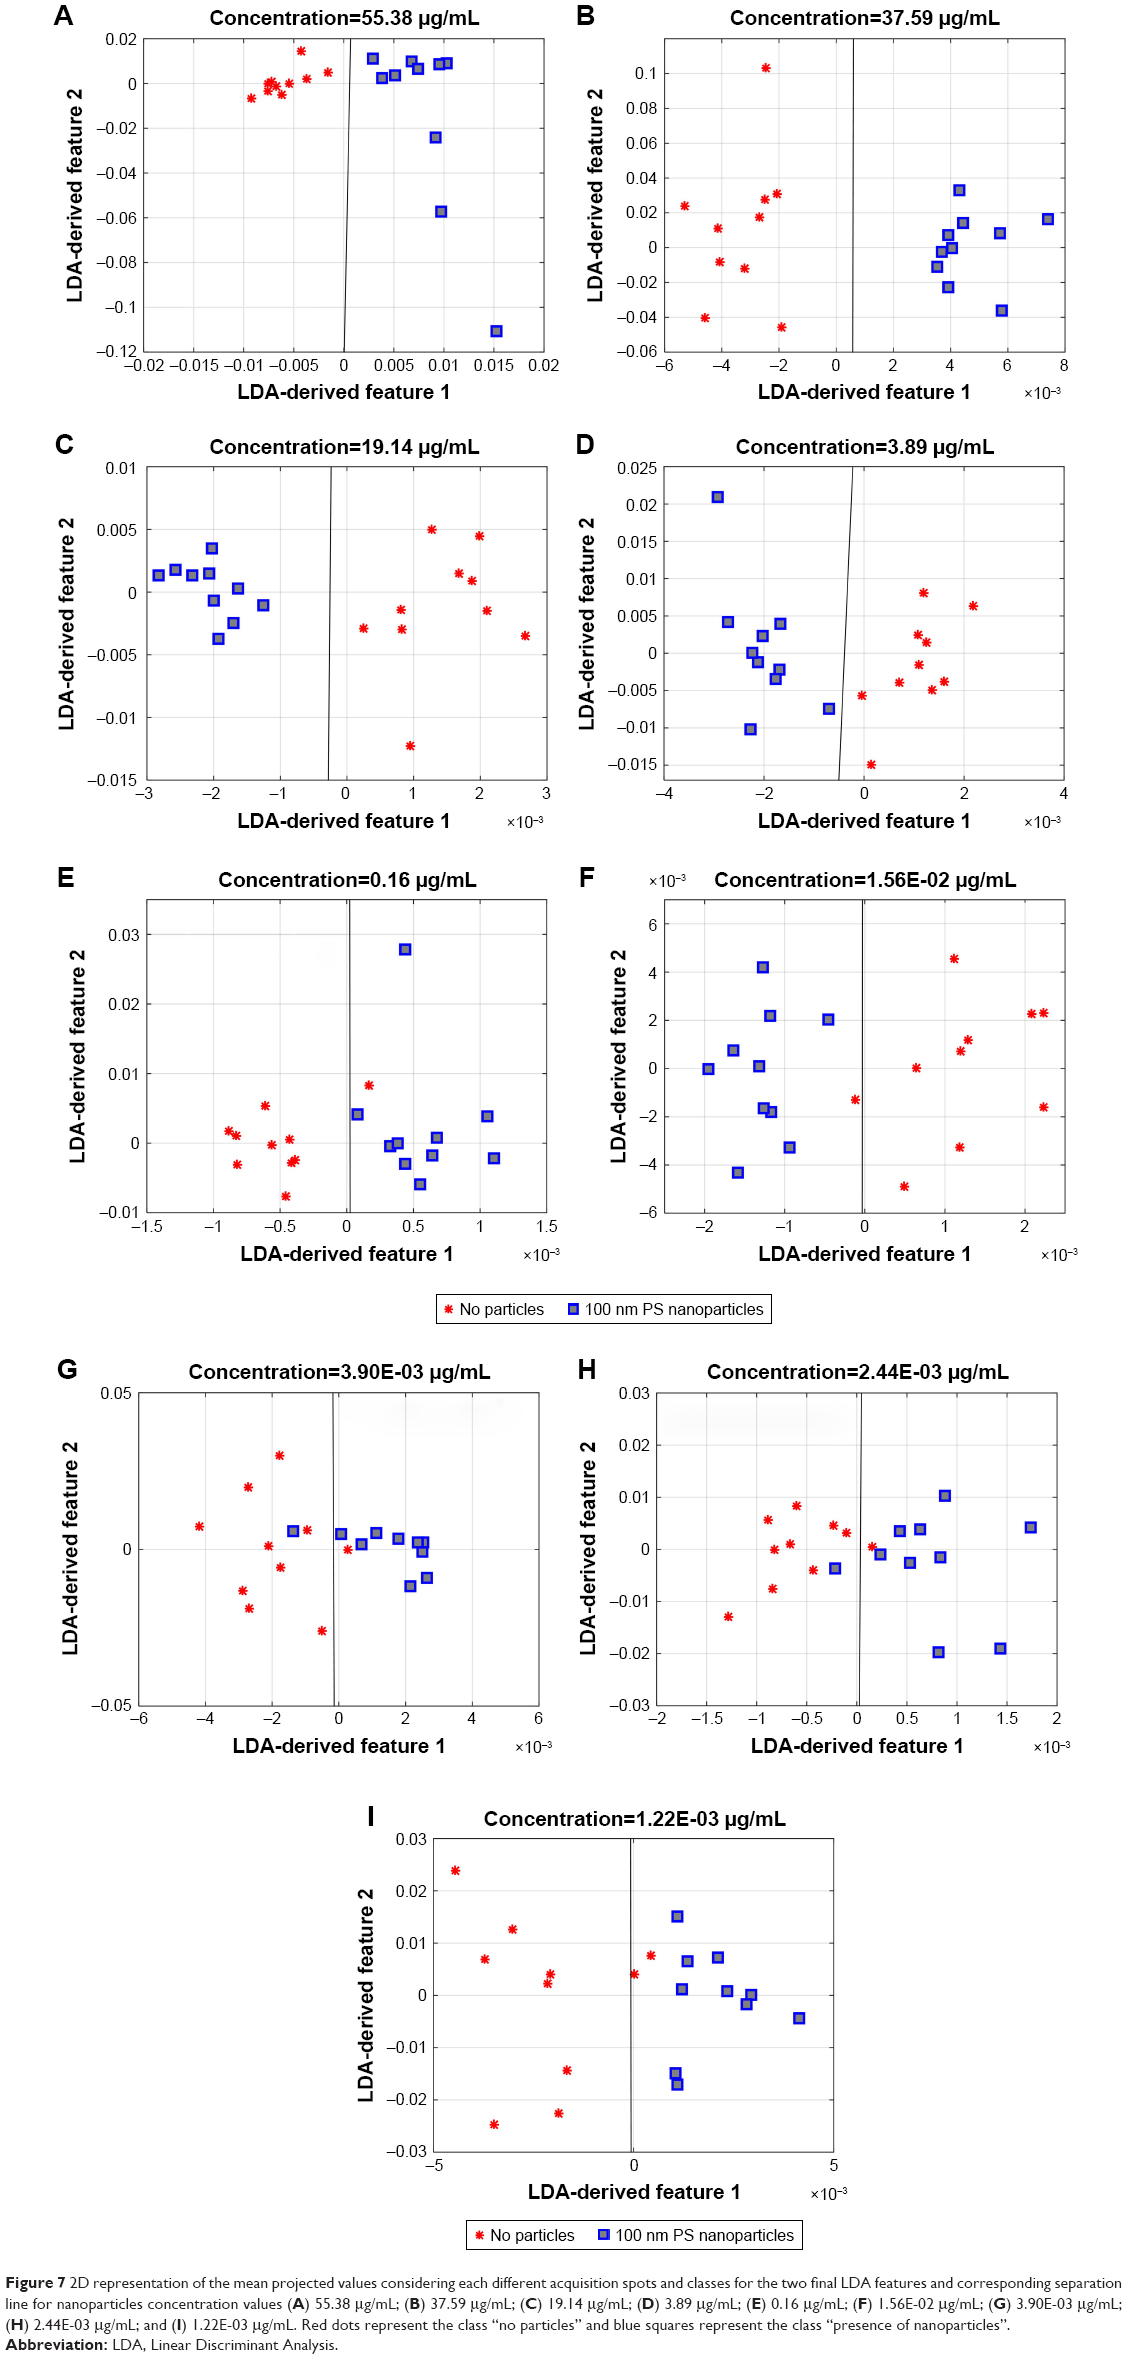
For all the solutions evaluated (from 1–10, Table 1), we were able to project the original set of 53 features into only two. In order to understand the most relevant information for nanoparticles detection in aqueous media, we identified the most important features for classes differentiation, according to the associated projection coefficients that contributed for calculating the first LDA-derived feature (LDA feature 1). This feature corresponded to the linear discriminant component most significant for classes differentiation, from the two generated through the LDA. It can be determined by comparing the eigenvalues of the corresponding eigenvectors. The eigenvector with the higher eigenvalue corresponds to the most significant linear discriminant component, the first LDA-derived feature.29,36 In this particular case, all the binary problems evaluated (except the one involving solution 5) showed the same set of features as the five most representative ones for the differentiation problem. Their enumeration and corresponding coefficients representation for each binary problem can be found in Figure 8.
 | Figure 8 The five most important features for binary distinction problems involving nanoparticles solutions with concentrations of 1.22E-03 (solution 10), 2.40E-03 (solution 9), 3.90E-03 (solution 8), 1.56E-02 (solution 7), 0.16 (solution 6), 19.14 (solution 4), 37.59 (solution 3), and 55.38 μg/mL (solution 2), according to LDA and corresponding coefficients magnitude. |
As expected, taking into account the recent evidences found in our studies about trapped microparticles type identification through back-scattering,18–21 the frequency components of the back-scattered signal are highly relevant features for scatterers detection/identification in aqueous solutions. In fact, one of the features associated with the highest features projection coefficient absolute value in the majority of the cases was the fourth level power of the Db10 wavelet-derived signal. The wavelet-derived characteristics were already considered the most suitable attributes for targets distinction in multiclass problems including bacteria type detection18 or synthetic microparticles and simple cells distinction and isolation.21 However, results show a slight but uniform dependence of the projection coefficients magnitude regarding the frequency-related features with nanoparticles concentration (Figure 8). In fact, the magnitude of the projection weight of EDb104 in the first LDA-derived feature is the lowest, for the lowest concentration value, increases with the increase of nanoparticles concentration till certain value, decreases again for intermediate concentration values and, then, increases for maximal concentrations.
Projection weights associated with the DCT-derived features EDCT[l5] and EDCT[l6] also showed magnitude fluctuations for different nanoparticles concentration values. Interestingly, coefficients magnitude was maximal for minimal concentrations for these features, decreased for intermediate concentrations, and then increased for higher nanoparticles concentration values. This suggests that a different kind of frequency information is more suitable for classes distinction considering different nanoparticles concentration values. Probably, DCT-derived features are more relevant for nanoparticles detection in lower concentration values, while wavelet-based variables contain more important information for detecting nanoparticles at higher concentration values. Coefficients of time-derived parameters ωNakagami and μNakagami features show a similar behavior with nanoparticles concentration. They both decrease in amplitude for comparisons from low-to-intermediate nanoparticles concentration values. However, according to LDA, classes separation problems involving high solid phase concentration solutions are highly influenced by contributions from Nakagami time-related signal characteristics.
The only separation problem where the five most representative features set did not match the one of Figure 8, was the separation problem involving solution 5 (nanoparticles concentration of 3.89 μg/mL). In this particular case, the five most significant features for the differentiation problem were: EDCT[l1]; EDCT[l2]; EDb44; ωNakagami; and μNakagami.
Taking into account that the contribution weights of the five top features range, in general, considering all the solutions compared, between ≈0.08 and ≈0.87, the contribution of any other feature from the remaining 48 can be considered negligible. In fact, the relevance degree of their contribution to the classes distinction problem is, according to LDA, so low that they can be discarded. This is an important conclusion for future studies, since we discarded 48 features from an original group of 53. The remaining group can, therefore, be directly used for classification in future studies, without being projected into a lower dimensional features space, thus reducing computational complexity. This features set composed of five attributes is also robust to the target molecule concentration, not revealing relevant changes on its composition for different nanoparticles concentration values. Indeed, it was composed always by the same attributes.
Probably, these five features, mainly the frequency-derived ones, are able to capture the time dependence patterns of the back-scattered radiation intensity that characterize the colloidal solutions (containing the liquid phase, distilled water, plus the solid phase, PS nanoparticles). These time-dependent patterns were probably not observed for distilled water only, since nanoparticles dimensions – 100 nm – were large compared to the water molecules.39 Considering that PS nanoparticles were freely suspended in the aqueous solution, they were no longer stationary in the suspension media, rather they moved in a random walk fashion, dictated by a Brownian motion process.39 Thus, fluctuations on the scattering intensity that vary in time were introduced on the backscattered signal collected from the solution. These are, therefore, an indirect measure of the random walking of the nanoparticles39 and are probably the cause for this specific features set having enough information for detecting particles smaller than the wavelength of the light. Note that, according to other studies, phase characteristics of the signal are even able to distinguish subpopulations of different types of nanoparticles which are similar in size, but composed of different materials (or different optical polarizabilities).40 However, more detailed studies have to be conducted in order to confirm this hypothesis.
Nanoparticles detection through discriminant analysis
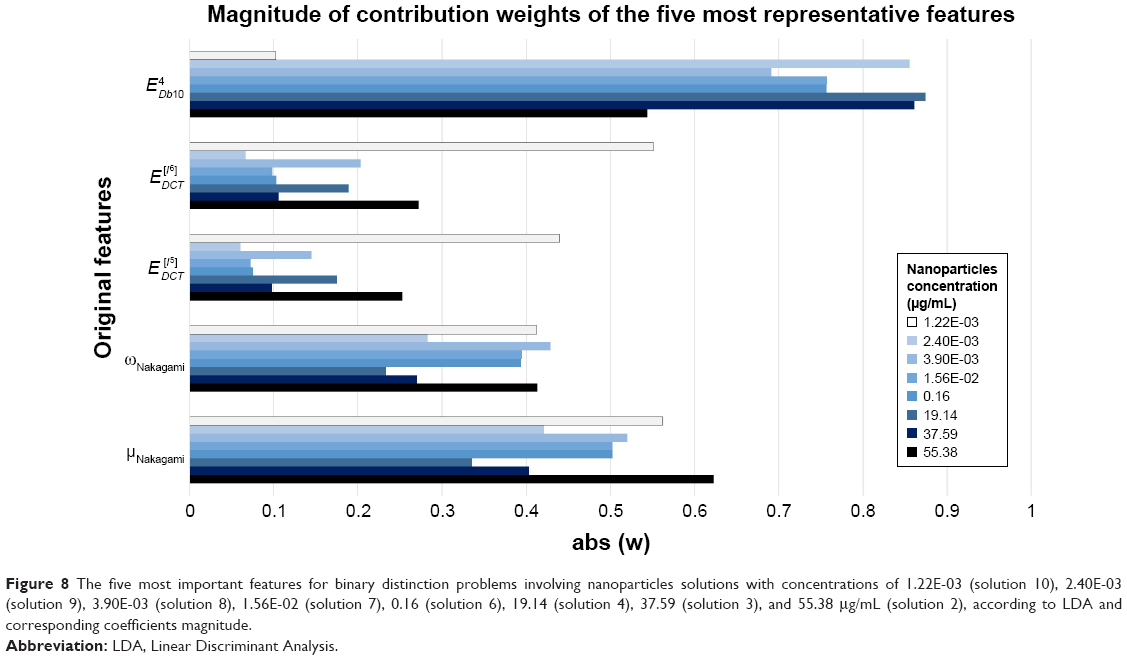
The number of correct class assignments vs total number of classifications performed (acquisition spots classified) for each one of the nine binary distinction problems, is provided in Figure 9. Class assignments were performed considering the location of LDA-derived separation line and features mean points for each sample, regarding each distinction problem, which are provided in Figure 7.
 | Figure 9 Number of correct class assignments (signal acquisition spots classified) vs total number of class assignments performed for (A) all nanoparticles concentration solutions; and (B) zoom in of (A) for low nanoparticles concentration values. |
Taking into account the information provided in Figure 9, it is possible to analyze the evolution of classes separability with the concentration of nanoparticles. Our method correctly identified the presence of 100 nm polystyrene nanoparticles in all the acquisition spots evaluated within the solution, for concentrations above or equal to 3.89 μg/mL (8.74E+10 particles/mL). It was also able to verify that no particles were present in the acquisition spots evaluated within solution one (containing only distilled water). For these target concentration values, the proposed method is therefore characterized by an accuracy, specificity, and sensitivity rate of 100%. However, its classes distinction performance starts to decrease for concentration values below 3.89 μg/mL. From 3.89–0.16 μg/mL inclusive, the accuracy of the method drops to 95% (19 acquisition spots correctly classified in a total of 20) (Figure 9B). Below or equal to 1.56E−02 μg/mL (3.51E+08 particles/mL) to the lower concentration analyzed (1.22E−3 μg/mL, 2.74E+07 particles/mL), the number of misclassified acquisitions increased to two, and the accuracy of the method decreased to 90% (18 acquisitions correctly classified in a total of 20). Considering these results, the LOD of the proposed method for an optimal accuracy (100% classes separation performance) corresponds to a nanoparticles concentration value of, at least, 3.89 μg/mL (8.74E+10 particles/mL). This value can be reduced to 0.16 μg/mL (3.51E+09 particles/mL), for the cost of a less conservative misclassification rate (95% of classes separation performance). For a higher error rate (of 10%) the LOD can be fixed in 1.22E−3 μg/mL (2.74E+07 particles/mL) (Figure 9B).
From Figure 7, it is possible to observe that, as expected, the distance that separates each LDA-derived feature mean points from each class to the separation line decreases with decreasing nanoparticles concentration values.
In fact, the lower the concentration of nanoparticles, the harder is the differentiation task between the classes “distilled water” vs “distilled water with nanoparticles” using the back-scattered signal, since their similarity degree increases. However, the number of misclassified samples is balanced between classes, along the several comparisons performed. This suggests equivalent performance values in terms of sensitivity and specificity of the proposed method. Equivalent sensitivity and specificity are a highly advantageous characteristic of a detection method, especially if its final application is related to the identification of human physiological analytes. For example, different types of EVs are present in circulating fluids in distinct proportions.41 Some cancer-related exosomes (expressing tumor-specific cargoes) are present in the plasma of tumor patients in significantly higher concentrations than other types of nano/microvesicles.4 A suitable EVs type isolation and detection method must be sensitive and specific, even if its target analyte is present in very tiny amounts in comparison to the other fluid compounds.
Although the reported results only validate the proposed method regarding the detection/identification of synthetic nanoparticles in aqueous solutions at low concentration values, this technique showed very advantageous characteristics that place it in a very competitive position and closer to the precise detection of more complex analytes, such as physiological EVs, lipoproteins, or virus. One of the main concerns related to the detection of such small structures is related with their constrained size – mainly in the range of 100–150 nm – which is far below the light diffraction limit.4,5,9,10 However, the proposed technique was shown to be suitable for the detection of nanoparticles in such size ranges. Another important constraint that must be considered is its LOD and the expected plasmatic levels of the different types of EVs and lipoproteins. For now, we have only the LOD reference values for the detection of polystyrene nanoparticles considering the proposed technique. However, this is not the only limitation.
Even if we had access to the LOD values regarding the detection of several types of EVs or lipoproteins using our technique, the plasmatic concentration values for the case of EVs considering human beings remain poorly understood.4,5 In fact, there is still several information about human EVs and tumor-derived exosomes (plasmatic levels, molecular contents, functions, predominance, etc.) that is currently not well understood.4,5,41 Usually, scientists only compare EVs plasmatic levels between patients and healthy donors, or use relative amounts to perform exosomes quantification studies.42 We must take into account that, currently, exosomes quantification and isolation are complex and time-consuming processes, including long-term affinity assays or/and consecutive ultracentrifugations.4,5,42 For these reasons, relative quantities are much more straightforward to report.42 However, despite being few, there are some studies where exosomes quantification in human samples from both patients and healthy controls have been performed.43,44 As an example, values for plasmatic levels of cancer-related exosomes, with dimensions of ≈100 nm, between 2.00E+12 and 3.00E+12 particles/mL were recently found in human plasma samples from patients with gastrointestinal stromal tumors,43 a value that is perfectly compatible with the LOD of our technique corresponding to the optical performance. A recent study also reported that mesenchymal non-small-cell lung cancer cells excrete exosomes characterized by diameters between 50 and 100 nm to the circulating fluids at concentration values between 4.00E+08 and 8.00E+08 particles/mL.44 This study was also performed using human-derived cell samples. Although this type of exosomes is found in lower plasmatic levels, they are still completely compatible with a performance between 95% and 100% for the detection of synthetic nanoparticles by our method. Non-cancer-related EVs, such as vesicles derived from the placenta of pregnant women, which have been associated to the systemic inflammation characteristic from the pre-eclampsia condition, have also been found in plasmatic levels compatible to the LOD of our method. Values between 107–108 particles/mL were found in the plasma of pregnant women diagnosed with pre-eclampsia.10 Platelet-derived EVs, which have shown suitable characteristics as atherosclerosis biomarkers, are physiologically present in plasmatic levels of 108–109 particles/mL, concentrations also within the range of the detection ability of the proposed technique.9
Regarding the concentration of lipoproteins, since their plasmatic concentrations are in the range of few grams per mL11 and, therefore, far above the LOD of the technique, the obtained results showed that its application should be easily extensible to the detection and identification of lipoproteins suggestive of atherosclerosis and other abnormal cardiovascular conditions. However, we have always to consider that there are several properties completely different between synthetic and complex biological nanoparticles, as the EVs or lipoproteins. One of these parameters is the refractive index. The refractive index of the polystyrene (1.57)45 is higher than any biological material. Considering that the higher the difference between the refractive index of the surrounding media and the particle, the higher is the amount of light scattered by the particle, the back-scattered light collected from suspended polystyrene nanoparticles should contain a higher amount of information than the light scattered by any other biological nanoparticle. Additionally, assays involving EVs or any other physiological nanostructure require that nanoparticles should be suspended in a complex media such as Phosphate Buffered Saline (PBS) or Fetal Bovine Serum (FBS), and not in distilled water. Since these media are characterized by a myriad of compounds, including antibodies, proteins, ions, vitamins, among others, the detection of EVs and other nanostructures is expected to be more chaotic. However, the proposed method has already revealed prominent features that can contribute to the future development of a microdevice for EVs, lipoproteins, and other nanostructures detection with innovative characteristics. Its detection accuracy is equivalent to the few pieces of equipment currently capable of detecting EVs and other nanoparticles at concentration values above 10.9,46,47 The majority of these devices are optical sensors based on Surface Plasmon Resonance effects.46,47 However, as mentioned above, they require complex, time-consuming, and expensive microfabrication methods to be developed and are often dependent on delicate fiber tip functionalization processes,46,47 or affinity-based phenomena (requiring antibodies) for detecting analytes.46,47 Our technique, being simpler, less costly, and more versatile, ensures the same detection accuracy for nanoparticles concentration values, considering nanotargets within the size range of EVs.
It is also important to note that perturbations can arise during the photopolymerization lenses fabrication method, therefore modifying the modal field distribution along each lens. Some reflection from the core/cladding of the fiber boundary can also arise during the process.19 Therefore, all these interdependencies could lead to some degree of variability on the scattering collecting performance of the different lenses fabricated using the selected probes fabrication method. However, we believe that these small changes do not significantly influence nanoparticles detection/differentiation, because each probe is thoroughly characterized, and the system is trained, taking into account its intrinsic capability to detect the back-scattered signal. In future studies, we intend to implement improvements on the lenses fabrication protocol, including strategies for more stable modal excitation during photopolymerization, such as mode filtering, or polymerization at a wavelength where the fiber is single mode. These procedures will surely allow us to overcome these difficulties, enabling a more reproducible fabrication of polymeric lenses on top of optical fibers.
Conclusion
In this study we propose a novel, simple, and high-resolution nanoparticles detection method based on the analysis of short-term back-scattered laser light signal portions collected by a polymeric lensed optical fiber, by dipping the fiber probe in a solution of nanoparticles in suspension. It does not require bulky and costly equipment, and is mainly characterized by a flexible and biocompatible polymeric micro-lens fabricated through a self-guided photopolymerization process on the top of an optical fiber, a photodetector and a microcontroller for data processing and analysis. Unlike DLS, it is fast, since it only requires back-scattered signal acquisitions with 2 seconds. Contrary to flow cytometry, it is single-angle, since it is able to detect nanoparticles of interest using a unique random scattering collection angle. Additionally, it does not depend on any other type of signal beyond the light scattered by the ensemble of nanoparticles and it is label-free, in contrast to other optical fiber sensors, which require fiber tip functionalization techniques using expensive dyes, antibodies, organic functional groups,48 or affinity-based techniques, using antibodies. According to the obtained results, it is able to ensure an optical performance (100% accuracy) in detecting synthetic nanoparticles in distilled water, for a concentration of nanoparticles of at least 3.89 μg/mL (8.74E+10 particles/mL). However, it is also able to ensure a performance of at least 90% for concentrations lower than 3.89 μg/mL, but higher than or equal to 1.22E−03 μg/mL (2.74E+07 particles/mL), considering the range of concentrations tested in this study. Considering that the “naturally generated” EVs (including exosomes) that have been associated with important roles for early cancer diagnosis and tumor metastasis assessment are characterized by diameters between 100 and 150 nm and plasmatic levels in the order of 108–1012, the proposed technique can be prominent for the development of an innovative device for EVs detection. It can also be used for detecting other types of nanostructures that provide relevant information about acute abnormal conditions, such as lipoproteins. This novel method can have an important impact in early cancer diagnosis, tumor metastasis assessment, tumor type differentiation protocols, and indirect health state monitoring. This can be incorporated into novel devices for Point-of-Care/Rapid Diagnostic micro-cell sensing.
Acknowledgments
This work was partly developed under the project NanoSTIMA, funded by the North Portugal Regional Operational Program (NORTE 2020), under the PORTUGAL 2020 Partnership Agreement, and through the European Regional Development Fund (ERDF). It was also funded by the Portuguese Foundation for Science and Technology (PhD research grant PD/BD/135023/2017). Rita SR Ribeiro is currently working at 4Dcell and Elvesys, Paris, France.
Disclosure
The authors report no conflicts of interest in this work.
References
Balog S, Rodriguez-Lorenzo L, Monnier CA, et al. Characterizing nanoparticles in complex biological media and physiological fluids with depolarized dynamic light scattering. Nanoscale. 2015;7(14):5991–5997. | ||
Jayaram DT, Ramos-Romero S, Shankar BH, et al. In vitro and in vivo demonstration of photodynamic activity and cytoplasm imaging through TPE nanoparticles. ACS Chem Biol. 2016;11(1):104–112. | ||
Chen F, Ehlerding E, Cai W. Theranostic nanoparticles. J Nucl Med. 2014;55(12):1919–1922. | ||
Steinbichler TB, Dudás J, Riechelmann H, Skvortsova I-I. The role of exosomes in cancer metastasis. Semin Cancer Biol. 2017;44:170–181. | ||
Welsh JA, Holloway JA, Wilkinson JS, Englyst NA. Extracellular vesicle flow cytometry analysis and standardization. Front Cell Dev Biol. 2017;5:78. | ||
Shpacovitch V, Sidorenko I, Lenssen J, et al. Application of the PAMONO-Sensor for Quantification of microvesicles and determination of nano-particle size distribution. Sensors. 2017;17(2):244. | ||
Wang X-H, Peng H-S, Yang W, Ren Z-D, Liu Y-A. Mitochondria-targeted theranostic nanoparticles for optical sensing of oxygen, photodynamic cancer therapy, and assessment of therapeutic efficacy. Microchimica Acta. 2016;183(10):2723–2731. | ||
European Commission. The appropriateness of existing methodologies to assess the potential risks associated with engineered and adventitious products of nanotechnologies. Scientific Committee on Emerging and Newly Identified Health Risks. 2006. | ||
Aatonen MT, Öhman T, Nyman TA, Laitinen S, Grönholm M, Siljander PR-M. Isolation and characterization of platelet-derived extracellular vesicles. Journal of Extracellular Vesicles. 2014;3(1):24692. | ||
Dragovic RA, Southcombe JH, Tannetta DS, Redman CWG, Sargent IL. Multicolor flow cytometry and nanoparticle tracking analysis of extracellular vesicles in the plasma of normal pregnant and pre-eclamptic women. Biol Reprod. 2013;89(6):151,1–12. | ||
Mcfarlane C, Stuart Young I, Hare L, Mahon G, Mceneny J. A rapid methodology for the isolation of intermediate-density lipoprotein: characterization of lipid composition and apoprotein content. Clin Chim Acta. 2005;353(1–2):117–125. | ||
Machida K, Imataka H. Production methods for viral particles. Biotechnol Lett. 2015;37(4):753–760. | ||
Pinho SS, Reis CA. Glycosylation in cancer: mechanisms and clinical implications. Nat Rev Cancer. 2015;15(9):540–555. | ||
Valkonen S, van der Pol E, Böing A, et al. Biological reference materials for extracellular vesicle studies. Eur J Pharm Sci. 2017;98:4–16. | ||
Hassan PA, Rana S, Verma G. Making sense of Brownian motion: colloid characterization by dynamic light scattering. Langmuir. 2015;31(1):3–12. | ||
Brar SK, Verma M. Measurement of nanoparticles by light-scattering techniques. TrAC Trends in Analytical Chemistry. 2011;30(1):4–17. | ||
Carvalho PM, Felício MR, Santos NC, Gonçalves S, Domingues MM. Application of light scattering techniques to nanoparticle characterization and development. Front Chem. 2018;6:237. | ||
Paiva JS, Ribeiro RS, Jorge PAS, Rosa CC, Cunha JPS. Towards a single parameter sensing for bacteria sorting through fiber trapping and back-scattered signal analysis. In: 26th International Conference on Optical Fiber Sensors. Optical Society of America; 2018. | ||
Rodrigues SM, Paiva JS, Ribeiro RS, Jorge PAS. Improved fabrication of polymeric optical fiber tweezers for single cell detection. In: 26th International Conference on Optical Fiber Sensors. Optical Society of America; 2018. | ||
Rodrigues S, Paiva JS, Ribeiro RS, Soppera O, Cunha JPS, Jorge PAS. Fabrication of Multimode-Single Mode Polymer Fiber Tweezers for Single Cell Trapping and Identification with Improved Performance. Sensors. 2018;18(9):2746. | ||
Paiva J, Ribeiro R, Cunha J, Rosa C, Jorge P. Single particle differentiation through 2D optical fiber trapping and Back-Scattered signal statistical analysis: an exploratory approach. Sensors. 2018;18(3):710. | ||
Soppera O, Jradi S, Lougnot DJ. Photopolymerization with microscale resolution: influence of the physico-chemical and photonic parameters. J Polym Sci A Polym Chem. 2008;46(11):3783–3794. | ||
Ribeiro R, Queir´os R, Ecoffet C, et al. Rapid fabrication of polymeric micro lenses for optical fiber trapping and beam shaping in SPIE NanoScience + Engineering: 91642M–91642. International Society for Optics and Photonics; 2014. | ||
Ribeiro R, Soppera O, Guerreiro A, Jorge P. Polymeric optical fiber tweezers as a tool for single cell micro manipulation and sensing. In: International Conference on Optical Fibre Sensors (OFS24). International Society for Optics and Photonics; 2015;96342K–96342K. | ||
Rodrigues Ribeiro RS, Soppera O, Oliva AG, Guerreiro A, Jorge PAS. New trends on optical fiber tweezers. J Lightwave Tech. 2015;33(16):3394–3405. | ||
Wu J, Wang Y. Plasmonic nanoparticle trapping with inhomogeneous temperature fields. IEEE Photon J. 2016;8(1):1–8. | ||
Ribeiro R, Jorge P, Guerreiro A. New developments on the design and modeling of fiber optical tweezers. In: 8th Ibero American Optics Meeting/11th Latin American Meeting on Optics, Lasers, and Applications. International Society for Optics and Photonics. 2013;8785F9. | ||
Ribeiro R, Dahal P, Guerreiro A, Jorge P. Fabrication of Fresnel plates on optical fibres by FIB milling for optical trapping manipulation and detection of single cells. Sci Rep. 2017;7:4485. | ||
De Sa J. Pattern Recognition: Concepts, Methods and Applications. Berlin, Germany: Springer Science & Business Media; 2012. | ||
Stavroulakis P, Stamp M. Handbook of Information and Communication Security. Berlin: Springer-Verlag Berlin Heidelberg, 2010. | ||
Izenman A. Modern Multivariate Statistical Techniques Regression, Classification and Manifold Learning. New York: Springer-Verlag, 2008. | ||
Izenman A. Linear Discriminant Analysis in Modern Multivariate Statistical Techniques:237–280. New York: Springer; 2013. | ||
Mohana Shankar P, Shankar P. A general statistical model for ultrasonic backscattering from tissues. IEEE Trans Ultrason Ferroelectr Freq Control. 2000;47(3):727–736. | ||
Rao K, Yip P. Discrete Cosine Transform: Algorithms, Advantages, Applications. Cambridge, Massachusetts: Academic press; 2014. | ||
Roberts PLD, Jaffe JS, Trivedi MM. Multiview, broadband acoustic classification of marine fish: a machine learning framework and comparative analysis. IEEE J Ocean Eng. 2011;36(1):90–104. | ||
Friedman JH. Regularized discriminant analysis. J Am Stat Assoc. 1989;84(405):165–175. | ||
Narsky I, Porter F. Statistical Analysis Techniques in Particle Physics: Fits, Density Estimation and Supervised Learning: John Wiley & Sons; 2013. | ||
Franc V, Hlavác V. Statistical Pattern Recognition Toolbox for Matlab. Prague, Czech: Center for Machine Perception, Czech Technical University; 2004. | ||
Clark NA, Lunacek JH, Benedek GB. A study of Brownian motion using light scattering. Am J Phys. 1970;38(5):575–585. | ||
O’Dell D, Schein P, Erickson D. Simultaneous characterization of nanoparticle size and particle-surface interactions with three-dimensional nanophotonic force microscopy. Phys Rev Appl. 2016;6(3):034010. | ||
Colombo M, Moita C, Niel G, et al. Analysis of ESCRT functions in exosome biogenesis, composition and secretion highlights the heterogeneity of extracellular vesicles. J Cell Sci. 2013;126:5553–5565. | ||
Cappello F, Logozzi M, Campanella C, et al. Exosome levels in human body fluids: a tumor marker by themselves? Eur J Pharm Sci. 2017;96:93–98. | ||
Atay S, Wilkey DW, Milhem M, Merchant M, Godwin AK. Insights into the proteome of gastrointestinal stromal tumors-derived exosomes reveals new potential diagnostic biomarkers. Mol Cell Proteomics. 2018;17(3):495–515. | ||
Lobb RJ, van Amerongen R, Wiegmans A, Ham S, Larsen JE, Möller A. Exosomes derived from mesenchymal non-small cell lung cancer cells promote chemoresistance. Int J Cancer. 2017;141(3):614–620. | ||
Sultanova N, Kasarova S, Nikolov I. Dispersion properties of optical polymers. Acta Phys Pol A. 2009;116(4):585–587. | ||
Im H, Shao H, Park YI, et al. Label-free detection and molecular profiling of exosomes with a nano-plasmonic sensor. Nat Biotechnol. 2014;32(5):490–495. | ||
Thakur A, Qiu G, Ng S-P, et al. Direct detection of two different tumor-derived extracellular vesicles by SAM-AuNIs LSPR biosensor. Biosens Bioelectron. 2017;94:400–407. | ||
Ribaut C, Loyez M, Larrieu J-C, et al. Cancer biomarker sensing using packaged plasmonic optical fiber gratings: towards in vivo diagnosis. Biosens Bioelectron. 2017;92:449–456. | ||
Workman C, Jensen LJ, Jarmer H, et al. A new non-linear normalization method for reducing variability in DNA microarray experiments. Genome Biol. 2002;3(9):research0048. |
 © 2019 The Author(s). This work is published and licensed by Dove Medical Press Limited. The full terms of this license are available at https://www.dovepress.com/terms.php and incorporate the Creative Commons Attribution - Non Commercial (unported, v3.0) License.
By accessing the work you hereby accept the Terms. Non-commercial uses of the work are permitted without any further permission from Dove Medical Press Limited, provided the work is properly attributed. For permission for commercial use of this work, please see paragraphs 4.2 and 5 of our Terms.
© 2019 The Author(s). This work is published and licensed by Dove Medical Press Limited. The full terms of this license are available at https://www.dovepress.com/terms.php and incorporate the Creative Commons Attribution - Non Commercial (unported, v3.0) License.
By accessing the work you hereby accept the Terms. Non-commercial uses of the work are permitted without any further permission from Dove Medical Press Limited, provided the work is properly attributed. For permission for commercial use of this work, please see paragraphs 4.2 and 5 of our Terms.