")
Back to Journals » Eye and Brain » Volume 8
Optical coherence tomography of the preterm eye: from retinopathy of prematurity to brain development
Authors Rothman A, Mangalesh S, Chen X, Toth C
Received 5 October 2015
Accepted for publication 26 January 2016
Published 27 May 2016 Volume 2016:8 Pages 123—133
DOI https://doi.org/10.2147/EB.S97660
Checked for plagiarism Yes
Review by Single anonymous peer review
Peer reviewer comments 4
Editor who approved publication: Professor Margaret Wong-Riley
Adam L Rothman,1,2 Shwetha Mangalesh,1 Xi Chen,1 Cynthia A Toth1,3
1Department of Ophthalmology, Duke University School of Medicine, Durham, 2Department of Internal Medicine, Cone Health, Greensboro, 3Department of Biomedical Engineering, Pratt School of Engineering, Duke University, Durham, NC, USA
Abstract: Preterm infants with retinopathy of prematurity are at increased risk of poor neurodevelopmental outcomes. Because the neurosensory retina is an extension of the central nervous system, anatomic abnormalities in the anterior visual pathway often relate to system and central nervous system health. We describe optical coherence tomography as a powerful imaging modality that has recently been adapted to the infant population and provides noninvasive, high-resolution, cross-sectional imaging of the infant eye at the bedside. Optical coherence tomography has increased understanding of normal eye development and has identified several potential biomarkers of brain abnormalities and poorer neurodevelopment.
Keywords: preterm infant, optical coherence tomography, neurosensory retina, biomarkers, retinopathy, brain development
Introduction
Despite routine screening and advances in treatment, retinopathy of prematurity (ROP) remains a major cause of vision loss in children. It is estimated that 14,000–16,000 preterm infants in the USA are affected by some degree of ROP each year, and the rate of ROP is increasing worldwide. This disease entity is characterized by abnormal and premature arrest of developing retinal blood vessels. Early intervention and treatment of infants with ROP decrease the likelihood of blindness,1 but visual abnormalities are still associated with treatment-requiring ROP (type 1 ROP). It is estimated that 65% of infants treated for ROP have visual acuity of less than 20/40 at school age.2 The effects of ROP and its comorbidities on preterm infants go beyond vision. Previous studies conducted in older children with a history of ROP have reported poor neurodevelopmental outcomes associated with ROP.3–11 These studies found that children with a history of ROP suffer mental retardation, cerebral palsy, autism, seizures, delayed gross motor skills, impaired speech and hearing, and other cognitive and neurologic abnormalities. However, most of these studies were conducted in children with severe ROP who went on to develop poor visual acuity and visual field defects. Msall et al5,6 assessed the functional outcomes of infants from the Cryotherapy for Retinopathy of Prematurity Study at 5.5 years and found history of threshold ROP a strong risk factor for severe disability. These children further had developmental, social, and educational challenges at 8 years. Interestingly, even those children with better visual acuity had functional deficits. Allred et al12 also observed that children with a history of severe ROP scored two to three standard deviations below the mean score on Bayley Scales of Infant and Toddler Development. This finding led to the hypothesis that preterm children may have reduced growth factors, such as insulin-like growth factor 1, which is critical for both brain and retinal development and usually supplied by the mother in utero. A more recent study by Beligere et al3 in India suggests that ROP zone rather than stage is more predictive of future neurodevelopmental delays. It is thus important to have early detection of neurodevelopmental abnormalities in these children for institution of early intervention.
As the human eye is a more accessible organ system for optical visualization than the brain, and thus more readily available for bedside imaging, it is proposed that assessment of normal and abnormal microanatomy of the preterm infant eye could be used as a screening tool for brain abnormalities.13 A better understanding of preterm retinal substructures and their association with brain anatomy will elucidate the pathway by which local retinal anatomic changes impact and predicts subnormal vision and central nervous system (CNS) function. It will also enable distinction between ocular and extraophthalmic (eg, CNS) causes of vision loss in children with a history of very preterm birth. Furthermore, retinal biomarkers may be identified to predict neurodevelopment in these infants. In contrast to indirect ophthalmoscopy or photography, novel noncontact ocular imaging at the bedside may enable direct telemedicine screening for ROP and neurodevelopment in multiple nurseries.14 This is aimed at improving preterm infant health care via objective bedside imaging and characterization of early critical indicators of poor vision and neurological development. We herein review the recent advances in bedside retinal imaging in infants with ROP and their correlations with brain development.
Optical coherence tomography
The advent and adaptation of multiple imaging modalities promise to change our understanding of ROP and neurodevelopment.15,16 The diagnosis, classification, and monitoring of ROP and its response to treatment traditionally rely on indirect ophthalmoscopy of the fundus by an expert ophthalmologist. Optical coherence tomography (OCT) allows for in vivo, cross-sectional assessment of eye tissue, including the retina and its vasculature. By comparing the interference patterns of light that passes through live tissue to a reference arm, OCT provides high-resolution imaging of just a few microns of eye microanatomy.17 Advances in image acquisition and processing now allow for fully automated algorithms that can segment, or outline individual structures,18 and sum these serial images to create three-dimensional volumes,19 which can be compared across many different commercial platforms.20 OCT has rapidly evolved from an experimental imaging modality to a mainstay of both research and clinical ophthalmology.
The translation of OCT to first children followed by infants has increased our understanding of pediatric eye pathologies ranging from pediatric glaucoma to pediatric retinal diseases.21–24 This is especially important in ROP, where structural abnormalities in the retina and the vasculature have been linked to developmental delays.11 OCT imaging was initially limited to school-age children who could comply with the upright chin-rest apparatus designed for adults. The challenges of imaging a noncompliant, supine infant required a new hardware. Joshi et al25 used an unmounted tabletop system to image eyes with stage 4A ROP under general anesthesia in the operating room. Vinekar et al26 similarly disassembled an OCT device and used the freed camera to image nonanesthetized eyes. Today, handheld spectral domain (SD)OCT devices allow for noncontact, portable imaging of supine infants at the bedside for both clinical and research purposes.27 The mobile imaging hand piece is attached to a fiber optic cable and can be oriented at the appropriate angle directly above the nonsedated supine eye. Furthermore, Maldonado et al28 created an age-dependent model to estimate the axial length of the infant eye, which is required to extrapolate lateral measurements. The bedside assessment of term and preterm infant eyes while in the nursery has led to a wealth of information regarding eye development and maturation. Bedside spectral domain optical coherence tomography (SDOCT) imaging (with the Envisu, Bioptigen Inc., Research Triangle Park, NC, USA) is performed with the infant supine within his or her incubator or bed, and with the examiner holding the eyelids open and this noncontact system over the eye. Rothman et al27,28 published video links to bedside imaging in the NICU and imaging in the clinic.28 Imaging is first centered on the macula, with a single volume of macula, then a volume across optic nerve and preferably a volume containing both macula and the optic nerve to allow one to draw an organizing axis from optic nerve to fovea.29 These volumes, typically 60–75 scans per volume with 600–900 A scans per B scans covering an area of ~6–7 × 6–7 mm, are useful to extract central foveal scan and to segment for layers such as retinal nerve fiber layer (RNFL).28,29
Photoreceptor development
While OCT promises to be a useful tool for identifying abnormalities associated with ROP, it first helped to describe normal neonatal retinal development and maturation. Imaging preterm infants before term-equivalent age allows for in vivo assessment of optic nerve and retinal architecture that would usually be found in utero. Alternatively, preterm infant microanatomy can be compared with age-matched term infant eyes to identify potential abnormalities. Maldonado et al30 used OCT to describe the eloquent centripetal migration of outer retinal structures, including the photoreceptors, toward the fovea that is synchronized with concurrent centrifugal migration of the inner retinal layers away from the fovea (Figure 1). The unique preterm infant foveal morphology observed on OCT has been confirmed in similar infant imaging studies.31,32 Hendrickson et al33 verified these developmental patterns with postmortem eye tissue, and Vajzovic et al34 validated that the unique layers observed on SDOCT correlate with histology (Figure 2). Vajzovic et al35 then used SDOCT to describe a delay in photoreceptor development in very preterm infants at term-equivalent age compared with age-matched term infants. They observed ellipsoid zone at the foveal center in (22/47) 47% of term infants imaged in the nursery, but only (9/64) 14% of very preterm infants (P<0.001); for those infants without ellipsoid zone at the fovea, there was also a greater mean distance of the ellipsoid zone to the foveal center in very preterm versus term infants (P=0.01), further representing a delay in photoreceptor migration. Recently, Lee et al36 reported measurement of the timeline of foveal development of term-born infants from birth through age 0–27 years. They demonstrated the continued increase in central foveal thickness with age and progressive maturation of photoreceptors over several years after birth, providing important age-appropriate normative data on healthy foveal development.
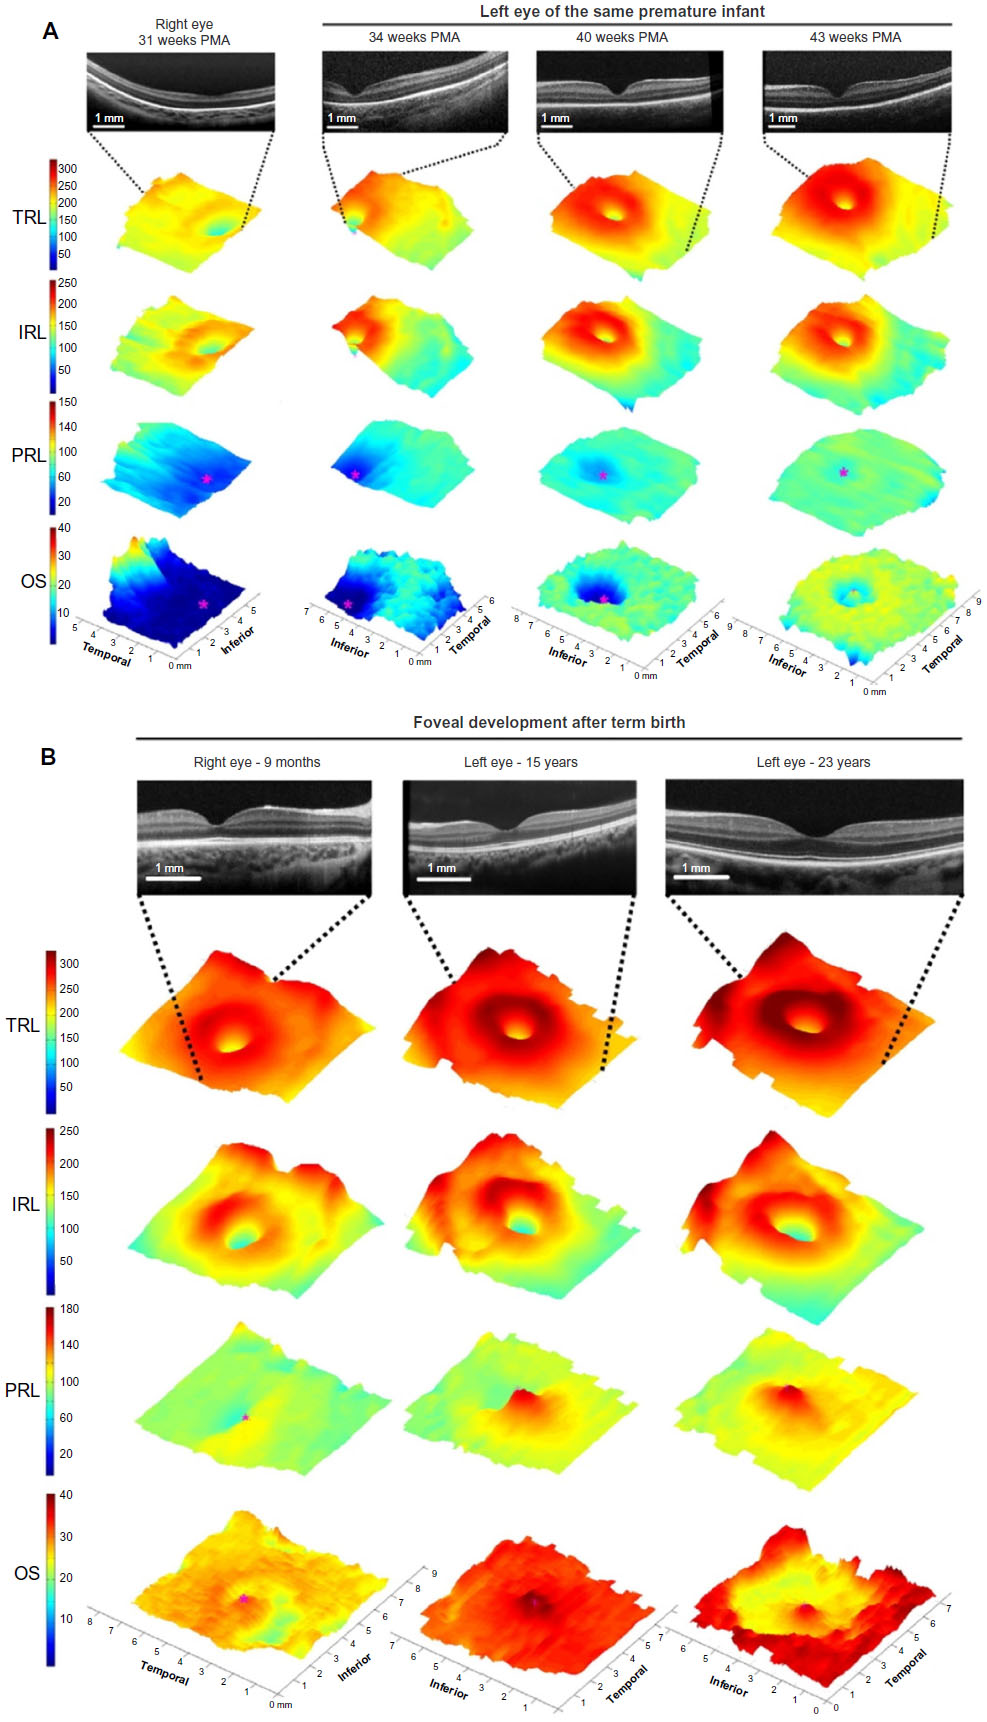 | Figure 1 Map of regional changes in human foveal development by age from 31 weeks PMA until adulthood. |
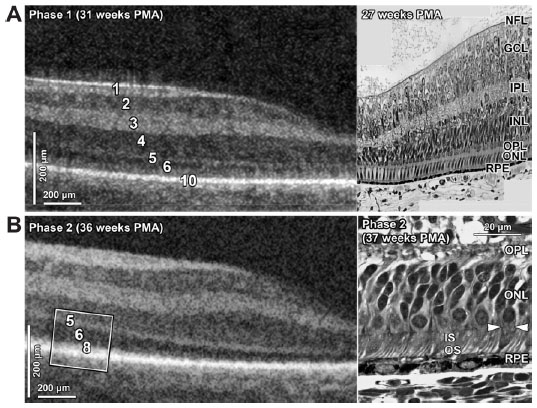 | Figure 2 SDOCT histology comparison of normal premature infant retinas. |
Macular edema of prematurity
Macular imaging with OCT has identified a unique representation of cystoid macular edema (CME) in the preterm population (Figure 3), also known as macular edema of prematurity, with neurodevelopmental implications. The macular edema is bilateral, symmetric, isolated to the inner nuclear layer, and typically causes foveal bulging with elongation of hyperreflective septae. Lee et al37 compared the utility of traditional indirect ophthalmoscopy with SDOCT during routine ROP exams to evaluate preretinal and retinal structures. The authors reported that SDOCT allowed identification of CME in 39% of examinations and epiretinal membrane in 32% of exams, neither of which were identified on indirect ophthalmoscopy. They did note that traditional examination was required for full ROP assessment (stage, zone, plus disease). Vinekar et al38 performed a similar study in an Indian population and observed subclinical CME in 29% of infants on ROP exam. Interestingly, all of the infants with CME in this study had stage 2 ROP, while no eyes with stage 0 or 1 ROP had CME. The authors posited that these cystoid structures might have caused by vascular leakage secondary to vascular endothelial growth factor imbalances or direct mechanical traction on the retina.
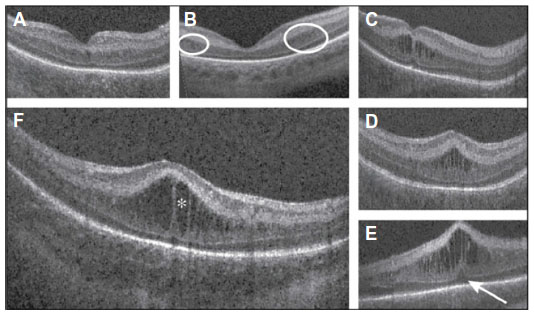 | Figure 3 Morphologic characteristics and phenotypes of CME observed by use of SDOCT. |
The role of ROP in preterm infant CME remains unclear. Maldonado et al39 performed a study that identified CME in 50% of preterm infants at a tertiary care center. They found that, while the presence or absence of CME was not associated with ROP outcomes, markers of CME severity such as central foveal thickness, inner nuclear layer thickness, and the foveal-to-parafoveal ratio were greater in eyes that either required laser photocoagulation or had stage 3 ROP. They did not find any strong relationship between CME and a battery of systemic health factors. Another study reports both persistence of and formation of new CME following bevacizumab (an antivascular endothelial growth factor used off-label for ROP treatment) administration, further suggesting this phenomenon is not directly tied to vascular endothelial growth factor.40 A case report of an infant with hemochromatosis and severe, bilateral CME that resolved following liver transplantation suggests other unidentified systemic health factors may play a role in neonatal CME.41
While the etiology of preterm infant CME is unclear, several pilot studies have identified functional outcomes suggesting this is a pathologic phenomenon rather than a phenotypic variant of development. One study followed 53 very preterm infants with CME in the intensive care nursery and performed Bayley Scales at 18–24 months corrected age to assess neurodevelopment and found CME was associated with worse language (P=0.002) and motor skills (P=0.03) as a toddler. Within the subset of very preterm infants with CME, there was an association between the severity of CME as assessed by increasing foveal-to-parafoveal thickness ratio and worsening cognitive (P=0.03, R2=0.16) and language scores (P=0.03, R2=0.15). According to Rothman et al,42 because the neurosensory retina is an extension of the CNS, SDOCT allows for direct visualization of CNS tissue and the CME observed may be an ophthalmologic manifestation of cellular events occurring elsewhere in the brain and CNS. Another study followed 13 infants (eleven preterm and two term) imaged in the nursery and found that all eight children with age-appropriate microanatomy on SDOCT had ≥20/40 visual acuity or within the normal limits on Teller acuity cards, while the five infants with CME later had suboptimal acuity, sensorimotor deficits, abnormalities on brain magnetic resonance imaging (MRI), or poor neurodevelopment.27 Vinekar et al43 also reported reduced visual acuity as early as 3 months corrected age in infants with CME. This may be due to delayed photoreceptor development for very preterm infants with or without CME35 or other confounding health parameters in this sick and vulnerable population.
Retinal vasculature
Preliminary investigations have also demonstrated OCT as an effective tool to characterize the retinal vasculature. While traditional indirect ophthalmoscopy provides an en face view of the fundus, OCT provides three-dimensional data and unique information in the anterior–posterior axis. Maldonado et al44 proposed a Vascular Abnormality Score by OCT (VASO) to quantify abnormalities graded on OCT such as vessel elevation, hyporeflective vessels, scalloping of retinal layers, and perivascular spaces (Figure 4). Infants with plus disease have a significantly higher VASO score (P=0.001). Retinal surface maps can also be created with segmentation software to greater appreciate vessel tortuosity and dilation. In addition, pilot data suggest a correlation between VASO and worsening language and motor skills as a toddler (unpublished data). Future studies may relate VASO and vessel mapping to markers of development and maturation such as photoreceptor development, CME, and RNFL thickness.
 | Figure 4 Evaluation of infant retinal vasculature with SDOCT. |
The rapidly evolving modifications to OCT imaging promise to change our approach to ROP. For example, color Doppler OCT visualizes blood flow and could allow for in vivo, cross-sectional assessment of blood flow and three-dimensional construction of retinal vasculature in infants with ROP.45–47 Advances in OCT angiography may become both a useful clinical tool for patients with ROP and research tool that helps characterize the vasculature and answer questions such as the significance of a smaller foveal avascular zone in preterm infants.48 Swept-source OCT promises to replace SDOCT with faster data acquisition, which will prove useful when imaging nonsedated infants.49 Alternatively, OCT may be paired with other technologies such as wide-field fluorescein angiography, which allows characterization of the permeability of peripheral vasculature.50
Optic nerve and retinal nerve fiber layer
In addition to macular and vessel imaging, OCT imaging provides valuable information about the optic nerve and RNFL. Our prior understanding of optic nerve development was limited to postmortem analyses. Provis et al51 described the initial burst of axonal proliferation that peaks during 16–17 weeks gestational age at ~3.7 million axons. This overproduction is followed by apoptosis of the optic nerve axons that plateaus approximately 29 weeks gestational age at 1.1 million axons. Overall, nearly 70% of the optic nerve axons are pruned prior to birth. The actual optic nerve is 75% of its adult size at birth52 when it is unmyelinated until about age 2.53
Because the microanatomy of the anterior visual pathway undergoes such dynamic change both in utero and during infancy, studies specific to this time window are valuable for understanding normal development and its phenotypic and pathologic variants. Samarawickrama et al54 imaged 12-year-old children and found that low birth weight, short birth length, and small head circumference correlated with larger optic nerve cup-to-disc ratio. Tong et al55 then compared optic nerve parameters in term versus preterm infants imaged with SDOCT and found a larger cup-to-disc ratio in preterm infants (P<0.001). Within the preterm cohort, they correlated increased cup-to-disc ratio with diagnosis of periventricular leukomalacia (P=0.005) and clinical need for MRI while in the nursery (P=0.023) as well as worse cognitive skills as a toddler as assessed by the Bayley Scales (P=0.049).
The RNFL consists of the unmyelinated ganglion cell axons that compose the innermost layer of the neurosensory retina prior to converging as the optic nerve. As such, average RNFL thickness is a more accurate measure of retinal ganglion cell integrity than the estimate provided by optic nerve head analysis. Several studies in school-age children have associated thinner RNFL with both lower birth weight56,57 and prematurity.58–60 Akerblom et al58 prescribe these differences to thinner RNFL in children with a history of stage 3 or 4 ROP, while Pueyo et al60 similarly described thinner RNFL in preterm children who required treatment for ROP and had concomitant pathologies such as hypoxic-ischemic events and perinatal infections. Recently, Park and Oh61 also found this inverse relationship between ROP stage and average RNFL thickness in school-age children. One limitation of these studies, however, is that the RNFL was measured years after ROP diagnosis and its associated comorbidities and treatments.
Measuring RNFL thickness in infants presents several unique challenges. RNFL measurements in adults are usually taken at a mean radial distance of 1.7 mm from the center of the optic nerve based on the reproducibility studies of Schuman et al.62 Because the neonatal eye is smaller than even the eyes of school-age children, average RNFL thickness should be measured at a distance of 1.5 mm from the center of the optic nerve, based on both pilot SDOCT data in healthy, term infants29 and proportionality calculations derived from fundus photography of infants63 and adults.64 Because the SDOCT scans of infants are obtained when the noncooperative child is supine, the scans are usually not orthogonally oriented. Previous work suggests that RNFL measurements should be standardized relative to the axis aligning the foveal center to the opening of Bruch’s membrane.65,66 Several custom MATLAB scripts (MathWorks, Inc., Natick, MA, USA) allow for measurement of RNFL thickness in neonates. The inner and outer layers of the RNFL are semiautomatically segmented or outlined. Users then manually mark the center of the optic nerve and fovea to create an organizing axis and then can calculate the average RNFL thickness at any radial distance from the center of the optic nerve across an arc of any specified degree. This method has provided a normative dataset of mean RNFL thickness in healthy, term infants imaged prior to discharge from the nursery.29 This same methodology has since been applied to very preterm infants and validated as a way to reproducibly measure RNFL over time in this vulnerable population. At term-equivalent age, very preterm infants have significantly thinner RNFL across both the papillomacular bundle (defined as the arc from −15 to +15 degrees relative to the organizing axis, P<0.001) and the temporal quadrant (the arc from −45 to +45 degrees relative to the organizing axis, P=0.005) compared with healthy, term infants. Furthermore, these very preterm infants imaged at <36 weeks postmenstrual age and again at term-equivalent age demonstrated a significant increase in mean thickness over this time interval (P<0.001). Because the ganglion cell axons are unmyelinated anterior to the lamina cribrosa, this increase in axonal thickness may parallel the increase in volume of gray brain matter observed in preterm infants on MRI during this time window (Figure 5).67
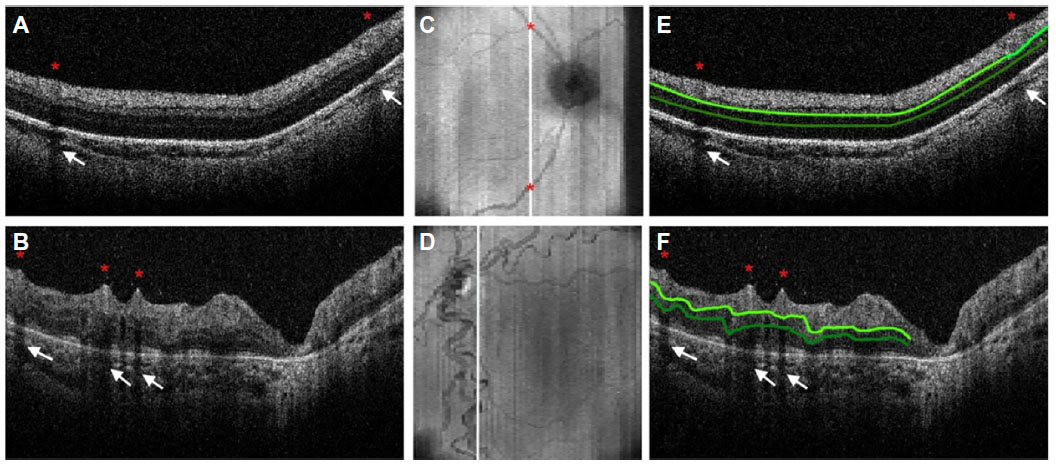
Interestingly, these pilot data did not identify within the very preterm cohort (n=57) a relationship between ROP stage, plus disease, or need for ROP treatment and RNFL thickness nor did it find a difference in RNFL thickness between those very preterm infants with or without a list of common preterm pathologies such as hydrocephalus, intraventricular hemorrhage, and bronchopulmonary dysplasia. There was, however, a significant relationship between mean RNFL thickness and gross brain abnormalities and lesions observed on MRI obtained while in the intensive care nursery. A pediatric neuroradiologist masked to all infant data other than age at MRI used a modified version of the grading scale described by Kidokoro et al68 to assess a global brain lesion burden index, which was composed of white matter, gray matter, and cerebellar subscores. There was a significant relationship between increasing global (P=0.001, R2=0.35), white matter (P=0.008, R2=0.26), and gray matter (P=0.009, R2=0.25) brain lesion indices on near-term MRI, signifying increasing brain abnormalities and thinner RNFL. Likewise, there was a significant correlation between worse cognitive (P=0.01, R2=0.18) and motor skills (P=0.02, R2=0.17) as a toddler, as assessed by the Bayley Scales, and thinner RNFL while in the intensive care nursery.13
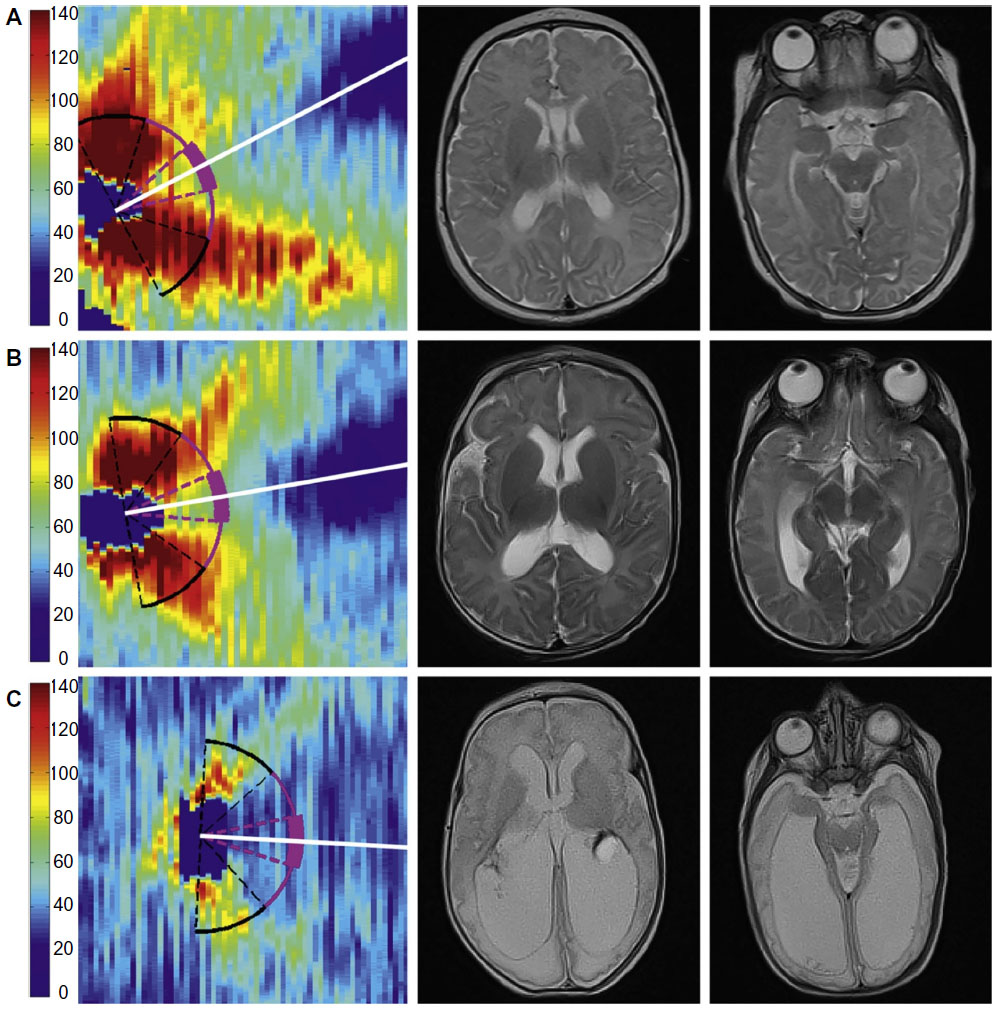 | Figure 5 Very preterm infant RNFL thickness maps at term equivalent age (left column) and their corresponding near-term T2-weighted brain MRI (B, right columns). |
The presence of CME and thinner RNFL in the very preterm infant population appears to be independent. The RNFL thinning is believed to be retrograde transsynaptic degeneration of ganglion cells similar to that observed in primates after mechanical injury that leads to enlarged optic nerve cup-to-disc ratio and thinner RNFL.69,70 Rather than a direct result of physical insult, CME is likely a manifestation of systemic physiologic insult such as inflammation or vascular endothelial growth factor dysregulation.42
Average RNFL thickness may be a promising biomarker of brain pathology and subsequent neurodevelopment as an adjunct clinical tool to brain MRI. There are several indications for brain MRI in the preterm population that often demonstrate differences from term brain development at this age71 due to the relationship between white matter injury and neurodevelopment.72–74 Lennartsson et al75 qualitatively described an inverse relationship between RNFL thickness in adults and the extent of white matter injury and damage to optic radiations as observed on fiber tractography experienced after premature birth.
Conclusion
Recent developments in bedside OCT imaging have contributed to our understanding of the retinal microanatomy of the preterm infant eye, including in those with ROP. The OCT imaging has provided a useful new perspective of retinal neurovascular development along with a three-dimensional view of the focal abnormalities of ROP: changes in retinal and choroidal vasculature, axonal layer thinning, and macular edema. It is through recognizing and documenting the age-appropriate stages of normal neonatal retinal development and maturation that one can identify changes associated not only with ROP but also with prematurity. These include delayed photoreceptor development, CME, enlarged optic nerve C/D ratio, and thin RNFL. More importantly, these anatomic abnormalities have been linked to abnormalities in brain anatomy as well as in neurodevelopment. Therefore, bedside OCT imaging maybe a useful and sensitive tool for early screening of very preterm infants who are at very high risk of these brain abnormalities and poorer neuro development. Because the eye and brain continue to develop well after term birth, it is highly likely that similar research in full-term infants may find similar relationships between eye microanatomy and neurodevelopment and CNS disease.
Ongoing studies aim to establish and evaluate bedside OCT imaging in the role of prenatal screening. Telemedicine, with transmission of digital eye images to centralized reading centers for expert interpretation, may increase the patient’s access to screening.76,77 While current studies focus on screening with digital fundus photography, this would be an obvious area for extension into OCT in the future.78 Multidisciplinary approach and collaborative efforts across multiple centers will be essential in improving developmental outcomes and monitoring therapeutic response to treatments or nutritional interventions to improve brain development in this vulnerable population.
Acknowledgments
Dr Toth receives royalties through her university from Alcon and research support from Bioptigen (Research Triangle Park, NC, USA) and Genentech (South San Francisco, CA, USA). She also has unlicensed patents pending in OCT imaging and analysis. No authors have a proprietary interest in the current study.
Disclosure
The authors report no conflicts of interest in this work.
References
Early Treatment for Retinopathy of Prematurity Cooperative Group. Revised indications for the treatment of retinopathy of prematurity: results of the early treatment for retinopathy of prematurity randomized trial. Arch Ophthalmol. 2003;121:1684–1694. | |
Wallace DK, Bremer DL, Good WV, et al. Correlation of recognition visual acuity with posterior retinal structure in advanced retinopathy of prematurity. Arch Ophthalmol. 2012;130:1512–1516. | |
Beligere N, Perumalswamy V, Tandon M, et al. Retinopathy of prematurity and neurodevelopmental disabilities in premature infants. Semin Fetal Neonatal Med. 2015;20:346–353. | |
Jacobson L, Fernell E, Broberger U, Ek U, Gillberg C. Children with blindness due to retinopathy of prematurity: a population-based study. Perinatal data, neurological and ophthalmological outcome. Dev Med Child Neurol. 1998;40:155–159. | |
Msall ME, Phelps DL, DiGaudio KM, et al. Severity of neonatal retinopathy of prematurity is predictive of neurodevelopmental functional outcome at age 5.5 years. Behalf of the Cryotherapy for Retinopathy of Prematurity Cooperative Group. Pediatrics. 2000;106: 998–1005. | |
Msall ME, Phelps DL, Hardy RJ, et al. Educational and social competencies at 8 years in children with threshold retinopathy of prematurity in the CRYO-ROP multicenter study. Pediatrics. 2004;113:790–799. | |
Cooke RW, Foulder-Hughes L, Newsham D, Clarke D. Ophthalmic impairment at 7 years of age in children born very preterm. Arch Dis Child Fetal Neonatal Ed. 2004;89:F249–F253. | |
Goyen TA, Todd DA, Veddovi M, Wright AL, Flaherty M, Kennedy J. Eye-hand co-ordination skills in very preterm infants <29 weeks gestation at 3 years: effects of preterm birth and retinopathy of prematurity. Early Hum Dev. 2006;82:739–745. | |
Stephenson T, Wright S, O’Connor A, et al. Children born weighing less than 1701 g: visual and cognitive outcomes at 11–14 years. Arch Dis Child Fetal Neonatal Ed. 2007;92:F265–F270. | |
Todd DA, Goyen TA, Smith J, Rochefort M. Developmental outcome in preterm infants <29 weeks gestation with </= Stage 3 retinopathy of prematurity (ROP): relationship to severity of ROP. J Dev Origin Health Dis. 2012;3:116–122. | |
Schmidt B, Davis PG, Asztalos EV, Solimano A, Roberts RS. Association between severe retinopathy of prematurity and nonvisual disabilities at age 5 years. JAMA. 2014;311:523–525. | |
Allred EN, Capone A Jr, Fraioli A, et al. Retinopathy of prematurity and brain damage in the very preterm newborn. J AAPOS. 2014; 18:241–247. | |
Rothman AL, Sevilla MB, Mangalesh S, et al. Thinner retinal nerve fiber layer in very preterm versus term infants and relationship to brain anatomy and neurodevelopment. Am J Ophthalmol. 2015;160:1296–1308.e2. | |
Quinn GE, Ying GS, Daniel E, et al. Validity of a telemedicine system for the evaluation of acute-phase retinopathy of prematurity. JAMA Ophthalmol. 2014;132:1178–1184. | |
Maldonado RS, Toth CA. Optical coherence tomography in retinopathy of prematurity: looking beyond the vessels. Clin Perinatol. 2013;40:271–296. | |
Vinekar A, Mangalesh S, Jayadev C, Maldonado RS, Bauer N, Toth CA. Retinal imaging of infants on spectral domain optical coherence tomography. Biomed Res Int. 2015;2015:782420. | |
Fujimoto JG. Optical coherence tomography for ultrahigh resolution in vivo imaging. Nat Biotechnol. 2003;21:1361–1367. | |
Lee JY, Chiu SJ, Srinivasan PP, et al. Fully automatic software for retinal thickness in eyes with diabetic macular edema from images acquired by cirrus and spectralis systems. Invest Ophthalmol Vis Sci. 2013;54:7595–7602. | |
Folgar FA, Yuan EL, Sevilla MB, et al. Drusen volume and retinal pigment epithelium abnormal thinning volume predict 2-year progression of age-related macular degeneration. Ophthalmology. 2016;123:39–50.e1. | |
Folgar FA, Yuan EL, Farsiu S, Toth CA. Lateral and axial measurement differences between spectral-domain optical coherence tomography systems. J Biomed Opt. 2014;19:16014. | |
Hess DB, Asrani SG, Bhide MG, Enyedi LB, Stinnett SS, Freedman SF. Macular and retinal nerve fiber layer analysis of normal and glaucomatous eyes in children using optical coherence tomography. Am J Ophthalmol. 2005;139:509–517. | |
Ghasia FF, Freedman SF, Rajani A, Holgado S, Asrani S, El-Dairi M. Optical coherence tomography in paediatric glaucoma: time domain versus spectral domain. Br J Ophthalmol. 2013;97:837–842. | |
Ely AL, El-Dairi MA, Freedman SF. Cupping reversal in pediatric glaucoma – evaluation of the retinal nerve fiber layer and visual field. Am J Ophthalmol. 2014;158:905–915. | |
Rothman AL, Folgar FA, Tong AY, Toth CA. Spectral domain optical coherence tomography characterization of pediatric epiretinal membranes. Retina. 2014;34:1323–1334. | |
Joshi MM, Trese MT, Capone A, Jr. Optical coherence tomography findings in stage 4A retinopathy of prematurity: a theory for visual variability. Ophthalmology. 2006;113:657–660. | |
Vinekar A, Sivakumar M, Shetty R, et al. A novel technique using spectral-domain optical coherence tomography (Spectralis, SD-OCT+ HRA) to image supine non-anaesthetized infants: utility demonstrated in aggressive posterior retinopathy of prematurity. Eye (Lond). 2010;24:379–382. | |
Rothman AL, Tran-Viet D, Vajzovic L, et al. Functional outcomes of young infants with and without macular edema. Retina. 2015;35:2018–2027. | |
Maldonado RS, Izatt JA, Sarin N, et al. Optimizing hand-held spectral domain optical coherence tomography imaging for neonates, infants, and children. Invest Ophthalmol Vis Sci. 2010;51:2678–2685. | |
Rothman AL, Sevilla MB, Freedman SF, et al. Assessment of retinal nerve fiber layer thickness in healthy, full-term neonates. Am J Ophthalmol. 2015;159:803–811. | |
Maldonado RS, O’Connell RV, Sarin N, et al. Dynamics of human foveal development after premature birth. Ophthalmology. 2011; 118:2315–2325. | |
Dubis AM, Costakos DM, Subramaniam CD, et al. Evaluation of normal human foveal development using optical coherence tomography and histologic examination. Arch Ophthalmol. 2012;130:1291–1300. | |
Villegas VM, Capo H, Cavuoto K, McKeown CA, Berrocal AM. Foveal structure-function correlation in children with history of retinopathy of prematurity. Am J Ophthalmol. 2014;158:508–512.e2. | |
Hendrickson A, Possin D, Vajzovic L, Toth CA. Histologic development of the human fovea from midgestation to maturity. Am J Ophthalmol. 2012;154:767–778.e2. | |
Vajzovic L, Hendrickson AE, O’Connell RV, et al. Maturation of the human fovea: correlation of spectral-domain optical coherence tomography findings with histology. Am J Ophthalmol. 2012;154:779–789.e2. | |
Vajzovic L, Rothman AL, Tran-Viet D, Cabrera MT, Freedman SF, Toth CA. Delay in retinal photoreceptor development in very preterm compared to term infants. Invest Ophthalmol Vis Sci. 2015;56:908–913. | |
Lee H, Purohit R, Patel A, et al. In vivo foveal development using optical coherence tomography. Invest Ophthalmol Vis Sci. 2015; 56:4537–4545. | |
Lee AC, Maldonado RS, Sarin N, et al. Macular features from spectral- domain optical coherence tomography as an adjunct to indirect ophthalmoscopy in retinopathy of prematurity. Retina. 2011;31:1470–1482. | |
Vinekar A, Avadhani K, Sivakumar M, et al. Understanding clinically undetected macular changes in early retinopathy of prematurity on spectral domain optical coherence tomography. Invest Ophthalmol Vis Sci. 2011;52:5183–5188. | |
Maldonado RS, O’Connell R, Ascher SB, et al. Spectral-domain optical coherence tomographic assessment of severity of cystoid macular edema in retinopathy of prematurity. Arch Ophthalmol. 2012;130:569–578. | |
Dubis AM, Subramaniam CD, Godara P, Carroll J, Costakos DM. Subclinical macular findings in infants screened for retinopathy of prematurity with spectral-domain optical coherence tomography. Ophthalmology. 2013;120:1665–1671. | |
Maldonado RS, Freedman SF, Cotten CM, Ferranti JM, Toth CA. Reversible retinal edema in an infant with neonatal hemochromatosis and liver failure. J AAPOS. 2011;15:91–93. | |
Rothman AL, Tran-Viet D, Gustafson KE, et al. Poorer neurodevelopmental outcomes associated with cystoid macular edema identified in preterm infants in the intensive care nursery. Ophthalmology. 2015;122:610–619. | |
Vinekar A, Mangalesh S, Jayadev C, et al. Macular edema in Asian Indian premature infants with retinopathy of prematurity: impact on visual acuity and refractive status after 1-year. Indian J Ophthalmol. 2015;63:432–437. | |
Maldonado RS, Yuan E, Tran-Viet D, et al. Three-dimensional assessment of vascular and perivascular characteristics in subjects with retinopathy of prematurity. Ophthalmology. 2014;121:1289–1296. | |
Chen Z, Milner TE, Dave D, Nelson JS. Optical Doppler tomographic imaging of fluid flow velocity in highly scattering media. Opt Lett. 1997;22:64–66. | |
Izatt JA, Kulkarni MD, Yazdanfar S, Barton JK, Welch AJ. In vivo bidirectional color Doppler flow imaging of picoliter blood volumes using optical coherence tomography. Opt Lett. 1997;22:1439–1441. | |
Kehlet Barton J, Izatt JA, Kulkarni MD, Yazdanfar S, Welch AJ. Three-dimensional reconstruction of blood vessels from in vivo color Doppler optical coherence tomography images. Dermatology. 1999;198:355–361. | |
Yanni SE, Wang J, Chan M, et al. Foveal avascular zone and foveal pit formation after preterm birth. Br J Ophthalmol. 2012;96:961–966. | |
Nankivil D, Dhalla AH, Gahm N, Shia K, Farsiu S, Izatt JA. Coherence revival multiplexed, buffered swept source optical coherence tomography: 400 kHz imaging with a 100 kHz source. Opt Lett. 2014;39:3740–3743. | |
Lepore D, Molle F, Pagliara MM, et al. Atlas of fluorescein angiographic findings in eyes undergoing laser for retinopathy of prematurity. Ophthalmology. 2011;118:168–175. | |
Provis JM, van Driel D, Billson FA, Russell P. Human fetal optic nerve: overproduction and elimination of retinal axons during development. J Comp Neurol. 1985;238:92–100. | |
Rimmer S, Keating C, Chou T, et al. Growth of the human optic disk and nerve during gestation, childhood, and early adulthood. Am J Ophthalmol. 1993;116:748–753. | |
Dolman CL, McCormick AQ, Drance SM. Aging of the optic nerve. Arch Ophthalmol. 1980;98:2053–2058. | |
Samarawickrama C, Huynh SC, Liew G, Burlutsky G, Mitchell P. Birth weight and optic nerve head parameters. Ophthalmology. 2009; 116:1112–1118. | |
Tong AY, El-Dairi M, Maldonado RS, et al. Evaluation of optic nerve development in preterm and term infants using handheld spectral-domain optical coherence tomography. Ophthalmology. 2014;121:1818–1826. | |
Wang XY, Huynh SC, Rochtchina E, Mitchell P. Influence of birth parameters on peripapillary nerve fiber layer and macular thickness in six-year-old children. Am J Ophthalmol. 2006;142:505–507. | |
Tariq YM, Pai A, Li H, et al. Association of birth parameters with OCT measured macular and retinal nerve fiber layer thickness. Invest Ophthalmol Vis Sci. 2011;52:1709–1715. | |
Akerblom H, Holmstrom G, Eriksson U, Larsson E. Retinal nerve fibre layer thickness in school-aged prematurely-born children compared to children born at term. Br J Ophthalmol. 2012;96:956–960. | |
Wang J, Spencer R, Leffler JN, Birch EE. Characteristics of peripapillary retinal nerve fiber layer in preterm children. Am J Ophthalmol. 2012;153:850–855.e1. | |
Pueyo V, Gonzalez I, Altemir I, et al. Microstructural changes in the retina related to prematurity. Am J Ophthalmol. 2015;159:797–802. | |
Park KA, Oh SY. Retinal nerve fiber layer thickness in prematurity is correlated with stage of retinopathy of prematurity. Eye (Lond). 2015;29:1594–1602. | |
Schuman JS, Pedut-Kloizman T, Hertzmark E, et al. Reproducibility of nerve fiber layer thickness measurements using optical coherence tomography. Ophthalmology. 1996;103:1889–1898. | |
De Silva DJ, Cocker KD, Lau G, Clay ST, Fielder AR, Moseley MJ. Optic disk size and optic disk-to-fovea distance in preterm and full-term infants. Invest Ophthalmol Vis Sci. 2006;47:4683–4686. | |
Williams TD, Wilkinson JM. Position of the fovea centralis with respect to the optic nerve head. Optom Vis Sci. 1992;69:369–377. | |
Chauhan BC, Burgoyne CF. From clinical examination of the optic disc to clinical assessment of the optic nerve head: a paradigm change. Am J Ophthalmol. 2013;156:218–227.e2. | |
He L, Ren R, Yang H, et al. Anatomic vs. acquired image frame discordance in spectral domain optical coherence tomography minimum rim measurements. PLoS One. 2014;9:e92225. | |
Mewes AU, Huppi PS, Als H, et al. Regional brain development in serial magnetic resonance imaging of low-risk preterm infants. Pediatrics. 2006;118:23–33. | |
Kidokoro H, Neil JJ, Inder TE. New MR imaging assessment tool to define brain abnormalities in very preterm infants at term. AJNR Am J Neuroradiol. 2013;34:2208–2214. | |
Jacobson L, Hellstrom A, Flodmark O. Large cups in normal-sized optic discs: a variant of optic nerve hypoplasia in children with periventricular leukomalacia. Arch Ophthalmol. 1997;115:1263–1269. | |
Quigley HA, Davis EB, Anderson DR. Descending optic nerve degeneration in primates. Invest Ophthalmol Vis Sci. 1977;16:841–849. | |
Hart AR, Whitby EW, Griffiths PD, Smith MF. Magnetic resonance imaging and developmental outcome following preterm birth: review of current evidence. Dev Med Child Neurol. 2008;50:655–663. | |
Iwata S, Nakamura T, Hizume E, et al. Qualitative brain MRI at term and cognitive outcomes at 9 years after very preterm birth. Pediatrics. 2012;129:e1138–1147. | |
Allin MP, Kontis D, Walshe M, et al. White matter and cognition in adults who were born preterm. PLoS One. 2011;6:e24525. | |
Kidokoro H, Anderson PJ, Doyle LW, Woodward LJ, Neil JJ, Inder TE. Brain injury and altered brain growth in preterm infants: predictors and prognosis. Pediatrics. 2014;134:e444–453. | |
Lennartsson F, Nilsson M, Flodmark O, Jacobson L. Damage to the immature optic radiation causes severe reduction of the retinal nerve fiber layer, resulting in predictable visual field defects. Invest Ophthalmol Vis Sci. 2014;55:8278–8288. | |
Wang SK, Callaway NF, Wallenstein MB, Henderson MT, Leng T, Moshfeghi DM. SUNDROP: six years of screening for retinopathy of prematurity with telemedicine. Can J Ophthalmol. 2015;50:101–106. | |
Vinekar A, Jayadev C, Mangalesh S, Shetty B, Vidyasagar D. Role of tele-medicine in retinopathy of prematurity screening in rural outreach centers in India – a report of 20,214 imaging sessions in the KIDROP program. Semin Fetal Neonatal Med. 2015;20:335–345. | |
Daniel E, Quinn GE, Hildebrand PL, et al. Validated system for centralized grading of retinopathy of prematurity: telemedicine approaches to evaluating acute-phase Retinopathy of Prematurity (e-ROP) Study. JAMA Ophthalmol. 2015;133:675–682. |
 © 2016 The Author(s). This work is published and licensed by Dove Medical Press Limited. The full terms of this license are available at https://www.dovepress.com/terms.php and incorporate the Creative Commons Attribution - Non Commercial (unported, v3.0) License.
By accessing the work you hereby accept the Terms. Non-commercial uses of the work are permitted without any further permission from Dove Medical Press Limited, provided the work is properly attributed. For permission for commercial use of this work, please see paragraphs 4.2 and 5 of our Terms.
© 2016 The Author(s). This work is published and licensed by Dove Medical Press Limited. The full terms of this license are available at https://www.dovepress.com/terms.php and incorporate the Creative Commons Attribution - Non Commercial (unported, v3.0) License.
By accessing the work you hereby accept the Terms. Non-commercial uses of the work are permitted without any further permission from Dove Medical Press Limited, provided the work is properly attributed. For permission for commercial use of this work, please see paragraphs 4.2 and 5 of our Terms.