")
Back to Journals » Eye and Brain » Volume 13
Optical Coherence Tomography in Patients with Alzheimer’s Disease: What Can It Tell Us?
Authors Song A , Johnson N, Ayala A , Thompson AC
Received 27 September 2020
Accepted for publication 9 December 2020
Published 8 January 2021 Volume 2021:13 Pages 1—20
DOI https://doi.org/10.2147/EB.S235238
Checked for plagiarism Yes
Review by Single anonymous peer review
Peer reviewer comments 2
Editor who approved publication: Professor Margaret Wong-Riley
Ailin Song,1,* Nicholas Johnson,1,* Alexandria Ayala,1 Atalie C Thompson2
1Duke University School of Medicine, Durham, NC, USA; 2Department of Ophthalmology, Duke University, Durham, NC, USA
*These authors contributed equally to this work
Correspondence: Atalie C Thompson
Department of Ophthalmology, Duke University, 2351 Erwin Road, DUMC 3802, Durham, NC 27710, USA
Tel +1-919-681-3937
Fax +1-919-681-8267
Email [email protected]
Purpose: Although Alzheimer’s disease (AD) is a leading cause of dementia worldwide, its clinical diagnosis remains a challenge. Optical coherence tomography (OCT) and OCT with angiography (OCTA) are non-invasive ophthalmic imaging tools with the potential to detect retinal structural and microvascular changes in patients with AD, which may serve as biomarkers for the disease. In this systematic review, we evaluate whether certain OCT and OCTA parameters are significantly associated with AD and mild cognitive impairment (MCI).
Methods: PubMed database was searched using a combination of MeSH terms to identify studies for review. Studies were organized by participant diagnostic groups, type of imaging modality, and OCT/OCTA parameters of interest. Participant demographic data was also collected and baseline descriptive statistics were calculated for the included studies.
Results: Seventy-one studies were included for review, representing a total of 6757 patients (2350 AD, 793 MCI, 2902 healthy controls (HC), and 841 others with a range of other neurodegenerative diagnoses). The mean baseline ages were 72.78± 3.69, 71.52± 2.88, 70.55± 3.85 years for AD, MCI and HC groups, respectively. The majority of studies noted significant structural and functional decline in AD patients when compared to HC. Although analysis of MCI groups yielded more mixed results, a similar pattern of decline was often noted amongst patients with MCI relative to HC. OCT and OCTA measurements were also shown to correlate with established measures of AD such as neuropsychological testing or neuroimaging.
Conclusion: OCT and OCTA show great potential as non-invasive technologies for the diagnosis of AD. However, further research is needed to determine whether there are AD-specific patterns of structural or microvascular change in the retina and optic nerve that distinguish AD from other neurodegenerative diseases. Development of sensitive and specific OCT/OCTA parameters will be necessary before they can be used to detect AD in clinical settings.
Keywords: optical coherence tomography, optical coherence tomography angiography, Alzheimer’s disease, mild cognitive impairment, dementia
Introduction
Alzheimer’s disease (AD) is a degenerative neurological disease that is the leading cause of dementia in the United States. According to current estimates approximately 5.8 million people aged 65 and older are living with this disease in 2020.1 As the population continues to age, the prevalence of AD is expected to grow. Clinically, it is challenging for physicians to distinguish AD from other causes of cognitive decline, particularly in older age groups. AD classically presents with an insidious onset of impaired executive functioning, which eventually progresses to severe cognitive impairment affecting multiple memory domains and compromising the ability of patients to perform activities of daily living. Ultimately, severe AD leads to death. Given that neuropathologic changes manifest decades before the onset of clinical symptoms in AD, early screening and diagnosis would facilitate the identification of individuals with preclinical disease.
Unfortunately, a definitive diagnosis of AD can only be made through histopathologic examination, which requires either an invasive brain biopsy or postmortem examination. While positron emission tomography (PET) imaging of the brain is an accurate and non-invasive modality that can be used to visualize amyloid,2 it is cost-prohibitive for most patients. Cerebrospinal fluid (CSF) testing can be used to determine levels of beta-amyloid and tau. However, this procedure is invasive, and currently there is limited evidence regarding the benefit of CSF biomarkers compared to biomarkers obtained by other modalities.3 Thus, there is a significant need to identify a noninvasive and cost-effective diagnostic modality that is widely accessible to patients.
In this effort, recent investigations have explored whether the retina and optic nerve can provide promising screening targets for early detection of AD. Embryologically, these structures are derived from the diencephalon4 and are therefore considered extensions of the central nervous system (CNS), providing a “window” into the central nervous system. It is therefore biologically plausible that in patients with AD, pathologic changes such as amyloid plaque deposition and neuronal degeneration may also be observed in the retina and optic nerve.5 A number of studies have demonstrated retinal changes and vascular measures associated with cognitive decline through fundus photography and postmortem human eyes.6–10 Retinal amyloid beta plaques have also been identified in transgenic mouse models using in vivo optical imaging.11 More recently, non-invasive high-resolution ocular imaging techniques including optical coherence tomography (OCT) and optical coherence tomography angiography (OCTA) have been proposed as tools for evaluating ocular changes in AD. Other imaging techniques such as widefield fundus photography,12 fluorescence lifetime imaging ophthalmoscopy,13 fundus autofluorescence,14 confocal scanning laser ophthalmoscopy,15 and retinal oximetry16 have also been applied to the study of AD. For example, widefield fundus photography has been used to identify changes in the peripheral retina in AD,12 while fundus autofluorescence has revealed plaque-like lesions in patients with mild cognitive impairment (MCI).14 However, these tools are currently not as widely available and have not been studied as extensively as OCT and OCTA. In just the past three years, there has been an explosion in research investigating the use of OCT and OCTA for the evaluation of AD, with over 35 new studies published and investigation of a number of novel parameters.17–54 In the following review, we summarize the proposed ocular manifestations of AD observed by OCT and OCTA in the recent literature and explore their potential for evaluating retinal and optic nerve pathology to enable earlier detection of Alzheimer’s disease.
Materials and Methods
Articles for this review were acquired through the PubMed research database. Studies were found using a combination of the following MeSH terms: “optical coherence tomography” or “optical coherence tomography angiography” AND “Alzheimer’s” or “Alzheimer’s disease”. References were then uploaded to a customized database for review using Covidence software (Melbourne, Australia). Articles were reviewed by three independent reviewers from Duke University School of Medicine in Durham, N.C. (A.A., A.S., N.J.). To be included in this review, studies had to be relevant, original, and peer reviewed. Studies were excluded if they were deemed to be irrelevant by at least two of the three reviewers. Animal studies and non-primary literature such as systematic reviews, meta-analyses, and editorials were also excluded. After an initial list of studies was generated, additional studies were included as a result of expert opinion and review of references of included studies.
References were primarily categorized based on participant diagnostic groups, the type of imaging used, and the OCT/OCTA parameters of interest. Descriptive statistics were calculated using Microsoft Excel (Version 16.4) to determine baseline characteristics of the studies included for final review.
Results
Preliminary PubMed queries resulted in 92 references. Of these, 6 references were excluded because they were deemed irrelevant by at least two of three reviewers. A total of 15 systematic reviews, meta-analyses, and editorials were excluded on the basis that they were non-primary sources. Three animal studies and four case reports were also excluded. Two studies published in non-English languages were also excluded. Nine additional studies were identified by soliciting expert opinion and by reviewing the reference sections of studies captured by the initial PubMed search. Thus, a total of 71 studies were included for final review (Figure 1). Sixty (84.5%) studies used only OCT as the primary method of imaging, 8 (11.3%) studies used only OCTA, and 3 (4.2%) studies presented results from both OCT and OCTA. A comprehensive list of studies with summarized data can be found in Table 1.
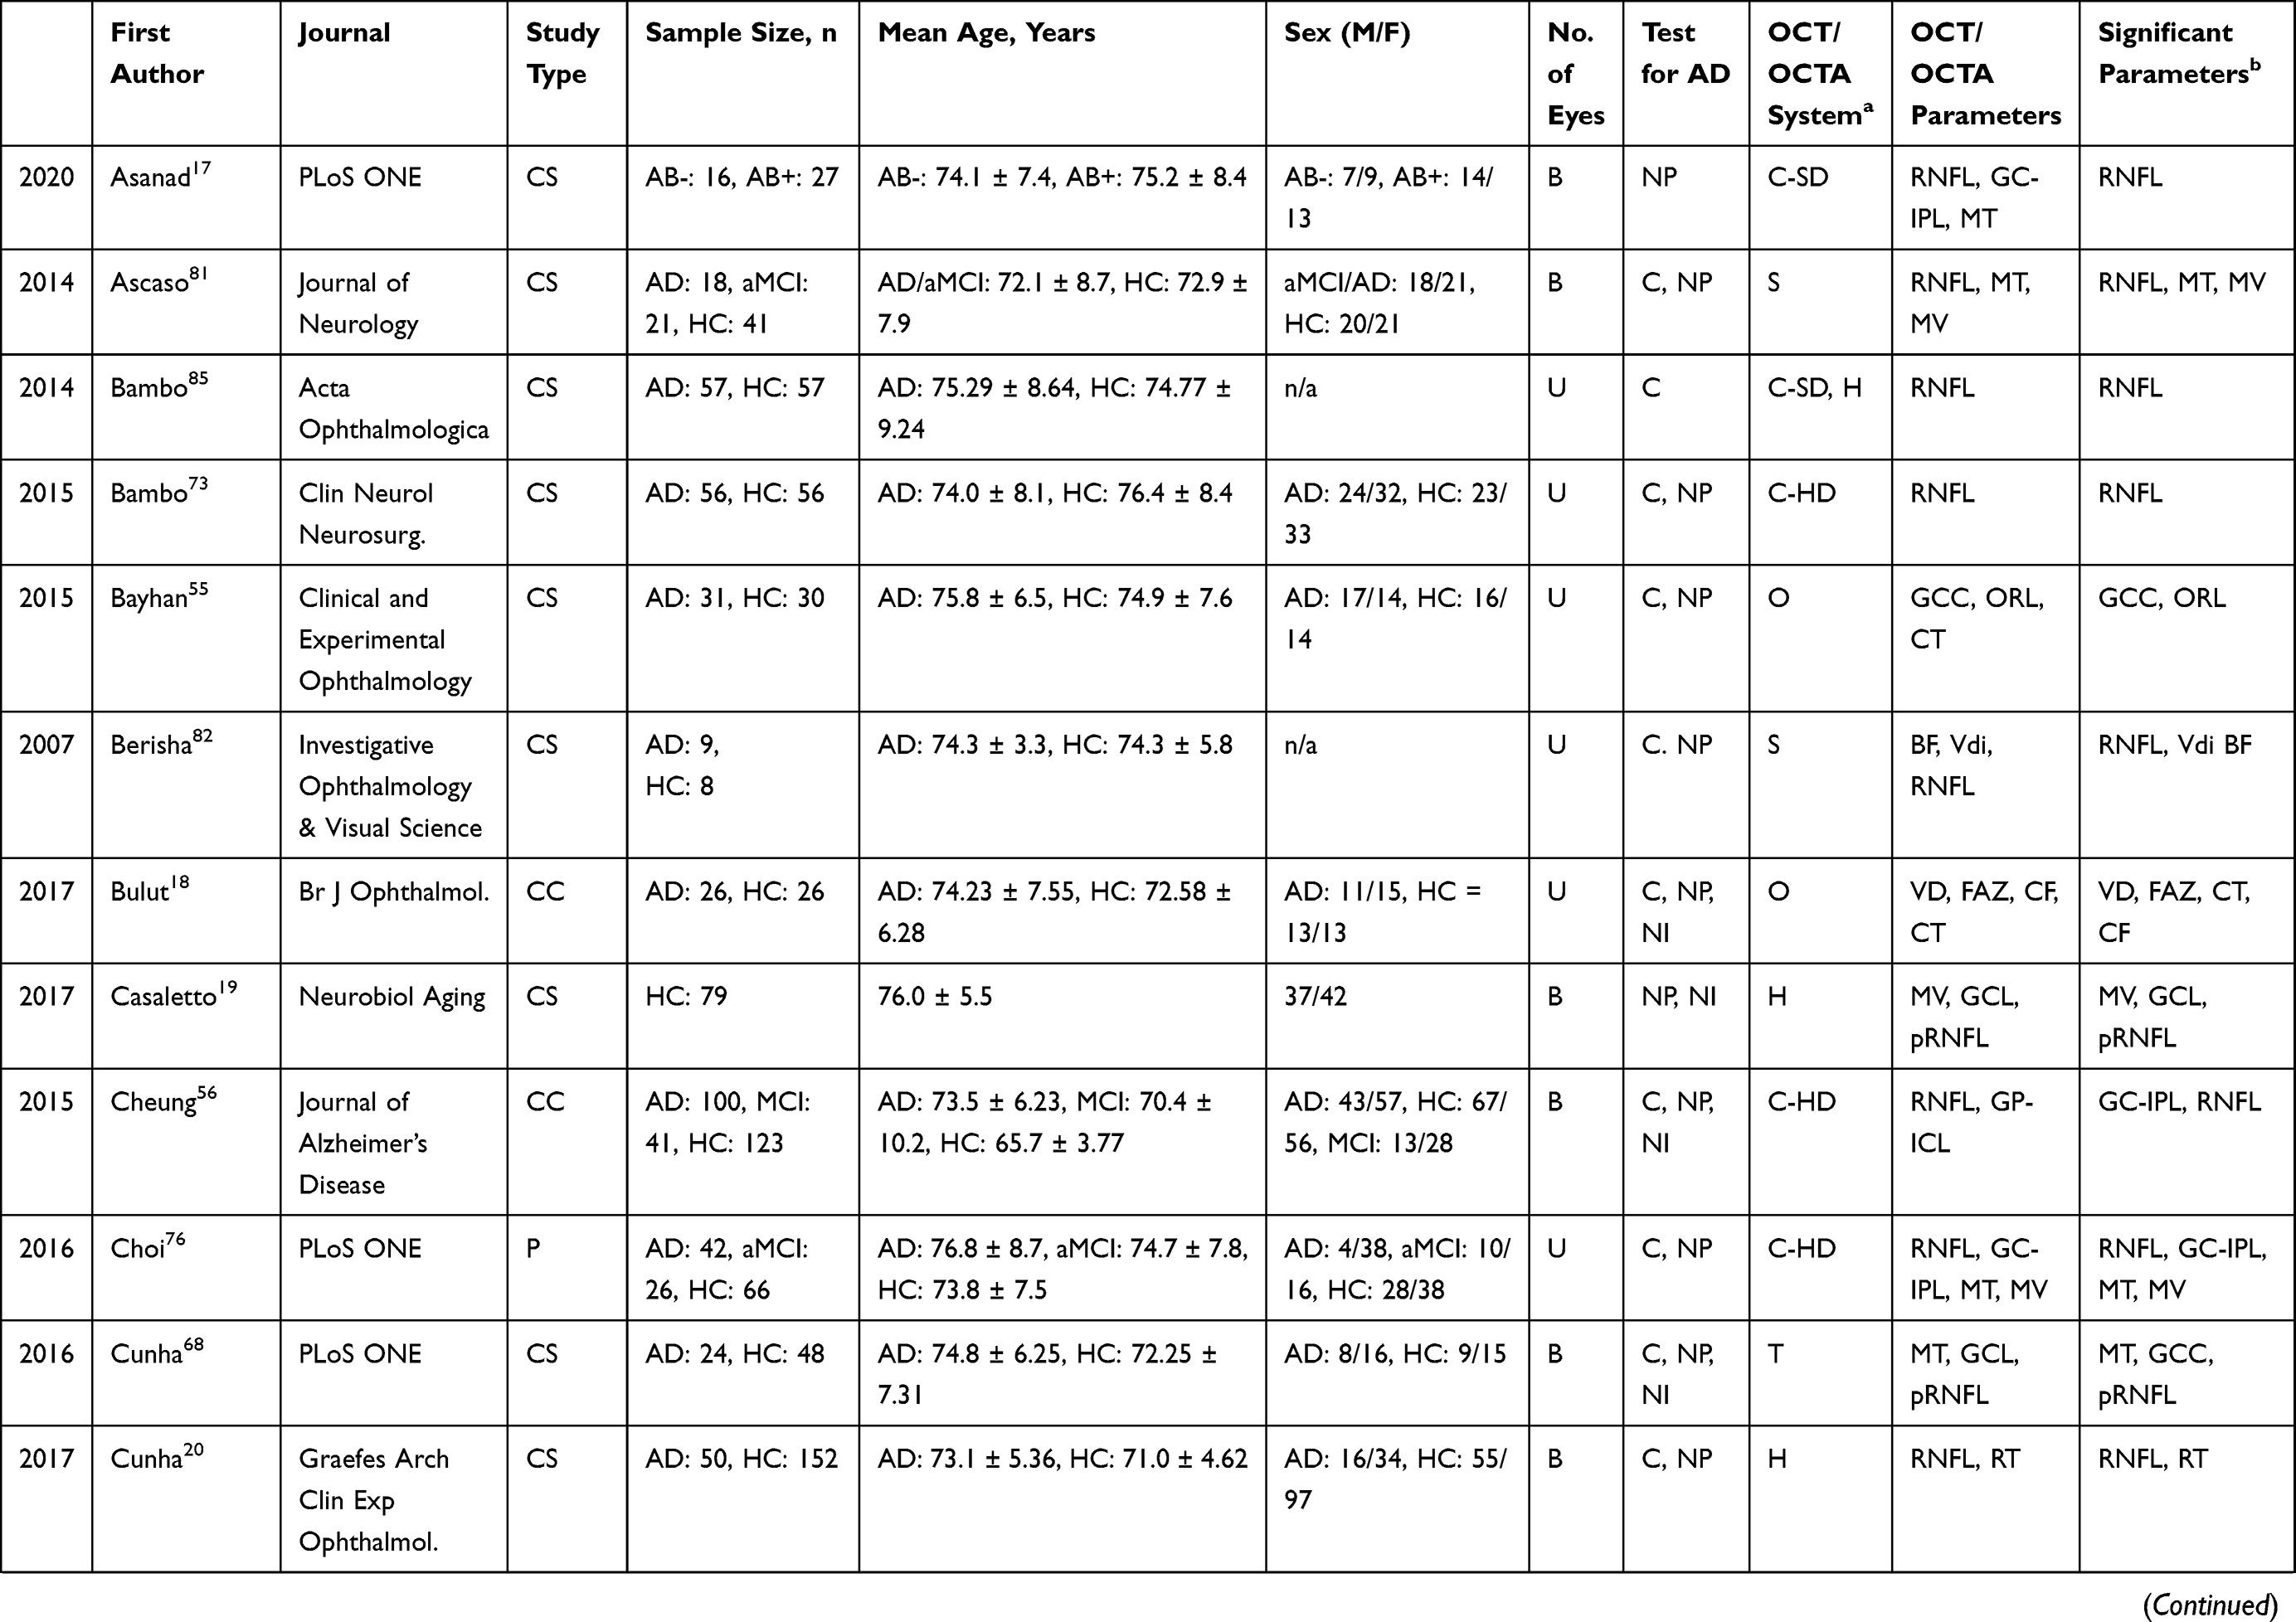 | 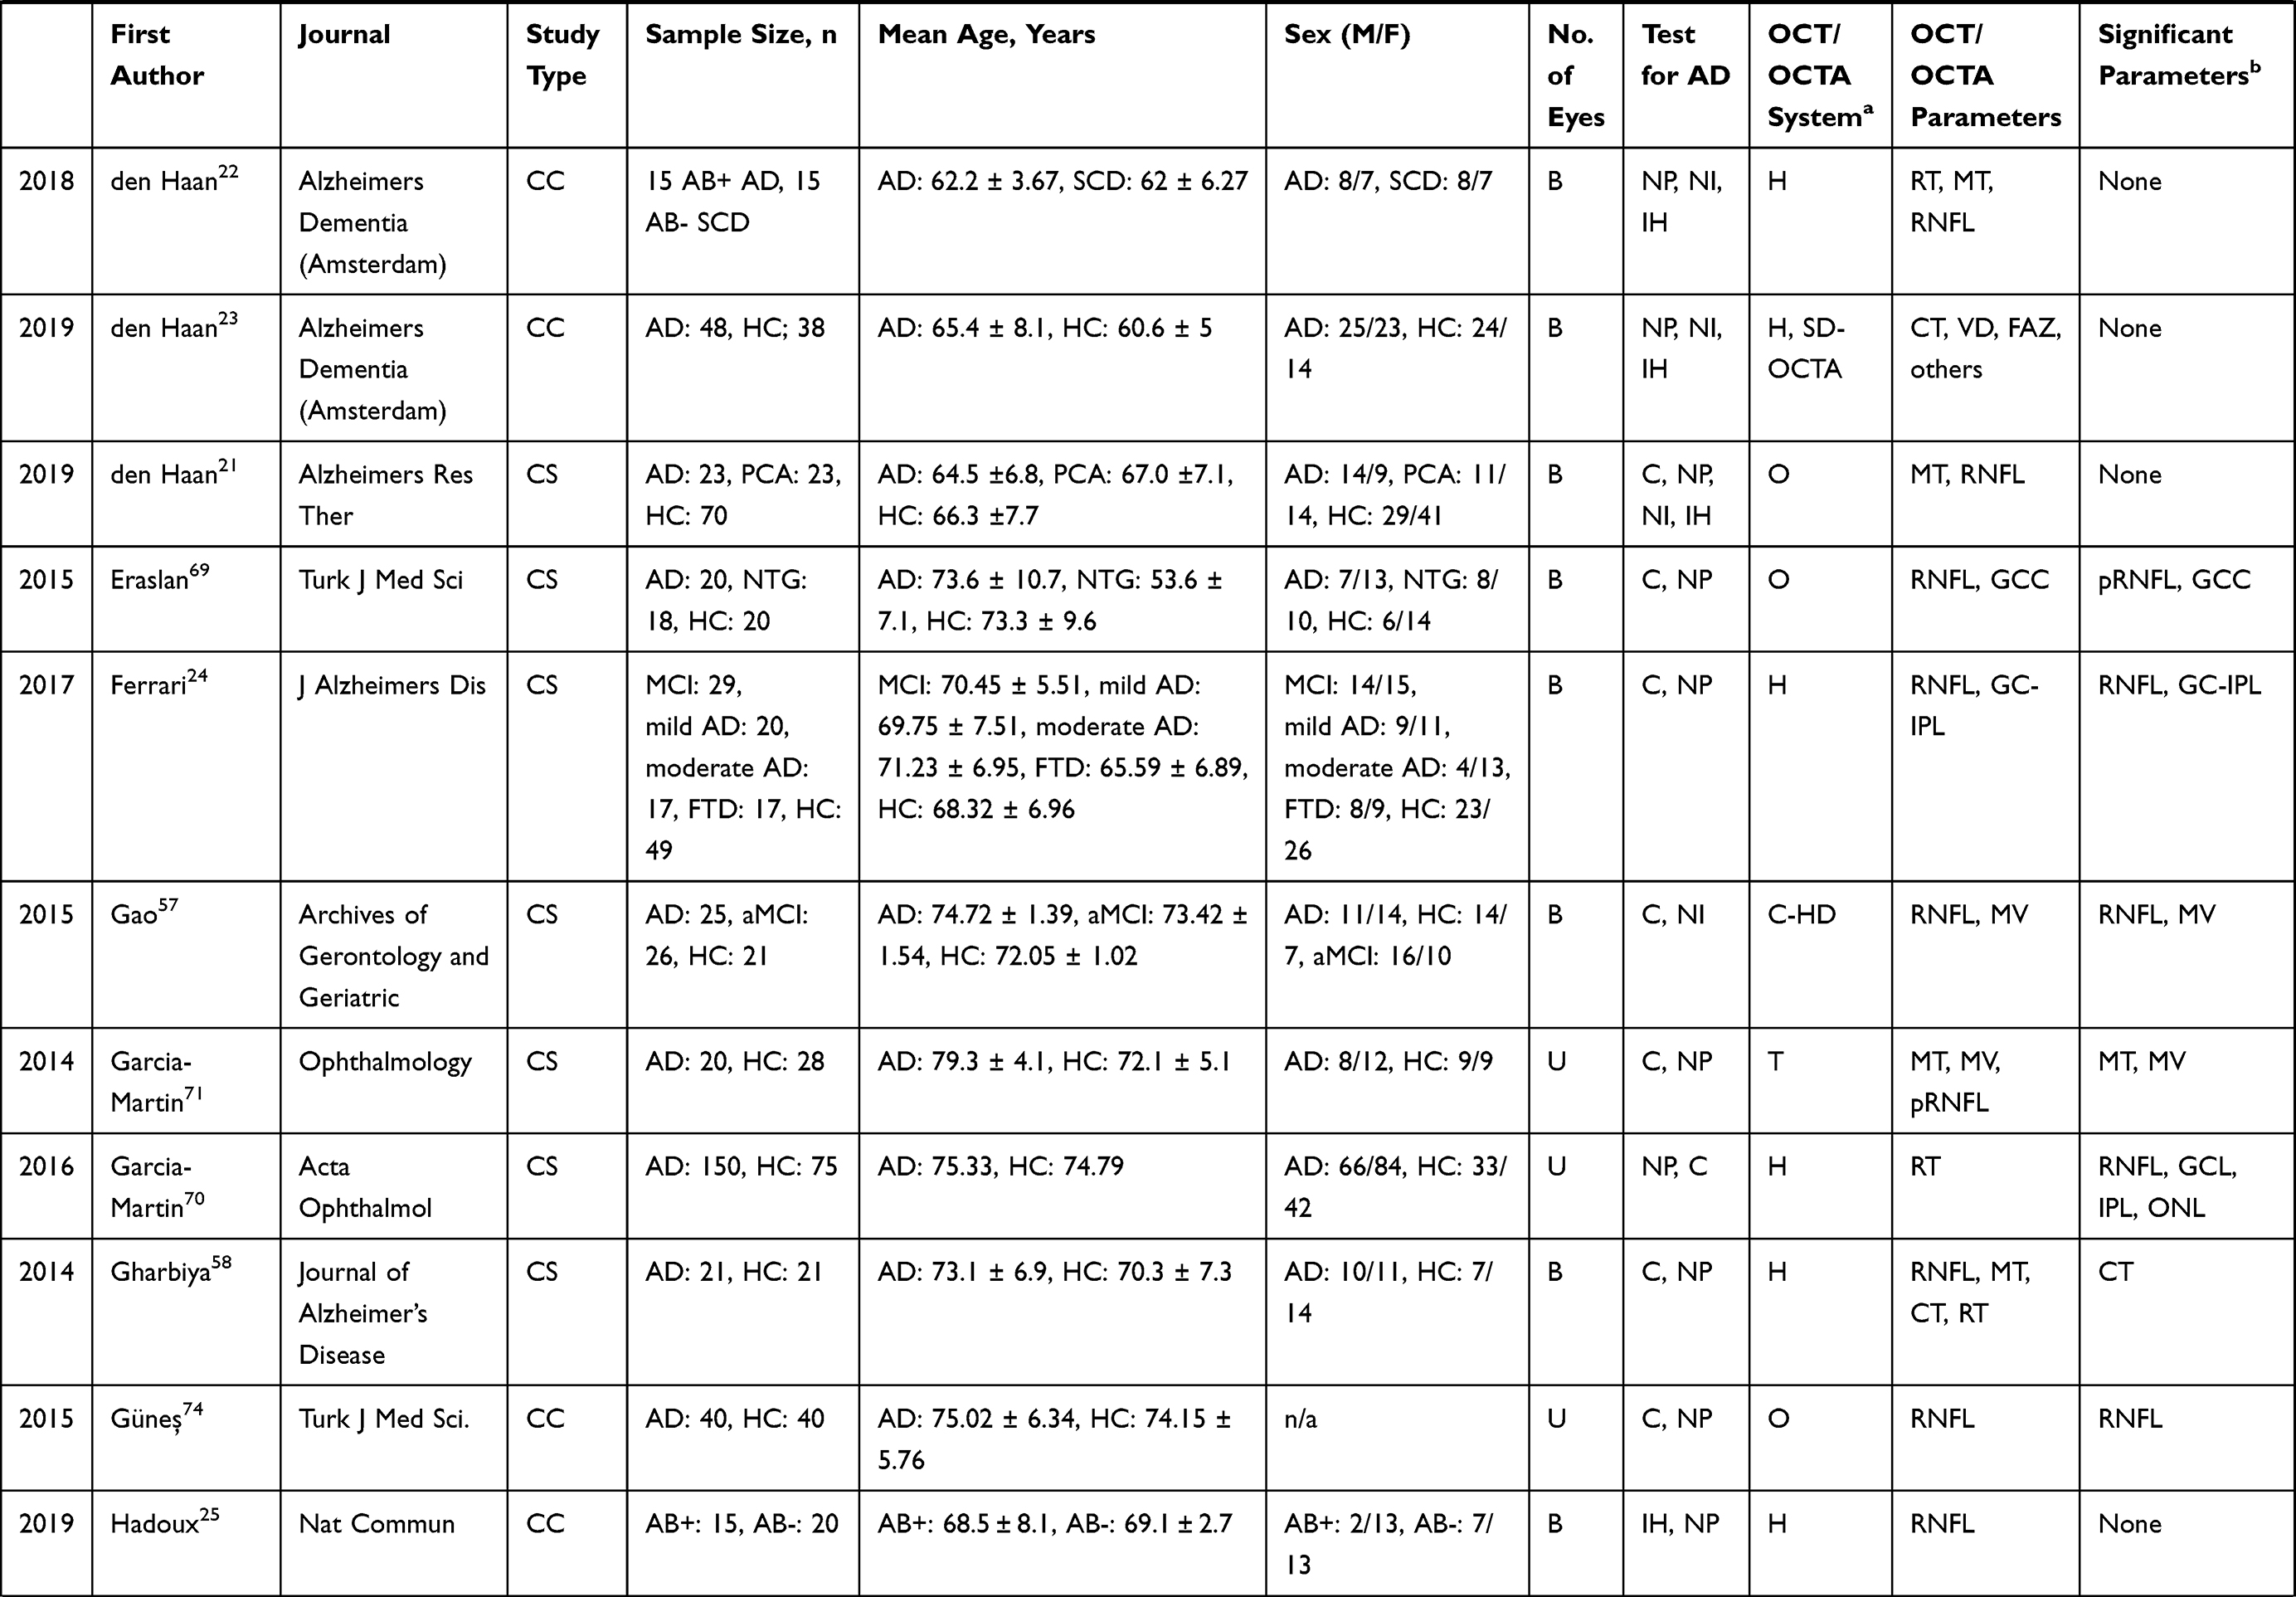 | 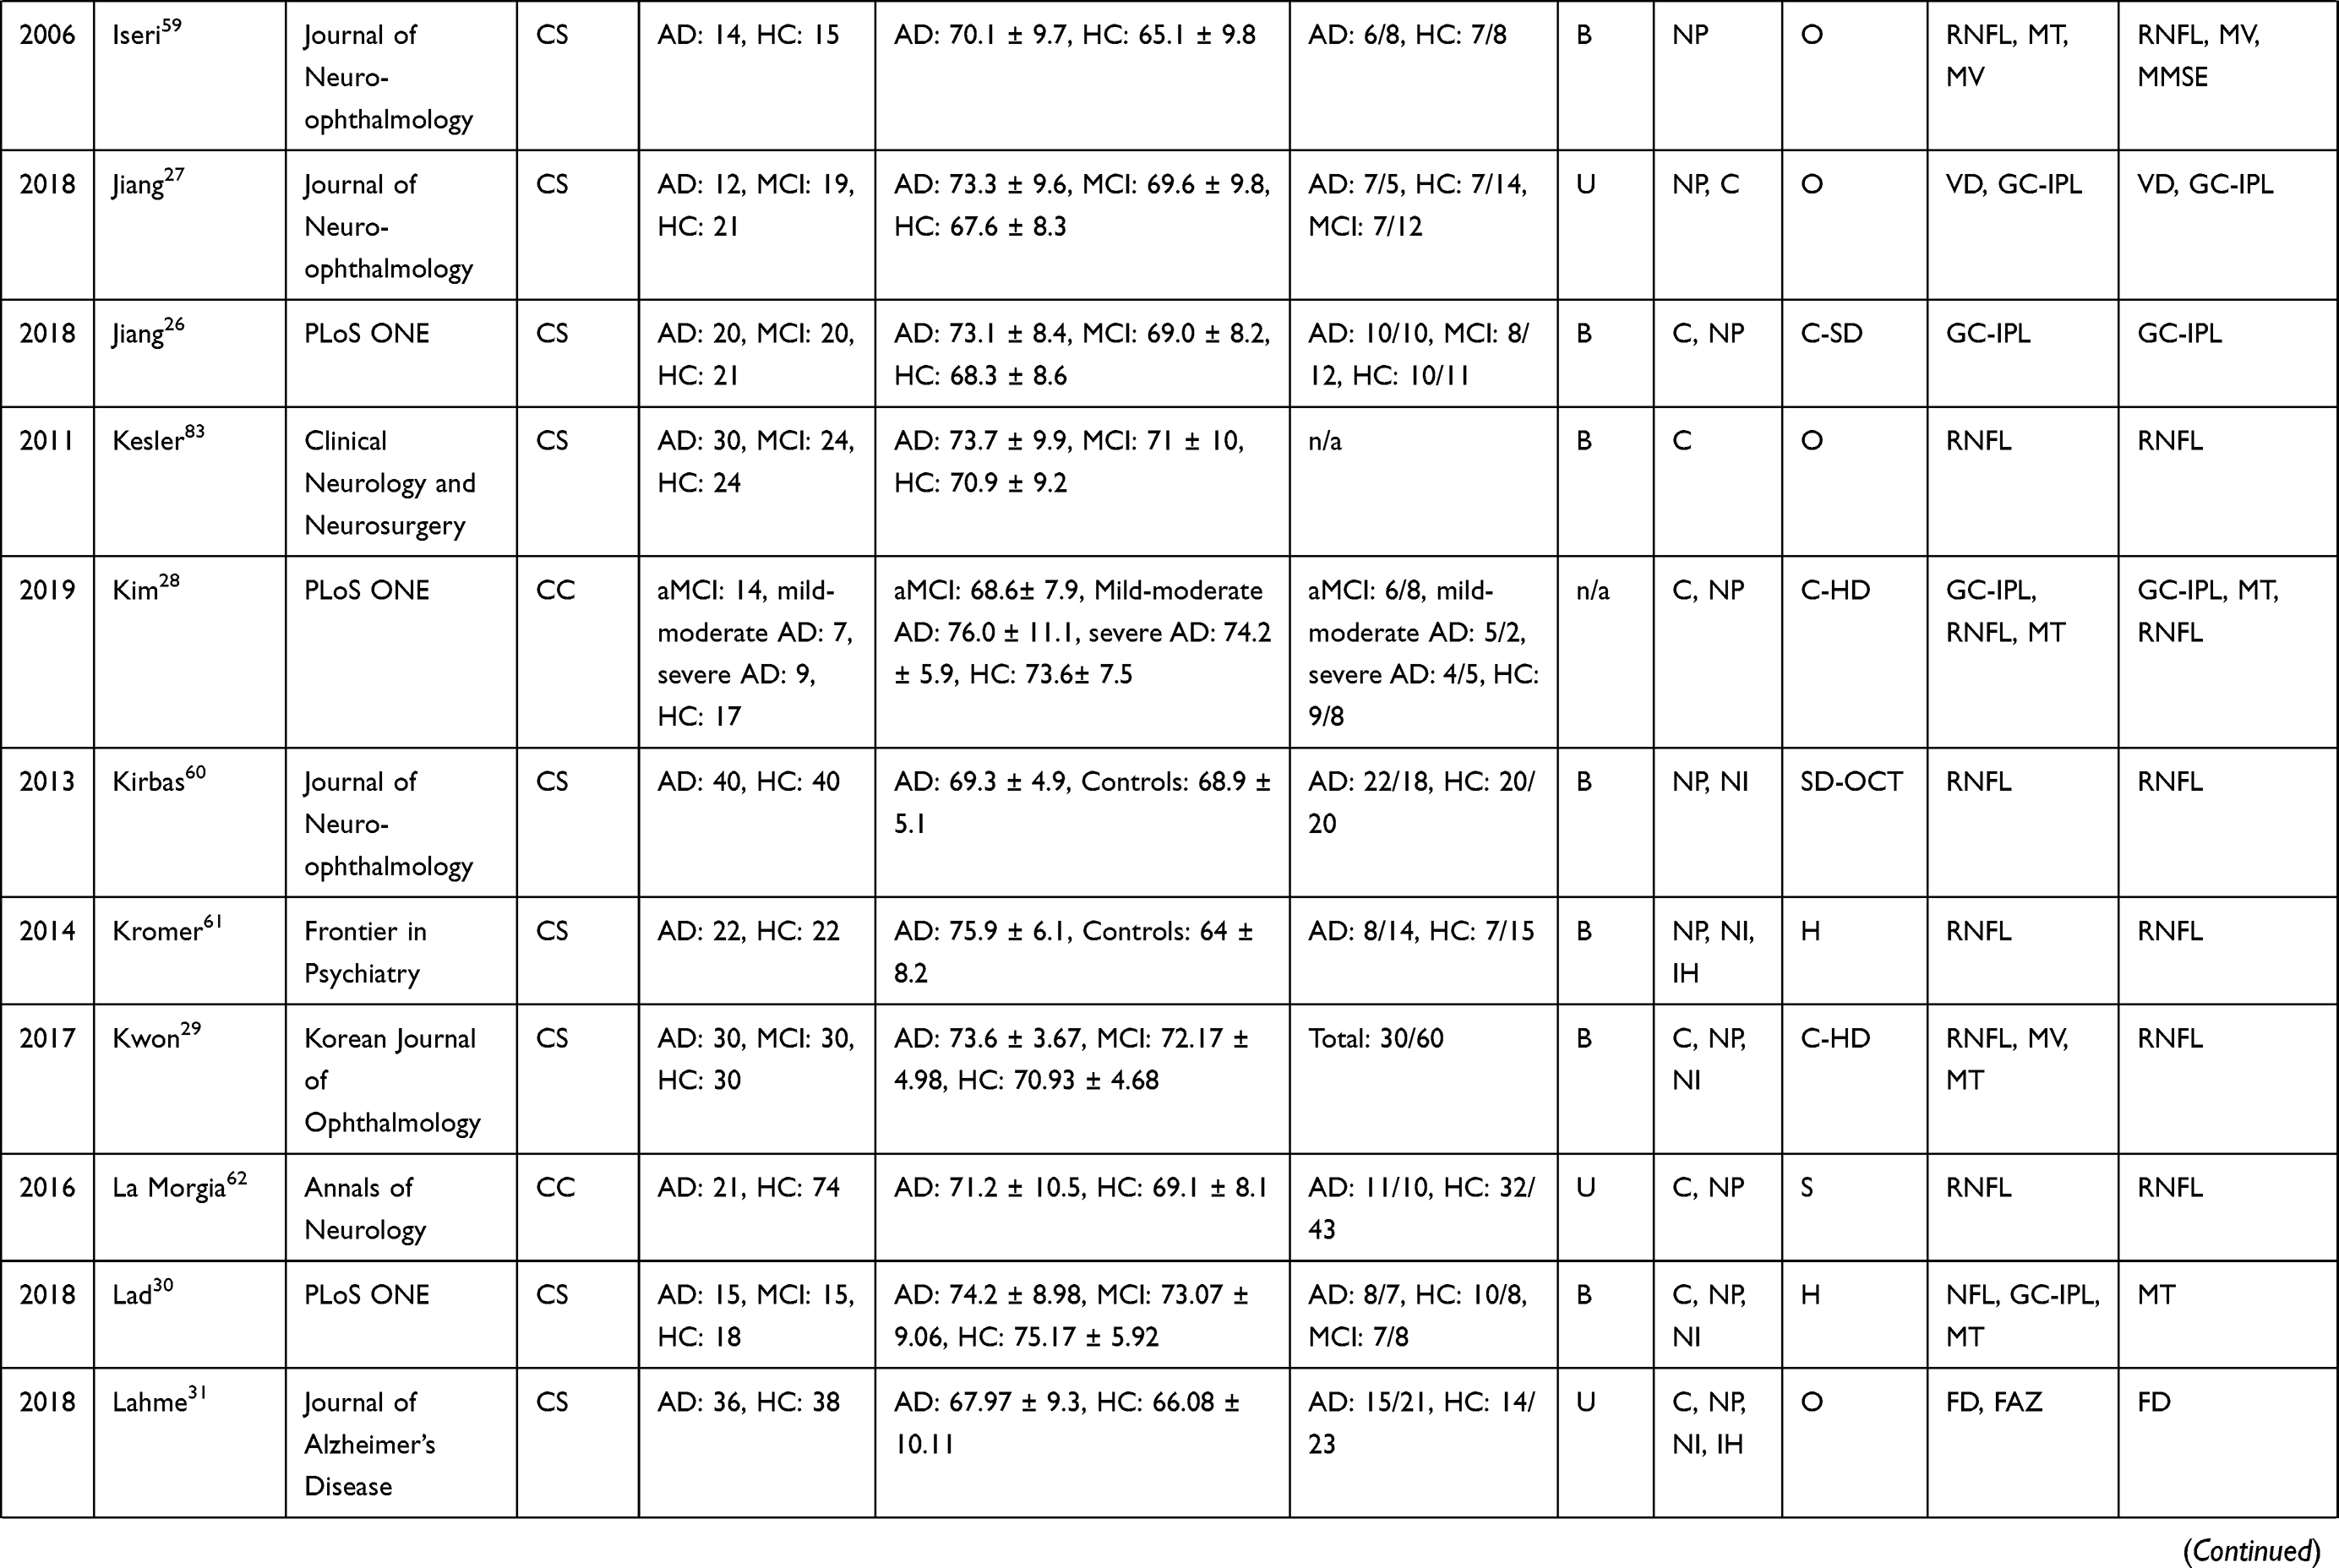 | 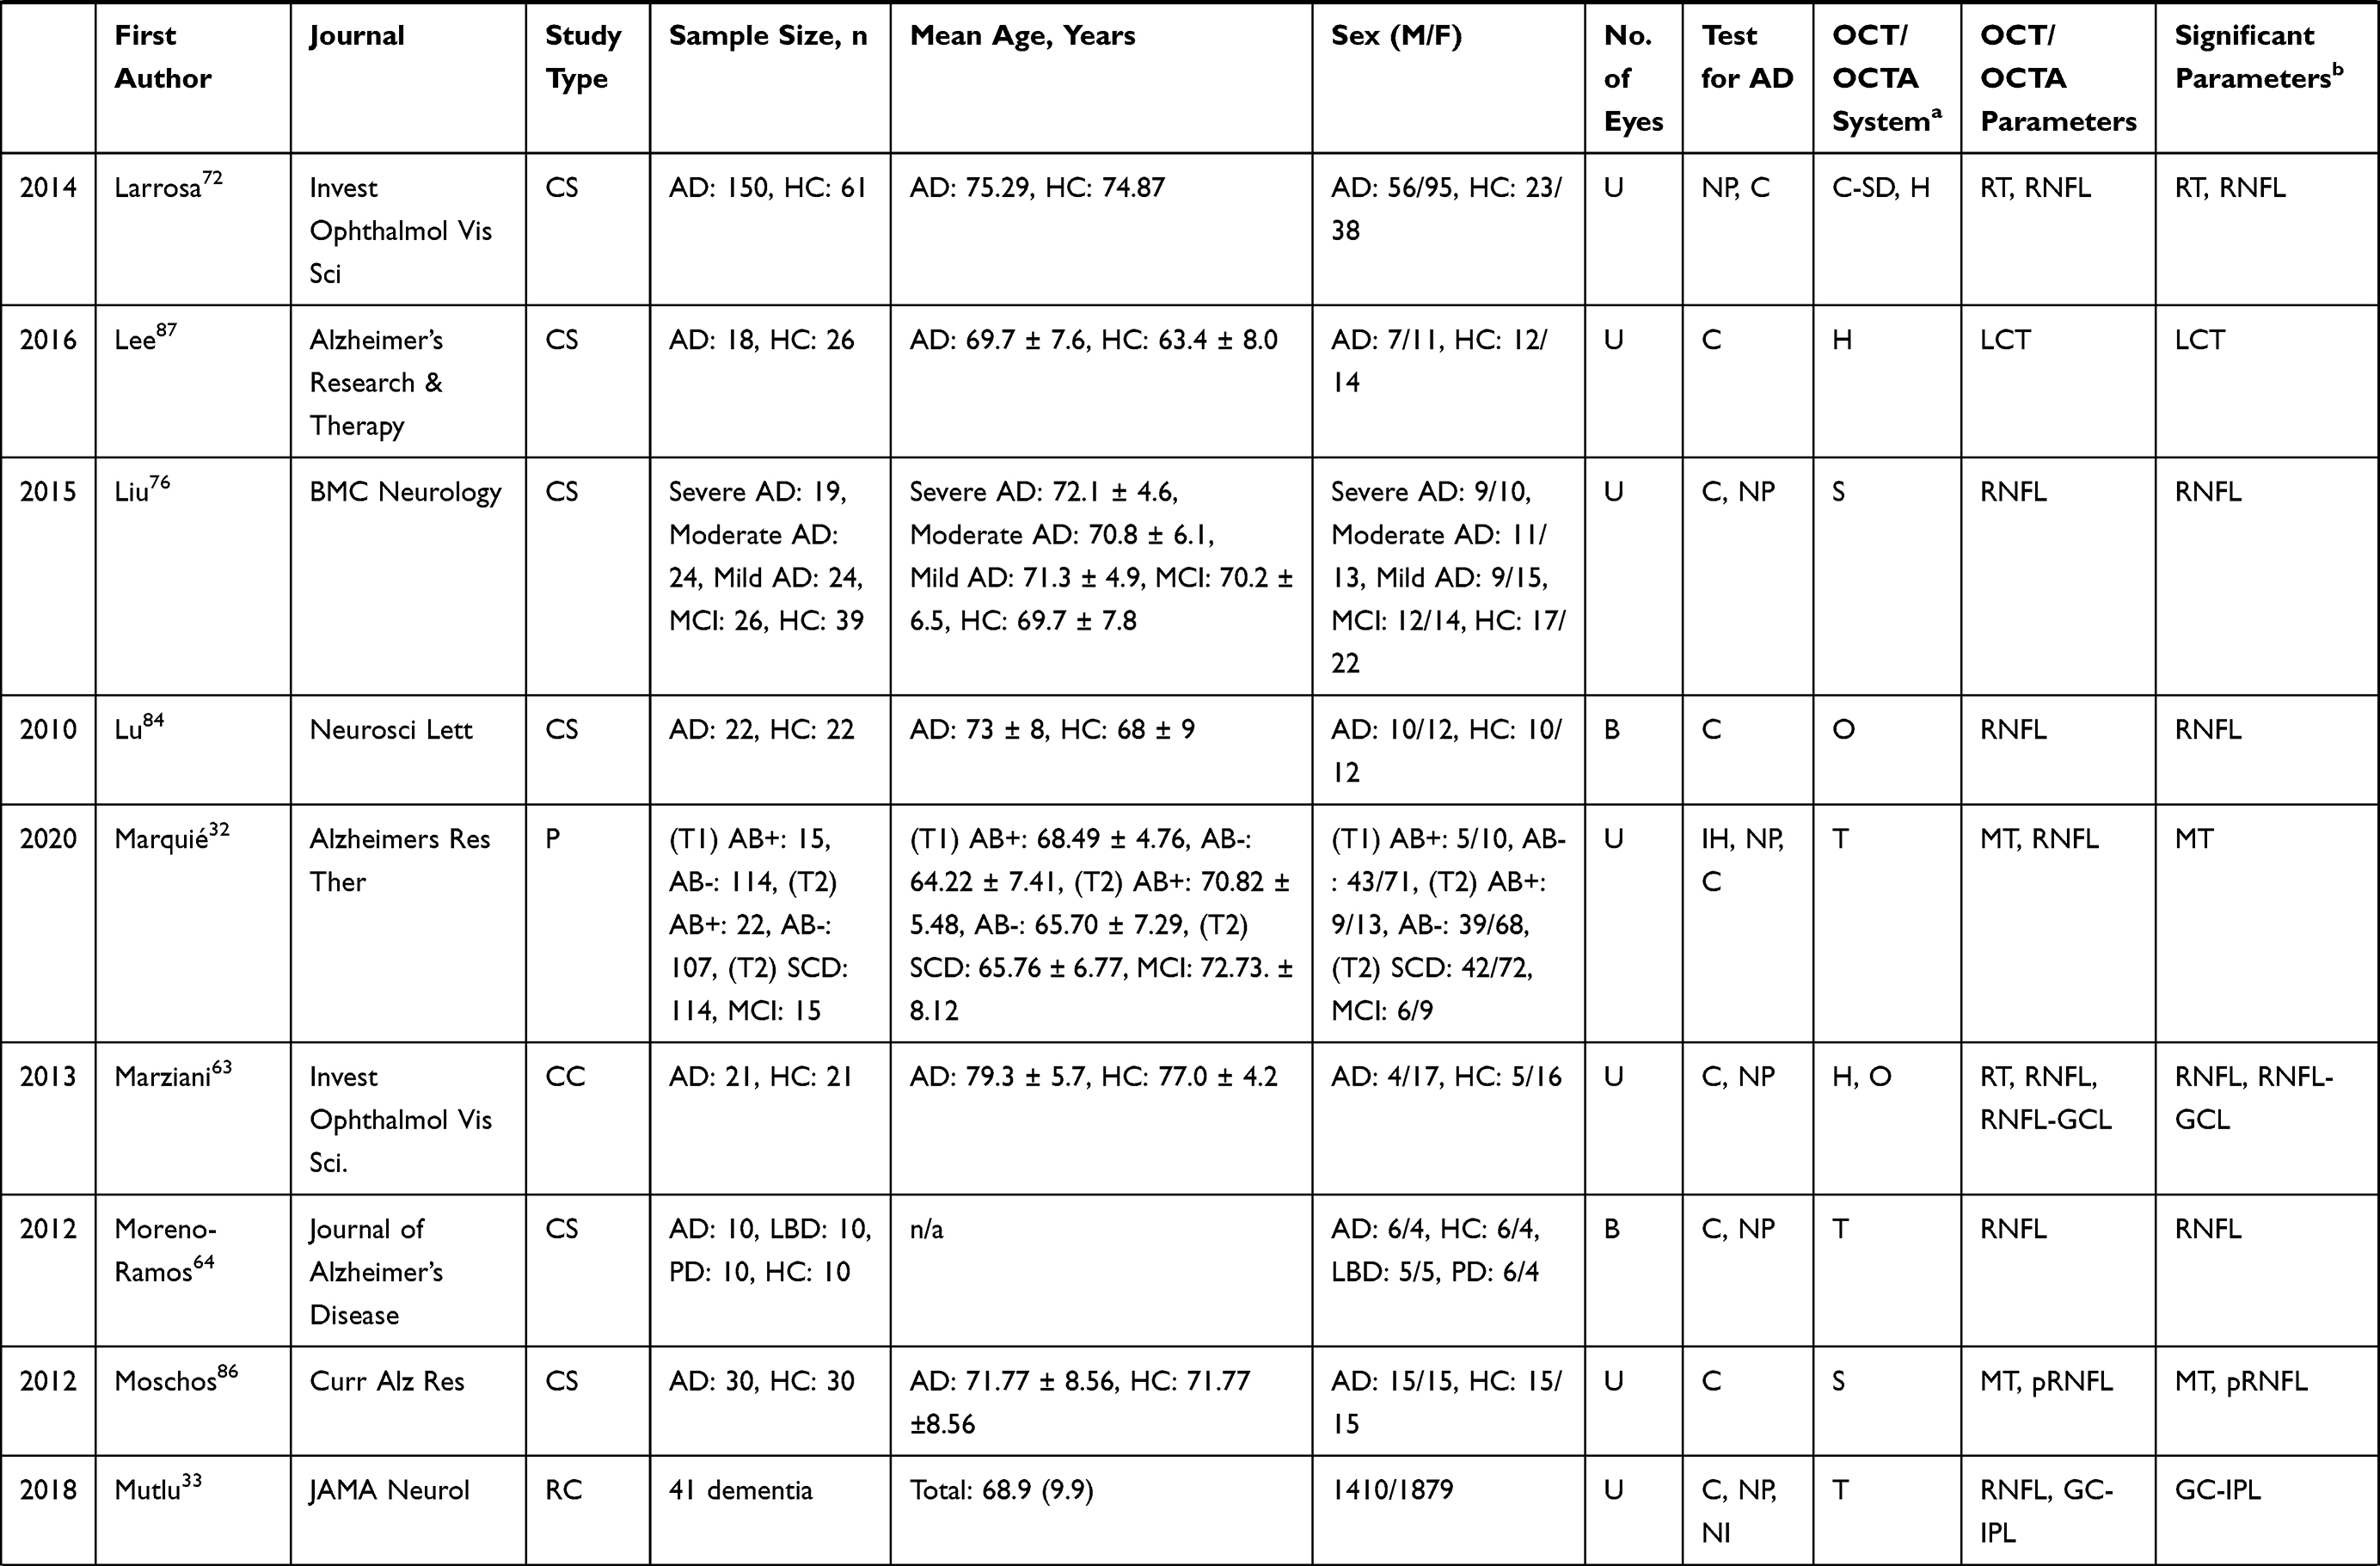 | 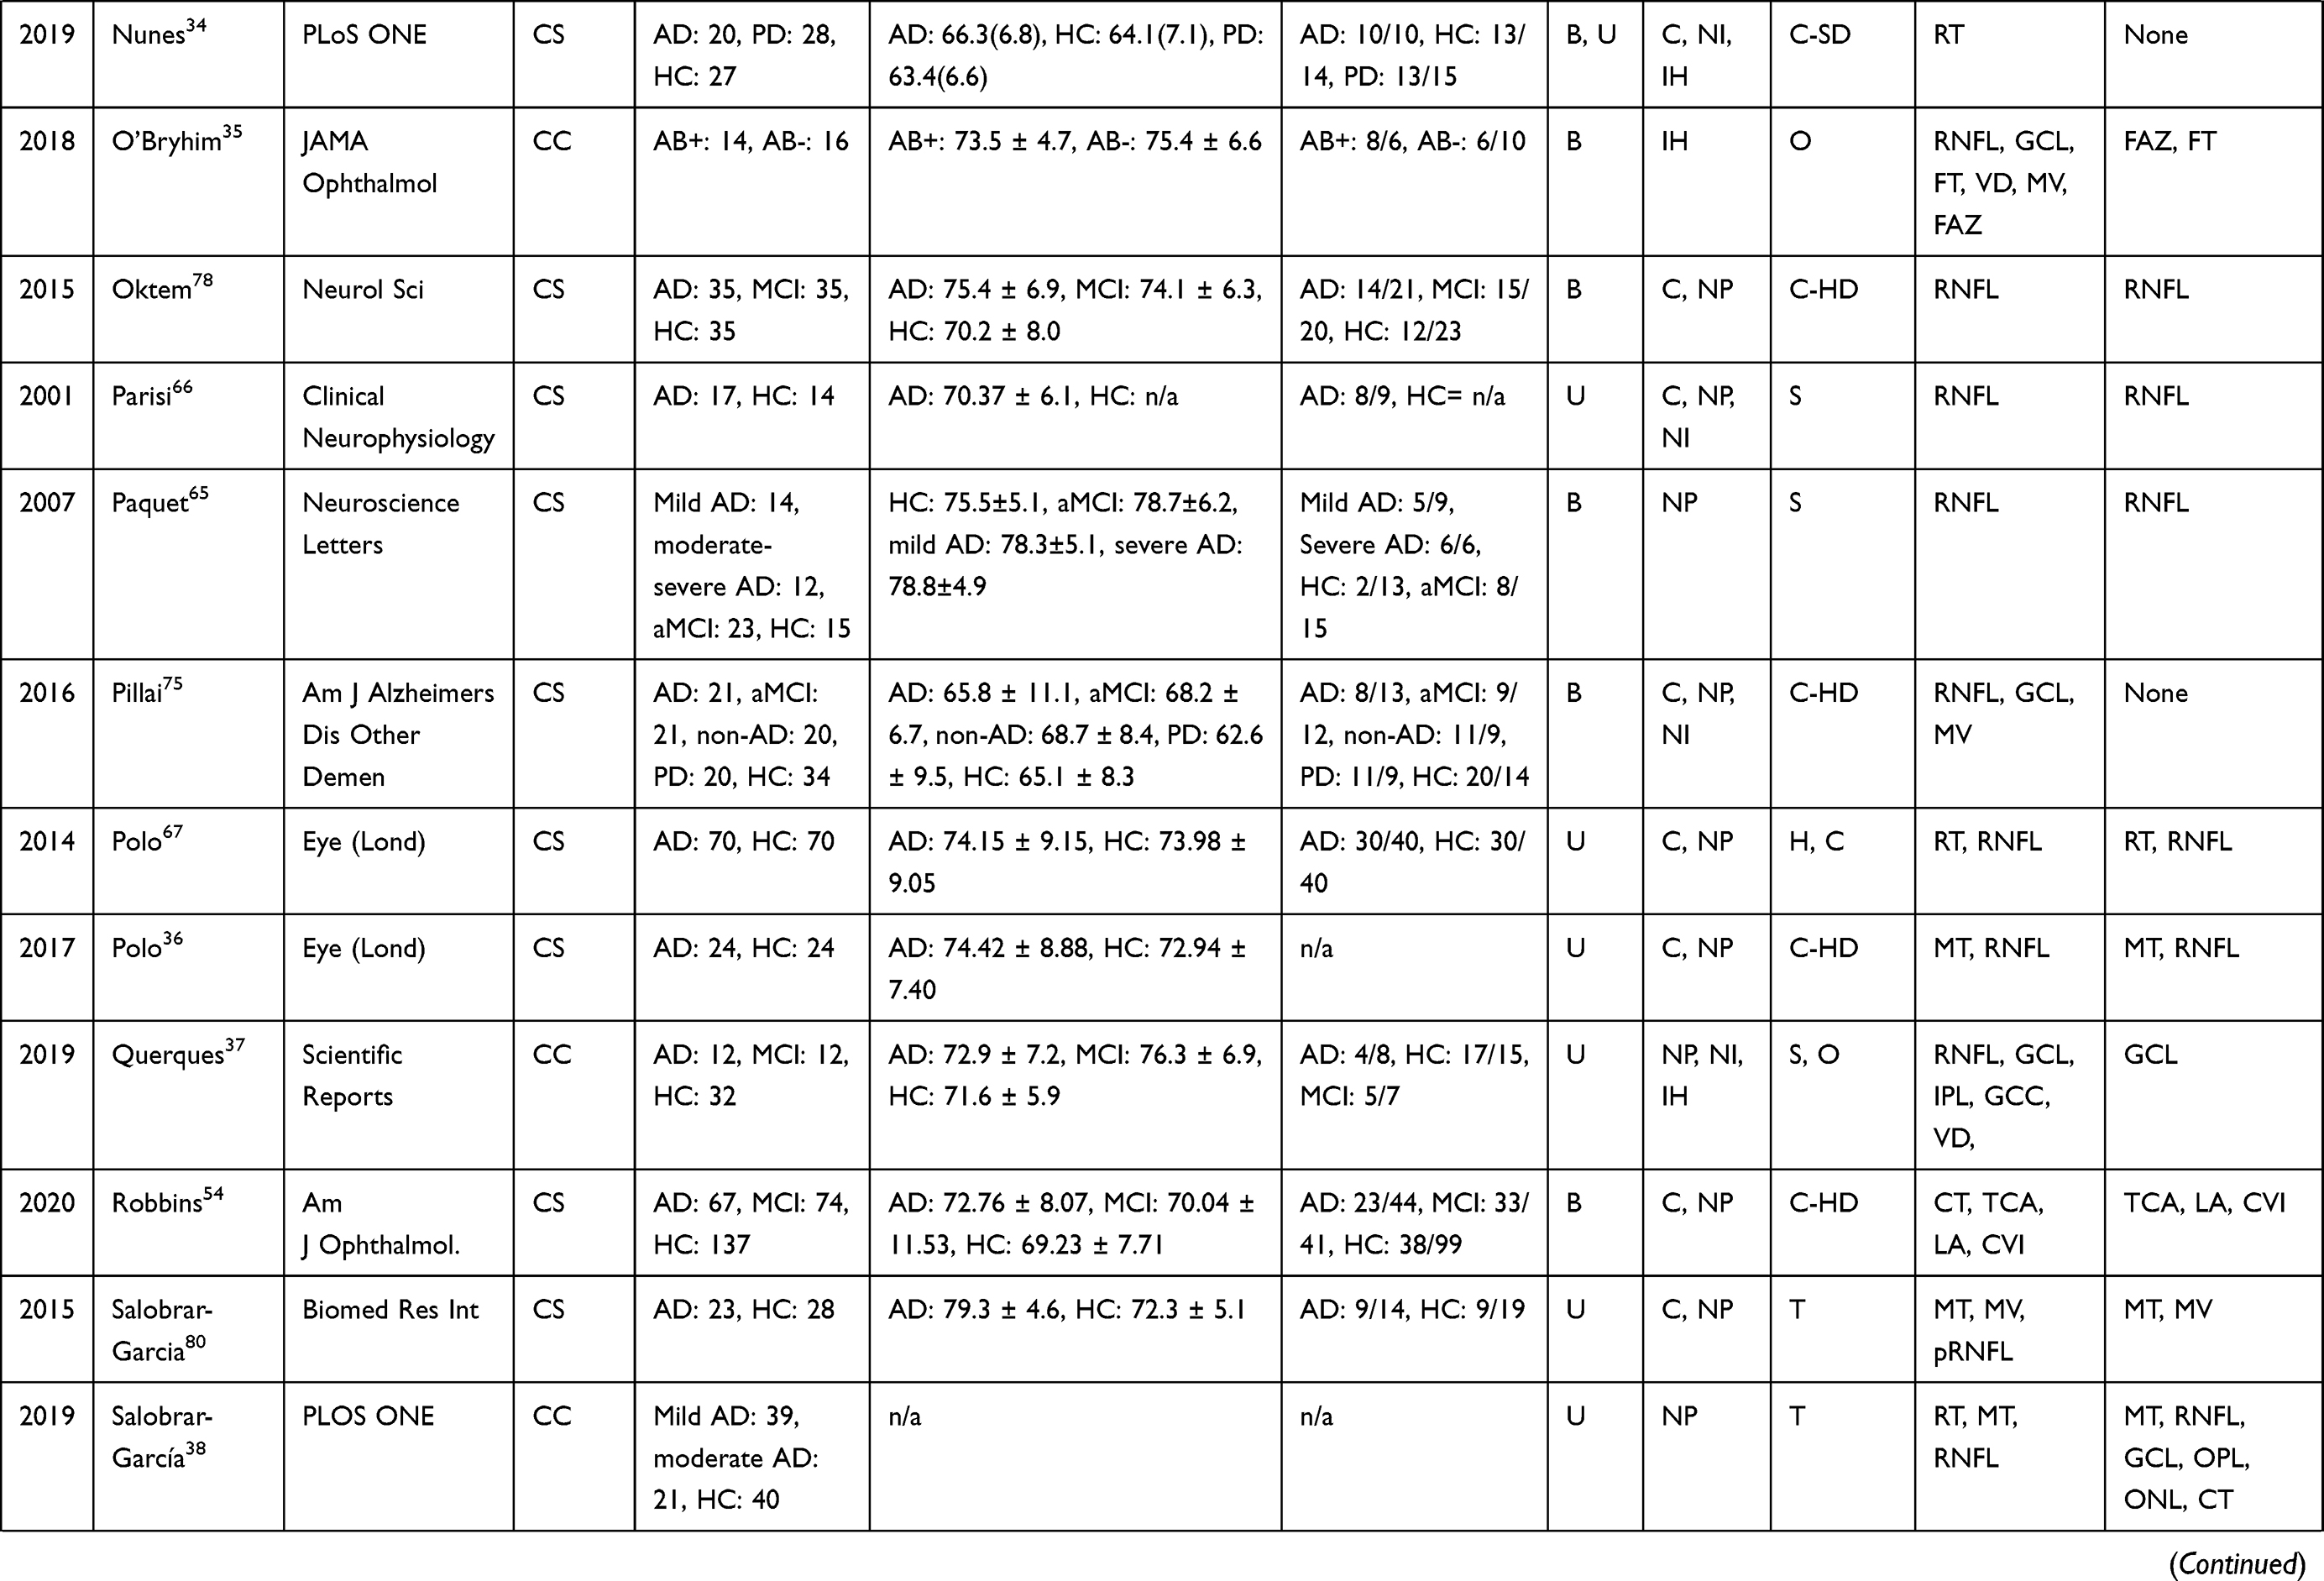 | 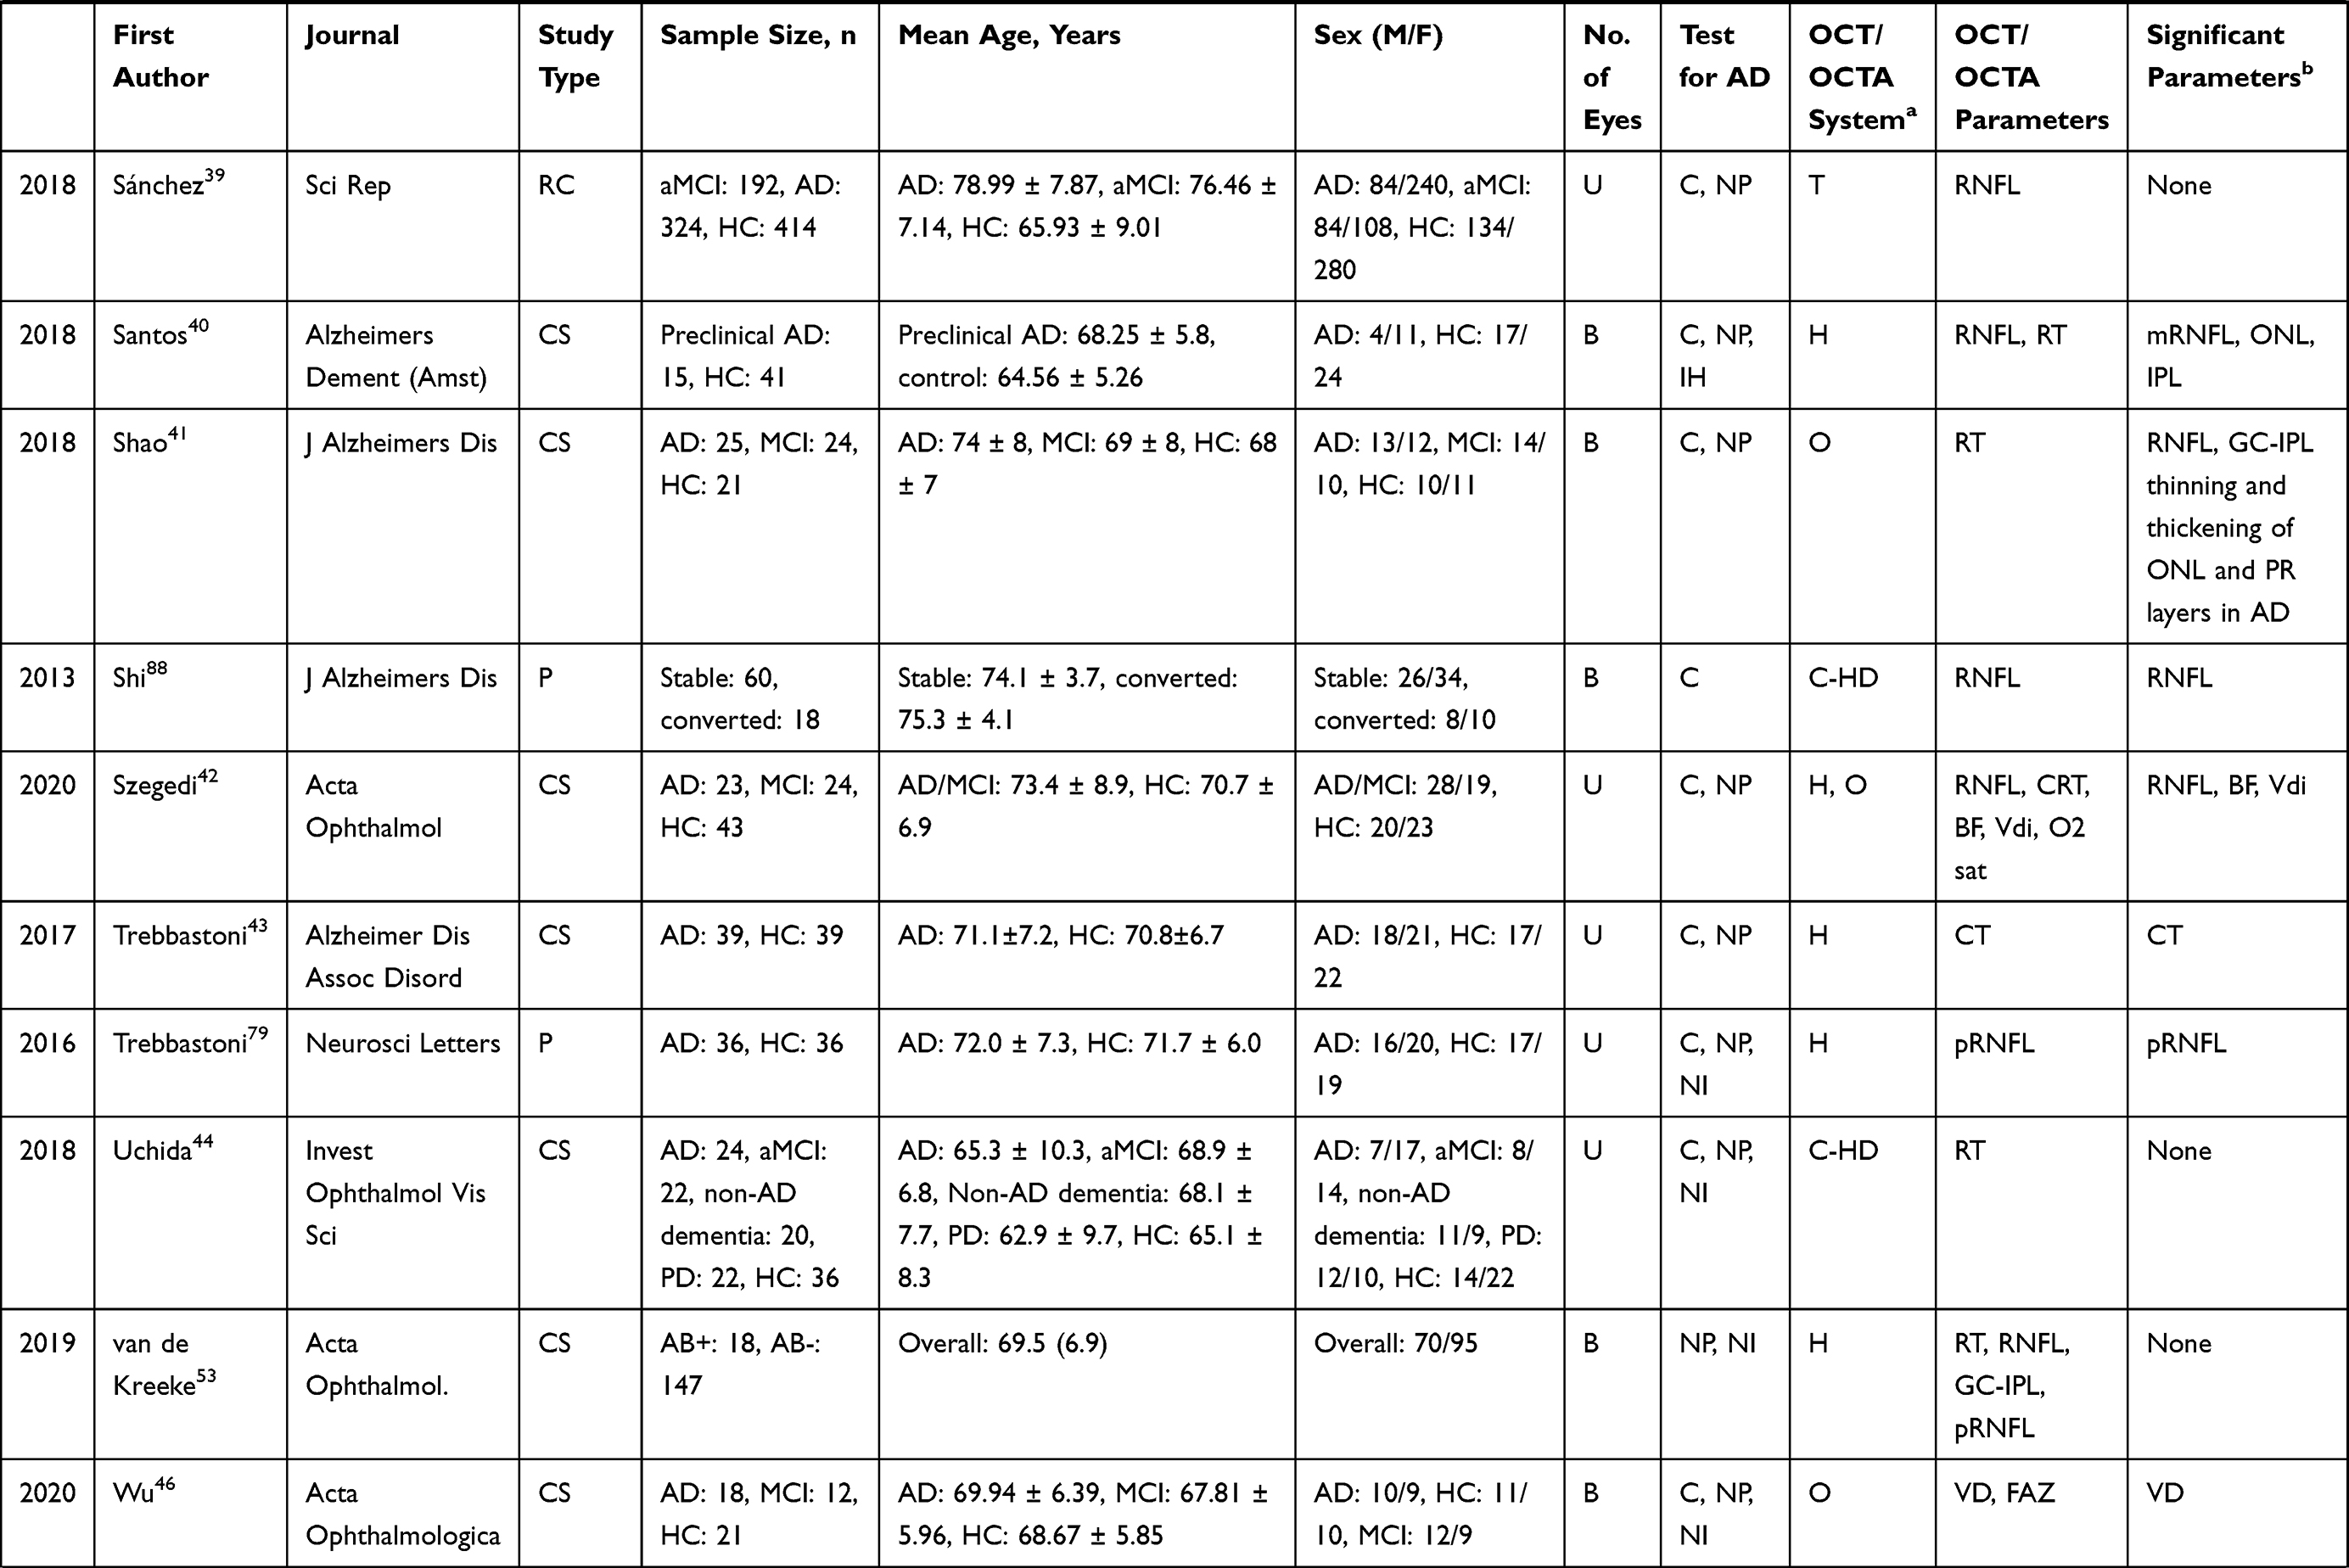 | 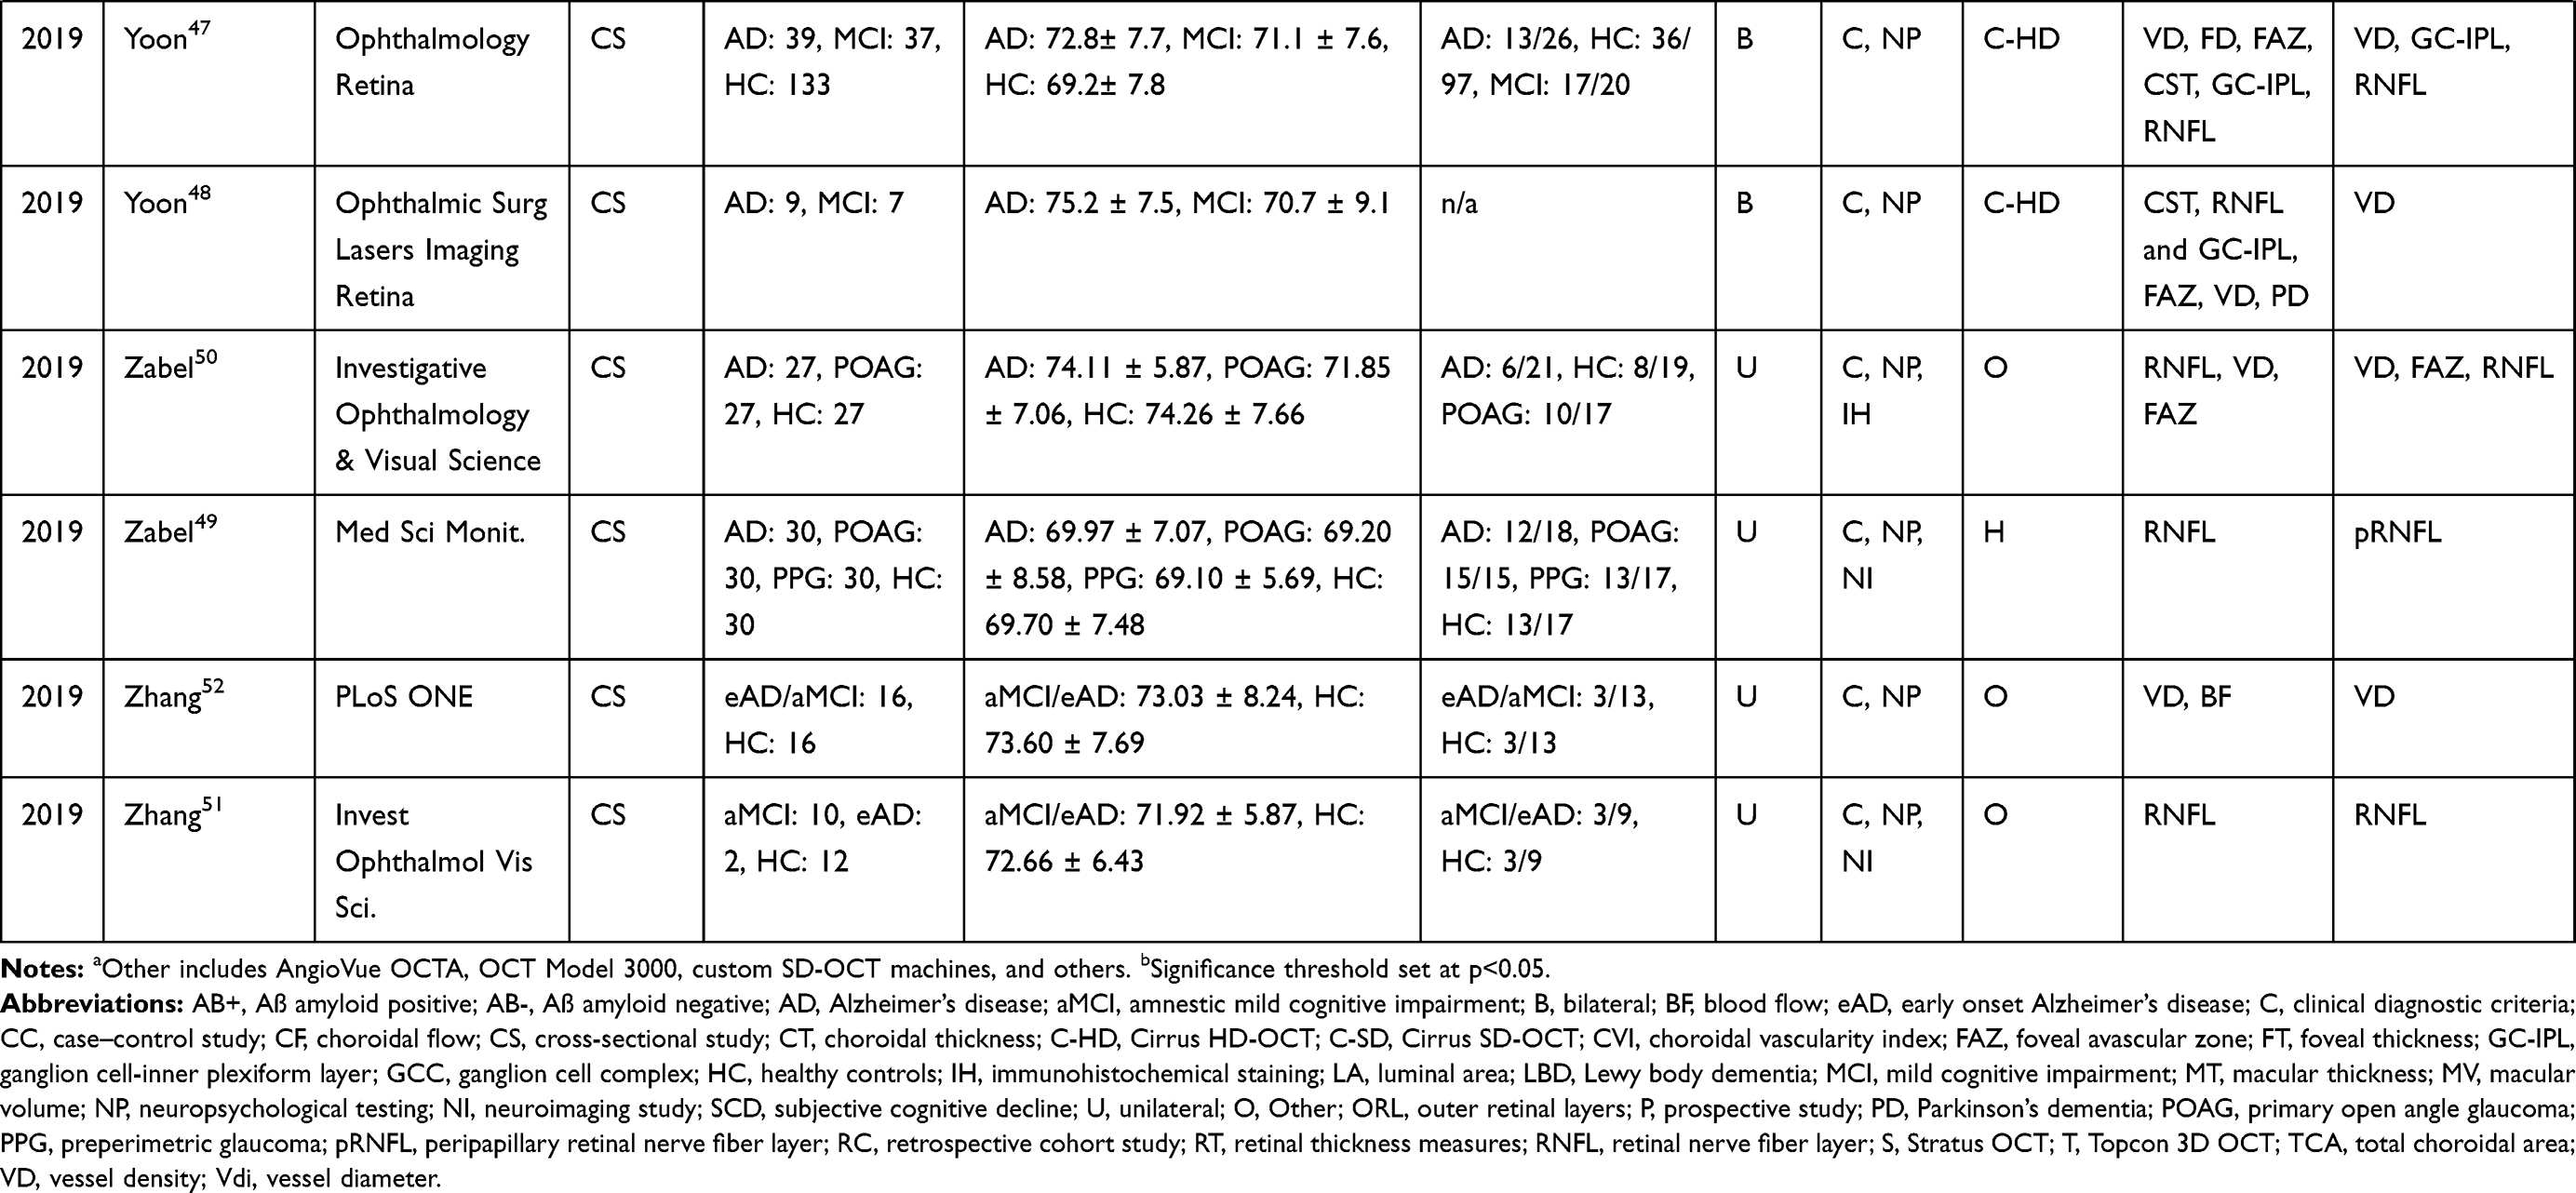 |
Table 1 Summary of the Included Studies |
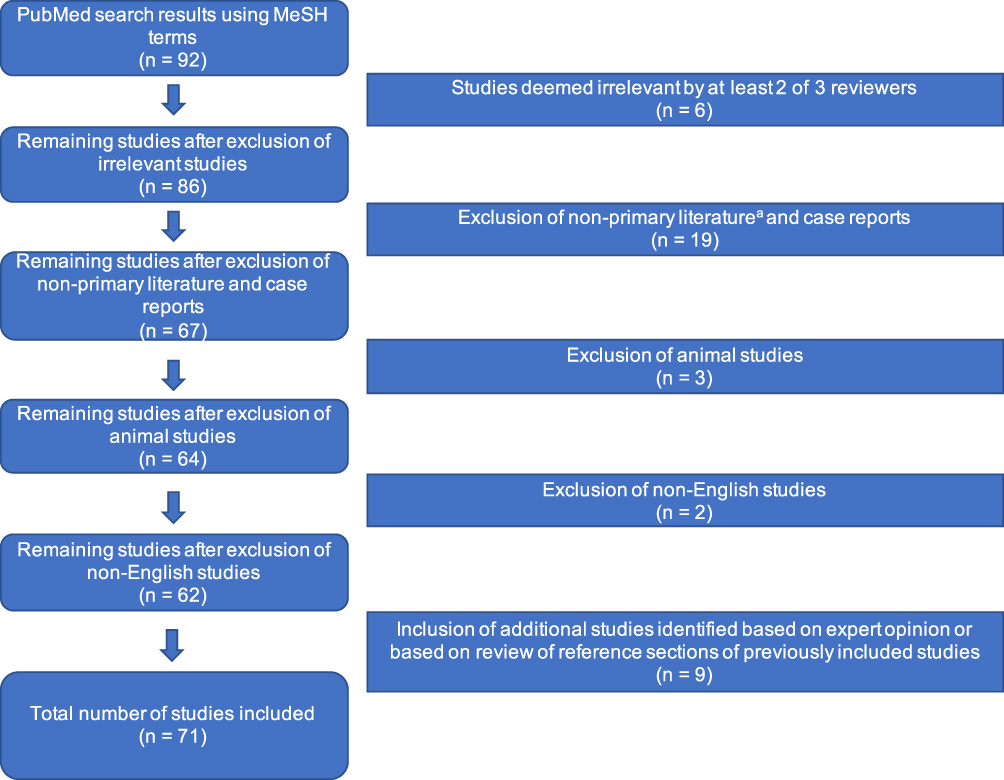 |
Figure 1 Flow chart of literature review process used to acquire references. Notes: aNon-primary literature included summary articles such as systematic reviews, meta-analyses, and editorials. |
Table 2 depicts the summary descriptive statistics for the included studies. The average sample size for each of the three main diagnostic groups was 38.52 ± 46.44, 30.50 ± 35.53, and 46.81 ± 56.38 patients for the AD, MCI, and HC groups, respectively. The average baseline age for patients within each diagnostic category was 72.78 ± 3.69 years for AD, 71.52 ± 2.88 years for MCI, and 70.55 ± 3.85 years for HC subjects.
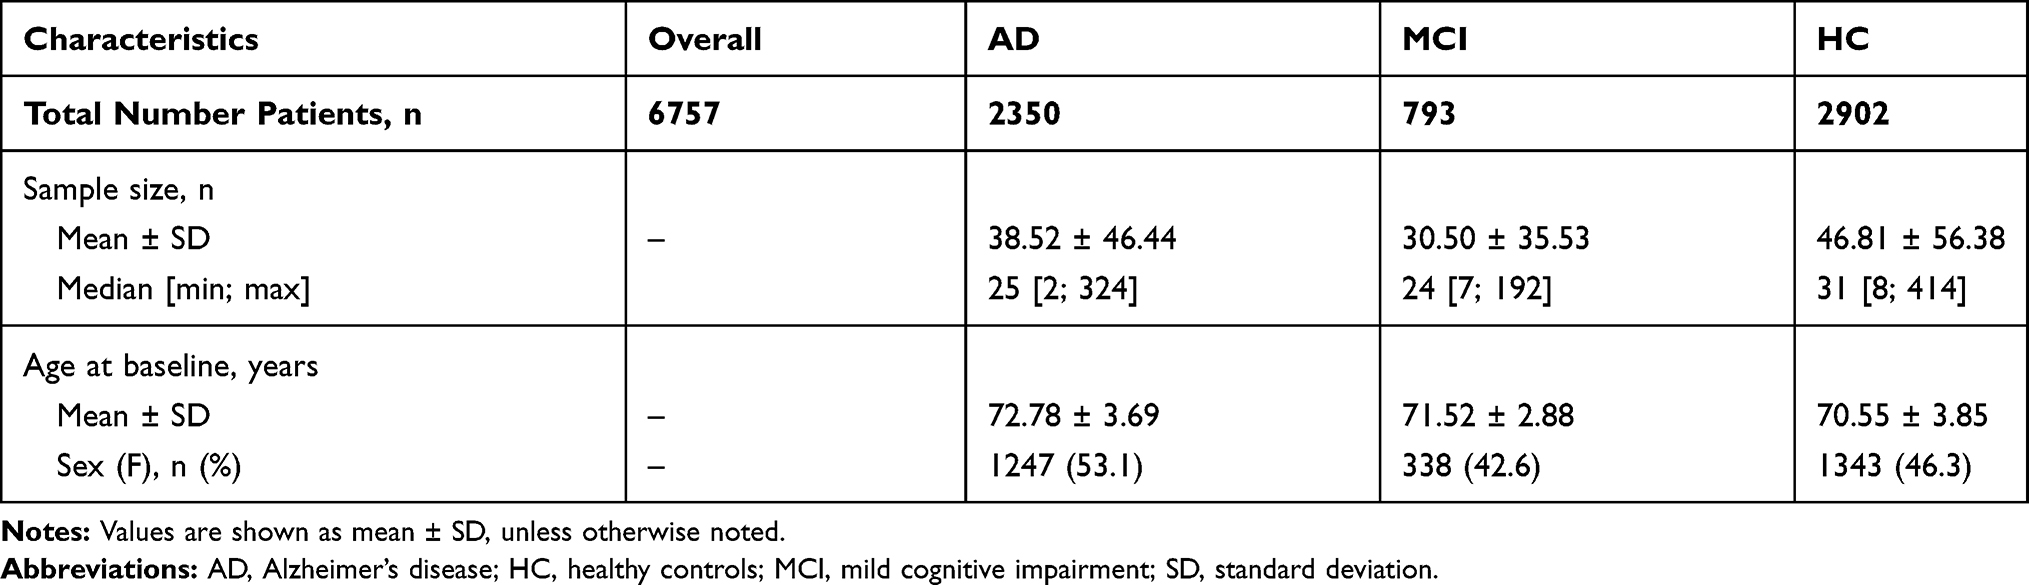 |
Table 2 Descriptive Statistics of Diagnostic Groups Presented in the Current Review |
Studies varied widely by their methods for determining AD diagnosis, with multiple studies using more than one criterion. Sixty-one (86%) studies used a form of neurocognitive testing (eg Mini-Mental State Examination (MMSE), Montreal Cognitive Assessment (MOCA), etc.),17–34,36–44,46,47,49–80 56 (79%) relied on clinical diagnosis by experts based on criteria such as the DSM-IV or NINCDS-ADRDA,18,20,21,24,26–34,36,39,41–44,46–52,54–57,62–64,66–88 29 (41%) utilized neuroimaging techniques (eg magnetic resonance imaging (MRI), computed tomography (CT) scan, or PET),18,19,21–23,25,29–31,33,34,37,39–41,44,46,48,49,51,53,56,57,60,61,66,68,75,79 and 13 (18%) used immunohistochemical staining for biomarkers tau and amyloid.21–23,25,31,32,34,35,37,39,50,51,61
Studies also differed in terms of the subject groups they included for comparison. The vast majority of studies compared patients with AD to healthy controls, while 25 studies24,26–30,37,39,41,42,44,46–48,51,52,54,56,57,65,75,76,78,81,83 included an additional subset of patients with a diagnosis of MCI or subjective cognitive decline for comparison. Four studies also included subjects with preclinical AD,32,35,40,53 defined as cognitively normal individuals who are positive for established AD biomarkers. Three studies also included patients with other forms of dementia, including Parkinson’s disease (PD), Lewy Body dementia (LBD), and unspecified non-AD dementia for comparison.44,64,75
Finally, regarding OCT/OCTA outcome parameters, studies utilizing OCT evaluated a combination of retinal layer thickness, macular volume and thickness, or choroidal volume and thickness. Meanwhile, studies utilizing OCTA primarily examined a host of vascular parameters such as retinal, macular, or choroidal vessel density or blood flow.
OCT
Optical coherence tomography (OCT) was first used to image the retina in 1991. It is frequently utilized for ophthalmic diagnosis and evaluation due to its non-invasiveness and higher spatial resolution than other imaging modalities such as PET, CT, or MRI. There are three main types of OCT including time domain (TD), spectral domain (SD), and swept source (SS) OCT. The types of OCT differ by their scanning speeds, with TD-OCT capturing the least number of scans per second (approximately 400 A-scans per second), and SS-OCT capturing the greatest number of scans per second (approximately 100,000–400,000 A-scans per second). SD-OCT averages between 20,000 and 40,000 A-scans per second with a higher resolution than the earlier TD-OCT. Enhanced depth imaging (EDI) is an additional technology that allows for better visualization of the choroid, and it is often used in conjunction with SD-OCT.89 SD-OCT is the most common type of OCT used in clinical practice due to its affordability when compared to SS-OCT and its increased spatial resolution when compared to TD-OCT.
Findings
The primary outcome parameters for OCT analyses included measurements of retinal layer thickness, macular volume and thickness, and choroidal volume and thickness as described below.
Thinning of the Retina
Of the studies that used OCT to compare patients with AD to cognitively normal HCs, the majority found a statistically significant association between the diagnosis of AD and thinning of retinal layers.20,26,28,29,33,36,38,40–42,48,49,56,57,59,60,62–64,66–70,72–74,76–79,81–86 Retinal thinning was often most pronounced in the inner layers such as the retinal nerve fiber layer (RNFL) and ganglion cell-inner plexiform layer (GC-IPL), a three-layer structure that is sometimes referred to as the ganglion cell complex (GCC). Moreover, Uchida et al specifically demonstrated that thickness of the outer retinal layers was not associated with AD or other forms of dementia.44
Furthermore, while overall mean RNFL (mRNFL) thickness tends to be reduced in AD patients, several studies have shown that this thinning is often markedly pronounced in the superior quadrants and is at times restricted to these quadrants.20,29,60–62,82 Conversely, several studies have shown no significant difference between AD patients and controls with regards to retinal thickness.21,22,27,30,39,55,58,75 Moreover, a twin study which evaluated preclinical AD patients concluded that there was no difference between RNFL thickness and beta-amyloid (Aβ) status, and suggested that variation in retinal thickness may be attributable to genetic variation between individuals.45 On the other hand, the largest prospective cohort study to date, which enrolled nearly 3300 patients, found that RNFL thinning was associated with an increased risk of dementia, particularly dementia due to AD.33
Interestingly, the retinal thinning observed in patients with AD may represent a non-specific marker of cognitive decline. In the majority of articles reviewed, patients with MCI often had significantly reduced RNFL thickness when compared to healthy controls.26,41,42,56,57,76–78 Moreover, when comparing the retinal thickness of patients with AD to those with MCI, a few studies found that patients with AD had significantly greater retinal thinning when compared to both healthy controls and MCI patients.57,77,81,83 However, Paquet et al did not detect a significant difference in retinal thickness between AD and MCI patients, particularly in patients classified as having mild AD.65 It is possible that the variation between these findings may stem from differences in sample size, with smaller samples being underpowered to detect a significant change. In particular, Paquet et al used both a smaller sample size and more comparison groups as they stratified patients with AD into two groups (mild versus moderate-severe), further decreasing the effective power of the study. Also, MCI is a more general, non-specific clinical diagnosis than AD. Not all MCI patients will develop AD, and there are amnestic and non-amnestic sub-classifications of MCI which were not analyzed by all studies, likely due to small sample sizes; in fact, only ten out of the 24 studies with MCI subjects focused specifically on amnestic MCI,28,39,44,51,52,57,65,75,76,81 while other studies did not specify the type of MCI.24,26,27,29,30,37,41,42,46–48,54,56,78,83
Retinal thinning is also a more non-specific biomarker, and has been reported in a number of other neurodegenerative diseases apart from AD.24,33,64,90–93 For example, in one study, Alzheimer’s, PD, and LBD patients were all shown to have reduced RNFL thickness when compared to healthy controls.64 Interestingly, Nunes et al recently reported a machine learning method capable of discriminating between AD and PD based on OCT images,34 representing a potential direction for future research in identifying AD-specific OCT biomarkers. Artificial intelligence in particular may offer sophisticated techniques for identifying subtle differences in retinal and microvascular architecture between AD and HC as well as other forms of dementia.
Macular Thickness and Volume
Twenty OCT studies included macular thickness and volume in their primary outcome measures.19–22,28,29,36,55,57–59,67–69,71,75,76,80,81,86 The results of these studies were slightly more nuanced than those that only measured retinal layer thickness. While thirteen of the twenty studies showed that patients with AD tend to have significantly reduced macular volume and thickness, two studies showed evidence of potential dynamic changes occurring within the macula.30,38 Salobrar-Garcia et al found that macular layers were thinner in patients with mild AD and thicker in those with moderate AD when compared to controls.38 Similarly, although Lad et al did not find differences in retinal thickness between patients with AD and controls, there were many areas of either significant thickening or thinning of the macula in patients with AD, which researchers posited may reflect dynamic changes occurring along the spectrum of neurodegeneration.30
Of note, three studies showed a significant correlation between macular thickness and performance on the MMSE.28,55,59 In all three studies, decreased macular thickness was associated with both AD diagnosis and worse performance on the MMSE. Macular thickness was also shown to be correlated with degree of cortical atrophy in a study by den Haan and collaborators.22
Choroidal Thickness
Only four studies have examined differences in choroidal thickness between patients with AD and healthy controls using primarily OCT.43,54,55,58 Three studies showed that patients with AD have reduced choroidal thickness compared to healthy controls. It has been postulated that choroidal thinning observed in AD might be due to vasculopathy triggered by local Aβ deposition.43,55,58 Similar to what has been described in the brain in AD,94,95 Aβ accumulation in the choroid may induce inflammatory responses and complement activation that progressively lead to neurodegeneration and regression of the choroidal vasculature.58 Consistent with this hypothesis, a study utilizing a transgenic rat model of AD has demonstrated Aβ accumulation in the choroid and concurrent choroidal thinning.96
In contrast, a very recently published study did not find a significant difference in subfoveal choroidal thickness (SFCT) between individuals with AD, MCI, and healthy cognition after controlling for age, sex, and visual acuity.54 Rather, total choroidal area (TCA), luminal area (LA), and choroidal vascularity index (CVI) differed between these groups, suggesting that TCA, LA, and CVI may be more appropriate parameters when compared to SFCT to differentiate individuals with AD from those with MCI and from those who are cognitively healthy.
OCTA
Recent advances allow OCT systems to acquire a retinal angiogram through a non-invasive technique known as OCT angiography (OCTA), which can provide depth-resolved volumetric information about the choroidal and retinal microcirculation. It is well established that vascular factors contribute to cerebral neurodegeneration in Alzheimer’s disease.97 Based on the similarities and continuity between cerebral and retinal vasculature, OCTA offers a potential way to detect microvascular changes in Alzheimer’s disease via retinal blood flow.
Retinal Vessel Density, Perfusion Density and Foveal Avascular Zone Size
Several studies have investigated the retinal microvasculature in patients with AD (Table 1).18,23,27,31,35,37,45–48,50,52,98 In patients with clinical AD, OCTA revealed reduced vessel density (VD) and perfusion density (PD) in both the superficial capillary plexus (SCP)18,27,31,45,47,48,52,98 and deep capillary plexus (DCP).27,46,50,52 Furthermore, patients with AD were found to have a larger foveal avascular zone (FAZ) in comparison to healthy controls.18,46,98 While these trends were also observed in patients with MCI in some studies,27,46,50,52 Yoon et al found no significant difference in VD, PD, or FAZ size between patients with MCI and healthy controls.47 Yet another study by den Haan et al detected no significant difference in retinal vascular measures— including VD and FAZ size— between amyloid-positive AD patients and amyloid-negative healthy controls.23 Similarly, Querques et al did not find any significant difference in OCTA measures among AD, MCI, and the healthy control group.37 However, they did demonstrate a reduction in arterial dilation of the retina in patients with AD and MCI using a dynamic vessel analyzer, which was inversely correlated with the level of beta-amyloid in the CSF. This finding suggests that functional changes may precede morphological changes in retinal vessels.37
Peripapillary and Optic Nerve Head Microvasculature
Peripapillary OCTA has been a growing area of research in AD in recent years. The radial peripapillary capillaries (RPCs) are a distinctive vascular network within the RNFL around the optic disc that has fewer anastomoses when compared with the SCP, which may make the vessels more susceptible to vascular dysfunction.99 This makes RPC an attractive target for the study of AD.
Nevertheless, the limited number of studies that have been performed in this area found mixed results.31,50,52,100 Lahme et al reported a reduction of peripapillary vessel density in patients with clinical AD.31 Conversely, two other studies found no significant differences in the peripapillary vascularity between patients with AD and HC subjects.50,52 Similarly, Zhang et al did not detect any statistically significant difference in peripapillary parameters between patients with amnestic MCI and HC.52 Lee et al reported more nuanced results: while patients with either MCI or subcortical vascular cognitive impairment (SVCI) had lower capillary density (CD) in RPC, the RPC CD in patients with AD was higher than those with SVCI in the superior and temporal quadrants of the RPC network.100 Part of this variation may be attributable to the lower reliability of peripapillary OCTA in certain quadrants. In particular, Robbins et al recently reported that temporal measurements were the least repeatable among peripapillary OCTA parameters.101 Further research is needed to evaluate the utility of peripapillary OCTA in AD.
Associations of OCTA Findings with Other AD Metrics
Other studies explored the correlations between OCTA findings and well-established AD metrics, providing further insight into the biological underpinning of these retinal microvascular abnormalities and their clinical significance in AD. Two studies identified an inverse correlation between retinal vessel density and the Fazekas scale, a radiographic measure of white matter lesions in the brain often used to assess patients with dementia.23,31 Yoon et al also reported that inferolateral ventricle volume was inversely corrected with SCP vessel density and perfusion density.48 Furthermore, some groups have demonstrated significant associations between retinal VD and neurocognitive testing results, including MoCA and MMSE scores.18,45 Though the association between OCTA findings and clinical AD is not fully understood, the fact that AD neuroimaging and neurocognitive tests are associated with OCTA findings supports the value of OCTA in the evaluation of AD.
OCTA Findings in Preclinical AD
Given that AD usually does not become symptomatic until advanced neurodegeneration and vascular damage have already occurred, there is an urgent need for robust biomarkers for AD early in its course when disease-modifying therapies are most likely to be effective.102 In this effort, several studies have investigated the utility of OCTA in preclinical AD, defined as cognitively unimpaired individuals who are positive for established AD biomarkers. In a cross-sectional monozygotic twin study, 124 cognitively healthy individuals underwent Aβ PET imaging and OCTA, which showed that Aβ+ individuals had significantly higher VD than Aβ- individuals in all regions; however, they did not differ in FAZ size.45 On the contrary, O’Bryhim et al demonstrated larger FAZ in subjects with Aβ biomarkers than those without.35 Despite the great interest in identifying biomarkers for early diagnosis of AD, further research is needed to determine whether OCTA will prove useful in detecting preclinical AD.
Discussion
OCT and OCTA are non-invasive ophthalmic imaging studies which may represent new tools for the diagnosis and screening of AD by examining changes within the retina. The current review summarized findings from 71 studies which aimed to detect specific changes in retinal structure and microvasculature in patients with AD. Although the results of these studies were somewhat mixed, there are certain OCT and OCTA findings that appear to be associated with AD diagnosis.
With regards to OCT findings, patients with AD often exhibit decreased retinal, macular, and choroidal thickness when compared to healthy controls.27,29,38,40,42,43,47,55–67,81–84 Given the embryological origins of the retina as an extension of the CNS, retinal atrophy may be considered akin to cortical atrophy insofar that it represents a non-specific marker of neurodegenerative disease.4 This hypothesis is further supported by a study that has found a significant association between OCT findings and the degree of cortical atrophy in patients with AD.22 It is important to note the limited specificity of retinal atrophy as a marker of cognitive decline. A number of studies have documented retinal thinning in other forms of dementia such as PD and LBD.64,90–93 Some studies have attempted to identify areas of the retina that undergo changes specific to AD. Although many of these studies suggest that the greatest thinning occurs in the superior quadrants of the inner retinal layers for patients with AD, the results are varied and prior studies lack sufficient statistical power to arrive at a consensus due to their limited sample size.20,29,60–62,82,83
Similarly, most of the studies that used OCTA in this review found reduced retinal vessel density and perfusion density in patients with AD when compared to healthy controls.37,46–48,50,52,98 Many of these patients were subsequently noted to have a larger FAZ.18,46,98 It has been previously established that there is a cerebrovascular component of neurodegeneration in AD, and current literature suggests that similar changes can be seen in retinal vasculature due to anatomical similarities.97 Furthermore, correlations between OCTA findings and other objective measures of AD diagnosis, such as neuroimaging and cognitive testing, lend additional support to use of these ophthalmic imaging studies.18,23,31,45,48
There is ample preliminary evidence in the literature to support ongoing investigation of the use of OCT and OCTA for identification of potential biomarkers for AD. As noted previously, current research suggests that patients with AD may exhibit a pattern of thinning that is most pronounced in the superior quadrants of the inner retinal layers,29,61,62,82,83 and changes may also occur in the microvasculature of AD subjects relative to healthy controls.18,27,31,46–48,50,52 However, additional research is needed to determine whether these and other structural or microvascular changes will prove useful and cost-effective in a clinical setting. The development of sensitive and specific OCT and OCTA parameters for AD screening or diagnosis will require testing in different settings that account for the prevalence of AD.
As previously mentioned, these imaging tools possess unique advantages over current methods for diagnosing AD. OCT and OCTA are non-invasive and relatively affordable when compared to other methods such as CSF analysis or neuroimaging.103 They also produce instantaneous, high-resolution images, which may markedly improve efficiency. Finally, OCT/OCTA findings have been shown to be associated with other objective tools for AD diagnosis such as cortical atrophy, immunohistochemical staining, and results of neurocognitive testing, which strengthens the case for their application as diagnostic tools.17–19,22,23,31,32,40,45,48,55,59,64,87
One potentially important avenue for the use of OCT/OCTA is in the early diagnosis and screening of preclinical AD. Current research suggests that it may be possible to detect microvascular and structural changes in the retina before patients exhibit clinical signs of AD.35,40 Several studies have demonstrated unique differences in retinal structure in patients with MCI compared to healthy controls or those with a diagnosis of AD.29,57,83 However, there is great variability among these studies, perhaps due to their sample sizes and the broad definitions of MCI for which there are multiple subtypes (eg amnestic and non-amnestic MCI). Studies including only amnestic MCI are more relevant to the study of AD,28,39,44,51,52,57,65,75,76,81 but a number of the studies did not specify which subtype of MCI was included.24,26,27,29,30,37,41,42,46–48,54,56,78,83 Further exploration of these imaging tools as screening measures for pre-clinical neurodegenerative changes is warranted, especially in larger cohorts of amnestic MCI patients.
There are several important limitations of the current review. Perhaps one of the most readily apparent is the limited sample size of most of the studies conducted to date. The average sample size for each of the diagnostic groups was small with a very wide range (Table 2), resulting in reduced statistical power that may have led to false-negative results. Furthermore, eight of 34 studies included multiple eyes per subject but did not report that proper adjustments for correlated measures were performed with either generalized estimating equations or mixed models.22,58–60,64,66,69,83 This lack of statistical adjustment for correlated measurements can lead to underestimation of the p-value and result in a type 1 statistical error. In addition, matching subjects according to demographic and clinical characteristics or controlling for these factors in multivariate analysis can limit the effect of known confounding variables and strengthen study conclusions. However, it is reassuring that the vast majority of studies included in this review either reported or attempted to account for potentially confounding factors (eg age, sex, or race) in the statistical analysis.17–68,70–88 Also, a majority of the studies were cross-sectional or retrospective, thus limiting causal inference; and only a small number were prospective.32,76,79,88 However, none of the studies to date have looked at changes in microvascular structure of AD or MCI patients over time in OCTA. Moreover, the existing prospective studies followed patients with OCT for at most 25 months.88 Longer follow-up is needed to provide more temporal information regarding the interval development of AD and to capture progression to more advanced stages of disease. Whether OCT/OCTA will be able to detect early changes predictive of the future onset of AD or of AD severity should be investigated in future longitudinal studies.
Other limitations include the multitude of confounding factors that may influence differences in OCT/OCTA findings. OCT and OCTA can be impacted by a number of artifacts, especially motion artifacts. Moreover, clinical factors such as elevated intraocular pressure, variable axial length, and refractive error have been previously shown to impact OCT measurements.104–106 Systemic comorbidities such as hypertension and diabetes mellitus may significantly impact retinal microvasculature and morphologic structure, thus influencing OCT and OCTA results.107,108 Other chronic eye diseases such as glaucoma or age-related macular degeneration may also impact the results of OCT/OCTA findings.109–111 In addition, certain OCT/OCTA findings such as FAZ size can vary by age, race, or sex,112,113 and can vary substantially between individuals thus limiting its utility. Moreover, if these factors are not controlled for in the analysis, then the relationship between FAZ and AD or MCI can be confounded.
Furthermore, studies vary widely by exclusion criteria and severity of disease (eg mild, moderate, or severe AD), leading to contradictory results. Likewise, studies that enroll a heterogeneous population in terms of patient demographic or clinical characteristics, and that do not correct for those characteristics, may be subject to the confounding biases described above. Variation in definitions of OCT/OCTA parameters may also limit comparability between studies and lead to inconsistent results. Studies utilizing more specific sub-groups (eg amnestic MCI) may therefore generate clearer results. However, current studies evaluating aMCI patients still displayed heterogeneity in results. For example, four of eight studies evaluating RNFL thickness in aMCI demonstrated RNFL thinning in aMCI patients compared to healthy controls,57,65,76,81 but the remaining four studies found no statistically significant differences.28,39,51,75 Some of the studies showing no differences were potentially underpowered28 or had significant demographic variation between groups,39 limiting the conclusions that could be drawn. Overall, it is not clear whether aMCI patients are consistently similar to AD patients in OCT/OCTA findings based on the current literature.
Similarly, it is theoretically possible that differences in OCT systems may explain some of the variability in study results. To the best of our knowledge, no study has compared different OCT systems in terms of their application to AD. However, previous studies investigating other diseases such as glaucoma suggest that SD-OCT has better resolution, faster acquisition speed, better sensitivity, and less measurement variability when compared to TD-OCT.114–116 Among different SD-OCT systems, measurements of parameters such as RNFL thickness further vary.117 Because of these differences between OCT systems, parameter values cannot be directly compared between devices. Future research is needed to determine the extent to which the results of OCT evaluations of AD differ depending on the OCT systems utilized.
Conclusions
In conclusion, findings from the current review suggest that there are statistically significant differences in the anatomical structure and microvascular blood flow of the retina in patients with neurodegeneration from AD when compared to healthy controls. Findings of increased retinal thinning and decreased perfusion and vessel density are the most well-documented findings associated with AD diagnosis. OCT/OCTA offer several notable advantages over current diagnostic methods for AD such as the fact that they are non-invasive, efficient, and relatively affordable. It is important to note, however, that these modalities are not without limitations and can be impacted by a number of factors including motion artifacts and other ophthalmic comorbidities. Although these OCT/OCTA results may be of potential use for early diagnosis and screening of AD, further larger-scale investigation is needed to identify whether OCT/OCTA can provide sensitive and specific parameters that are cost-effective in clinical or screening settings.
Future directions for research in this area include identification of AD-specific patterns of retinal structural and microvascular change that may help differentiate AD from other forms of neurodegenerative disease. While some studies suggest that patients with AD may exhibit certain patterns of retinal loss, these findings must first be reproduced with larger and more diverse samples to support these findings. Furthermore, although several theories have been proposed, the exact mechanism by which these retinal alterations occur have yet to be determined.
Abbreviations
AD, Alzheimer’s disease; MCI, Mild Cognitive Impairment; HC, Healthy Controls; OCT, Optical Coherence Tomography; OCTA, Optical Coherence Tomography with Angiography; PET, Positron emission tomography; CSF, Cerebrospinal fluid; CNS, Central nervous system; MRI, Magnetic resonance imaging; CT, Computed tomography; PD, Parkinson’s disease; LBD, Lewy body dementia; TD, Time Domain; SD, Spectral Domain; SS, Swept Source; EDI, Enhanced Depth Imaging; RNFL, Retinal nerve fiber layer; GC-IPL, Ganglion cell-inner plexiform layer; GCC, Ganglion cell complex; mRNFL, mean RNFL; Aβ, beta-amyloid; MMSE, Mini-Mental State Examination; MOCA, Montreal Cognitive Assessment; VD, Vessel density; PD, Perfusion density; SCP, Superficial capillary plexus; DCP, Deep capillary plexus; FAZ, Foveal avascular zone; RPC, Radial peripapillary capillaries; SVCI, subcortical vascular cognitive impairment; CD, Capillary density.
Disclosure
Dr. Thompson is supported by a grant from the National Eye Institute (1K23EY030897-01). The authors report no financial or other conflicts of interest with this work. The authors alone are responsible for the content and writing of the paper.
References
1. Alzheimer’s Association. 2020 Alzheimer’s disease facts and figures. Alzheimer’s Dement. 2020;16(3):391–460. doi:10.1002/alz.12068
2. Saint-Aubert L, Barbeau EJ, Péran P, et al. Cortical florbetapir-PET amyloid load in prodromal Alzheimer’s disease patients. EJNMMI Res. 2013;3(1):43. doi:10.1186/2191-219X-3-43
3. Herukka S-K, Simonsen AH, Andreasen N, et al. Recommendations for cerebrospinal fluid Alzheimer’s disease biomarkers in the diagnostic evaluation of mild cognitive impairment. Alzheimer’s Dement. 2017;13(3):285–295. doi:10.1016/j.jalz.2016.09.009
4. Erskine L, Herrera E. Connecting the retina to the brain. ASN Neuro. 2014;6(6):175909141456210. doi:10.1177/1759091414562107
5. London A, Benhar I, Schwartz M. The retina as a window to the brain—from eye research to CNS disorders. Nat Rev Neurol. 2013;9(1):44–53. doi:10.1038/nrneurol.2012.227
6. Blanks JC, Hinton DR, Sadun AA, Miller CA. Retinal ganglion cell degeneration in Alzheimer’s disease. Brain Res. 1989;501(2):364–372. doi:10.1016/0006-8993(89)90653-7
7. Blanks JC, Schmidt SY, Torigoe Y, Porrello KV, Hinton DR, Blanks RH. Retinal pathology in Alzheimer’s disease. II. Regional neuron loss and glial changes in GCL. Neurobiol Aging. 1996;17(3):385–395. doi:10.1016/0197-4580(96)00009-7
8. Frost S, Kanagasingam Y, Sohrabi H, et al. Retinal vascular biomarkers for early detection and monitoring of Alzheimer’s disease. Transl Psychiatry. 2013;3:e233. doi:10.1038/tp.2012.150
9. Goldstein LE, Muffat JA, Cherny RA, et al. Cytosolic beta-amyloid deposition and supranuclear cataracts in lenses from people with Alzheimer’s disease. Lancet. 2003;361(9365):1258–1265. doi:10.1016/S0140-6736(03)12981-9
10. Hinton DR, Sadun AA, Blanks JC, Miller CA. Optic-nerve degeneration in Alzheimer’s disease. N Engl J Med. 1986;315(8):485–487. doi:10.1056/NEJM198608213150804
11. Koronyo-Hamaoui M, Koronyo Y, Ljubimov AV, et al. Identification of amyloid plaques in retinas from Alzheimer’s patients and noninvasive in vivo optical imaging of retinal plaques in a mouse model. NeuroImage. 2011;54:S204–S217. doi:10.1016/j.neuroimage.2010.06.020
12. Csincsik L, MacGillivray TJ, Flynn E, et al. Peripheral retinal imaging biomarkers for Alzheimer’s disease: a pilot study. Ophthalmic Res. 2018;59(4):182–192. doi:10.1159/000487053
13. Sadda SR, Borrelli E, Fan W, et al. A pilot study of fluorescence lifetime imaging ophthalmoscopy in preclinical Alzheimer’s disease. Eye. 2019;33(8):1271–1279. doi:10.1038/s41433-019-0406-2
14. Kayabasi U. Retinal examination for the diagnosis of Alzheimer’s disease. Int J Ophthal Pathol. 2014;03(04). doi:10.4172/2324-8599.1000145
15. Kurna SA, Akar G, Altun A, Agirman Y, Gozke E, Sengor T. Confocal scanning laser tomography of the optic nerve head on the patients with Alzheimer’s disease compared to glaucoma and control. Int Ophthalmol. 2014;34(6):1203–1211. doi:10.1007/s10792-014-0004-z
16. Einarsdottir AB, Hardarson SH, Kristjansdottir JV, Bragason DT, Snaedal J, Stefánsson E. Retinal oximetry imaging in Alzheimer’s disease. J Alzheimers Dis. 2016;49(1):79–83. doi:10.3233/JAD-150457
17. Asanad S, Fantini M, Sultan W, et al. Retinal nerve fiber layer thickness predicts CSF amyloid/tau before cognitive decline. PLoS One. 2020;15(5):e0232785. doi:10.1371/journal.pone.0232785
18. Bulut M, Kurtuluş F, Gözkaya O, et al. Evaluation of optical coherence tomography angiographic findings in Alzheimer’s type dementia. Br J Ophthalmol. 2018;102(2):233–237. doi:10.1136/bjophthalmol-2017-310476
19. Casaletto KB, Ward ME, Baker NS, et al. Retinal thinning is uniquely associated with medial temporal lobe atrophy in neurologically normal older adults. Neurobiol Aging. 2017;51:141–147. doi:10.1016/j.neurobiolaging.2016.12.011
20. Cunha JP, Proença R, Dias-Santos A, et al. OCT in Alzheimer’s disease: thinning of the RNFL and superior hemiretina. Graefes Arch Clin Exp Ophthalmol. 2017;255(9):1827–1835. doi:10.1007/s00417-017-3715-9
21. den Haan J, Csinscik L, Parker T, et al. Retinal thickness as potential biomarker in posterior cortical atrophy and typical Alzheimer’s disease. Alz Res Ther. 2019;11(1):62. doi:10.1186/s13195-019-0516-x
22. den Haan J, Janssen SF, van de Kreeke JA, Scheltens P, Verbraak FD, Bouwman FH. Retinal thickness correlates with parietal cortical atrophy in early-onset Alzheimer’s disease and controls. Alzheimers Dement (Amst). 2018;10:49–55. doi:10.1016/j.dadm.2017.10.005
23. Haan JD, van de Kreeke JA, van Berckel BN, et al. Is retinal vasculature a biomarker in amyloid proven Alzheimer’s disease? Alzheimers Dement (Amst). 2019;11:383–391. doi:10.1016/j.dadm.2019.03.006
24. Ferrari L, Huang S-C, Magnani G, Ambrosi A, Comi G, Leocani L. Optical coherence tomography reveals retinal neuroaxonal thinning in frontotemporal dementia as in Alzheimer’s disease. JAD. 2017;56(3):1101–1107. doi:10.3233/JAD-160886
25. Hadoux X, Hui F, Lim JKH, et al. Non-invasive in vivo hyperspectral imaging of the retina for potential biomarker use in Alzheimer’s disease. Nat Commun. 2019;10(1):4227. doi:10.1038/s41467-019-12242-1
26. Jiang H, Liu Y, Wei Y, et al. Impaired retinal microcirculation in patients with Alzheimer’s disease. PLoS One. 2018;13(2):e0192154. doi:10.1371/journal.pone.0192154
27. Jiang H, Wei Y, Shi Y, et al. Altered macular microvasculature in mild cognitive impairment and Alzheimer disease. J Neuroophthalmol. 2018;38(3):292–298. doi:10.1097/WNO.0000000000000580
28. Kim J-I, Kang B-H, Kasuga K. Decreased retinal thickness in patients with Alzheimer’s disease is correlated with disease severity. PLoS One. 2019;14(11):e0224180. doi:10.1371/journal.pone.0224180
29. Kwon JY, Yang JH, Han JS, Kim DG. Analysis of the retinal nerve fiber layer thickness in alzheimer disease and mild cognitive impairment. Korean J Ophthalmol. 2017;31(6):548–556. doi:10.3341/kjo.2016.0118
30. Lad EM, Mukherjee D, Stinnett SS, et al. Evaluation of inner retinal layers as biomarkers in mild cognitive impairment to moderate Alzheimer’s disease. PLoS One. 2018;13(2):e0192646. doi:10.1371/journal.pone.0192646
31. Lahme L, Esser EL, Mihailovic N, et al. Evaluation of ocular perfusion in Alzheimer’s disease using optical coherence tomography angiography. JAD. 2018;66(4):1745–1752. doi:10.3233/JAD-180738
32. Marquié M, Valero S, Castilla-Marti M, et al. Association between retinal thickness and β-amyloid brain accumulation in individuals with subjective cognitive decline: fundació ACE healthy brain initiative. Alzheimers Res Ther. 2020;12(1):37. doi:10.1186/s13195-020-00602-9
33. Mutlu U, Colijn JM, Ikram MA, et al. Association of retinal neurodegeneration on optical coherence tomography with dementia: a population-based study. JAMA Neurol. 2018;75(10):1256. doi:10.1001/jamaneurol.2018.1563
34. Nunes A, Silva G, Duque C, et al. Retinal texture biomarkers may help to discriminate between Alzheimer’s, Parkinson’s, and healthy controls. PLoS One. 2019;14(6):e0218826. doi:10.1371/journal.pone.0218826
35. O’Bryhim BE, Apte RS, Kung N, Coble D, Van Stavern GP. Association of preclinical Alzheimer disease with optical coherence tomographic angiography findings. JAMA Ophthalmol. 2018;136(11):1242. doi:10.1001/jamaophthalmol.2018.3556
36. Polo V, Rodrigo MJ, Garcia-Martin E, et al. Visual dysfunction and its correlation with retinal changes in patients with Alzheimer’s disease. Eye (Lond). 2017;31(7):1034–1041. doi:10.1038/eye.2017.23
37. Querques G, Borrelli E, Sacconi R, et al. Functional and morphological changes of the retinal vessels in Alzheimer’s disease and mild cognitive impairment. Sci Rep. 2019;9(1):63. doi:10.1038/s41598-018-37271-6
38. Salobrar-García E, de Hoz R, Ramírez AI, et al. Changes in visual function and retinal structure in the progression of Alzheimer’s disease. PLoS One. 2019;14(8):e0220535. doi:10.1371/journal.pone.0220535
39. Sánchez D, Castilla-Marti M, Rodríguez-Gómez O, et al. Usefulness of peripapillary nerve fiber layer thickness assessed by optical coherence tomography as a biomarker for Alzheimer’s disease. Sci Rep. 2018;8(1):16345. doi:10.1038/s41598-018-34577-3
40. Santos CY, Johnson LN, Sinoff SE, Festa EK, Heindel WC, Snyder PJ. Change in retinal structural anatomy during the preclinical stage of Alzheimer’s disease. Alzheimers Dement (Amst). 2018;10:196–209. doi:10.1016/j.dadm.2018.01.003
41. Shao Y, Jiang H, Wei Y, et al. Visualization of focal thinning of the ganglion cell-inner plexiform layer in patients with mild cognitive impairment and Alzheimer’s disease. J Alzheimers Dis. 2018;64(4):1261–1273. doi:10.3233/JAD-180070
42. Szegedi S, Dal-Bianco P, Stögmann E, et al. Anatomical and functional changes in the retina in patients with Alzheimer’s disease and mild cognitive impairment. Acta Ophthalmol. 2020;98. doi:10.1111/aos.14419
43. Trebbastoni A, Marcelli M, Mallone F, et al. Attenuation of choroidal thickness in patients with Alzheimer disease: evidence from an italian prospective study. Alzheimer Dis Assoc Disord. 2017;31(2):128–134. doi:10.1097/WAD.0000000000000176
44. Uchida A, Pillai JA, Bermel R, et al. Outer retinal assessment using spectral-domain optical coherence tomography in patients with Alzheimer’s and Parkinson’s disease. Invest Ophthalmol Vis Sci. 2018;59(7):2768–2777. doi:10.1167/iovs.17-23240
45. van de Kreeke JA, Nguyen H-T, Konijnenberg E, et al. Optical coherence tomography angiography in preclinical Alzheimer’s disease. Br J Ophthalmol. 2020;104(2):157–161. doi:10.1136/bjophthalmol-2019-314127
46. Wu J, Zhang X, Azhati G, Li T, Xu G, Liu F. Retinal microvascular attenuation in mental cognitive impairment and Alzheimer’s disease by optical coherence tomography angiography. Acta Ophthalmol. 2020;98. doi:10.1111/aos.14381.
47. Yoon SP, Grewal DS, Thompson AC, et al. Retinal microvascular and neurodegenerative changes in Alzheimer’s disease and mild cognitive impairment compared with control participants. Ophthalmol Retina. 2019;3(6):489–499. doi:10.1016/j.oret.2019.02.002
48. Yoon SP, Thompson AC, Polascik BW, et al. Correlation of OCTA and volumetric MRI in mild cognitive impairment and Alzheimer’s disease. Ophthalmic Surg Lasers Imaging Retina. 2019;50(11):709–718. doi:10.3928/23258160-20191031-06
49. Zabel P, Kałużny JJ, Wiłkość-Dębczyńska M, et al. Peripapillary retinal nerve fiber layer thickness in patients with Alzheimer’s disease: a comparison of eyes of patients with Alzheimer’s disease, primary open-angle glaucoma, and preperimetric glaucoma and healthy controls. Med Sci Monit. 2019;25:1001–1008. doi:10.12659/MSM.914889
50. Zabel P, Kaluzny JJ, Wilkosc-Debczynska M, et al. Comparison of retinal microvasculature in patients with Alzheimer’s disease and primary open-angle glaucoma by optical coherence tomography angiography. Invest Ophthalmol Vis Sci. 2019;60(10):3447. doi:10.1167/iovs.19-27028
51. Zhang YS, Onishi AC, Zhou N, et al. Characterization of inner retinal hyperreflective alterations in early cognitive impairment on adaptive optics scanning laser ophthalmoscopy. Invest Ophthalmol Vis Sci. 2019;60(10):3527. doi:10.1167/iovs.19-27135
52. Zhang YS, Zhou N, Knoll BM, et al. Parafoveal vessel loss and correlation between peripapillary vessel density and cognitive performance in amnestic mild cognitive impairment and early Alzheimer’s disease on optical coherence tomography angiography. PLoS One. 2019;14(4):e0214685. doi:10.1371/journal.pone.0214685
53. Kreeke JA, Nguyen H, Haan J, et al. Retinal layer thickness in preclinical Alzheimer’s disease. Acta Ophthalmol. 2019;97(8):798–804. doi:10.1111/aos.14121
54. Robbins CB, Grewal DS, Thompson AC, et al. Choroidal structural analysis in Alzheimer’s disease, mild cognitive impairment, and cognitively healthy controls. Am J Ophthalmol. 2020. doi:10.1016/j.ajo.2020.09.049
55. Bayhan HA, Aslan Bayhan S, Celikbilek A, Tanık N, Gürdal C. Evaluation of the chorioretinal thickness changes in Alzheimer’s disease using spectral-domain optical coherence tomography. Clin Experiment Ophthalmol. 2015;43(2):145–151. doi:10.1111/ceo.12386
56. Cheung CY, Ong YT, Hilal S, et al. Retinal ganglion cell analysis using high-definition optical coherence tomography in patients with mild cognitive impairment and Alzheimer’s disease. J Alzheimers Dis. 2015;45(1):45–56. doi:10.3233/JAD-141659
57. Gao L, Liu Y, Li X, Bai Q, Liu P. Abnormal retinal nerve fiber layer thickness and macula lutea in patients with mild cognitive impairment and Alzheimer’s disease. Arch Gerontol Geriatr. 2015;60(1):162–167. doi:10.1016/j.archger.2014.10.011
58. Gharbiya M, Trebbastoni A, Parisi F, et al. Choroidal thinning as a new finding in Alzheimer’s disease: evidence from enhanced depth imaging spectral domain optical coherence tomography. J Alzheimers Dis. 2014;40(4):907–917. doi:10.3233/JAD-132039
59. Iseri PK, Altinaş O, Tokay T, Yüksel N. Relationship between cognitive impairment and retinal morphological and visual functional abnormalities in Alzheimer disease. J Neuroophthalmol. 2006;26(1):18–24. doi:10.1097/01.wno.0000204645.56873.26
60. Kirbas S, Turkyilmaz K, Anlar O, Tufekci A, Durmus M. Retinal nerve fiber layer thickness in patients with Alzheimer disease. J Neuroophthalmol. 2013;33(1):58–61. doi:10.1097/WNO.0b013e318267fd5f
61. Kromer R, Serbecic N, Hausner L, Froelich L, Aboul-Enein F, Beutelspacher SC. Detection of retinal nerve fiber layer defects in Alzheimer’s disease using SD-OCT. Front Psychiatry. 2014;5:22. doi:10.3389/fpsyt.2014.00022
62. La Morgia C, Ross-Cisneros FN, Koronyo Y, et al. Melanopsin retinal ganglion cell loss in Alzheimer disease: mRGC loss in AD. Ann Neurol. 2016;79(1):90–109. doi:10.1002/ana.24548
63. Marziani E, Pomati S, Ramolfo P, et al. Evaluation of retinal nerve fiber layer and ganglion cell layer thickness in Alzheimer’s disease using spectral-domain optical coherence tomography. Invest Ophthalmol Vis Sci. 2013;54(9):5953–5958. doi:10.1167/iovs.13-12046
64. Moreno-Ramos T, Benito-León J, Villarejo A, Bermejo-Pareja F. Retinal nerve fiber layer thinning in dementia associated with Parkinson’s disease, dementia with Lewy bodies, and Alzheimer’s disease. J Alzheimers Dis. 2013;34(3):659–664. doi:10.3233/JAD-121975
65. Paquet C, Boissonnot M, Roger F, Dighiero P, Gil R, Hugon J. Abnormal retinal thickness in patients with mild cognitive impairment and Alzheimer’s disease. Neurosci Lett. 2007;420(2):97–99. doi:10.1016/j.neulet.2007.02.090
66. Parisi V, Restuccia R, Fattapposta F, Mina C, Bucci MG, Pierelli F. Morphological and functional retinal impairment in Alzheimer’s disease patients. Clin Neurophysiol. 2001;112(10):1860–1867. doi:10.1016/s1388-2457(01)00620-4
67. Polo V, Garcia-Martin E, Bambo MP, et al. Reliability and validity of Cirrus and Spectralis optical coherence tomography for detecting retinal atrophy in Alzheimer’s disease. Eye (Lond). 2014;28(6):680–690. doi:10.1038/eye.2014.51
68. Cunha LP, Lopes LC, Costa-Cunha LVF, et al. Macular thickness measurements with frequency domain-OCT for quantification of retinal neural loss and its correlation with cognitive impairment in Alzheimer’s disease. PLoS One. 2016;11(4):e0153830. doi:10.1371/journal.pone.0153830
69. Eraslan M, Çerman E, Çekiç O, et al. Neurodegeneration in ocular and central nervous systems: optical coherence tomography study in normal-tension glaucoma and Alzheimer disease. Turk J Med Sci. 2015;45(5):1106–1114. doi:10.3906/sag-1406-145
70. Garcia-Martin E, Bambo MP, Marques ML, et al. Ganglion cell layer measurements correlate with disease severity in patients with Alzheimer’s disease. Acta Ophthalmol. 2016;94(6):e454–459. doi:10.1111/aos.12977
71. Garcia-Martin ES, Rojas B, Ramirez AI, et al. Macular thickness as a potential biomarker of mild Alzheimer’s disease. Ophthalmology. 2014;121(5):1149–1151.e3. doi:10.1016/j.ophtha.2013.12.023
72. Larrosa JM, Garcia-Martin E, Bambo MP, et al. Potential new diagnostic tool for alzheimer’s disease using a linear discriminant function for fourier domain optical coherence tomography. Invest Ophthalmol Vis Sci. 2014;55(5):3043. doi:10.1167/iovs.13-13629
73. Bambo MP, Garcia-Martin E, Gutierrez-Ruiz F, et al. Analysis of optic disk color changes in Alzheimer’s disease: a potential new biomarker. Clin Neurol Neurosurg. 2015;132:68–73. doi:10.1016/j.clineuro.2015.02.016
74. Güneş A, Demirci S, Tök L, Tök Ö, Demirci S. Evaluation of retinal nerve fiber layer thickness in Alzheimer disease using spectral-domain optical coherence tomography. Turk J Med Sci. 2015;45(5):1094–1097. doi:10.3906/sag-1405-114
75. Pillai JA, Bermel R, Bonner-Jackson A, et al. Retinal nerve fiber layer thinning in Alzheimer’s disease: a case–control study in comparison to normal aging, Parkinson’s disease, and non-Alzheimer’s dementia. Am J Alzheimers Dis Other Demen. 2016;31(5):430–436. doi:10.1177/1533317515628053
76. Choi SH, Park SJ, Kim NR, Arendt T. Macular ganglion cell -inner plexiform layer thickness is associated with clinical progression in mild cognitive impairment and Alzheimers disease. PLoS One. 2016;11(9):e0162202. doi:10.1371/journal.pone.0162202
77. Liu D, Zhang L, Li Z, et al. Thinner changes of the retinal nerve fiber layer in patients with mild cognitive impairment and Alzheimer’s disease. BMC Neurol. 2015;15:14. doi:10.1186/s12883-015-0268-6
78. Oktem EO, Derle E, Kibaroglu S, Oktem C, Akkoyun I, Can U. The relationship between the degree of cognitive impairment and retinal nerve fiber layer thickness. Neurol Sci. 2015;36(7):1141–1146. doi:10.1007/s10072-014-2055-3
79. Trebbastoni A, D’Antonio F, Bruscolini A, et al. Retinal nerve fibre layer thickness changes in Alzheimer’s disease: results from a 12-month prospective case series. Neurosci Lett. 2016;629:165–170. doi:10.1016/j.neulet.2016.07.006
80. Salobrar-Garcia E, Hoyas I, Leal M, et al. Analysis of retinal peripapillary segmentation in early Alzheimer’s disease patients. Biomed Res Int. 2015;2015:636548. doi:10.1155/2015/636548
81. Ascaso FJ, Cruz N, Modrego PJ, et al. Retinal alterations in mild cognitive impairment and Alzheimer’s disease: an optical coherence tomography study. J Neurol. 2014;261(8):1522–1530. doi:10.1007/s00415-014-7374-z
82. Berisha F, Feke GT, Trempe CL, McMeel JW, Schepens CL. Retinal abnormalities in early Alzheimer’s disease. Invest Ophthalmol Vis Sci. 2007;48(5):2285–2289. doi:10.1167/iovs.06-1029
83. Kesler A, Vakhapova V, Korczyn AD, Naftaliev E, Neudorfer M. Retinal thickness in patients with mild cognitive impairment and Alzheimer’s disease. Clin Neurol Neurosurg. 2011;113(7):523–526. doi:10.1016/j.clineuro.2011.02.014
84. Lu Y, Li Z, Zhang X, et al. Retinal nerve fiber layer structure abnormalities in early Alzheimer’s disease: evidence in optical coherence tomography. Neurosci Lett. 2010;480(1):69–72. doi:10.1016/j.neulet.2010.06.006
85. Bambo MP, Garcia-Martin E, Pinilla J, et al. Detection of retinal nerve fiber layer degeneration in patients with Alzheimer’s disease using optical coherence tomography: searching new biomarkers. Acta Ophthalmol. 2014;92(7):e581–582. doi:10.1111/aos.12374
86. Moschos MM, Markopoulos I, Chatziralli I, et al. Structural and functional impairment of the retina and optic nerve in Alzheimer’s disease. Curr Alzheimer Res. 2012;9(7):782–788. doi:10.2174/156720512802455340
87. Lee EJ, Kim T-W, Lee DS, et al. Increased CSF tau level is correlated with decreased lamina cribrosa thickness. Alzheimers Res Ther. 2016;8:6. doi:10.1186/s13195-015-0169-3
88. Shi Z, Wu Y, Wang M, et al. Greater attenuation of retinal nerve fiber layer thickness in Alzheimer’s disease patients. J Alzheimers Dis. 2014;40(2):277–283. doi:10.3233/JAD-131898
89. Spirn 2015. EyeWiki: optical coherence tomography; 2020. Available from: https://eyewiki.aao.org/Optical_Coherence_Tomography.
90. Inzelberg R, Ramirez JA, Nisipeanu P, Ophir A. Retinal nerve fiber layer thinning in Parkinson disease. Vision Res. 2004;44(24):2793–2797. doi:10.1016/j.visres.2004.06.009
91. Bodis-Wollner I. Retinopathy in Parkinson disease. J Neural Transm (Vienna). 2009;116(11):1493–1501. doi:10.1007/s00702-009-0292-z
92. Yu J-G, Feng Y-F, Xiang Y, et al. Retinal nerve fiber layer thickness changes in Parkinson disease: a meta-analysis. PLoS One. 2014;9(1):e85718. doi:10.1371/journal.pone.0085718
93. Chrysou A, Jansonius NM, van Laar T. Retinal layers in Parkinson’s disease: a meta-analysis of spectral-domain optical coherence tomography studies. Parkinsonism Relat Disord. 2019;64:40–49. doi:10.1016/j.parkreldis.2019.04.023
94. Marchesi VT. Alzheimer’s dementia begins as a disease of small blood vessels, damaged by oxidative-induced inflammation and dysregulated amyloid metabolism: implications for early detection and therapy. FASEB J. 2011;25(1):5–13. doi:10.1096/fj.11-0102ufm
95. Miao J, Vitek MP, Xu F, Previti ML, Davis J, Van Nostrand WE. Reducing cerebral microvascular amyloid-beta protein deposition diminishes regional neuroinflammation in vasculotropic mutant amyloid precursor protein transgenic mice. J Neurosci. 2005;25(27):6271–6277. doi:10.1523/JNEUROSCI.1306-05.2005
96. Tsai Y, Lu B, Ljubimov AV, et al. Ocular changes in TgF344-AD rat model of Alzheimer’s disease. Invest Ophthalmol Vis Sci. 2014;55(1):523–534. doi:10.1167/iovs.13-12888
97. de la Torre JC. Alzheimer disease as a vascular disorder: nosological evidence. Stroke. 2002;33(4):1152–1162. doi:10.1161/01.str.0000014421.15948.67
98. Grewal DS, Polascik BW, Hoffmeyer GC, Fekrat S. Assessment of differences in retinal microvasculature using OCT angiography in Alzheimer’s disease: a twin discordance report. Ophthalmic Surg Lasers Imaging Retina. 2018;49(6):440–444. doi:10.3928/23258160-20180601-09
99. Henkind P. Radial peripapillary capillaries of the retina. I. Anatomy: human and comparative. Br J Ophthalmol. 1967;51(2):115–123. doi:10.1136/bjo.51.2.115
100. Lee J-Y, Kim JP, Jang H, et al. Optical coherence tomography angiography as a potential screening tool for cerebral small vessel diseases. Alz Res Ther. 2020;12(1):73. doi:10.1186/s13195-020-00638-x
101. Robbins C, Grewal D, Thompson A, Yoon S, Plassman B, Fekrat S. Repeatability of peripapillary optical coherence tomography angiography parameters in older adults. J Vitreoretin Dis. 2020.
102. Shaw LM, Korecka M, Clark CM, Lee VM-Y, Trojanowski JQ. Biomarkers of neurodegeneration for diagnosis and monitoring therapeutics. Nat Rev Drug Discov. 2007;6(4):295–303. doi:10.1038/nrd2176
103. Ibne Mokbul M. Optical coherence tomography: basic concepts and applications in neuroscience research. J Med Eng. 2017;2017:3409327. doi:10.1155/2017/3409327
104. Lee R, Tham Y-C, Cheung CY, et al. Factors affecting signal strength in spectral-domain optical coherence tomography. Acta Ophthalmol. 2018;96(1):e54–e58. doi:10.1111/aos.13443
105. Higashide T, Ohkubo S, Hangai M, et al. Influence of clinical factors and magnification correction on normal thickness profiles of macular retinal layers using optical coherence tomography. PLoS One. 2016;11(1):e0147782. doi:10.1371/journal.pone.0147782
106. Hardin JS, Taibbi G, Nelson SC, Chao D, Vizzeri G. Factors affecting Cirrus-HD OCT optic disc scan quality: a review with case examples. J Ophthalmol. 2015;2015:746150. doi:10.1155/2015/746150
107. Spaide RF, Fujimoto JG, Waheed NK. Optical coherence tomography angiography. Retina (Philadelphia, Pa). 2015;35(11):2161–2162. doi:10.1097/IAE.0000000000000881
108. Lee TH, Lim HB, Nam KY, Kim K, Kim JY. Factors affecting repeatability of assessment of the retinal microvasculature using optical coherence tomography angiography in healthy subjects. Sci Rep. 2019;9(1):16291. doi:10.1038/s41598-019-52782-6
109. Michelessi M, Lucenteforte E, Oddone F, et al. Optic nerve head and fibre layer imaging for diagnosing glaucoma. Cochrane Database Syst Rev. 2015;(11):CD008803. doi:10.1002/14651858.CD008803.pub2
110. Miguel AIM, Silva AB, Azevedo LF. Diagnostic performance of optical coherence tomography angiography in glaucoma: a systematic review and meta-analysis. Br J Ophthalmol. 2019;103(11):1677–1684. doi:10.1136/bjophthalmol-2018-313461
111. de Carlo TE, Bonini Filho MA, Chin AT, et al. Spectral-domain optical coherence tomography angiography of choroidal neovascularization. Ophthalmology. 2015;122(6):1228–1238. doi:10.1016/j.ophtha.2015.01.029
112. Gómez-Ulla F, Cutrin P, Santos P, et al. Age and gender influence on foveal avascular zone in healthy eyes. Exp Eye Res. 2019;189:107856. doi:10.1016/j.exer.2019.107856
113. Chun LY, Silas MR, Dimitroyannis RC, Ho K, Skondra D, Vavvas DG. Differences in macular capillary parameters between healthy black and white subjects with Optical Coherence Tomography Angiography (OCTA). PLoS One. 2019;14(10):e0223142. doi:10.1371/journal.pone.0223142
114. Pinilla I, Garcia-Martin E, Idoipe M, Sancho E, Fuertes I. Comparison of retinal nerve fiber layer thickness measurements in healthy subjects using fourier and time domain optical coherence tomography. J Ophthalmol. 2012;2012:107053. doi:10.1155/2012/107053
115. Park SB, Sung KR, Kang SY, Kim KR, Kook MS. Comparison of glaucoma diagnostic capabilities of Cirrus HD and Stratus optical coherence tomography. Arch Ophthalmol. 2009;127(12):1603–1609. doi:10.1001/archophthalmol.2009.296
116. Moreno-Montañés J, Olmo N, Alvarez A, García N, Zarranz-Ventura J. Cirrus high-definition optical coherence tomography compared with stratus optical coherence tomography in glaucoma diagnosis. Invest Ophthalmol Vis Sci. 2010;51(1):335. doi:10.1167/iovs.08-2988
117. Seibold LK, Mandava N, Kahook MY. Comparison of retinal nerve fiber layer thickness in normal eyes using time-domain and spectral-domain optical coherence tomography. Am J Ophthalmol. 2010;150(6):807–814. doi:10.1016/j.ajo.2010.06.024
 © 2021 The Author(s). This work is published and licensed by Dove Medical Press Limited. The full terms of this license are available at https://www.dovepress.com/terms.php and incorporate the Creative Commons Attribution - Non Commercial (unported, v3.0) License.
By accessing the work you hereby accept the Terms. Non-commercial uses of the work are permitted without any further permission from Dove Medical Press Limited, provided the work is properly attributed. For permission for commercial use of this work, please see paragraphs 4.2 and 5 of our Terms.
© 2021 The Author(s). This work is published and licensed by Dove Medical Press Limited. The full terms of this license are available at https://www.dovepress.com/terms.php and incorporate the Creative Commons Attribution - Non Commercial (unported, v3.0) License.
By accessing the work you hereby accept the Terms. Non-commercial uses of the work are permitted without any further permission from Dove Medical Press Limited, provided the work is properly attributed. For permission for commercial use of this work, please see paragraphs 4.2 and 5 of our Terms.