")
Back to Journals » Drug, Healthcare and Patient Safety » Volume 11
Opioids and frequency counts in the US Food and Drug Administration Adverse Event Reporting System (FAERS) database: a quantitative view of the epidemic
Authors Veronin MA, Schumaker RP, Dixit RR, Elath H
Received 11 May 2019
Accepted for publication 18 July 2019
Published 19 August 2019 Volume 2019:11 Pages 65—70
DOI https://doi.org/10.2147/DHPS.S214771
Checked for plagiarism Yes
Review by Single anonymous peer review
Peer reviewer comments 2
Editor who approved publication: Dr Hemalkumar B Mehta
Michael A Veronin,1 Robert P Schumaker,2 Rohit R Dixit,2 Harshini Elath2
1Social and Administrative Sciences, Department of Pharmaceutical Sciences, University of Texas at Tyler, Ben and Maytee Fisch College of Pharmacy, Tyler, TX 75799, USA; 2Department of Computer Science, College of Business and Technology, University of Texas at Tyler, Tyler, TX 75799, USA
Correspondence: Michael A Veronin
Social and Administrative Sciences, Department of Pharmaceutical Sciences, University of Texas at Tyler, Ben and Maytee Fisch College of Pharmacy, 3900 University Blvd., Tyler, Texas 75799, USA
Tel +1 903 566 6148
Fax +1 903 565 5598
Email [email protected]
Background: The U.S. Food and Drug Administration Adverse Event Reporting System (FAERS), contains information on adverse drug events and medication error reports submitted to the FDA through the MedWatch program. A significant number of adverse events reported in the FAERS database have been for opioid use. The objective of this study was to determine the frequency counts and associated deaths of opioid drug names in the FAERS database.
Methods: Drug data were obtained from the DRUG and OUTCOME files in the database. Drugs identified included: morphine, fentanyl, oxycodone, hydrocodone, tramadol, hydromorphone, methadone, codeine, oxymorphone, meperidine, propoxyphene, diphenoxylate, and heroin. Frequency counts and concomitant deaths of opioid drug names were determined via the MySQL database management system.
Results: Fifteen different opioid drugs identified in the FAERS database were associated with ADEs, including death, and 3 drugs (oxycodone, hydrocodone, fentanyl) accounted for more than half of the reports. The highest frequency count value was 158,181 for oxycodone, which represents approximately 20.2% of the frequency counts for the opioids. The lowest frequency count value was 2,161 for dextromethorphan, which represents approximately 0.3% of the total. The opioid with the highest proportion of deaths to drug count was heroin (71.8%), followed by dextromethorphan (55.6%), methadone (37.2%), morphine (26.8%), and propoxyphene (23.7%).
Conclusion: The FAERS database represents an important source for detection and reporting of adverse drug events (ADEs), in particular the opioids and related drugs. It remains a challenge to estimate the true incidence of ADEs for this class of drugs in the general population.
Keywords: adverse drug event, Food and Drug Administration, opioid, frequency count, FAERS database
Introduction
Opioids are one of the most widely prescribed classes of drugs in the U.S.,1 and information on the characteristics of their use is important to our understanding of the impact on the health and well-being of our society.
The US Food and Drug Administration Adverse Event Reporting System (FAERS) is one of the largest government databases in the country and is comprised of adverse drug event (ADE) and medication error reports that have been submitted to the FDA through the “MedWatch” reporting program.2,3 Though commonly recognized for this purpose, the FAERS database also can indirectly provide valuable information on prescribing practices and patient outcomes based on real-life clinical encounters.
Specifically, FAERS is a computer-based relational database made-up of seven file “packages” arranged in tabular format.4 The files contain information on items such as patient demographics, adverse drug reactions, source of ADE reports, drug therapy start and end dates, and indications of use (diagnoses) for the reported drugs. Two preeminent files, the DRUG file, consists of the names of the reported medications suspect for adverse drug events (ADEs), and the OUTCOME file, contains information on the type of outcome from the drug, such as life-threatening, hospitalization, or death.
A frequency count is a measure of the number of times that an event occurs.5 Frequency counts can be organized in tables, which are useful for describing the number of occurrences of a particular type of datum within a dataset. Frequency tables can help to identify obvious trends within a data set and can be used to compare data between data sets of the same type.6
The objective of this study was to determine the frequency counts of selected opioid drugs in the FAERS database, with associated deaths. The focus of this report is on specific files within the FAERS database identifying the types of opioids and the magnitude of their presence. This can provide insight into the usage patterns of opioids in healthcare systems.
Methods
As described in a related report, the DRUG data files in the FAERS database were downloaded, cleaned, and standardized using a combination of data cleaning tools and manual correction techniques.7 The quarterly reports from 2004 to 2016, yielded 31,921,755 records from which the frequency counts were determined.
Frequency counts
Opioid drug names were identified from the National Institute of Drug Abuse Website.8 The opioid drugs selected were as follows: heroin, morphine, fentanyl, oxycodone, hydrocodone, tramadol, hydromorphone, methadone, codeine, oxymorphone, meperidine, propoxyphene, diphenoxylate, dextromethorphan and buprenorphine. The drugs were included in this investigation because of reports of high abuse potential in the medical literature.8–10
Data on drug names and associated deaths were retrieved from the MySQL database with standard query and function commands.11
Frequency counts of opioid drug names from the DRUG file were obtained using the MySQL “Select” statement and “COUNT(*)” function. With these statements and functions, a number of non-NULL values for each opioid drug name expression was obtained. Subsequently, it was determined how often each drug name value occurred relative to the entire data set.
In a similar manner, frequency counts of number of deaths from the OUTCOME file, were created.
To help manage the collection of files and records, Microsoft Excel® was incorporated to organize information. From MySQL, tables were created in Excel®, and the frequency count values were manually entered into rows and columns, whereby data analysis was conducted. The process is summarized in Figure 1.
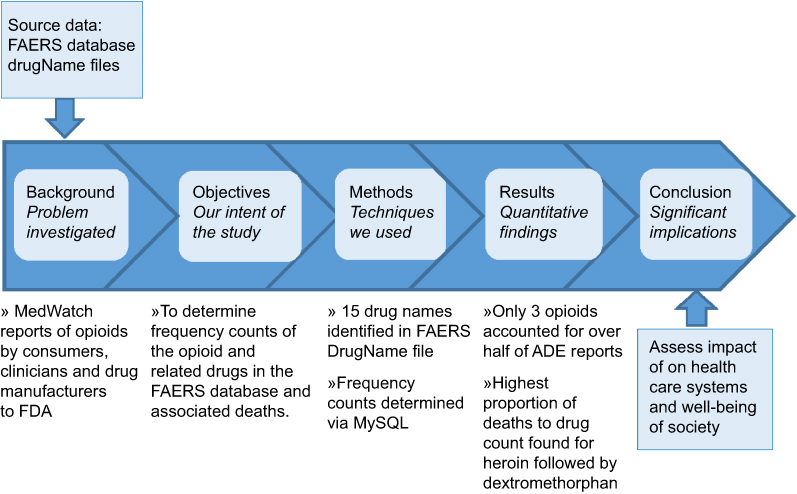 |
Figure 1 Summary of the process: frequency counts of opioids in the US Food and Drug Administration Adverse Event Reporting System (FAERS) database. |
Results
For the specified time period, the drug name count for the opioid drug names was 784,517, which represents approximately 2.46% of the drug names in the FAERS database.
The highest frequency count value was 158,181 for oxycodone, which represents approximately 20.2% of the frequency counts for the opioids. The lowest frequency count value was 2,161 for dextromethorphan, which represents approximately 0.3% of the total.
The top 3 opioids include oxycodone, hydrocodone, and fentanyl which make up approximately 51.7% of the total frequency counts.
In addition to the highest frequency count, oxycodone was also the opioid with the highest number of associated deaths. This was followed by hydrocodone, morphine, fentanyl, and tramadol. The top 3 opioids with associated deaths made up approximately 51.8% of the deaths associated with the opioids.
The opioid with the greatest proportion of deaths to drug count was heroin (71.8%), followed by dextromethorphan (55.6%), methadone (37.2%), morphine (26.8%), and propoxyphene (23.7%). The numerical results in total are presented in Table 1, and illustrated in Figure 2.
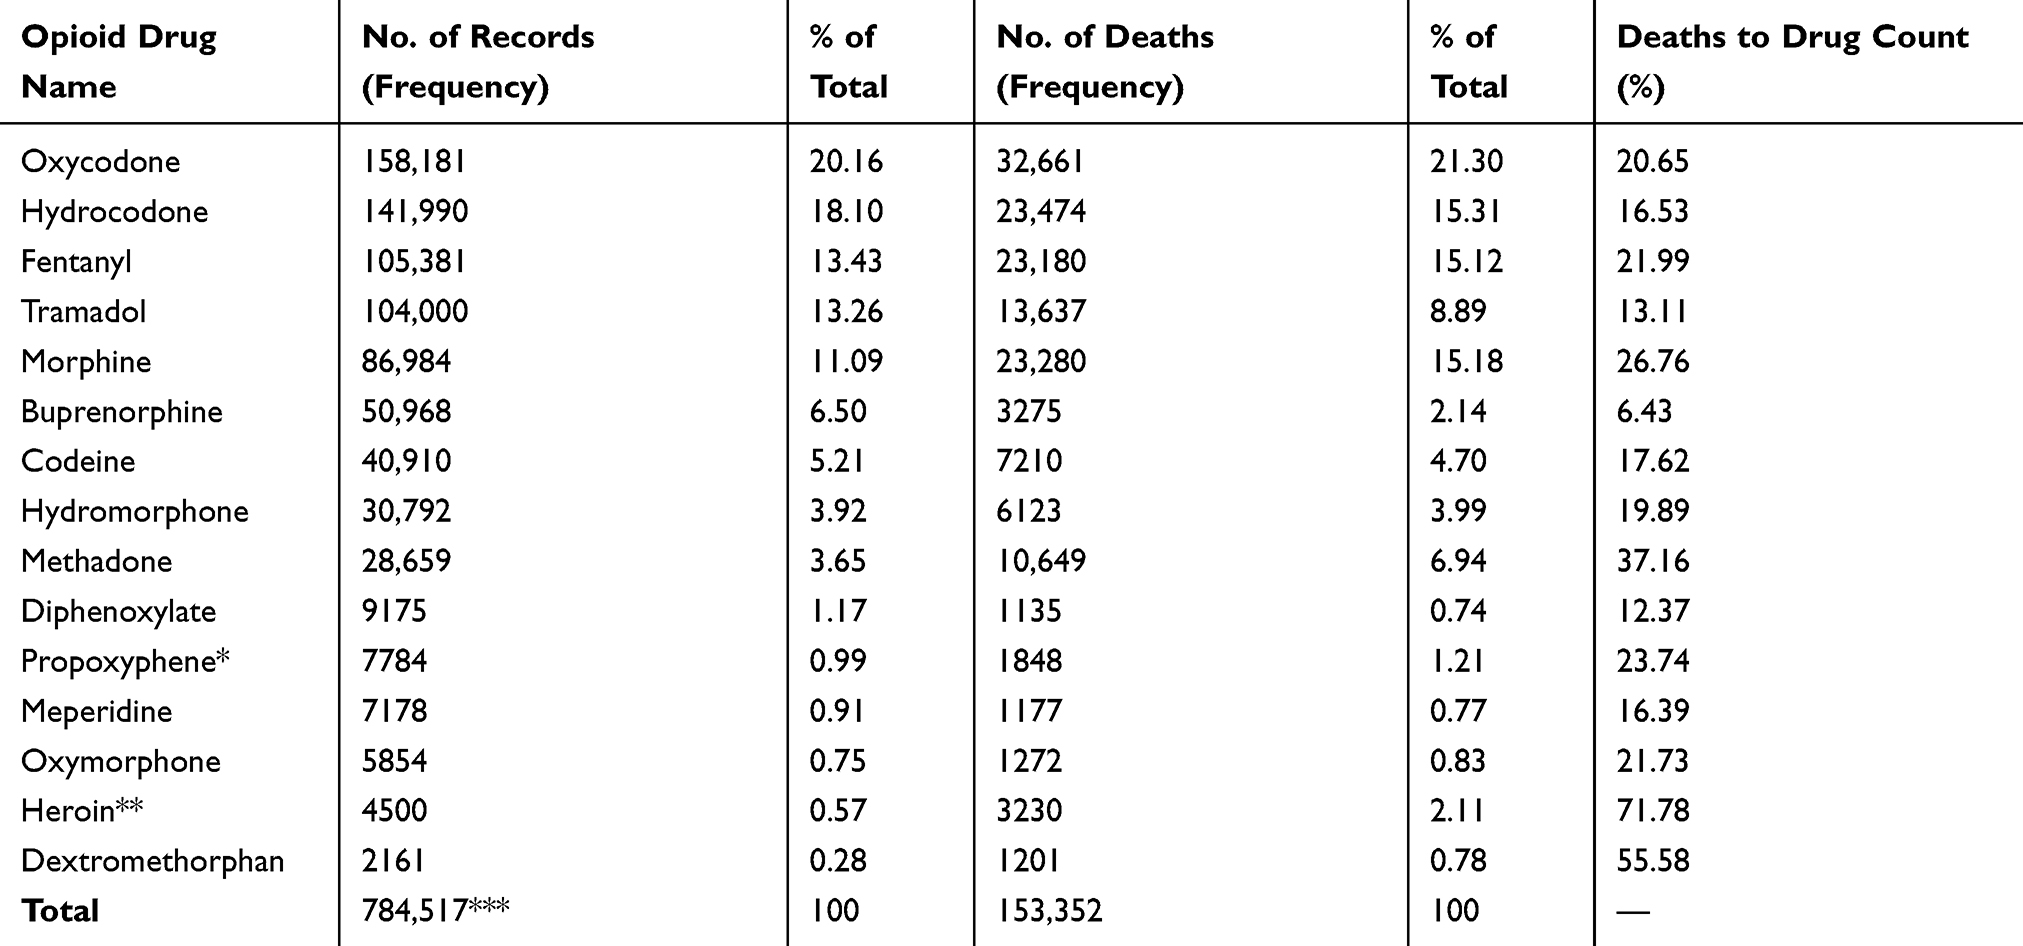 |
Table 1 Frequency counts of opioids and associated deaths in the FAERS database |
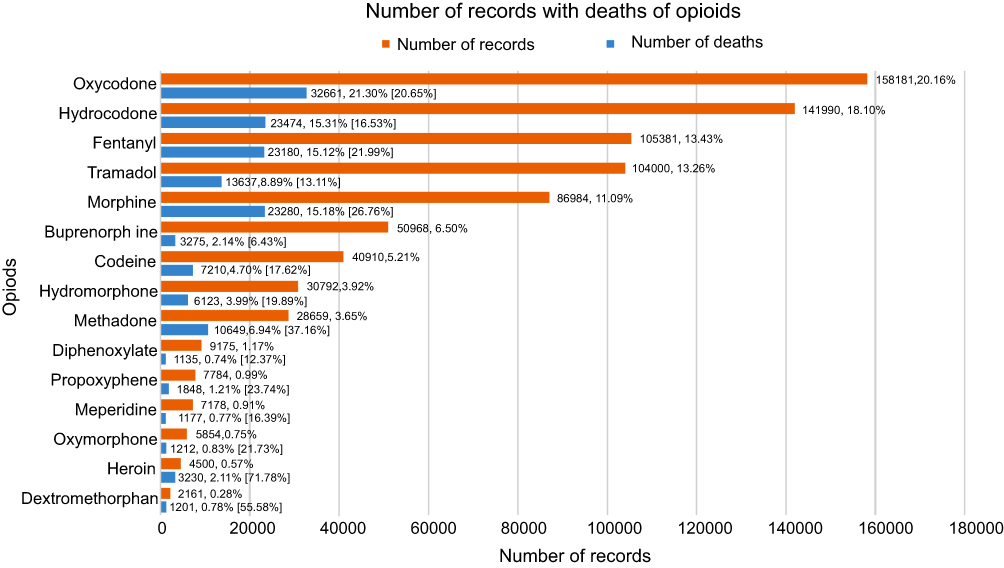 |
Figure 2 Frequency counts of opioids, associated deaths, and percentage of deaths to drug name records [%] in the FAERS database. |
Discussion
An adverse drug event is “an injury resulting from the use of a drug”12 which presents the single greatest risk of harm to patients in hospitals.13
Millions of records of adverse drug events have been created in the FAERS database from reports by healthcare professionals, consumers, and drug manufacturers through the “MedWatch” reporting program.3
In this report, the frequency of adverse events – including deaths – is identified for selected opioids in the US Food and Drug Administration’s largest registry of adverse drug events. This information appears to run parallel to news media and other reports on the prevalence of opioid usage in what has come to be known as the “opioid epidemic” or “opioid crisis.”
In determining frequency counts of the opioid drugs, the most straight-forward approach to working with quantitative data was employed.14 Drug items were classified by name within the opioid group and an arithmetical count was made of the identified drug name. The opioid and opioid-related drugs with the highest to lowest frequency counts of adverse events in the database were identified and with this method, quantities were determined not only individually, but also relative to each other.
The results indicate that the 15 different opioid drugs identified in the FAERS database were associated with ADEs, and 3 drugs (oxycodone, hydrocodone, fentanyl) accounted for more than 50% of all reports. All of the drugs identified included death as a consequence of the ADE, which could be due to the opioid alone or in combination with one or more other drugs.15
Not surprisingly, the results of this study show that the proportion of deaths to opioid type to be highest with heroin, which validates the numerous news stories on opioid cause of death. Interestingly, the proportion of deaths to ADEs were significant for dextromethorphan, which although had the lowest number of records, had the second highest proportion of deaths to adverse drug events. Dextromethorphan hydrobromide is found in more than 100 over-the-counter cough and cold remedies in the U.S.,16 and is normally thought of as being safe and effective, and low in abuse potential.
Opioid availability has been implicated as a leading stimulus of the opioid epidemic.17 In practice, the root cause of the opioid epidemic is multifaceted and has been linked to a range of issues. Such issues include changes in prescribing patterns, increasing access and decreased relative cost of heroin, illicitly manufactured fentanyl, and the increasing treatment demand to supply gap and it particular impact on populations with little access to treatment.18,19 While the adverse drug events occur among all types of opioids, the incidence of reported ADEs for the most frequently occurring drugs is likely related to the magnitude of availability and usage.
Founded in 1993, the MedWatch system and FAERS database not only exist as a repository of adverse drug events,2,3 but also can be viewed as a “microcosm” of drug treatment and outcomes in our healthcare system. The drugs that populate the FAERS database are those that are implicated in an adverse event ranging from any undesirable experience to death.20
In our estimation, the ADEs for the selected opioids made up approximately 2.6% of those in the FAERS database. In absolute terms, this may not seem imposing, but with thousands of approved drugs in existence, the opioid and opioid-like drugs described in this report actually represent a significant number of suspected adverse drug events.
In addition, MedWatch reports of adverse drug events are notoriously underreported.21 In fact, the under-reporting of adverse drug events in general has been deemed an “international health concern.” With this in mind, it would be reasonable to assume that the reporting of ADEs for opioids would also be underreported, thus, only a small portion of ADEs that occur are represented in these counts.
Limitation
This report provides a “snapshot” of activity regarding usage of opioid drugs, and without physiologic, psychologic or demographic information on patient cases involved with these drugs, caution in drawing meaningful conclusions should be advised.
While the resulting FAERS data may provide the signal of a safety concern with an ADE that may warrant further investigation, there are limitations to interpreting the data.
Adverse drug events (ADEs) include allergic reactions, side effects, overmedication, and medication errors.22 With frequency counts, information is lacking on the actual nature of the ADEs or their severity, and there is no information on the number of users of a specific drug that can be used to calculate the proportion of patients experiencing an event.23 It would be beneficial to address this issue in future studies.
Conclusion
According to Sakaeda et al (2013), “A report in the FAERS database is a story, sometimes only a rumor, but numerous reports can reflect reality.”24 The FAERS database represents an important source for detection and reporting of adverse drug events, in particular the opioids and related drugs. It remains a challenge to estimate the true incidence of ADEs for this class of drugs in the general population.
Acknowledgment
The study was funded by The University of Texas at Tyler Ben and Maytee Fisch College of Pharmacy, with no external sources of funding or support.
Disclosure
The authors report no conflicts of interest in this work.
References
1. Kelly JP, Cook SF, Kaufman DW, Anderson T, Rosenberg L, Mitchell AA. Prevalence and characteristics of opioid use in the US adult population. Pain. 2008;138(3):507–513. Epub 2008 Mar 14. doi:10.1016/j.pain.2008.01.027
2. U.S. Food and Drug Administration. [homepage on the Internet]. Questions and Answers on FDA’s Adverse Event Reporting System (FAERS). What is FAERS? 2018 June 4. Available from: https://www.fda.gov/drugs/surveillance/fda-adverse-event-reporting-system-faers.
3. Marks NS MedWatch: safety information and adverse event reporting. Jul 11, 2017. Available from: http://www.medscape.org/viewarticle/588757.
4. Poluzzi E, Raschi E, Piccinni C, de Ponti F. Data mining techniques in pharmacovigilance: analysis of the publicly accessible FDA Adverse Event Reporting System (AERS). In: Karahoca A, editor. Data Mining Applications in Engineering and Medicine. Croatia: InTech; 2012:267–301.
5. Stat Trek. Statistics dictionary. Frequency Count; 2019. Available from: http://stattrek.com/statistics/dictionary.aspx?definition=frequency%20count.
6. Reid A. Advantages & disadvantages of a frequency table. Sciencing. 2018. Available from: https://sciencing.com/advantages-disadvantages-frequency-table-12000027.html.
7. Veronin MA, Schumaker RP, Dixit R, Dhake P, Ogwo M. A systematic approach to “cleaning” of drug name records data in the FAERS database. IJBDM. In press 2019.
8. National Institute on Drug Abuse. DrugFacts. Prescription opioids. June 2018. Available from: https://www.drugabuse.gov/publications/drugfacts/prescription-opioids.
9. Miller SC. Dextromethorphan psychosis, dependence and physical withdrawal. Addict Biol. 2005;10(4):325–327. doi:10.1080/13556210500352410
10. Yokell MA, Zaller ND, Green TC, Rich JD. Buprenorphine and buprenorphine/naloxone diversion, misuse, and illicit use: an international review. Curr Drug Abuse Rev. 2011;4(1):28–41. doi:10.2174/1874473711104010028
11. Tutorialspoint. MySQL - Select Query: 2019. Available from: https://www.tutorialspoint.com/mysql/mysql-select-query.htm.
12. Nebeker JR, Barach P, Samore MH. Clarifying adverse drug events: a clinician’s guide to terminology, documentation, and reporting. Ann Intern Med. 2004;140:795–801. doi:10.7326/0003-4819-140-10-200405180-00009
13. Institute for Healthcare Improvement. Measures. Adverse events per 1,000 doses; 2019. Available from: http://www.ihi.org/resources/Pages/Measures/ADEsper1000Doses.aspx.
14. Carlberg C. Statistical analysis with microsoft excel 2013: about variables and values. Informit. May 20, 2014. Available from: http://www.informit.com/articles/article.aspx?p=2201796&seqNum=3.
15. Cone EJ, Fant RV, Rohay JM, et al. Oxycodone involvement in drug abuse deaths: a DAWN-based classification scheme applied to an oxycodone postmortem database containing over 1000 cases. J Anal Toxicol. 2003;27(2):57–67. doi:10.1093/jat/27.2.57
16. Consumer Products Healthcare Association. Dextromethorphan: preventing teen cough medicine abuse 2019. Available from: https://www.chpa.org/dex.aspx.
17. Bershidsky L Supply, not despair, caused the opioid epidemic. Bloomberg. January 10, 2018. Available from: https://www.bloomberg.com/opinion/articles/2018-01-10/supply-not-despair-caused-the-opioid-epidemic.
18. National Institute on Drug Abuse. Opioid overdose crisis. January 2019. Available from: https://www.drugabuse.gov/drugs-abuse/opioids/opioid-overdose-crisis.
19. Liu L, Pei DN, Soto P. History of the opioid epidemic. How did we get here? Poison Control. National Capital Poison Center. 2019. Available from: https://www.poison.org/articles/opioid-epidemic-history-and-prescribing-patterns-182.
20. Overstreet B A closer look at FDA’s adverse event reporting system. Patient Safety & Quality Healthcare. January 24, 2012. Available from: https://www.psqh.com/analysis/a-closer-look-at-fdas-adverse-event-reporting-system/.
21. Stergiopoulos S, Brown CA, Felix T, Grampp G, Getz KA. A survey of adverse event reporting practices among US healthcare professionals. Drug Saf. 2016;39(11):1117–1127. doi:10.1007/s40264-016-0455-4
22. Committee on the Assessment of the U.S. Drug Safety System, Baciu A, Stratton K, Burke SP, editors. The Future of Drug Safety: Promoting and Protecting the Health of the Public. Washington (DC): National Academies Press; 2006:Ch2:20.
23. Pal S. Reporting and consequences of adverse events. US Pharm. 2017;42(10):12.
24. Sakaeda T, Tamon A, Kadoyama K, Okuno Y. Data mining of the public version of the FDA adverse event reporting system. Int J Med Sci. 2013;10(7):796–803. doi:10.7150/ijms.6048
 © 2019 The Author(s). This work is published and licensed by Dove Medical Press Limited. The full terms of this license are available at https://www.dovepress.com/terms.php and incorporate the Creative Commons Attribution - Non Commercial (unported, v3.0) License.
By accessing the work you hereby accept the Terms. Non-commercial uses of the work are permitted without any further permission from Dove Medical Press Limited, provided the work is properly attributed. For permission for commercial use of this work, please see paragraphs 4.2 and 5 of our Terms.
© 2019 The Author(s). This work is published and licensed by Dove Medical Press Limited. The full terms of this license are available at https://www.dovepress.com/terms.php and incorporate the Creative Commons Attribution - Non Commercial (unported, v3.0) License.
By accessing the work you hereby accept the Terms. Non-commercial uses of the work are permitted without any further permission from Dove Medical Press Limited, provided the work is properly attributed. For permission for commercial use of this work, please see paragraphs 4.2 and 5 of our Terms.