")
Back to Journals » Patient Preference and Adherence » Volume 9
Older patients’ perceived burdens of their health problems: a cross-sectional analysis in 74 German general practices
Authors Junius-Walker U, Wiese B , Klaaßen-Mielke R, Theile G, Müller C, Hummers-Pradier E
Received 22 January 2015
Accepted for publication 18 March 2015
Published 18 June 2015 Volume 2015:9 Pages 811—820
DOI https://doi.org/10.2147/PPA.S81348
Checked for plagiarism Yes
Review by Single anonymous peer review
Peer reviewer comments 5
Editor who approved publication: Dr Johnny Chen
Ulrike Junius-Walker,1 Birgitt Wiese,1 Renate Klaaßen-Mielke,2 Gudrun Theile,1,3 Christiane Annette Müller,4 Eva Hummers-Pradier4
1Institute of General Practice, Hannover Medical School, Hannover, 2Department of Medical Informatics, Biometry and Epidemiology, Ruhr-University, Bochum, Germany; 3Geriatric Clinic University Hospital, Zurich, Switzerland; 4Department of General Practice/Family Medicine, University Medical Center Göttingen, Georg-August-University, Göttingen, Germany
Background: Older patients often experience the burden of multiple health problems. Physicians need to consider them to arrive at a holistic treatment plan. Yet, it has not been systematically investigated as to which personal burdens ensue from certain health conditions.
Objective: The objective of this study is to examine older patients’ perceived burden of their health problems.
Patients and methods: The study presents a cross-sectional analysis in 74 German general practices; 836 patients, 72 years and older (mean 79±4.4), rated the burden of each health problem disclosed by a comprehensive geriatric assessment. Patients rated each burden using three components: importance, emotional impact, and impact on daily activities. Cluster analyses were performed to define patterns in the rating of these components of burden. In a multilevel logistic regression analysis, independent factors that predict high and low burden were explored.
Results: Patients had a median of eleven health problems and rated the burden of altogether 8,900 health problems. Four clusters provided a good clustering structure. Two clusters describe a high burden, and a further two, a low burden. Patients attributed a high burden to social and psychological health problems (especially being a caregiver: odds ratio [OR] 10.4, 95% confidence interval [CI] 4.4–24.4), to specific symptoms (eg, claudication: OR 2.3, 95% CI 1.3–4.0; pain: OR 2.3, 95% CI 1.6–3.1), and physical disabilities. Patients rated a comparatively low burden for most of their medical findings, for cognitive impairment, and lifestyle issues (eg, hypertension: OR 0.2, 95% CI 0.2–0.3).
Conclusion: The patients experienced a relatively greater burden for physical disabilities, mood, or social issues than for diseases themselves. Physicians should interpret these burdens in the individual context and consider them in their treatment planning.
Keywords: patient preference, quality of life, older adults, general practice, cost of illness
Introduction
Patients’ perceived burdens of their health problems play an important role in the consultation. Information gathering of these perceptions is considered as part of the “groundwork for explanation and treatment planning”.1 Older patients, however, often do not present with just one but multiple morbidities. Rather than deciding upon treatment for a single condition, doctors need to factor multiple health problems into one holistic treatment plan.2 In these circumstances, patients’ views on their disease-specific burdens need to be simultaneously collected and weighed in relation to one another.3,4 In practice, however, physicians gather views on single diseases in a subsequent way,5 and there is no clear strategy on how to strike a balance between different health-related burdens.
The phrase “burden” is introduced in this context to depict illness perceptions associated with negative impacts of a health problem. The underlying concept of illness perceptions used here is Leventhal’s common-sense model of illness representation. In this model, the individual is seen as a problem solver, who evaluates a health problem on the cognitive and emotional level. The cognitive themes center around the disease label, its perceived timeframe, causal attributes, controllability, and consequences. In parallel, emotional responses gain momentum with feelings such as depression, annoyance, anger, or anxiety.6 Hence, the perceived burden of a health problem is influenced by personal emotional and cognitive appraisals, both of which need to be represented in an assessment of burden.
Perceived burden is usually assessed using two common approaches: generic measures across diseases or measures for specific conditions. An example of a generic measure is self-rated health. Population studies demonstrate a general decrease in self-rated health with advanced age and the presence of diseases.7 Other instruments measure burden for a specific condition or context, such as claudication or the caregiver’s burden.8,9 Both approaches cannot be applied to assess burdens of multiple health problems within a person, and instruments that measure or rank multiple burdens are not yet established. A good platform to develop such an assessment of multiple burdens seems to be the Duke/WONCA Severity of Illness Checklist. The original version assesses the severity of health problems for a patient from a professional point of view. A modified version was developed later to capture the patient’s perspectives on his or her health problems.10 We chose this patient version to measure perceived burden, and pilot tested and revised it in an earlier study.11
The negative impact of multiple morbidities on health-related quality of life has implications for clinical practice.12 Care decisions cannot be solely justified by guidelines for single diseases. Rather, patient-related burdens and treatment preferences need to be factored into the complex decision-making process.13 However, there appears to be a research gap in surveying and understanding the differential burden for patients with multimorbidity. The current study aims to examine perceived burdens of older patients of their different health problems.
Methods
Research setting and ethics approval
Data were derived from a subproject of the prerequisites for a new health care model for elderly people with multimorbidity (PRISCUS) consortium, funded by the German Federal Ministry of Education and Research. The subproject is a multicenter-controlled intervention trial in German general practices that took place between 2008 and 2010 (DRKS 00000575).14 The aim was to examine whether a doctor–patient consultation following a geriatric assessment improves the perceived burden of health problems in older patients. In this paper, we utilize the baseline data only. At baseline, all study participants received a comprehensive geriatric assessment (STEP, see “Data collection on patients’ health problems and their perceived burden for each problem”) and rated the perceived burden for each disclosed health problem. The type of health problem was then associated with its perceived burden. The ethics committee of Hannover Medical School approved of the study (number 4991).
Recruitment
For the PRISCUS project, we recruited 56 family physicians and added these to 18 family physicians from an existing epidemiological cohort (get-abi-cohort).15 The 56 family physicians were enrolled by accessing regional lists of the Association of Statutory Health Insurance Registered Doctors and of the teaching family practices. The practices covered altogether five regions in Germany (Hannover, Marburg, Munich, Leipzig, and Witten-Herdecke). Patients were enrolled in the practices if they fulfilled the inclusion criteria and consented to the study procedures. Inclusion criteria were the following: age 72 years and older (minimum age of the get-abi patient cohort), should be able to visit the practice, and should be contactable by telephone. Exclusion criteria were inability to consent, severe hearing or understanding difficulty, and simultaneous participation in another study.
Data collection on patients’ health problems and their perceived burden for each problem
Participants received a comprehensive geriatric assessment “STEP” performed by study nurses in the practices. STEP is an assessment used in primary care studies in Germany and neighboring countries.16 It addresses health problems, risks, and health behaviors of seven different health domains: functional health, social circumstances, somatic symptoms, medical findings, mood, preventive lifestyle issues, and cognition. It contains 44 items, in the form of questions and a few simple examinations, such as taking the pulse and blood pressure, a clock-drawing test to screen cognition, a timed-up-and-go test for mobility and risk of falls, and a foot examination.17 Immediately after the assessment, patients received a list of their individual health problems. Our study nurses then collected ratings of the perceived burden for each listed problem.
Operationalization of patient-rated burden
The assessment of the perceived burden for each problem was based on the Duke Severity of Illness Checklist modified by Okkes et al for patient self-assessment.10 Results from our pilot study led us to determine three items, which best capture different aspects of burden using the cognitive component of significance, a disabling, and an emotional component.11
- How important is this problem to you?”
- How much are you emotionally affected by the problem?”
- How much does this problem limit you in your daily activities?”
Responses were on a four-point Likert scale: “not at all”, “a little”, “fairly”, and “very”. This even-numbered scale is used to produce a forced choice with no indifferent option available. Such a scale decreases social desirability bias and makes it easier to dichotomize responses for analysis.18
The three questions were applied to 34 out of 44 health problems in the STEP assessment (triple ratings). For nine STEP problems, however, it did not make sense to inquire about resulting limitations in daily activities. In these cases, patients only responded to the remaining two burden components (dual ratings). For example, it is meaningless to ask “How much are you limited in your daily activities?” for a health problem like “I have no person to trust”. For the same reason, patients were asked to rate “unknown or no vaccination coverage” just according to its perceived importance. In Table 1, the 44 health problems are presented together with the type of burden rating (34 triple, nine dual, one single rating).
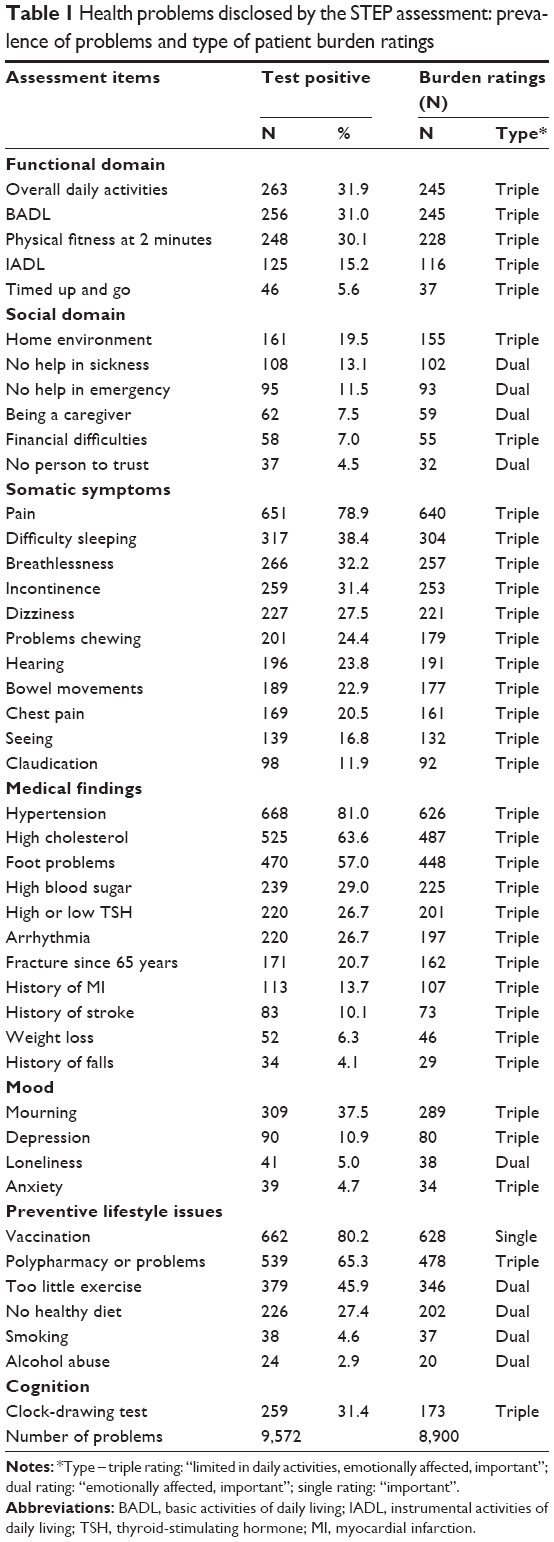 | Table 1 Health problems disclosed by the STEP assessment: prevalence of problems and type of patient burden ratings |
Data analyses
The data of 826 patients were analyzed. Altogether, they had 9,572 health problems disclosed by the assessment, of which they rated 8,900 according to the perceived burden.
We first determined the prevalence of health problems (Table 1) and the separate relative frequencies of perceived importance, emotional affection, and limitation in daily activities for each health problem. In a next step, we considered the combined burden components of a health problem (dual or rather triple ratings) and explored their response combinations. For this reason, the robust clustering method, partitioning around medoids, from Kaufman and Rousseeuw was applied to the response items to identify groups of similar patterns (clusters).19 The term medoid refers to a representative data object within a cluster for which the distance to all the other members of the cluster is minimum. The average silhouette width provides a measure of cluster goodness and shows how close each data object is to its medoid and how distant to the neighboring medoid. A large average silhouette width (approximating 1) means that the entered data objects are well clustered; a value of −1 means that data are poorly clustered.
Two cluster analyses were performed, one for the triple ratings of burden and one for the dual ratings. For health problems with triple ratings, four clusters provided the best average silhouette width (clusters A0, A1, A2, A3); for health problems with dual ratings, it was three clusters (clusters B0, B1, B2; Table 2). The clusters A0 and B0, A1 and B1, and A2 and B2 turned out to convey the same message (as shown in Table 2). Therefore, we felt it was justified to merge the clusters for further analysis: A0 and B0→0, A1 and B1→1, A2 and B2→2, and A3→3.
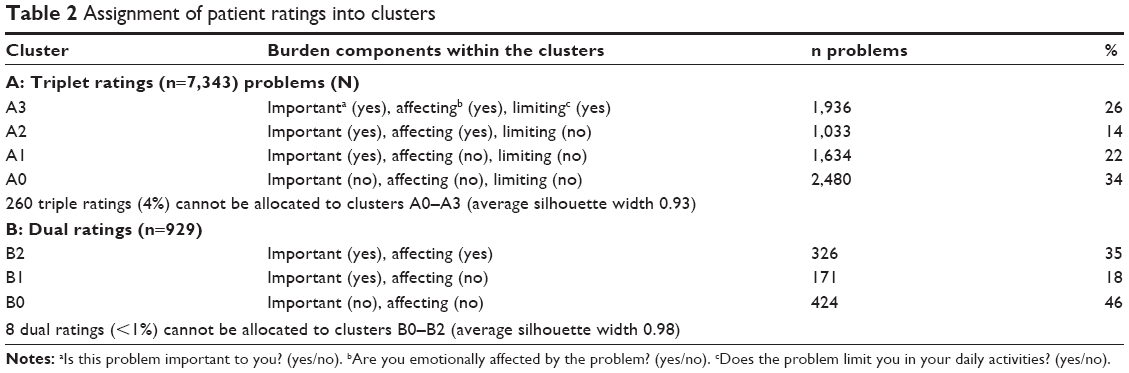 | Table 2 Assignment of patient ratings into clusters |
To further evaluate the influence of different covariates (eg, age, sex, type of health problem) on these clusters, a multilevel (mixed-effect) logistic regression was applied. As several health problems belong to one patient, the patient entered as random effect into this model. The clusters were used as the outcome variable in the regression model. Clusters “2” and “3” were defined as presenting a high burden because they reveal a negative impact on emotions and/or on daily activities. Clusters “0” and “1” express a lower burden with no such consequences. As predictor variables we used patient’s characteristics (age ≥80/<80 years, sex, education status [low: elementary school or less]), number of health problems [having ≥11/<11, 11 being the median for this population], and type of health problem. There were 44 types of health problems for which sleeplessness was used as the reference value. Sleeplessness was chosen as a reference because it holds the middle position in the cluster ratings of burden (49% of affected patients rated a high burden, 51% a low burden).
We used the following statistical programs for our analyses: SPSS Version 22 for the descriptive analyses, R package “cluster” for the cluster analyses, and STATA Version 12 for the multilevel logistic regression analysis.
Results
Participants
Seventy-four physicians from five German regions took part in the study. In their practices, a total of 836 patients agreed to participate. Four patients did not match entry criteria. Another six patients had participated in the assessment but not in the burden ratings and were excluded. The remaining 826 patients were on average 79 (±4.4) years old, 61% were female, and 41% lived alone, 56% with a partner, 2% with their children, and less than 1% in institutional care. The 826 patients had altogether 9,572 health problems disclosed by the STEP assessment with a median of eleven problems (interquartile range 8–15). Participants rated the burden for 8,900 of the problems, and 672 problems (7%) were not rated. Table 1 presents the prevalence of the 44 health problems and the burden ratings disclosed by the assessment.
Clusters of burden
Two cluster analyses (one for the triple ratings and one for the dual ratings) were performed to identify groups of cases, which are similar with regard to their response patterns. Results are shown in Table 2. An optimal clustering structure was reached with four clusters for the triple ratings (A0–A3), and with three clusters for the dual ratings (B0–B2) as determined by silhouette width.
Of practical significance is a common hierarchy of patient perceptions: whenever patients perceived a problem as limiting in daily activities, they also felt emotionally affected and considered it important. Likewise, whenever patients perceived a problem as emotionally affecting but not limiting in activities, they also considered it important. Important health problems could also stand for themselves. These dependencies were responsible for the confined set of clusters and the good clustering structure.
Health problems and their assignment to burden clusters
Figure 1 depicts the 44 health problems with their associated perceived burden clusters. They are listed within the seven health domains. The stacked bars for each health problem represent the proportion of patients, whose associated burden was allocated to clusters 3, 2, 1, and 0.
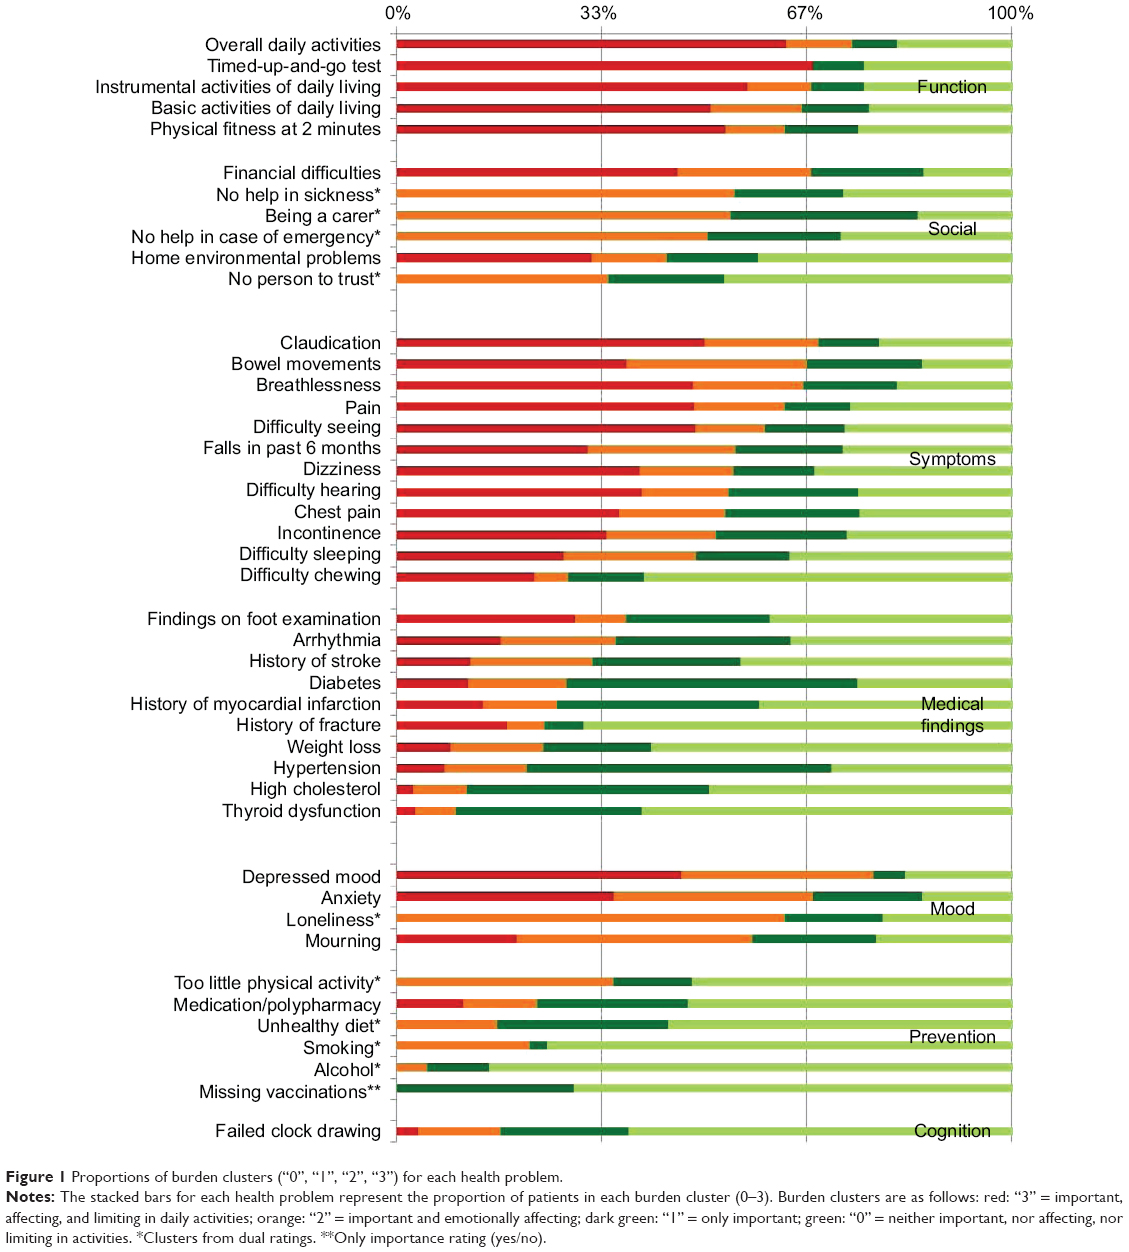 | Figure 1 Proportions of burden clusters (“0”, “1”, “2”, “3”) for each health problem. |
Cluster “3”: high burden, which is important, emotionally affecting, and limiting in daily activities.
More than half of the patients within the domain of functional health problems, such as difficulties with basic and instrumental activities of daily living or with a slow walk (failed timed-up-and-go test), perceived such a high burden. Also, patients who suffered from symptoms of claudication, shortness of breath, pain, and difficulty seeing perceived these problems as burdensome in this way.
Cluster “2”: high burden, which is important and emotionally affecting with no impact on daily activities.
Social problems, such as being a caregiver, the absence of a close person, and problems with mood, predominately fell into this category.
Cluster “1”: low burden, which is important with no impact on emotions or daily activities.
This was the case for some medical findings, such as hypertension, diabetes, high cholesterol levels, thyroid dysfunction, and history of myocardial infarction.
Cluster “0”: low burden, which is unimportant with no impact on emotions or on daily activities.
Patients predominately considered their unhealthy lifestyles in the preventive health domain as not burdensome but also history of a fracture and a failed clock-drawing test used for dementia screening.
Influence of patient characteristics and specific health problems on high-burden clusters
The multilevel logistic regression analysis enabled us to explore the independent effect of different health problems on the perceived burden (outcome variable represented by high-burden clusters “2 and 3”; Table 3). In this prediction model, adjustments were made for patient characteristics and burden ratings within a patient (level 1) and burden ratings between patients (level 2). Patients with greater than or equal to eleven health problems (median in this population) had a greater chance of experiencing a high burden for any of their problems as compared to patients with fewer health problems.
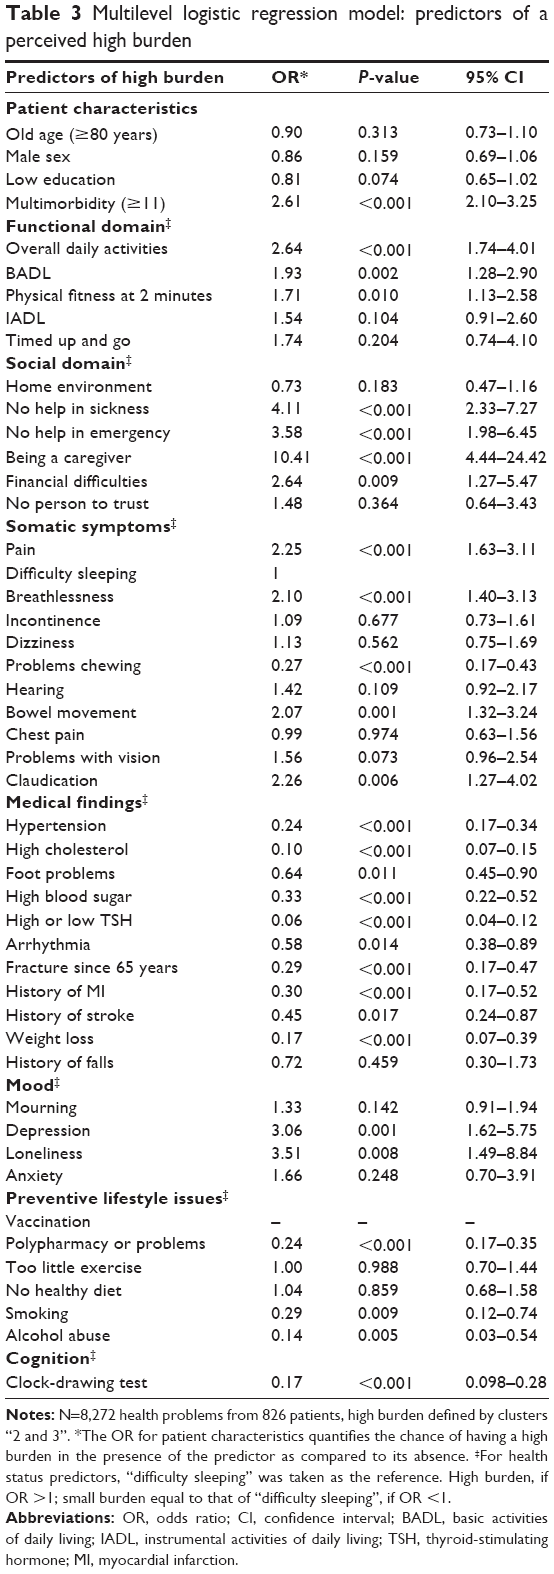 | Table 3 Multilevel logistic regression model: predictors of a perceived high burden |
The 44 specific health problems were also taken into account with sleeplessness used as the reference. Compared to patients who suffered from sleeplessness, most of the functional and social health problems predicted a higher burden; this also applied to some symptoms, such as pain, claudication, shortness of breath, and difficulty with bowel movements. Additionally, depression and loneliness were considered to be highly burdensome. By far, the greatest chance of being rated as a high burden was the caregiving role.
By contrast, a relatively low burden was present for all medical findings with the exception of history of falls. Patients also considered problems with chewing, vaccination, the clock-drawing test, and some preventive lifestyle issues, such as problems with medication, smoking, and alcohol abuse, as hardly burdensome (Table 3). High cholesterol levels and thyroid dysfunction had by far the greatest chance of receiving a low burden.
Discussion
In this study, older patients rated the burden for each of their health problems. Three components were used to portray burden: importance, emotional impact, and impact on daily activities. The study generates three main findings. Firstly, the clusters obtained from the three components indicate a hierarchy of burden, in that “impact on daily activities” is always accompanied by “emotional impact”, and “emotional impact” is always accompanied by “importance”. “Importance”, however, can appear alone. Secondly, the perceived burden differs in its nature and extent depending on the underlying health problem: “non-diseases”, such as functional health problems, psychological issues, social circumstances, and some symptoms are related to a high burden with an impact on daily living and on emotions. Other problems, in particular, chronic diseases and preventive lifestyle issues, are associated with a lower burden. Thirdly, the multilevel regression analysis shows that additional factors such as the presence of many health problems and financial difficulties independently predict high burden.
Attributes of the burden components (limitations on daily living, affection, and importance)
Patients rating clusters of burden demonstrated a hierarchy. The component “limitations in daily activities” always also involved negative affections and an appreciation of importance. Previous studies have shown that the experience of functional limitations has an independent negative effect on self-rated health.20,21 This indicates that it is an own entity within the patient perception of health. What the experience of being limited in daily activities actually entails remains fairly unclear. However, it has been previously shown that it is linked to negative emotions, such as distress and depression, but aspects such as experiencing dependence or losing autonomy also play a role.22–24
Another component of burden is emotion. In the current study, a large proportion of patients felt emotionally burdened if they were affected by mood disorders or by social stressors, such as lack of support or isolation. A recent study has shown that little social participation has a direct effect on psychological distress.25
The third burden component deals with the notion of importance. In our study, patients frequently perceived medical findings (eg, high cholesterol levels, diabetes, and hypertension) important but rarely disabling or emotionally affecting. Similar observations have been made in previous quality-of-life studies for hypertension and diabetes.26,27 Possible explanations are that older patients may not be fully aware of the diagnosis and its consequences and are less likely to take control.28 They may perceive those diseases just as labels and not relate them to disease-specific symptoms and experiences, or patients blindly trust their doctors’ treatment and risk management.29 It may be exactly these aspects of dissociation and handing control over to professionals that move responsibilities to the physicians. This, in turn, relieves patients from their perceived burden.30
Single health problems and their perceived burden in relation to each other
Previous research dealt with subjective health and related concepts either using a holistic measure across diseases or focusing on a single disease. We deliberately wanted patients with multiple health problems to self-assess their burden for each problem in the context of all their problems.
The majority of our study patients associate problems in the health domains of mood and function with a high burden (with an emotional and/or disabling impact). These links have been previously made in studies of self-rated health, yet they have found insufficient attention in practice.31,32 Disease-specific recommendations giving guidance on controlling the underlying disorder take center stage, while professional attention on the resultant disability or handicap falls behind.33,34 Presently, studies are underway to determine effects of new health care programs to assess and prevent disability in older patients in general practices.35,36
In our study, patients also rated several symptoms as highly burdensome, in particular pain, problems with bowel movements, and shortness of breath. Despite their perceived burden, these often remain underdiagnosed in practice, and in the case of problems with bowel movements, patients do not experience sufficient treatment relief.16,37–39
A comparatively low burden was connected with health problems, such as chronic diseases and especially preventive lifestyle issues (eg, unhealthy diet or lack of physical activity). Patients may have found lifestyle issues relatively insignificant in the light of other health problems; they may also have considered the additional burden that comes with efforts toward behavioral change. Interestingly, also the failed clock-drawing test had little effect on the perceived burden. Patients may have felt awkward with their test performance and may have denied any personal implications.
Additional findings from the multilevel regression analysis
In the regression model, being a caregiver turned out to be the most relevant predictor of a high burden. It is well known that caring interferes with many health and life domains,40 and the risk of hospitalization and mortality rises with an increasing burden of caregiving.41 Family physicians tend to underrate the impaired health of caregivers and often feel unable to provide services tailored toward their special needs.42
The regression model also reveals a significant association of a high burden with a low income but not with sex, age, and education. Recent regression models on older people’s or patients’ self-rated health also found no association between burden and sex, and differing effects for income, education, and age.43–45 In accordance with the Longitudinal Aging Study Amsterdam, our model demonstrates that the presence of multiple health problems has an independent effect on burden.46
Strengths and limitations
Our study moves to the fore the subjective perceptions of older patients on their multiple health problems facilitating a differentiated picture on the associated burdens. We have also tested a practical and easy method that assesses the burden of health problems in patients with multimorbidity.
There are some limitations in the measurement and interpretation of burden. The perceived burden as such is not an established concept, and we do not presume to provide a comprehensive understanding of burden. It is possible that through the structured nature of the study instrument, we did not capture all meanings of burden. We also assigned a “high” or “low” burden to the response combinations, which is an interpretative statement. Hence, further theoretical and empirical research is needed as well as a formal validation of instruments. The findings may not be representative for the general population. As patients were directly recruited from practices, they may have perceived their health problems more severely. Our data on burden result from a cross-sectional study. This “snapshot” cannot capture different perception stages that patients may adopt in the course of their diseases.
The STEP assessment does not deal with all health problems that older people encounter. However, it has been specially developed to give a comprehensive overview of typical old-age problems representing symptoms, disabilities, and health-related environmental factors that are often excluded in studies examining subjective health perceptions.
Conclusion
Older patients have a wide spectrum of health problems and rate the burden associated with these quite differently. Functional and psychological problems, adverse social circumstances, and some specific symptoms induce a great and comprehensive burden. Also, the presence of multiple health problems and financial difficulties add to this burden. Other health problems, such as lifestyle issues and chronic diseases, generate a relatively low burden. Underlying reasons are hypothetical and need to be investigated further.
It has been commented that with an emphasis on disease-specific evidence-based medicine, “the relief of suffering as a goal of medicine” moves into the background.47 Family physicians are the primary contacts for older patients who suffer in particular from functional, psychological, and social health problems. Our findings may encourage physicians to actively inquire into older patients’ perceived burdens and use this information as an additional factor in weighing up treatment decisions in the presence of multimorbidity.48
Acknowledgments
The authors thank all the family physicians who participated in this study. They also thank Prof Dr med Stefan Wilm and his team from the Institute of General Practice, Heinrich-Heine-University Düsseldorf, who recruited general practices in the Witten-Herdecke region. Further participating partners in the PRISCUS project are HJ Trampisch, L Pientka, U Thiem, P Thürmann, P Platen, K Berger, and W Greiner. The project was funded by the Federal Ministry of Education and Research [01ET0722].
Author contributions
UJW initiated this study, analyzed the results, and wrote the paper. RKM was responsible for data management. BW conducted the data analyses. GT und CM oversaw the fieldwork and data collection. EHP oversaw the whole project. All authors contributed toward data analysis, drafting and revising the paper and agree to be accountable for all aspects of the work.
Disclosure
The authors report no conflicts of interest in this work.
References
Silverman J, Kurtz S, Draper J. Skills for Communicating with Patients. Oxford: Radcliffe Publishing; 2004:66. | ||
Tinetti ME, McAvay GJ, Chang SS, et al. Contribution of multiple chronic conditions to universal health outcomes. J Am Geriatr Soc. 2011;59:1686–1691. | ||
Bayliss E, Bosworth H, Noel P, Wolff JL, Damush TM, Mciver L. Supporting self-management for patients with complex medical needs. Chronic Illn. 2007;3:167–175. | ||
Fraenkel L, McGraw S. Participation in medical decision making: the patients’ perspective. Med Decis Making. 2007;27:533–538. | ||
Anthierens S, Tansens A, Petrovic M, Christiaens T. Qualitative insights into general practitioners views on polypharmacy. BMC Fam Pract. 2010;11:65. | ||
Diefenbach M, Leventhal H. The common-sense model of illness representation: theoretical and practical considerations. J Soc Distress Homel. 1996;5:11–37. | ||
Idler E, Benyamini Y. Self-rated health and mortality: a review of twenty-seven community studies. J Health Soc Behav. 1997;38:21–37. | ||
Nordanstig J, Karlsson J, Pettersson M, Wann-Hansson C. Psychometric properties of the disease-specific health-related quality of life instrument VascuQoL in a Swedish setting. Health Qual Life Out. 2012;10:45. | ||
Deeken JF, Taylor KL, Mangan P, Yabroff KR, Ingham JM. Care for the caregivers: a review of self-report instruments developed to measure the burden, needs, and quality of life of informal caregivers. J Pain Symptom Manage. 2003;26:922–953. | ||
Okkes IM, Veldhuis M, Lamberts H. Severity of episodes of care assessed by family physicians and patients: the DUSOI/WONDA as an extension of the international classification of primary care (ICPC). Fam Pract. 2002;19:350–356. | ||
Junius-Walker U, Stolberg D, Steinke P, Theile G, Hummers-Pradier E, Dierks ML. Health and treatment priorities of older patients and their general practitioners: a cross-sectional study. Qual Prim Care. 2011;19:67–76. | ||
Brettschneider C, Leicht H, Bickel H, et al; MultiCare Study Group. Relative impact of multimorbid chronic conditions on health-related quality of life – results from the MultiCare Cohort Study. PLoS One. 2013;8:e66742. | ||
Boyd CM, Fortin M. Future of multimorbidity research: how should understanding of multimorbidity inform health system design? Public Health Rev. 2010;32:451–474. | ||
Thiem U, Hinrichs T, Müller CA, et al. Prerequisites for a new health care model for elderly people with multiple morbidities: results and conclusions from 3 years of research in the PRISCUS consortium. Z Gerontol Geriat. 2011;44(suppl 2):101–112. | ||
The getABI Study Group. The German epidemiological trial on Ankle Brachial Index (getABI): rationale, design and methods. VASA. 2002;4:241–248. | ||
Piccoliori G, Gerolimon E, Abholz H. Geriatric assessment in general practice using a screening instrument: is it worth the effort? Results of a South Tyrol Study. Age Ageing. 2008;37:647–652. | ||
Sandholzer H, Hellenbrand W, v Renteln-Kruse W, van Weel C, Walker P; The Step-Panel. An evidence-based approach to assessing older people in primary care. Occ Paper R Coll Gen Pract. 2002;82:1–53. | ||
Garland R. The mid-point on a rating scale: is it desirable? Mark Bull. 1991;2:66–70. [Research Note 3]. | ||
Kaufman L, Rousseeuw PJ. Finding Groups in Data. New Jersey: Wiley and Sons; 2005. | ||
Arnadottir SA, Gunnarsdottir ED, Stenlund H, Lundin-Olsson L. Determinants of self-rated health in old age: a population-based, cross-sectional study using the international classification of functioning. BMC Public Health. 2011;11:670. | ||
Galenkamp H, Braam AW, Huisman M, Deeg DJ. Seventeen-year time trend in poor self-rated health in older adults: changing contributions of chronic diseases and disability. Eur J Public Health. 2013;23:511–517. | ||
Cairney J, Faulkner G, Veldhuize S, Wade T. Changes over time in physical activity and psychological distress among older adults. Can J Psychiatry. 2009;54:160–169. | ||
van den Brink CL, Tijhuis M, van den Bos GA, Giampaoli S, Nissinen A, Kromhout D. The contribution of self-rated health and depressive symptoms to disability severity as a predictor of 10-year mortality in European elderly men. Am J Pub Health. 2005;95:2029–2034. | ||
Breton É, Beloin F, Fortin C, et al. Gender-specific associations between functional autonomy and physical capacities in independent older adults: results from the NuAge study. Arch Gerontol Geriatr. 2014;58:56–62. | ||
Boen H, Dalgard O, Bjertness E. The importance of social support in the associations between psychological distress and somatic health problems and socio-economic factors among older adults living at home: a cross-sectional study. BMC Geriatr. 2012;12:27. | ||
Alonso J, Ferrer M, Gandek B, et al; IQOLA Project Group. Health-related quality of life associated with chronic conditions in eight countries: results from the International Quality of Life Assessment (IQOLA) Project. Qual Life Res. 2004;13:283–298. | ||
Wang HM, Beyer M, Gensichen J, Gerlach FM. Health-related quality of life among general practice patients with differing chronic diseases in Germany: cross sectional survey. BMC Public Health. 2008;8:246. | ||
Ostchega Y, Dillon CF, Hughes JP, Carroll M, Yoon S. Trends in hypertension prevalence, awareness, treatment, and control in older U.S. adults: data from the National Health and Nutrition Examination Survey 1988 and 2004. J Am Geriatr Soc. 2007;55:1056–1065. | ||
Perret-Guillaume C, Genet C, Herrmann F, Benetos A, Hurst SA, Vischer UM. Attitudes and approaches to decision making about antihypertensive treatment in elderly patients. J Am Med Dir Assoc. 2011;12:121–128. | ||
Junius-Walker U, Wrede J, Schleef T, et al. What is important, what needs treating? How GPs perceive older patients’ multiple health problems: a mixed method research study. BMC Res Notes. 2012;5:443. | ||
Mulsant B, Anguli M, Seaberg E. The relationship between self-rated health and depressive symptoms in an epidemiological sample of community-dwelling older adults. J Am Geriatr Soc. 1997;45:954–958. | ||
Schüz B, Wurm S, Schöllgen I, Tesch-Römer C. What do people include when they self-rate their health? Differential associations according to health status in community-dwelling older adults. Qual Life Res. 2011;20:1573–1580. | ||
Smith S, O’Dowd T. Chronic diseases: what happens when they come in multiples? Br J Gen Pract. 2007;57:268–270. | ||
Bounthavong M, Law AV. Identifying health-related quality of life (HRQL) domains for multiple chronic conditions (diabetes, hypertension and dyslipidemia): patient and provider perspectives. J Eval Clin Pract. 2008;14:1002–1011. | ||
Suijker JJ, Buurman BM, ter Riet G, et al. Comprehensive geriatric assessment, multifactorial interventions and nurse-led care coordination to prevent functional decline in community-dwelling older persons: protocol of a cluster randomized trial. BMC Health Serv Res. 2012;12:85. | ||
Stijnen MM, Duimel-Peeters IG, Jansen MW, Vrijhoef HJ. Early detection of health problems in potentially frail community-dwelling older people by general practices – project [G]OLD: design of a longitudinal, quasi-experimental study. BMC Geriatr. 2013;13:7. | ||
Watkins E, Wollan PC, Melton LJ 3rd, Yawn BP. Silent pain sufferers. Mayo Clin Proced. 2006;81:167–171. | ||
Nellesen D, Yee K, Chawla A, Lewis BE, Carson RT. A systematic review of the economic and humanistic burden of illness in irritable bowel syndrome and chronic constipation. J Manage Care Pharm. 2013;19:674–755. | ||
Johanson JF, Kralstein J. Chronic constipation: a survey of the patient perspective. Aliment Pharmacol Therapeut. 2007;25:599–608. | ||
Carretero S, Garcés J, Ródenas F, Sanjosé V. The informal caregiver’s burden of dependent people: theory and empirical review. Arch Gerontol Geriatr. 2009;49:74–79. | ||
Kuzuya M, Enoki H, Hasegawa J, et al. Impact of caregiver burden on adverse health outcomes in community-dwelling dependent older care recipients. Am J Geriatr Psychiatry. 2011;19:382–391. | ||
Greenwood N, Mackenzie A, Habibi R, Atkins C, Jones R. General practitioners and carers: a questionnaire survey of attitudes, awareness of issues, barriers and enablers to provision of services. BMC Fam Pract. 2010;11:100. | ||
König HH, Heider D, Lehnert T, et al; ESEMeD/MHEDEA 2000 investigators. Health status of the advanced elderly in six European countries: results from a representative survey using EQ-5D and SF-12. Health Qual Life Out. 2010;8:143. | ||
Nützel A, Dahlhaus A, Fuchs A, et al. Self-rated health in multimorbid older general practice patients: a cross-sectional study in Germany. BMC Fam Pract. 2014;15:1. | ||
Perrucio A, Katz J, Losina E. Health burden in chronic disease: multimorbidity is associated with self-rated health more than medical comorbidity alone. J Clin Epidemiol. 2012;65:100–106. | ||
Galenkamp H, Braam AW, Huisman M, Deeg DJ. Somatic multimorbidity and self-rated health in the older population. J Gerontol B Psychol Sci Soc Sci. 2011;66B:380–386. | ||
Cassel E. Diagnosing suffering: a perspective. Ann Intern Med. 1999;131:531–534. | ||
Fried TR, McGraw S, Agostini JV, Tinetti ME. Views of older persons with multiple morbidities on competing outcomes and clinical decision-making. J Am Geriatr Soc. 2008;56:1839–1844. |
 © 2015 The Author(s). This work is published and licensed by Dove Medical Press Limited. The full terms of this license are available at https://www.dovepress.com/terms.php and incorporate the Creative Commons Attribution - Non Commercial (unported, v3.0) License.
By accessing the work you hereby accept the Terms. Non-commercial uses of the work are permitted without any further permission from Dove Medical Press Limited, provided the work is properly attributed. For permission for commercial use of this work, please see paragraphs 4.2 and 5 of our Terms.
© 2015 The Author(s). This work is published and licensed by Dove Medical Press Limited. The full terms of this license are available at https://www.dovepress.com/terms.php and incorporate the Creative Commons Attribution - Non Commercial (unported, v3.0) License.
By accessing the work you hereby accept the Terms. Non-commercial uses of the work are permitted without any further permission from Dove Medical Press Limited, provided the work is properly attributed. For permission for commercial use of this work, please see paragraphs 4.2 and 5 of our Terms.