")
Back to Journals » OncoTargets and Therapy » Volume 12
OGDH promotes the progression of gastric cancer by regulating mitochondrial bioenergetics and Wnt/β-catenin signal pathway
Authors Lu X, Wu N , Yang W, Sun J, Yan K, Wu J
Received 15 March 2019
Accepted for publication 25 August 2019
Published 12 September 2019 Volume 2019:12 Pages 7489—7500
DOI https://doi.org/10.2147/OTT.S208848
Checked for plagiarism Yes
Review by Single anonymous peer review
Peer reviewer comments 2
Editor who approved publication: Professor Gaetano Romano
Xin Lu,1 Nan Wu,2 Wanli Yang,2 Jia Sun,3 Kemin Yan,3 Jing Wu1
1Biomedical-Information Engineering Laboratory of State Ministry of Education, Shaanxi Key Laboratory of Biomedical Engineering, School of Life and Science Technology, Xi’an Jiaotong University, Xi’an, Shaanxi 710049, People’s Republic of China; 2Laboratory of Tissue Engineering, Faculty of Life Science, Northwest University, Xi’an, Shaanxi 710069, People’s Republic of China; 3State Key Laboratory of Cancer Biology, National Clinical Research Center for Digestive Diseases and Xijing Hospital of Digestive Diseases, Air Force Military Medical University, Xi’an, Shaanxi 710032, People’s Republic of China
Correspondence: Jing Wu
Biomedical-Information Engineering Laboratory of State Ministry of Education, Shaanxi Key Laboratory of Biomedical Engineering, School of Life and Science Technology, Xi’an Jiaotong University, 28 Xian Ning Western Road, Xi’an City, Shaanxi Province 710049, People’s Republic of China
Email [email protected]
Background/aims: 2-oxoglutarate dehydrogenase (OGDH) is the first rate-limiting E1 subunit of OGDH complex (OGDHC), which plays as a regulatory point in the cross-road of TCA cycle and glutamine metabolism. Until now, the role of OGDH in carcinogenesis has been unclear.
Methods: In the present study, we determined the expression of OGDH in human gastric cancer (GC) tissues and cell lines by RT-qPCR, Western blotting and immunohistochemical staining respectively. The biological impacts of OGDH on cell growth and migration were explored through modulation OGDH expression in GC cells. Furthermore, mitochondrial functions and Wnt/β-catenin signal were analyzed to elucidate the mechanism by which OGDH was involved in GC progression.
Results: The results showed that the levels of OGDH mRNA and protein were significantly higher in GC tissues, which was positively correlated with clinicalpathological parameters of GC patients. OGDH inhibitor SP significantly suppressed GC cell viability. Modulation of OGDH had distinct effects on cell proliferation, cell cycle and cell migration in the GC cell lines AGS and BGC823. Overexpression of OGDH resulted in the downregulation of the EMT molecular markers E-cadherin and ZO-1, the upregulation of N-cadherin and claudin-1. OGDH deficiency had the opposite outcomes in GC cells. Meantime, OGDH knockdown cells showed decreased mitochondrial membrane potential, oxygen consumption rate, intracellular ATP product, and increased ROS level and NADP+/NADPH ratio. Consistently, overexpression of OGDH enhanced the mitochondrial function in GC cells. Furthermore, OGDH knockdown reduced the expressions of β-catenin, slug and TCF8/ZEB1, and the downstream targets cyclin D1 and MMP9 in GC cells. OGDH overexpression facilitated the activation of Wnt/β-catenin signal pathway. Additionally, overexpression of OGDH promoted tumorigenesis of GC cells in nude mice.
Conclusion: Taken together, these results indicate that OGDH serves as a positive regulator of GC progression through enhancement of mitochondrial function and activation of Wnt/β-catenin signaling.
Keywords: 2-oxoglutarate dehydrogenase, cell proliferation, epithelial-to-mesenchymal transition, gastric cancer, mitochondrial function, Wnt/β-catenin signal
Introduction
Gastric cancer (GC) is the third leading cause of worldwide cancer-related deaths according to the GLOBOCAN database.1 Despite recent improvement in diagnosis and therapeutic methods, the overall prognosis of patients with GC is still poor. The mechanism behind GC progression is quite complex. Helicobacter pylori infection, hereditary susceptibility and environment factors have been investigated as the major causes of its pathogenesis.2 Multiple genetic and epigenetic alterations or abnormality occur in the development of GC.3 To improve the understanding of GC progression, novel molecular mechanisms and therapeutic targets should be explored.
The OGDH complex is a major modulator of the tricarboxylic acid (TCA) cycle and electron transport chain activity, which catalyzes the decarboxylation of 2-OG to succinyl-CoA and reduces NAD+ to NADH. In normal cell metabolism, the production of the reducing equivalent NADH from OGDHC is feed to respiratory complex I to generate the mitochondrial membrane potential (Δψm) required for ATP production. The activity of OGDHC is regulated by multiple factors including ATP, inorganic phosphate, NAD+, Ca2+ and pH value. Through sensing cell energy status OGDHC dynamically interplays between the OXPHOS to adjust mitochondrial metabolism.4 Cancer cells undergo a reprogramming of metabolism to maintain bioenergetics, redox status, cell signaling and biosynthesis in harsh microenvironment, including glycolysis, the TCA cycle and glutaminolysis.5 Upon nutrient deprivation, glucose and glutamine are the two primary nutrients utilized by cancer cells to form 2-oxoglutarate (2-OG), which can be catalyzed by both OGDHC in oxidative decarboxylation and IDHs in reductive carboxylation.6 Therefore, operating at a metabolic cross-road, OGDHC plays an essential role in cancer cells to adjust metabolic fluxes according to resource availability and energy demand.
OGDHC consists three subunits, that the E1 subunit is 2-oxoglutarate dehydrogenase (OGDH), the E2 subunit is dihydrolipoamide succinyltransferase (DLST), and the E3 subunit is dihydrolipoamide dehydrogenase (DLD).7 The E1 and E2 subunits of keto acid dehydrogenases are specific for particular alpha-keto acids, the E3 subunit is common. Pyruvate dehydrogenase complex (PDHC), OGDHC and branched-chain alpha keto acid dehydrogenase (BCKDC) each catalyze the oxidative decarboxylation of specific alpha keto acids that are recognized by the E1 and E2 subunits. The recent study also identifies that mitochondrial 2-oxoadipate dehydrogenase complex shares the E2 and E3 components with OGDHC.8 It indicates that OGDH is the unique component of OGDHC working at the first and rate-limiting step. In humans, there are three major splice variants of the OGDH gene, V1 (114 kDa), V2 (48 kDa) and V3 (114 kDa), although the functional differences of these enzymes remain unreported. Recent studies show that OGDH gene expression is altered in diverse cancers, which implicates a potential role in carcinogenesis. It has been observed that OGDH gene was increased in the transformed rat lung epithelial cells and oral squamous cell carcinoma, and OGDH alternative mRNA transcript was upregulated in colorectal cancer.9–11 Somatic frameshift mutations of OGDH gene were detected in microsatellite instability high GCs and CRCs.12 Using OGDH inhibitors and silencing OGDH in siRNAs, the notably different dependencies of cancer cells have been uncovered in a manner of metabolic specificity.13,14 However, it still lacks of clear knowledge of the biological role of OGDH in the progression of cancer. To date, the expression pattern of OGDH in human gastric cancers has not been explored. In addition, its roles and the potential mechanism need further investigation
In the present study, we demonstrated that OGDH expression was obviously upregulated in GC tissues compared with adjacent non-cancer tissues, implying a correlation between OGDH expression and GC progression. Importantly, our data elucidated the positive role of OGDH in GC cell growth and migration by maintaining mitochondrial bioenergetics and activate epithelial-to-mesenchymal transition via Wnt/β-catenin signaling pathway. It suggests that OGDH might serve as a novel target for GC therapy.
Materials and methods
Patients of GC samples
The paired GC and adjacent normal stomach mucosa tissues were achieved from 33 diagnosed patients who had undergone GC surgery at Xi’jing Hospital of Digestive Disease. All the specimens were taken under the guidance of HIPAA protocol and approved by the ethics committee Xijing Hospital. All samples were clinically and pathologically verified. This study was approved by the Xijing Hospital Human Body Protection Committee. Informed consent was obtained from each patient.
Immunohistochemistry staining
Staining was performed by standard immunohistochemistry procedures. The GC tissue microarray (HStm-Ade150-01) was purchased from Shanghai Outdo Biotech Co. LTD., which includes 72 cases of gastric adenocarcinoma with paired paraneoplastic tissues. The tissue microarray slide was incubated overnight using primary antibody against OGDH (ab137773, Abcam, Cambridge, UK). Mayer’s hematoxylin was used for the purpose of nuclear counter staining. All pathological material was reviewed by a pathologist with experience in gastroenterology. The intensity of staining was scored as 0 (negative), 1 (weak), 2 (medium) or 3 (strong). Extent of staining was scored as 0 (<5%), 1 (5–25%), 2 (26–50%), 3 (51–75%) and 4 (>75%) according to the percentages of the positive staining areas in relation to the whole carcinoma area. Scores for staining intensity and percentage positivity of cells were then multiplied to generate the immunoreactivity score (IRS) for each case. Samples having a final staining score of ≤6 were considered to be low and those with score of >6 were considered to be high.
Cell culture
Human GC cell lines AGS, BGC-823, SGC7901, MKN45 and MKN28 were purchased from National Infrastructure of Cell Line Resource (Shanghai, China). The normal gastric epithelial cells (GES) were kindly offered by Professor Nie of the Fourth Military Medical University, which had the institutional review board approval to use. GC cells were cultured in RPMI medium (Gibco, NY, USA) supplemented with 10% fetal bovine serum (Bioind, Israel), 1% penicillin (100mM)/streptomycin (50 mM) (Gibco) in an atmosphere containing 5% CO2 at 37 °C. To detect the effects of OGDH inhibition on cell growth, different concentrations of SP (0~1 mM, HY-12688, MedChem Express Co., Shanghai, China) were added to the media and incubated for 48 hrs.
Recombinant lentivirus infection
AGS cells were infected by the lentiviral vector containing human OGDH full-length cDNA fragment (LV-OGDH) (GeneChem Co., Ltd, Shanghai, China). An empty vector was used as the negative control (LV-NC). The infected cells were selected for 14 days in the presence of 2 μg/mL puromycin (Sigma-Aldrich, St. Louis, USA) to establish the stable OGDH overexpressing cells.
Oligonucleotide transfection
Double-stranded siRNA against OGDH were purchased from Ribobio (Guanzhou, China). The sequences of OGDH siRNAs were as follows: 5ʹ-CAGCATCCAAAATC CCCAG-3ʹ and 5ʹ-GTGAACTGCATGATCCCAG-3ʹ.15 Oligonucleotide transfection was performed using lipofectamine 2000 reagent (Invitrogen). BGC823 cells cultured in 6-well plates were transfected with the siRNA according to the manufacturer’s instructions. In all experiments, a nonspecific scramble siRNA served as a control. Cells were analyzed 48 h after transfection. The specific silencing of the expression was assessed by Western blotting.
RNA extraction and quantitative real-time PCR
Total RNAs were isolated from cells by TRIzolTM reagent (ThermoFisher Scientific, USA), and reverse transcriptions were performed by Takara RNA PCR kit (Takara, Tokyo, Japan). Real-time PCR was performed on ABI 7500 system (Applied Biosystems, CA, USA) with SYBR Green PCR Supermixes (Biorad, California, USA). The gene expression level was normalized using GAPDH as an internal reference gene. The sequences of the primers used in the study (forward/reverse primer pair): OGDH: 5ʹ-GAGGCTGTCATGTACGTGTGCA-3ʹ and 5ʹ-TACATGAGCGGCTGCGTGAAC A-3ʹ; GAPDH: 5ʹ-AGAAGGCTGGGGCTCATT TG-3ʹ and 5ʹ-AGGGGCCATCCAC AGTCTTC-3ʹ.
Cell viability assay
The growth of GC cells was determined using a MTT assay kit (Beyotime, Jiangsu, China) according to the manufacturer’s protocol. Briefly cells were seeded in 96-well plates (2×10³ cells/well), cultured for another 1–3 days. At 24, 48 and 72 h after planting, cells were incubated with MTT(5 mg/mL) solution at 37 °C for 4h. Formazan precipitate was dissolved in DMSO, and absorbance was measured at a wavelength of 450 nm using BioRad microplate reader (FluoDia T70, Photon Technology International, Lawrenceville, NJ).
Colony formation assay
GC cells were seeded into 6-well plates (1×10³ cells/well) and cultured for 2 weeks at 37 °C in a 5% CO2-humidified incubator. The cells were fixed with 4% paraformaldehyde and stained with crystal violet. The experiments were repeated three times.
Flow cytometry
Single cell suspension (1×10⁶ cells) was fixed with 16% formaldehyde and stained by propidium iodide in the dark. Cell cycle was acquired by FACScan flow cytometer (BD Biosciences, Franklin Lakes, NJ). The results were analyzed using Multicycle-DNA Cell Cycle Analyzed Software.
Wound healing assay
Cells were seeded into 24-well plate and cultured until confluence. A straight scratch was made with a pipette tip, and the first image was acquired. After cells grew additional 24 h, the second image was photographed. Multiple views of each well was documented, and each experimental group was repeated triplicate.
Transwell migration assay
Cell migration was assayed using Transwell chambers (6.5 mm; Corning, NY, USA) with 8-μm pore membranes. The lower chamber was filled with 1500 μl of lower medium (medium with 20% FBS). The cells (5×10⁴ cells/well) were suspended in 200 μl of upper medium (medium with 1% FBS) and were plated into the upper chamber. After 24 hrs, the number of crystal violet-stained cells on the undersurface of the polycarbonate membranes was visually counted in five random fields at 100×magnification.
Western blot assay
Cell and tissue lysates were extracted by an ice-cold NP-40 buffer (50 mM Tris 7.4, 150 mM NaCl, 0.1% NP-40) supplemented with a protease inhibitor cocktail (Calbiochem, Darmstadt, Germany). Lysates were separated by SDS-polyacrylamide gel electrophoresis (SDS-PAGE) and immunoblotted. The antibodies used were as follows: anti-GAPDH (#ab5174) and anti-OGDH (#ab137773) were purchased from Abcam (Cambridge, MA, USA); EMT antibody samples (#9782), anti-MMP2 (#40994), anti-MMP9 (#13667), anti-β-actin (#3700), and HRP-linked anti-rabbit and anti-mouse secondary IgG (#7074 and #7076) were purchased from Cell Signaling Technology (Danvers, PA USA); anti-Flag (#F3165, Sigma-Aldrich).
JC-1 assay
Mitochondrial membrance potential (ΔΨm) was detected by specific probe JC-1 (#C2005, Beyotime) staining. Cells (5×10⁵/mL) were resuspended in JC-1 working buffer (10 μg/mL) and incubated in darkness. Then cells were measured fluorometrically with excitation and emission settings at red fluorescent (550 and 600 nm) green fluorescent (485 and 535 nm). Analysis the rate of red fluorescent signal and green fluorescent signal. Triplicate reactions were performed for the experiment.
Measurement of intracellular ROS
Intracellular ROS production was determined by using a fluorescent dye 2ʹ, 7ʹ-dichlorofluorescein diacetate (H2DCF-DA, Sigma-Aldrich). Briefly, cells were incubated with 10 μM H2DCF-DA at 37 °C for 30 min. Fluorescence (Ex.488nm, Em.525nm) was monitored by a SpectraMax M5 Microplate Reader (Molecular Devices). Triplicate reactions were performed for the experiment.
Measurement of intracellular ATP
Intracellular ATP concentration was measured by using an ATP assay kit (#S0026, Beyotime) according to the manufacturer’s instructions. In brief, 100 μL single cell suspension was mixed with 100 μL luciferin–luciferase reagent. Luminescence was monitored by using a Modulus TM Micoplate Reader. The signal intensities were normalized by cellular protein levels and showed as relative ATP levels. Triplicate reactions were performed for the experiment.
Extracellular O2 consumption assay
Oxygen consumption is measured by Extracellular O2 Consumption Assay kit (#ab197243, Abcam) to implicate mitochondrial function according to the manufacturer’s instructions.
Measurement of the ratio of NADP+/NADPH
The intracellular ratio NADP+/NADPH was detected by NADP+/NADPH Assay kit (#ab65349, Abcam) according to the manufacturer’s instructions.
Xenografted tumors in nude mice
BALB/c nude mice (5–6 weeks old) were purchased and maintained under specific pathogen-free conditions in the Centre of Animal, the Fourth Military Medical University, Xi’an China. This study was carried out in strict accordance with the recommendations in the Guide for the Care and Use of Laboratory Animals of the National Institutes of Health. All of the procedures in the studies involving animals were performed in accordance with the ethical standards of the Fourth Military Medical University. Cell (1×10⁷) in single cell suspension were injected subcutaneously into the both sides of the back of the nude mice to establish the subcutaneous xenograft tumor model (n=5 per group). After 4 weeks, all of the mice were sacrificed under deep anesthesia. The final weight of each tumor were recorded.
Statistical analysis
Statistical analyses were completed using SPSS 19.0 software (Chicagao, IL, USA) and Prism 5 software (San Diego, CA, USA). All data were shown as the mean ± SEM of triplicate values from three separate experiments. The results were compared by Student’s t-test or one-way ANOVA. P-value <0.05 was considered to be statistically significant (*0.01< P<0.05, **0.001< P<0.01, *** P<0.001).
Results
OGDH expression is significantly upregulated in GC tissues and cell lines
To investigate the expression of OGDH in GC tissues, we first performed qRT-PCR assay among 33 paired GC tissues and corresponding normal tissues and observed that OGDH mRNA expression was significantly upregulated in GC tissues (Figure 1A). Western blot assay confirmed that OGDH expression at the level of protein was higher in GC tissues than the compared normal tissues (Figure 1B). Consistently, OGDH expressions in GC cell lines AGS, MKN45, MKN28, BGC823 were higher than in GES cells (Figure 1C). To characterize the clinicopathological relevance of OGDH in GC patients, we analyzed the expression of OGDH in the GC tissue microarray of 72 paired cases of GC tissues and the adjacent normal tissues. As shown, OGDH was predominantly localized in the cytoplasm and significantly elevated in GC tissues compared with normal tissues (Figure 1D). Then cancerous tissues were divided into the high OGDH group (score ≥6) and low OGDH group (score<6), respectively. High expression of OGDH was detected in 64% (46/72) cases of GC tissues. In addition, GC patients with a larger tumor stage size (>3cm) and high AJCC stage (stage III and IV) had higher levels of OGDH (Table 1).
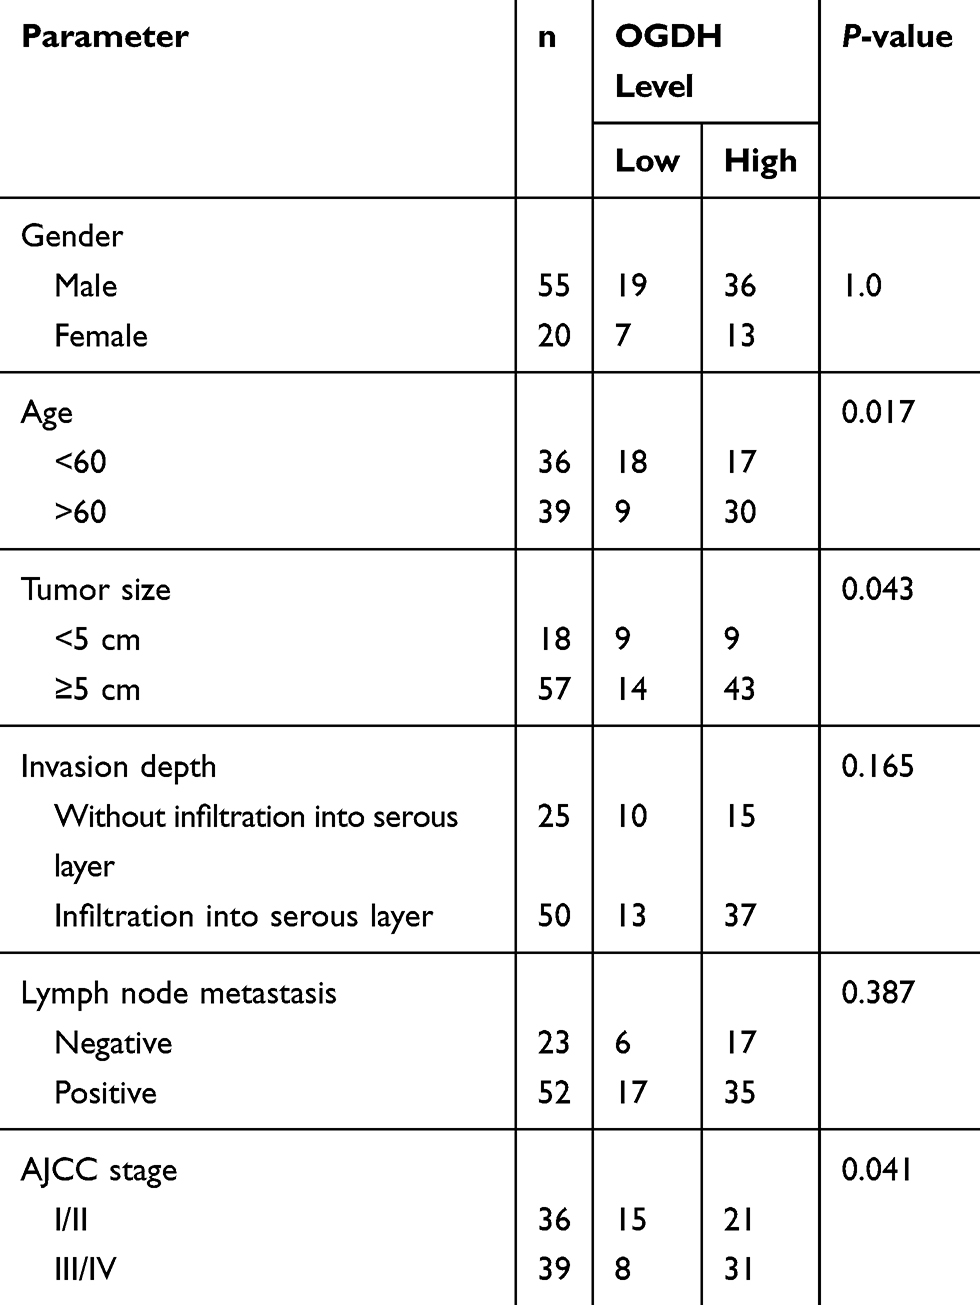 |
Table 1 Association of OGDH level with clinicopathological parameters of patients with gastric cancer |
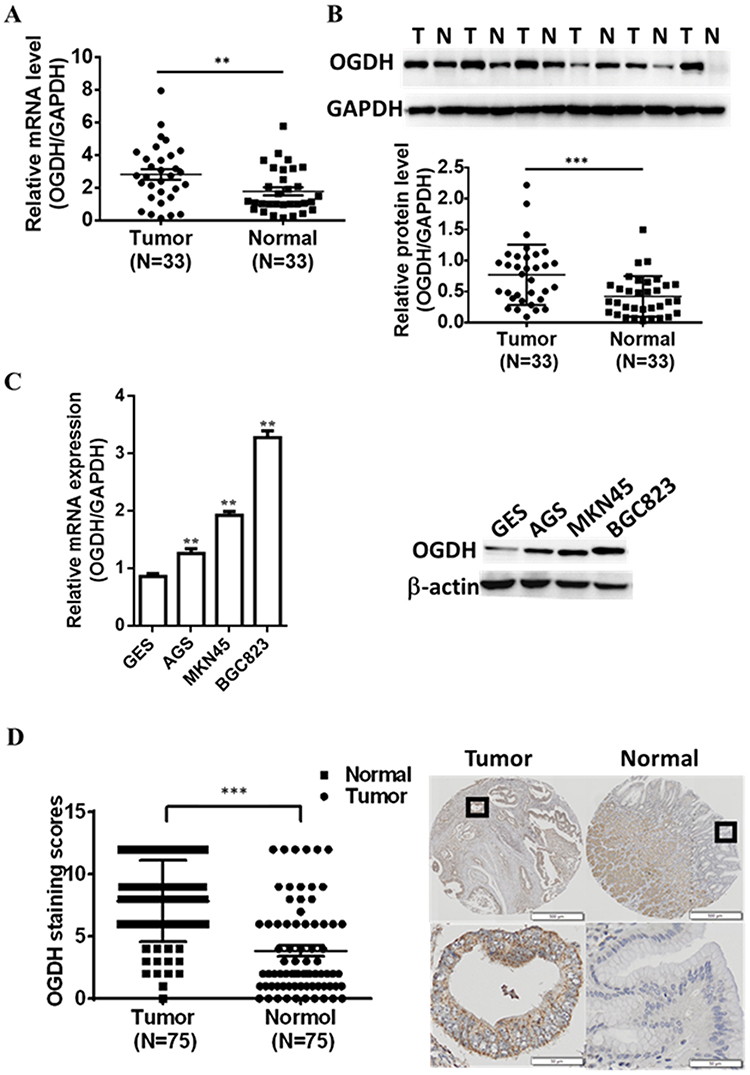 |
Figure 1 Expression of OGDH in human gastric cancer tissues and cell lines is upregulated. (A) The mRNA levels of OGDH in GC tissues and corresponding normal tissues were quantified by qRT-PCR normalized to those of GAPDH. (B) The protein levels of OGDH in GC tissues were determined by Western blotting. (C) The levels of OGDH mRNA and protein were determined by qRT-PCR and Western blotting respectively. (D) The expression and localization of OGDH in the GC tissue array were detected and scored with semiquantitative immunohistochemical staining. Data are expressed as the mean ± standard deviation (n=3). **P<0.01, ***P<0.001 vs. normal. |
OGDH promotes GC cell growth in vitro
Taking into account that cancer cells have great various dependence on OGDH activity due to the specific metabolic plasticity,16 we screened the sensitivities of three GC cell lines and GES cells to SP. The results showed that cell viability of poorly differentiated AGS was cells more significantly inhibited by SP than highly differentiated GC cells MKN45 and BGC823, and SP weakly inhibited cell growth of immortal normal gastric epithelial cells GES (Figure 2A).
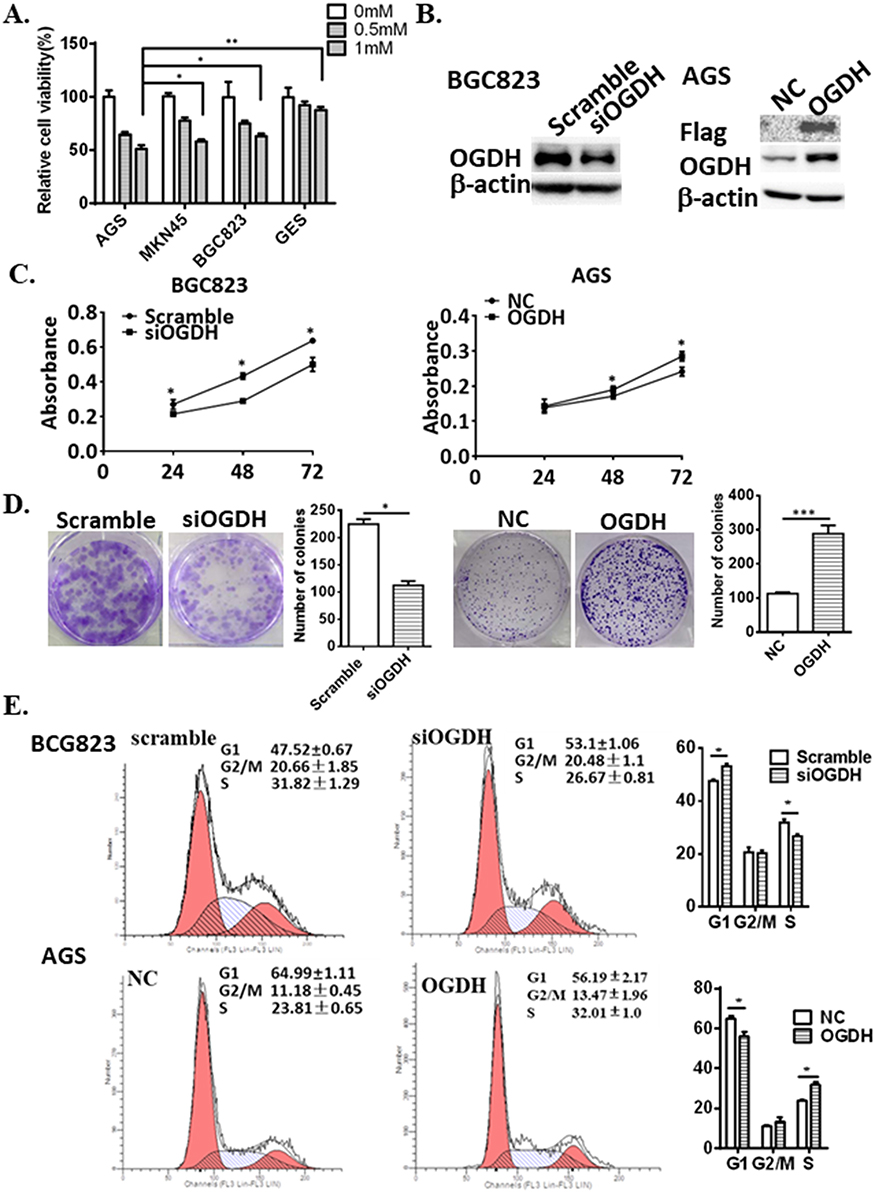 |
Figure 2 OGDH promotes GC cell growth in vitro. (A) Cell viability was determined by MTT assay after the treatment of SP in GC cells and GES cells. Values are means ± SEM from ≥3 independent experiments. Statistical significance was established using one-way ANOVA. *P<0.05, **P<0.01 vs AGS. (B) Western blot analysis assessed the expression of OGDH in BGC-823 cells transfected with OGDH siRNA and AGS cells infected with LV-OGDH. (C and D). MTT assay and colony formation assay determined the effects of OGDH modification on cell growth. The number of the individual cell colonies formed is expressed as the mean ± SEM. (E) The cell cycle is analyzed by flow cytometry. The cell cycle phases are expressed as the mean ± SEM. *represent Student’s t-test, *P<0.05, **P<0.01, ***P<0.001 vs control. |
To evaluate the potential functions of OGDH in regulating GC cell growth, we downregulated the expression of OGDH in BGC823 cells which had a high level of endogenous OGDH by siRNA transfection; and upregulated OGDH expression in AGS cells which had a relative low level of endogenous OGDH by lentivirus infection (LV-OGDH). The modification of OGDH expression was determined by Western blotting (Figure 2B). Cell proliferation was determined at 24, 48, and 72 h after seeding using an MTT assay. The proliferation of GC cells was significantly suppressed after silencing of endogenous OGDH and increased upon OGDH overexpression at each time point (Figure 2C). In colony formation assay, OGDH silencing decreased the number and size of GC cell colonies incubated after 14 days, while ectopic expression of OGDH had the opposite effects (Figure 2D). Disorder of cell cycle is one of the important reasons for the malignant increase of tumor cells. We analyzed the cell cycle of OGDH overexpressed AGS cells and OGDH silenced BGC823 cells by FACS. The results showed that knockdown OGDH resulted an arrest of GC cells at the G1 phase compared with the scramble siRNA control, and overexpression of OGDH caused a significant decrease of cells in the G1 phase and an increase in the S phase compared with the empty vector control (Figure 2E). These results indicate that OGDH might upregulated GC cell proliferation by accelerating the G1/S phase transition in cell cycle.
OGDH facilitates GC cell migration by regulating EMT transition
It has been recently reported that OGDHC inhibitor, (S)-2-[(2,6-dichlorobenzoyl) amino] succinic acid (AA6) inhibits breast cancer metastasis.15 To investigate the role of OGDH in GC cell migration, wound healing was used. It was observed that OGDH knockdown BGC823 cells migrated significantly slower than the control group, and overexpression of OGDH accelerated cell migration through the scratch wound (P<0.01, Figure 3A). To provide further support for the effect of OGDH on cell mobility, transwell assays was performed. Cells that migrated through the Matrigel matrix are presented in Figure 3B. When endogenous OGDH was downregulated, the number of cancer cells through the Matrigel decreased significantly compared with the control group, while OGDH overexpression had the opposite effect (P<0.01).
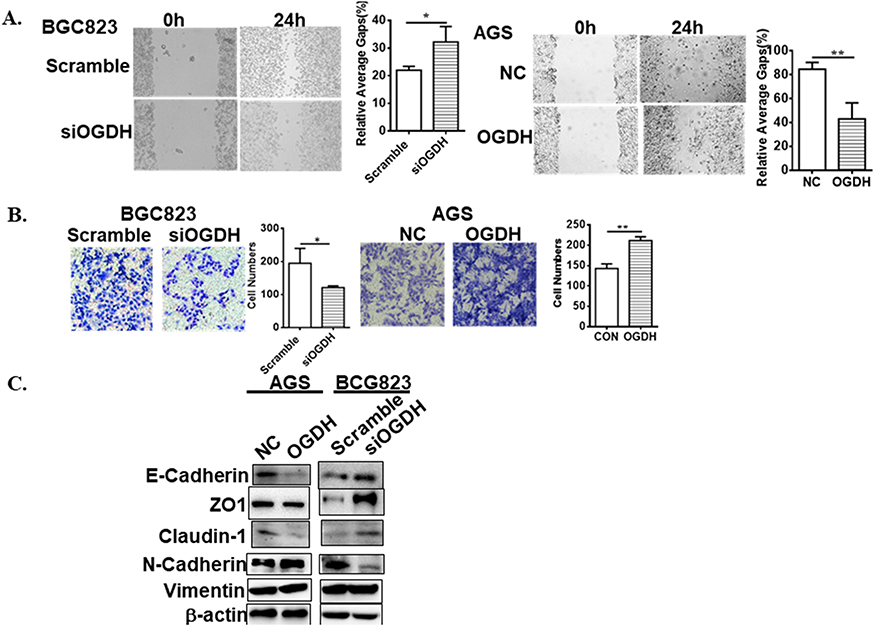 |
Figure 3 OGDH increases cell migration. (A) Wound healing assay. Representative images depicting BGC823 or AGS cells motility are shown. The graph on the right shows the relative average gap after 24 h scraping. (B) Transwell assay. Representative pictures shows GC cells invasiveness; the graphs represent migrated cells. Values are presented as mean ± SEM from 3 independent experiments. *represent Student’s t-test, *P<0.05, **P<0.01 vs control. (C) Western blotting detects the EMT markers. |
Epithelial-mesenchymal transition (EMT) is required for the distant metastasis of tumors and associated with tumor malignancy. We quantitated the expression levels of the EMT markers by Western blotting in OGDH overexpressing AGS cells and OGDH knockdown BGC823 cells. As shown in Figure 3C, the protein levels of E-Cadherin, claudin-1 and ZO-1 were significantly decreased in OGDH silenced BGC823 cells compared with control group, while the expression levels of N-cadherin and vimentin increased. The opposite outcomes were detected in OGDH overexpressing AGS cells.
OGDH enhances mitochondrial function
OGDHC contributes to adapt mitochondrial metabolism to bioenergetics requirements of cancer cells.4 To elucidate the functions of OGDH in mitochondrial functions of GC cells, we detected mitochondrial membrane potential (Δψm) by JC-1 staining, cellular ATP level and oxygen consumption rates (OCRs) in GC cells with a gain or loss of OGDH. The data showed that overexpression OGDH significantly upregulated the mitochondrial membrane potential (ΔΨm), increased intracellular ATP product and oxygen consumption rates (OCRs) (Figure 4A). In OGDH knockdown BGC823 cells, the mitochondrial function was suppressed with low membrane potential, ATP level and OCR (Figure 4B). ROS production is closely associated with mitochondrial function. Increased ROS levels can also activate anti-tumourigenic signaling resulting in oxidative stress induced-cancer cell death.17 To investigate the effects of OGDH on cellular redox status of GC cells, we detected the levels of ROS and NADP+/NADPH ratio. As shown, the levels of ROS and NADP+/NADPH ratio in OGDH overexpressed GC cells were much lower than the negative control (Figure 4C). OGDH knockdown exhibited the opposite effects in BGC823 cells (Figure 4D).
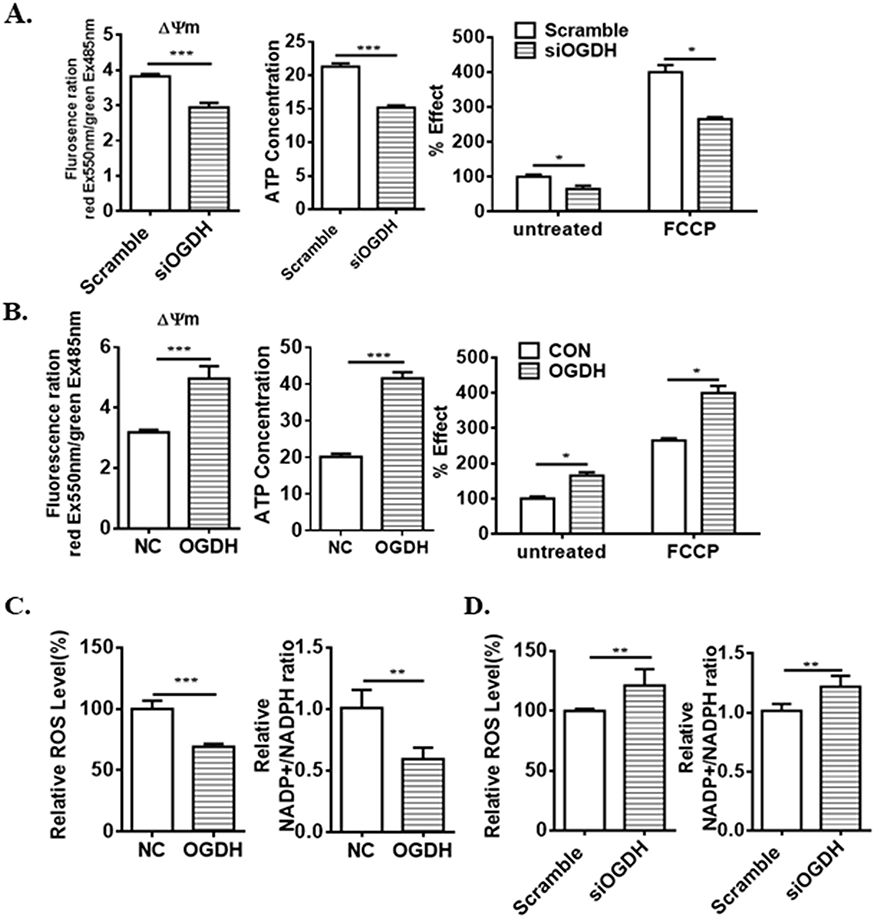 |
Figure 4 OGDH augments mitochondrial functions. (A) OGDH siRNA inhibits mitochondrial membrance potential (ΔΨm), intracellular ATP concentration and O2 consumption rate in AGS cells. (B) Ectopic expression of OGDH increases mitochondrial bioenergetics in BGC823 cells. (C) OGDH siRNA upregulates ROS level and NADP+/NADPH ratio. (D) The levels of ROS and NADP+/NADPH ratio are downregulated by OGDH overexpression. Values are presented as mean ± SEM from 3 independent cultures. *P<0.05, **P<0.01, ***P<0.001 vs. control (Student’s t-test). |
OGDH regulates Wnt/β-catenin signaling pathway
Accumulating evidence has shown that the abnormally high activation of the Wnt/β-catenin pathway is required for the initiation and progression of various tumors.18 We performed Western blotting to determine whether OGDH regulated the Wnt/β-catenin pathway in GC cells. As shown in Figure 5, overexpression of OGDH obviously up-regulated the expression levels of β-catenin, its downstream effectors Slug, TCF8/ZEB1, and its targets Cyclin D1, c-Myc and MMP9 in AGS cells. While OGDH knockdown significantly reduced their expression. These results suggested that OGDH might participate in the activation of Wnt/β-catenin pathway to promote GC cells growth and migration.
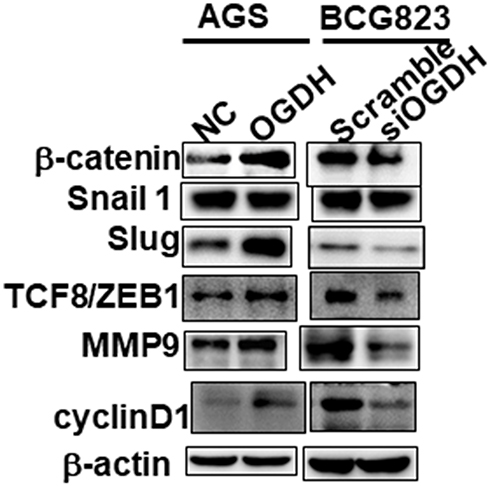 |
Figure 5 OGDH modulates β-catenin signaling. Representative Western blot analysis of relative protein levels of β-catenin, Snail1, Slug, ZEB1, MMP9 and cyclin D1 in AGS and BGC823 cells. |
OGDH modulates tumor growth in vivo
To verify the results of cell growth in vitro, we used a nude mouse xenograft mode to test the role of OGDH in tumorigenesis in vivo. OGDH overexpressing AGS cells and the control cells were injected into BALB/C nude mice, respectively. Compared with the control groups, the size and weight of the tumors were significantly higher in the OGDH overexpressing group (Figure 6).
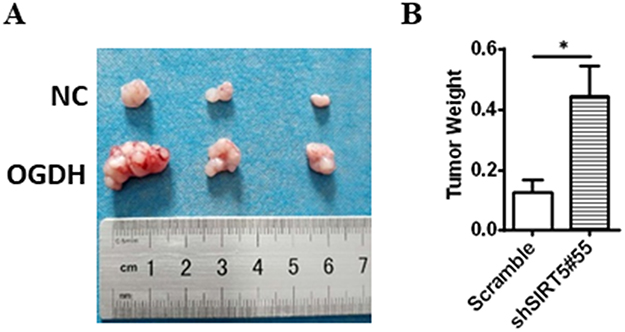 |
Figure 6 Xenograft nude mice. (A) Representative photographs of the dissected tumors from OGDH overexpressing group and NC group. (B) The graph shows the tumor weight. Values are presented as mean ± SEM (n=5). *P<0.05 vs. NC (Student’s t-test). |
Discussion
Since the “Warburg effect” was revealed decades ago, it has been suggested that defects in mitochondrial respiration is the underlying cause of cancer for a long time. However, more recent studies have shown that most cancers still remain mitochondrial function, oxidative respiration.19 Mitochondrial energy pathways are reprogrammed with a coexistence of the forward and reverse modes of the TCA cycle to better utilization of available fuels for the high bioernergetic and biosynthetic requirements of cancer cells. OGDHC activity is essential for the forward TCA cycle and the ETC chain. Vatrient et al reported that HIF1 reduced the activity of OGDHC by mediating degradation of OGDH splice variant 2 to drive the reductive carboxylation of 2-OG in tumor cells.4 Silencing OGDH prevent the production of sufficient levels of NADH, ultimately preventing NADPH-dependent IDH2 to reduce 2-OG.20 The striking range of dependencies OGDHC are associated to specific cell types and metabolic manner.13,16 We observed that OGDH expression was upregulated in GC tissues and cells, and positively regulated cell growth and migration. Most interesting, OGDH silencing reduced mitochondrial bioenergetics, while OGDH overexpression had the opposite effect in GC cells. The data suggests that the upregulation of OGDH might facilitate the forward TCA cycle to satisfy the requirement for the rapid growth of GC cells. A fine-tuning of OGDHC activity is required to balance 2-OG fate in both energetic and anabolic pathways. After glucose, glutamine is the most rapidly consumed nutrient by many human cancer cell lines to produce high levels of 2-OG.21 Therefore, the future study of the relationship between glutamine metabolism and OGDHC will be needed to understand the biochemical regulation of OGDHC in GC cells.
Under pathophysiological conditions, mitochondrial ROS contributes to the initiation and amplification of cancer.22 Much higher ROS levels in cancer cells than normal cells are connected with energy metabolism, but excessive mitochondrial ROS may induce cell death in tumors.23 OGDHC can both sense and generate ROS.24 In response to NADH accumulation and increased 2-OG levels, the E3 subunit of OGDHC may be stimulated to generate H2O2.25 On the other hand, an increase in ROS levels may decrease OGDHC function to form a feedback mechanism.26 NADPH has an important role in maintaining cellular redox balance of cancer cell. OGDHC maintain a low NAD+/NADH ratio, which in turn supports NADPH for reductive carboxylation of 2-OG.27 We demonstrated that OGDH played an important role in the interdependent homeostasis of ROS and NADPH in GC cells, that ROS production and NADP+/NADPH ratio were significantly reduced following OGDH overexpression.
Epithelial‑mesenchymal transition (EMT) is required for the invasion and distant metastasis of tumors.28 It has been found that many metabolic genes were upregulated upon induction of EMT, involving glycolysis, the TCA cycle and glutamine metabolism.29 On the other hand, recent evidence also suggests that the link between EMT and metabolism is mutual, and in some circumstances, alterations of metabolism can drive EMT. The silencing of FBP1 favours EMT in gastric cells in vitro.30 EMT also is a key signature of tumours harbouring mutations in the TCA cycle enzymes FH, SDH and IDH.31 OGDHC inhibitor AA6 inhibits breast cancer-associated metastasis by regulating 2-OG-dependent TET-miR200-Zeb1/CtBP1-MMP3 axis.15 We found that OGDH regulated the expressions of Wnt signaling pathway downstream effector β-catenin and transcription factors Slug and TCF8/ZEB1. Traditionally implicated, β-catenin activates E-cadherin transcriptional repressors such as Snail (SNAI1), Slug (SNAI2) and ZEB-1 to promoting EMT in various tumors.32 β-catenin also has an important role in the maintenance of mitochondrial homeostasis, regulating ATP production via the tricarboxylic acid cycle, OXPHOS, and fatty acid oxidation. Our results suggest specific metabolic alterations lead to the activation of Wnt/β-catenin signaling and EMT transcript factors. However, the mechanism underlining mitochondrial metabolism and Wnt/β-catenin signaling need to be further elucidated.
Our study reveals that OGDH contributes to the progression of GC by augmenting mitochondrial bioenergetics and maintaining cellular redox status to satisfy the fast growth and invasion of GC cells. However, the effects of OGDH on remodeling cancer metabolism and the molecular mechanisms underpinning growth and migration still need further studies. And more evidences are required to explore the possibility of OGDH as an indicator of the diagnosis and prognosis of GC patients.
Ethics
Patients and GC samples: the patient consent was written informed consent, and that this was conducted in accordance with the Declaration of Helsinki. The xenograft experiments were approved by the Fourth Military Medical University.
Abbreviations
GC, gastric cancer; OGDH, 2-oxoglutarate dehydrogenase; SP, succinyl phosphonate; ROS, reactive oxygen species; OXPHOS, oxidative phosphorylation; EMT, epithelial-to-mesenchymal transition; MMP9, matrix metalloproteinases 9.
Acknowledgments
This work was supported by the National Natural Science Foundation of China Project (81471401) and the Opening Foundation of State Key Laboratory of Cancer Biology, National Clinical Research Center for Digestive Diseases and Xijing Hospital of Digestive Diseases, Fourth Military Medical University.
Disclosure
The authors report no conflicts of interest in this work.
References
1. Torre LA, Bray F, Siegel RL, Ferlay J, Lortet-Tieulent J, Jemal A. Global cancer statistics, 2012. CA Cancer J Clin. 2015;65(2):87–108.
2. Xiao S, Zhou L. Gastric cancer: metabolic and metabolomics perspectives (Review). Int J Oncol. 2017;51(1):5–17.
3. Ali Z, Deng Y, Tang Y, Zheng S, Ma N, He N. Epigenetic deregulations in gastric cancer. J Nanosci Nanotechnol. 2013;13(1):40–51.
4. Vatrinet R, Leone G, De Luise M, et al. The alpha-ketoglutarate dehydrogenase complex in cancer metabolic plasticity. Cancer Metab. 2017;5:3.
5. Tsai CK, Yeh TS, Wu RC, et al. Metabolomic alterations and chromosomal instability status in gastric cancer. World J Gastroenterol. 2018;24(33):3760–3769.
6. Hosios AM, Hecht VC, Danai LV, et al. Amino acids rather than glucose account for the majority of cell mass in proliferating mammalian cells. Dev Cell. 2016;36(5):540–549.
7. Reed LJ, Hackert ML. Structure-function relationships in dihydrolipoamide acyltransferases. J Biol Chem. 1990;265(16):8971–8974.
8. Nemeria NS, Gerfen G, Nareddy PR, et al. The mitochondrial 2-oxoadipate and 2-oxoglutarate dehydrogenase complexes share their E2 and E3 components for their function and both generate reactive oxygen species. Free Radic Biol Med. 2018;115:136–145.
9. Chen H, Lee LS, Li G, Tsao SW, Chiu JF. Upregulation of glycolysis and oxidative phosphorylation in benzo[alpha]pyrene and arsenic-induced rat lung epithelial transformed cells. Oncotarget. 2016;7(26):40674–40689.
10. Grimm M, Calgeer B, Teriete P, Biegner T, Munz A, Reinert S. Targeting thiamine-dependent enzymes for metabolic therapies in oral squamous cell carcinoma? Clin Transl Oncol. 2016;18(2):196–205.
11. Snezhkina AV, Krasnov GS, Zaretsky AR, et al. Differential expression of alternatively spliced transcripts related to energy metabolism in colorectal cancer. BMC Genomics. 2016;17(Suppl 14):1011.
12. Jo YS, Oh HR, Kim MS, Yoo NJ, Lee SH. Frameshift mutations of OGDH, PPAT and PCCA genes in gastric and colorectal cancers. Neoplasma. 2016;63(5):681–686.
13. Allen EL, Ulanet DB, Pirman D, et al. Differential aspartate usage identifies a subset of cancer cells particularly dependent on OGDH. Cell Rep. 2016;17(3):876–890.
14. Ilic N, Birsoy K, Aguirre AJ, et al. PIK3CA mutant tumors depend on oxoglutarate dehydrogenase. Proc Natl Acad Sci U S A. 2017;114(17):E3434–E3443. doi:10.1073/pnas.1617922114
15. Atlante S, Visintin A, Marini E, et al. alpha-ketoglutarate dehydrogenase inhibition counteracts breast cancer-associated lung metastasis. Cell Death Dis. 2018;9(7):756. doi:10.1038/s41419-018-1111-y
16. Bunik VI, Mkrtchyan G, Grabarska A, et al. Inhibition of mitochondrial 2-oxoglutarate dehydrogenase impairs viability of cancer cells in a cell-specific metabolism-dependent manner. Oncotarget. 2016;7(18):26400–26421. doi:10.18632/oncotarget.8387
17. Moloney JN, Cotter TG. ROS signalling in the biology of cancer. Semin Cell Dev Biol. 2018;80:50–64. doi:10.1016/j.semcdb.2017.05.023
18. Clevers H. Wnt/beta-catenin signaling in development and disease. Cell. 2006;127(3):469–480. doi:10.1016/j.cell.2006.10.018
19. Gasparre G, Rossignol R, Sonveaux P. Mitochondria in cancer. Biochim Biophys Acta Bioenerg. 2017;1858(8):553–555. doi:10.1016/j.bbabio.2017.05.004
20. Mullen AR, Wheaton WW, Jin ES, et al. Reductive carboxylation supports growth in tumour cells with defective mitochondria. Nature. 2011;481(7381):385–388. doi:10.1038/nature10642
21. Li T, Le A. Glutamine metabolism in cancer. Adv Exp Med Biol. 2018;1063:13–32. doi:10.1007/978-3-319-77736-8_2
22. Sabharwal SS, Schumacker PT. Mitochondrial ROS in cancer: initiators, amplifiers or an Achilles’ heel? Nat Rev Cancer. 2014;14(11):709–721. doi:10.1038/nrc3803
23. Kang SW, Lee S, Lee EK. ROS and energy metabolism in cancer cells: alliance for fast growth. Arch Pharm Res. 2015;38(3):338–345. doi:10.1007/s12272-015-0550-6
24. McLain AL, Szweda PA, Szweda LI. alpha-Ketoglutarate dehydrogenase: a mitochondrial redox sensor. Free Radic Res. 2011;45(1):29–36. doi:10.3109/10715762.2010.534163
25. Tretter L, Adam-Vizi V. Generation of reactive oxygen species in the reaction catalyzed by alpha-ketoglutarate dehydrogenase. J Neurosci. 2004;24(36):7771–7778. doi:10.1523/JNEUROSCI.1842-04.2004
26. Applegate MA, Humphries KM, Szweda LI. Reversible inhibition of alpha-ketoglutarate dehydrogenase by hydrogen peroxide: glutathionylation and protection of lipoic acid. Biochemistry. 2008;47(1):473–478. doi:10.1021/bi7017464
27. Mullen AR, Hu Z, Shi X, et al. Oxidation of alpha-ketoglutarate is required for reductive carboxylation in cancer cells with mitochondrial defects. Cell Rep. 2014;7(5):1679–1690. doi:10.1016/j.celrep.2014.04.037
28. Ye X, Weinberg RA. Epithelial-mesenchymal plasticity: a central regulator of cancer progression. Trends Cell Biol. 2015;25(11):675–686. doi:10.1016/j.tcb.2015.07.012
29. Porporato PE, Payen VL, Baselet B, Sonveaux P. Metabolic changes associated with tumor metastasis, part 2: mitochondria, lipid and amino acid metabolism. Cell Mol Life Sci. 2016;73(7):1349–1363. doi:10.1007/s00018-015-2100-2
30. Li J, Wang Y, Li QG, et al. Downregulation of FBP1 promotes tumor metastasis and indicates poor prognosis in gastric cancer via regulating epithelial-mesenchymal transition. PLoS One. 2016;11(12):e0167857.
31. Li M, Bu X, Cai B, et al. Biological role of metabolic reprogramming of cancer cells during epithelialmesenchymal transition (Review). Oncol Rep. 2019;41(2):727–741. doi:10.3892/or.2018.6882
32. Krishnamurthy N, Kurzrock R. Targeting the Wnt/beta-catenin pathway in cancer: update on effectors and inhibitors. Cancer Treat Rev. 2018;62:50–60. doi:10.1016/j.ctrv.2017.11.002
 © 2019 The Author(s). This work is published and licensed by Dove Medical Press Limited. The full terms of this license are available at https://www.dovepress.com/terms.php and incorporate the Creative Commons Attribution - Non Commercial (unported, v3.0) License.
By accessing the work you hereby accept the Terms. Non-commercial uses of the work are permitted without any further permission from Dove Medical Press Limited, provided the work is properly attributed. For permission for commercial use of this work, please see paragraphs 4.2 and 5 of our Terms.
© 2019 The Author(s). This work is published and licensed by Dove Medical Press Limited. The full terms of this license are available at https://www.dovepress.com/terms.php and incorporate the Creative Commons Attribution - Non Commercial (unported, v3.0) License.
By accessing the work you hereby accept the Terms. Non-commercial uses of the work are permitted without any further permission from Dove Medical Press Limited, provided the work is properly attributed. For permission for commercial use of this work, please see paragraphs 4.2 and 5 of our Terms.