")
Back to Journals » OncoTargets and Therapy » Volume 12
ODC1 promotes proliferation and mobility via the AKT/GSK3β/β-catenin pathway and modulation of acidotic microenvironment in human hepatocellular carcinoma
Authors Ye Z , Zeng Z , Shen Y, Yang Q, Chen D, Chen Z, Shen S
Received 16 December 2018
Accepted for publication 29 March 2019
Published 27 May 2019 Volume 2019:12 Pages 4081—4092
DOI https://doi.org/10.2147/OTT.S198341
Checked for plagiarism Yes
Review by Single anonymous peer review
Peer reviewer comments 2
Editor who approved publication: Dr Sanjeev K. Srivastava
Zi Ye,1 Zhirui Zeng,2,3 Yiyi Shen,4 Qiang Yang,1 Duidui Chen,1 Zubing Chen,1 Shiqiang Shen1
1Department of General Surgery, Renmin Hospital of Wuhan University, Wuhan, Hubei 430060, People’s Republic of China; 2Guizhou Provincial Key Laboratory of Pathogenesis & Drug Research on Common Chronic Diseases, Guiyang, Guizhou 550009, People’s Republic of China; 3Department of Physiology, School of Basic Medicine, Guizhou Medical University, Guiyang, Guizhou 550009, People’s Republic of China; 4Department of Liver-Biliary Surgery, The Affiliated Hospital of Guizhou Medical University, Guiyang, Guizhou, 550009, People’s Republic of China
Purpose: Ornithine decarboxylase 1 (ODC1)–an oncogene involved in the biosynthesis of polyamines–is commonly upregulated and associated with poor prognosis in numerous cancers. However, the role and mechanism of ODC1 in hepatocellular carcinoma (HCC) remains unclear. The aim of the present study was to investigate the role of ODC1 in HCC and clarify the latent molecular mechanisms.
Material and methods: We used samples obtained from The Cancer Genome Atlas. The expression of ODC1 was also assessed in our additional HCC samples and HCC cell lines. The roles of ODC1 in HCC cell proliferation, migration and invasion in vitro were investigated using the cell-counting kit-8 assay, 5-ethynyl-2´-deoxyuridine assay, colony formation assay, flow cytometry, wound healing assay and transwell assay, respectively. The effect of ODC1 on HCC cell proliferation in vivo was investigated by constructing a xenotransplanted tumor model in nude mice. Quantitative real-time polymerase chain and western blotting were used to detect the expression levels of ODC1 in mimetic hypoxia, nutrient depleted, and acidotic microenvironment. The relationships between ODC1, the AKT/GSK3β/β-catenin pathway, and acidotic microenvironment were further investigated through western blotting, immunohistochemical staining, and immunofluorescence.
Results: ODC1 was upregulated in HCC tissues and cell lines, and co-expressed with KI67 and PCNA (P<0.05). A decrease in the expression of ODC1 inhibits proliferation, migration, invasion, and induces cell cycle arrest in HCC cell lines in vitro, while suppressing HCC cell proliferation in vivo (P<0.05). Furthermore, the expression of ODC1 was increased in the mimetic acidotic microenvironment, while the interference with the expression of ODC1 reversed the effect of the acidotic microenvironment through regulation of AKT/GSK3β/β-catenin and related downstream proteins.
Conclusion: ODC1 is an unfavorable gene in HCC patients,promoting HCC cell proliferation, migration and invasion via the AKT/GSK3β/β-catenin pathway and modulation of the acidotic microenvironment.
Keywords: hepatocellular carcinoma, ornithine decarboxylase 1, acidotic, β-catenin
Introduction
Primary liver cancer is a common and lethal type of cancer worldwide. It is an aggressive tumor frequently complicated with chronic liver disease and cirrhosis. Primary liver cancer, mostly hepatocellular carcinnoma(HCC), ranks second among cancers with the highest mortality rate in male patients.1,2 The treatment of HCC has clearly improved in the previous decades. However, the overall survival of patients with HCC remains unsatisfactory. Occurrence of invasion in the early stage of disease is the main barrier to improving patient survival in the clinical setting. However, the mechanism of HCC progression has not been fully elucidated.
An emerging concept is that the maintenance and expansion of tumors also strongly depend on external signals from their microenvironment. In most solid tumors, the vasculature of the tumor is always inadequate to meet the demands of the growing mass, leading to hypoxic, nutrient-depleted and acidotic regions in the tumor.3 The effects of the microenvironment on the reprogramming of cancer cell metabolism, migration and metastasis have been widely studied. Jin et al4 found that hypoxia promotes the progression of colorectal cancer by inducing the up-regulation of hypoxia-inducible factor 1-alpha and glucose metabolism reprogramming. Golias T5 demonstrated that hypoxia promotes cancer progression through the control of glucose metabolism via the regulation of pyruvate dehydrogenase. Zhao et al6 found that nutrient-depleted microenvironment caused by radiation plays a significant role in enhancing the ability of the glioma cell line U251 to metastasize via regulation of the Sp1 transcription factor. In addition, Sauvant et al7 found that the acidotic microenvironment induces multidrug resistance in rat prostate AT1 cancer cells in vitro and in vivo by increasing the activity of p-glycoprotein via activation of p38.7
Ornithine decarboxylase 1 (ODC1) is the first rate-limiting enzyme in the polyamine metabolism pathway, which catalyzes the decarboxylation and conversion of ornithine to putrescine.8 High expression of ODC1 is significantly correlated with poor survival in a series of cancers, such as breast,9 prostat,10 colorectal,11 and endometrial.12 ODC1 contributes to the risk of gastric cancer through modulation of the biosynthesis of polyamine or interaction between isoflavones and NAD(P)H quinone dehydrogenase 1, ornithine decarboxylase antizyme 2, and adenosylmethionine decarboxylase 1.13 In addition,it is a critical determinant of MYCN oncogenesis and a therapeutic target in neuroblastoma.14 Moreover,it has been widely reported that aberrant polyamine metabolism is associated with the incidence of cancer via regulation of signaling pathways, such as the PTEN-PI3K-mTOR complex 1, Wnt-β-catenin signaling and RAS pathways.15 However, information regarding the role and molecular mechanism of ODC1 in HCC is currently limited.
The objective of the present study was to investigate the role of ODC1 in HCC and clarify the latent molecular mechanisms. We showed this study is useful for HCC diagnosis and treatment in future.
Materials and methods
Analysis of the cancer genome atlas (TCGA) data of HCC
Published mRNA expression data for 50 normal liver tissues and 377 HCC specimens were downloaded from the TCGA (
Clinical specimens
Twenty-seven paired HCC tissues and corresponding adjacent healthy tissues were obtained from Wuhan University Renmin Hospital, Wuhan, China. The specimens were reviewed by a pathologist and histologically confirmed to be HCC through histopathological evaluation. The study was approved by the Ethics Committee of Wuhan University Renmin Hospital and performed in accordance with the tenets of the Declaration of Helsinki. All patients, whose tissues were used in this research, provided written informed consent.
Cell culture
Human HCC cell line HepG2 was purchased from the American Type Culture Collection. Human HCC cell line SMMC-7721 and normal liver cell line LO2 were purchased from the Shanghai Institute of Cell Biology of Chinese Academy of Sciences, Shanghai, China. Cells were cultured in Dulbecco’s Modified Eagle’s Medium (DMEM; Invitrogen, Carlsbad, CA, USA) supplemented with 100 U/mL penicillin and 100 µg/mL streptomycin (Invitrogen, Carlsbad, CA, USA) and 10% fetal bovine serum (FBS; Gibco, Carlsbad, CA, USA) at 37°C with 5% CO2.
Transfection
Lipofectamine 2,000 (Invitrogen, Carlsbad, CA, USA) was used according to the protocol provided by the manufacturer. Small interfering RNA (siRNA) for ODC1 was purchased from GeneCopoeia, Inc. (Wuhan, China).The sequences are shown below:
Negative control sense: UUCUCCGAACGUGUCACGUTT
Antisense: ACGUGACACGUUCGGAGAATT
ODC1 siRNA sense: GGUUGGUUUCAGCAUGUAUTT
Antisense: AUACAUGCUGAAACCAACCTT
Cell counting kit-8 (CCK-8) assay
Cells were plated onto 96-well plates (1,000 cells per well) and cultured for 24, 48 and 72 h. Subsequently, 10 µl CCK8 solution (BosterBiological Technology, Ltd.,Wuhan,China) were added to each well and incubation continued at 37°C for 2 h. The optical density value of each well was detected at a wavelength of 450 nm.
5-ethynyl-2’-deoxyuridine (EdU) incorporation assay
Cell proliferation was detected using a Cell-Light EdU Apollo 555 In Vitro Kit (Beyotime Biotechnology, Shanghai, China) according to the protocol provided by the manufacturer. In brief, HCC cell lines were plated in six-well plates. After transfection, EdU was added into each well and incubated for 2 h. After washing twice with phosphate-buffered saline(PBS), the cells were fixed with 4% paraformaldehyde for 30 min at room temperature. Subsequently, cells were incubated with Apollo staining reaction liquid for 30 min to detect the positive cells. The cells were stained again with 4',6-diamidino-2-phenylindole (DAPI) and immunofluorescence was observed using a fluorescence microscope.
Colony formation assay
SMMC-7721 and HepG2 cells were seeded at a density of 3.0×10³ cells/well in a normal six-well plate for transfection with negative control cells. After 7 days, the colonies were fixed with paraformaldehyde and stained using crystal violet. The number of grown colonies was counted and inspected under an optical microscope.
Wound-healing assay
Cells were seeded insix-well plates and incubated for 24 h. Subsequently,the cell monolayer was scraped using a 200-μL sterile pipette tip to create a central linear wound. The migration of cells into the denuded areas in the scraped region was recorded and photographed 72 h after the creation of the wound using an optical microscope. The wound at 0 h was considered 100% of the average gap.
Transwell miagration and invasion assay
A total of 2×10⁴ SMMC-7721 and 5×10⁴ HepG2 cells were resuspended in serum-free DMEM after transfection with siRNA and placed in the top portion of a transwell chamber with 8-μm pores with or without Matrigel (Becton-Dickinson Labware, Bedford, MA, USA). The lower portion of the chamber contained 10% FBS as a chemoattractant. The chambers were cultured at 37°C in 5% CO2 for 24 h. After removing the non-migrating cells on the top of the membrane using cotton swabs, cells that migrated to the bottom of the insert were fixed with paraformaldehyde, stained with 0.2% crystal violet, and counted and photographed under magnification (×100) using an optical microscope equipped with a digital camera. Five random fields were analyzed in each chamber.
Apoptosis assay
Cell apoptosis was assessed using an Annexin V/PI apoptosis kit (BD Biosciences, San Jose, CA, USA), according tothe protocol provided by the manufacturer. Trypsinized cells were centrifuged at 500× g at 4°C for 5 min, and the supernatant was discarded. The pelleted cells were resuspended in 100 μL binding buffer and incubated with 5 μL fluorochrome-conjugated Annexin-V and 5 μL propidium iodide (PI) in the dark at room temperature for 15 min. The cells were washed again and resuspended in binding buffer to remove unbound moieties and analyzed through flow cytometry.
Flow cytometry
SMMC-7721 and HepG2 cells were seeded in six-well plates after transfection. Cells were harvested using DMEM without FBS for cell cycle synchronization. After harvested for 24 h, culture medium was changed and cells were treatment with DMEM contain 10%FBS to proliferate 48 h.The cells were washed with PBS twice and suspended in −20℃PBS containing 70% ethyl alcohol for 24 h. Subsequently, the cells were stained with PI/RNase staining solution in the dark for 30 min at 37° C, and analyzed using flow cytometry.
Animal experiments
All animal procedures were approved by the Animal Research Ethics Committee of People’s Hospital affiliated to Wuhan University. Six-week-old female BLBA/c nude mice were purchased from Beijing Huafukang Biotechnology, Beijing, China. Briefly, 2×10⁷ si-ODC1 HepG2 cells or negative control HepG2 cells were subcutaneously injected into the flanks of nude mice. Each group contained five mice. The tumor volume was monitored for 21 days with 3-day intervals by measuring the width and length of each tumor. The mice were sacrificed on day 21 and the size of each tumor was determined.
Western blotting
Samples were homogenized in a RIPA buffer (Servicebio, Biological Technology, Ltd.,Wuhan, China) containing phenylmethylsulfonyl fluoride for the total protein extraction assay according to the instructions provided by the manufacturer. An equal amount of protein (25 μg) was loaded in each lane and separated using 10% sodium dodecyl sulfate polyacrylamide gel electrophoresis. After transfer to polyvinylidene difluoride membranes (Merck Millipore, Billerica, MA, USA), the membranes were blocked with 5% non-fat milk (Bio-Rad,Laboratories Inc., Hercules, CA, USA) at room temperature for 2 h and incubated overnight at 4°C with primary antibodies. The following primary antibodies were purchased from Proteintech (Wuhan, China):β-actin (60008–1-Ig), β-catenin (17565–1-AP), AKT (10176–2-AP), p-AKT(S473) (66444–1-Ig),E-cadherin (20874–1-AP), Vimentin (10366–1-AP), P21 (10355–1-AP), and CCNB2 (21644–1-AP) Of note, p-GSK3β (Ser9) (D85E12) was purchased from CST (USA). The membranes were washed and incubated in horseradish peroxidase-conjugated goat anti-mouse or goat anti-mouse or anti-rabbit immunoglobulin G secondary antibody. Protein bands were visualized using an ChemiDocTM XRS + with image LabTM Software (BIORAD, USA).
Real-time polymerase chain reaction (PCR)
Total RNA was extracted from cells using TRIzol (Yeasen, Shanghai, China) and transcript levels were detected via SYBR Green-based real-time PCR performed using the CFX Connect Real-Time System(Bio-rad, USA). Each sample was evaluated in triplicate and the control group was set as 1. The primer sequences used in this experiment were as follows:
ODC1forward primer: TTTACTGCCAAGGACATTCTGG
Reverse primer: GGAGAGCTTTTAACCACCTCAG
β-actin forward primer: CATGTACGTTGCTATCCAGGC
Reverse primer: CTCCTTAATGTCACGCACGAT.
Immunohistochemistry assay
Tumor tissues and adjacent healthy tissues were fixed with 4% paraformaldehyde, dehydrated, embedded in paraffin, and cut into 4-µm sections. The specimens were deparaffinized in xylene and rehydrated using a series of graded alcohols. After restoration using sodium citrate and blocking using H2O2 and bovine serum albumin, the tissue sections were immunohistochemically stained with the primary antibody overnight at 4°C.Subsequently, the sections were incubated with horseradish peroxidase-conjugated secondary antibody for 1 h at room temperature, followed by incubation with the Cell and Tissue Staining HRP-DAB Kit(Boster Biological Technology, Ltd.,Wuhan,China) according to the instructions provided by the manufacturer.
Immunofluorescence staining
Cells cultured on coverslips were fixed with 4% paraformaldehyde at 4° C for 30 min. After fixation, cells were washed with PBS, permeabilized in 0.2% Triton X-100, and blocked with 5% bovine serum albumin. Cells were subsequently incubated with primary antibodies, followed by incubation with CY3 488-conjugated secondary antibodies. Slides were mounted in a medium containing 4ʹ,6-diamidino-2-phenylindole, and images were acquired using a microscope (Corning, New York, USA).
Statistical analysis
Data are representative of at least three independent experiments. The Student’s t-test was used for statistical analyses. A P<0.05 denoted statistical significance.
Results
ODC1 is highly expressed in HCC and correlated with poor prognosis
The mRNA expression of ODC1, KI67, and PCNA, and clinical information were extracted from the publicly available TCGA database to analyze the role of ODC1 in HCC. As shown in Figure 1A, we found that the expression of ODC1 was significantly elevated in HCC tissues compared with that observed in normal liver tissues (P<0.05). The HCC samples (ie, patients aged ≤80 years) were assigned in the high (n=176) or low (n=177) expression group based on the expression level of ODC1. The reuslts showed that the high expression group was associated with a lower 5 year survival rate (Figure 1B), demonstrating that high expression of ODC1 may be related to poor outcome. Furthermore, the Pearson correlation analysis (Figure 1C–D) showed that ODC1 was co-expressed with KI67 (R=0.40, P<0.01) and PCNA (R=0.34, P<0.01).
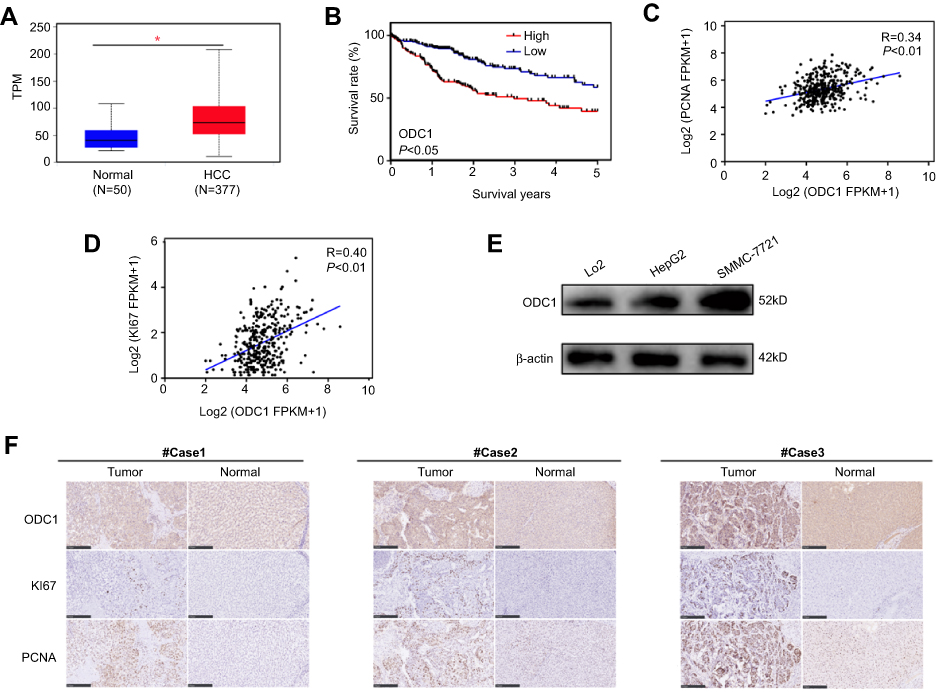 | Figure 1 ODC1 is highly expressed in HCC and correlated with poor prognosis. (A) The expression levels of ODC1 were analyzed in HCC samples and normal liver samples obtained from the TCGA database. (B) HCC cases were classified into the high or low expression group according to their levels of ODC1 expression. Kaplan–Meier survival analysis was performed to determine the relationship between the expression of ODC1 and clinical outcome. (C–D) Pearson correlation analysis was used to analyze the co-expression of ODC1 with KI67 or PCNA. (E) The expression levels of ODC1 in LO2, HepG2, and SMMC-7721 cells were determined through western blotting. (F) Three typical immunohistochemical results for ODC1, KI67, and PCNA are shown. *P<0.05. Abbreviations: ODC1, ornithine decarboxylase 1; HCC, hepatocellular carcinoma; TCGA, The Cancer Genome Atlas. |
Liver normal cell line LO2, HCC cell lines HepG2 and SMMC-7721, and 27 clinical samples were employed to determine the protein level of ODC1. Using western blotting, we found that the expression of ODC1 in HepG2 and SMMC-7721 cells was higher than that detected in LO2 cells (Figure 1E). Furthermore, we performed immunohistochemical analyses on the 27 pairs of human HCC specimens and their matched adjacent normal liver tissues. Increased levels of ODC1 protein were detected in 18 of the 27 (66.7%) HCC clinical samples.Moreover, ODC1 was co-expressed with KI67 and PCNA in these samples.Representative cases were shown in Figure 1F.
Inhibition of ODC1 suppressed HCC cell proliferation and colony formation, and induced cell cycle arrest
CCK8, EdU, and colony formation assays were performed to investigate the effects of ODC1 on HCC cell proliferation in vitro. We revealed that ODC1 markedly suppressed cell proliferation and colony formation in both SMMC-7721 and HepG2 cells (Figure 2A–C). The effect of ODC1 on cell apoptosis and cell cycle arrest was further studied. We found that inhibition of ODC1 slightly increased the number of Annexin V-positive cells in both types of cells (Figure 2D). In addition, we measured the cell cycle distribution. In SMMC-7721 cells, inhibition of ODC1 significantly increased the number of cells in the S phase, whereas it reduced the number of cells in the G1 phase. However, in HepG2 cells, suppression of ODC1 significantly increased the number of cells in the G2/M phase and decreased the number of cells in the G1 (Figure 2E). Furthermore, we found that inhibition of ODC1 significantly decreased the size of the tumor in vivo (Figure 2F). These results indicated that inhibition of ODC1 decreases the proliferation of HCC cells in vitro and in vivo.
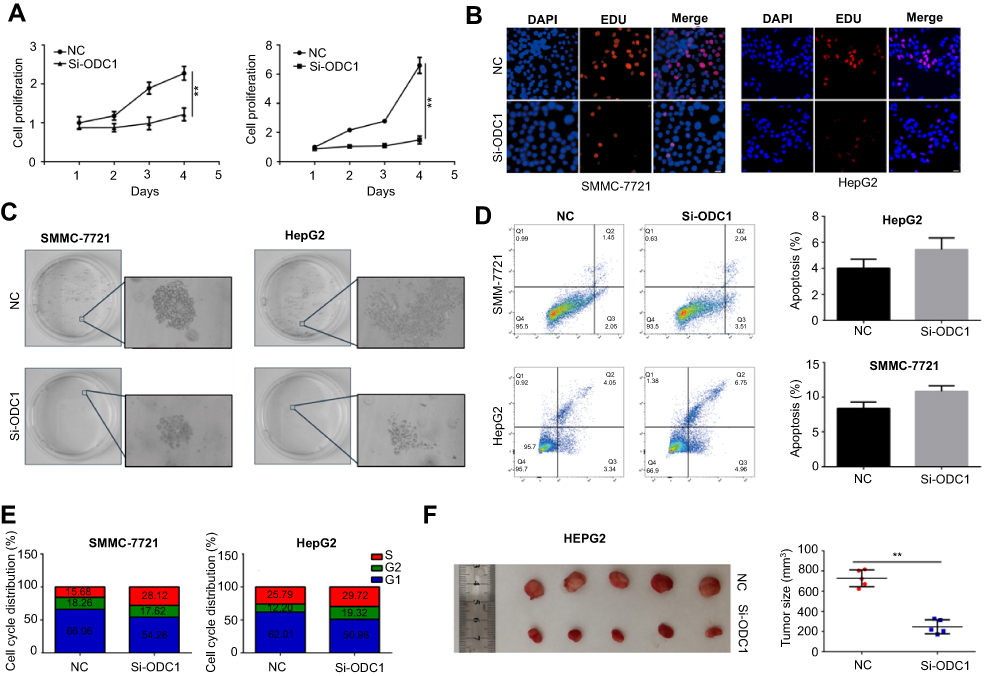 | Figure 2 Inhibition of ODC1 suppressed the proliferation and colony formation, and induced cell cycle arrest, but not apoptosis in HCC cells. (A) CCK-8 assays were performed to evaluate the cell viability of negative control and cells expressing low levels of ODC1. (B) EdU assays were used to determine the effect of ODC1 on the proliferation of HepG2 and SMMC-7721 cells. (C) Colony formation assays were performed to investigate the effect of ODC1 on the colony formation ability of HepG2 and SMMC-7721 cells. (D) The effect of ODC1 on apoptosis was analyzed through flow cytometry. (E) Cell cycle distributions after inhibition of ODC1 were detected through flow cytometry. (F) The effect of ODC1 on cell proliferation in vivo was evaluated using a nude mice model. **P<0.01. Abbreviations: ODC1, ornithine decarboxylase 1; HCC, hepatocellular carcinoma; CCK-8, Cell Counting Kit-8; EdU, 5-ethynyl-2’-deoxyuridine. |
Suppression of ODC1 decreased the migration, invasion, and epithelial-mesenchymal transition (EMT) phenotype in HCC cells
In addition, we performed wound-healing and transwell invasion assays to investigate the effects of ODC1 on the migration and invasion of HCC cells in vitro. The results of both assays indicated that the mobility capability of ODC1-silenced cells was weaker than that observed in the corresponding normal control (NC) cells (Figure 3A-B). Accumulating evidence has demonstrated that the EMT endows epithelial cells with their migratory and invasive abilities and functions in the metastatic process of numerous types of cancer, including HCC.Western blotting and immunofluorescence staining were performed to analyze the influence of ODC1 on EMT-related molecules(eg, including E-cadherin and vimentin), aiming to reveal the relationship between ODC1 and the cell EMT phenotype.We found that suppression of ODC1 resulted in higher levels of the epithelial marker E-cadherin and lower levels of the mesenchymal marker vimentin (Figure 3C–D). Collectively,these results indicated that suppression of ODC1 decreased the migration, invasion and EMT phenotype of HCC cells.
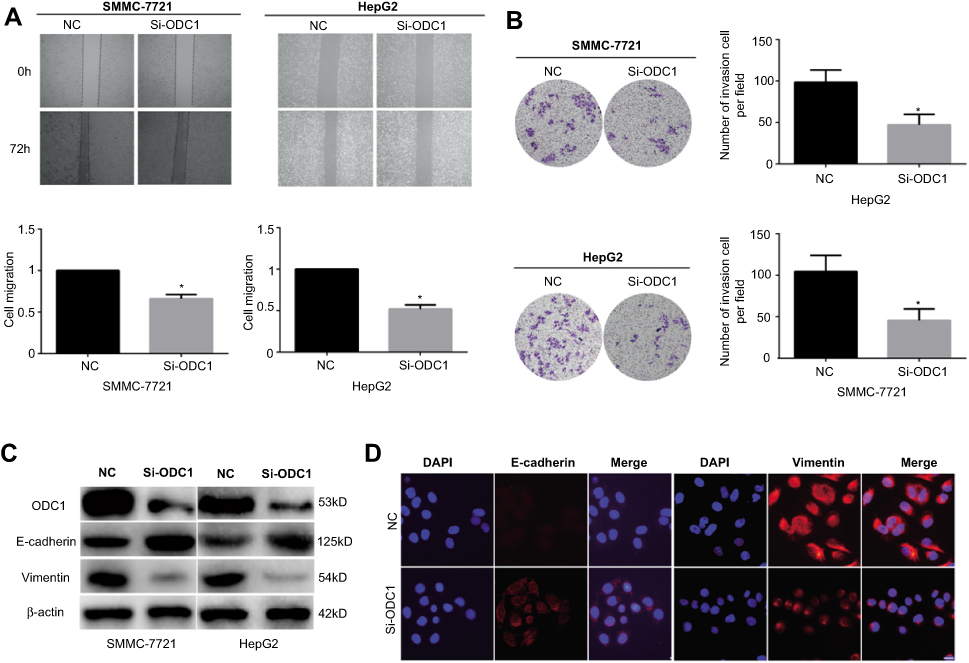 | Figure 3 Suppression of ODC1 decreased the migration, invasion, and EMT phenotype of HCC cells. (A) Wound-healing assay was used to determine the effect of ODC1 inhibition on the migration of SMMC-7721 and HepG2 cells. (B) Transwell assays were performed to evaluate the effect of ODC1 suppression on the invasion of SMMC-7721 and HepG2 cells. (C) Western blotting was used to measure the expression of ODC1, E-cadherin, and vimentin after inhibition of ODC1. (D) Immunofluorescence staining was used to evaluate the expression of E-cadherin and vimentin after inhibition of ODC1. *P<0.05. Abbreviations: ODC1, ornithine decarboxylase 1; HCC, hepatocellular carcinoma; EMT, epithelial-mesenchymal transition. |
ODC1 was upregulated in the mimetic acidotic microenvironment
Pervious studies have shown that the expression of metabolism-related enzymes is closely related to the tumor microenvironment. The expression levels of ODC1 mRNA and protein were measured in mimetic hypoxia, nutrient-depleted, and acidotic microenvironments using reverse-transcription PCR (RT-PCR) and western blotting to identify changes induced under these conditions. Initially, we cultured HCC cells in a 1%O2 microenvironment to simulate hypoxia and showed that this condition did not significantly influence the expression levels of ODC1 mRNA and protein (Figure 4A–B). Similarly, we cultured HCC cells in culture medium contain 1% FBS to simulate nutrient depletion and found that this condition did not significantly influence the expression levels of ODC1 mRNA and protein (Figure 4C–D). Furthermore, a previous study showed that the average concentration of extracellular lactic acid in most tumor cells was 10 mM.16 Therefore, we treated HCC cells with 10mM lactate to simulate the acidotic microenvironment and found that both the transcriptional and protein expression levels of ODC1 was upregulated (Figure 4E–F).
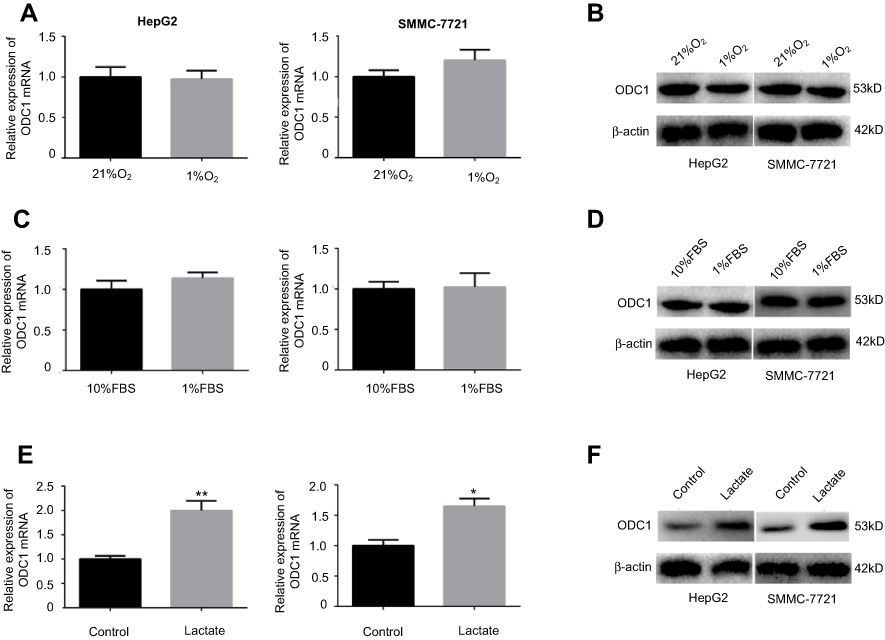 | Figure 4 ODC1 was up-regulated in the mimetic acidotic microenvironment. (A–B) HepG2 and SMMC-7721 cells were cultured in 21% O2 and 1% O2 environments. The mRNA and protein expression levels of ODC1 were detected through qRT-PCR and western blotting. (C–D) HepG2 and SMMC-7721 cells were cultured in 10% FBS and 1% FBS environments. The mRNA and protein expression levels of ODC1 were detected through qRT-PCR and western blotting. (E–F) HepG2 and SMMC-7721 cells were cultured in environments with or without 10 mM lactate. The mRNA and protein expression levels of ODC1 were detected through qRT-PCR and western blotting. *P<0.05; **P<0.01. Abbreviations: ODC1, ornithine decarboxylase 1; HCC, hepatocellular carcinoma; qRT-PCR, quantitativereverse-transcription PCR; FBS, fetal bovine serum. |
Interference with the expression of ODC1 reversed the effect of the acidotic microenvironment on the proliferation and migration of HCC cells
CCK8 and EdU assays were performed to identify the role of ODC1 in the proliferation of HCC cells under the mimetic acidotic microenvironment. We found that this condition stimulated the proliferation of HCC cells, and interference with the expression of ODC1 reversed this effect (Figure 5A–B). Similarly, using the wound-healing assay, we found that the acidotic microenvironment stimulated the migration of HCC cells,and inhibition of ODC1 decreased this effect(Figure 5C). Collectively, these results revealed that ODC1 promotes the proliferation and migration of HCC cells under the mimetic acidotic microenvironment.
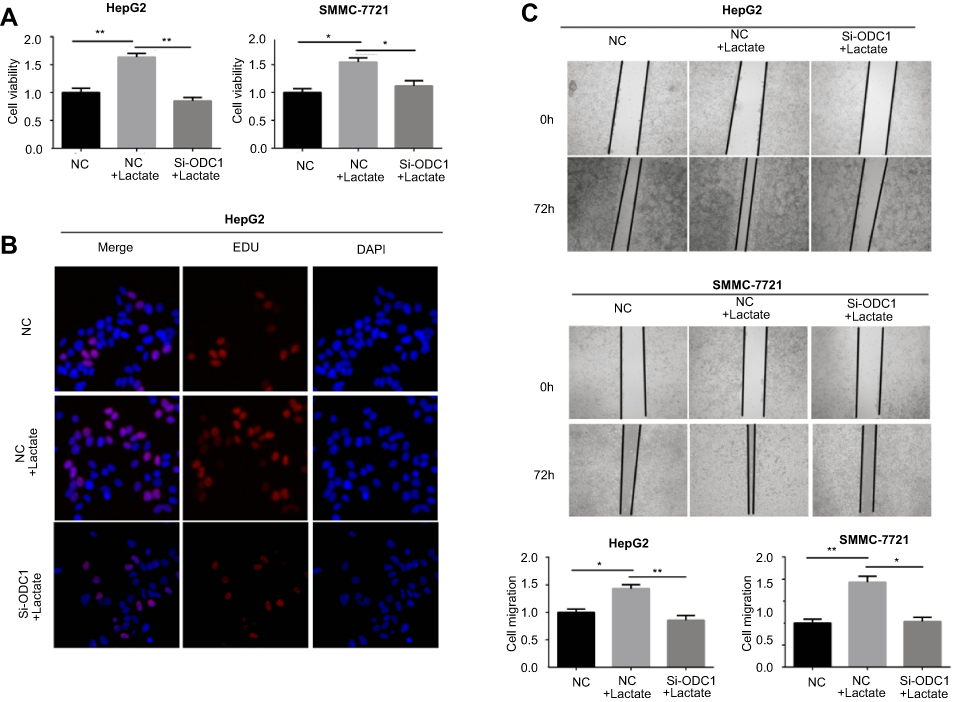 | Figure 5 Interference with the expression of ODC1 reversed the effect of the acidotic microenvironment on the proliferation and migration of HCC cells. (A) CCK-8 assay was performed to detect the viability of NC and si-ODC1 cells after treatment with or without 10 mM lactate for 48 h. (B) EdU assay was used to detect rapid proliferation in NC and si-ODC1 cells after treatment with or without 10 mM lactate. (C) Wound-healing assay was performed to detect the migration of NC and si-ODC1 cells after treatment with or without 10 mM lactate for 72 h. *P<0.05; **P<0.01. Abbreviations: ODC1, ornithine decarboxylase 1; CCK-8, Cell Counting Kit-8; NC, normal control group; Si-ODC1, ODC1 siRNA treatment group; EdU, 5-ethynyl-2´-deoxyuridine. |
ODC1 linked to the acidotic microenvironment and the AKT/GSK3β/β-catenin pathway
Considering the role of ODC1 as the first rate-limiting enzyme in the metabolism pathway of polyamines, numerous studies have investigated the effect of its inhibition on the levels of polyamines in the cells. AKT has been implicated in a series of cellular processes, such as cell survival, growth, and migration. It has been reported that a high level of polyamines activates AKT,17,18 whereas inhibition of polyamine metabolism using a polyamine derivative may decrease the activity of the AKT pathway.19 Therefore, we initially examined whether inhibition of ODC1 affects AKT in HCC cells under normal culture conditions. The results showed that the level of total AKT did not change, whereas that of p-AKT(S473) was decreased in both SMMC-7721 and HepG2 cells. These results indicated that inhibition of ODC1 decreased the activity of the AKT pathway. GSK3β is one of the downstream targets of AKT, which may be directly phosphorylated at Ser9 and inactivated by p-AKT, potentially leading to Wnt-independent β-catenin stabilization.20 Therefore, we measured the expression levels of p-GSK3β (Ser9) and β-catenin, and found that they were decreased following the inhibition of ODC1 (Figure 6A). These results indicated that ODC1 may regulate the AKT/GSK3β/β-catenin pathway via the metabolism of polyamines. Furthermore,immunofluorescence staining was used to determine the expression and nuclear localization of β-catenin.The findings of this analysis indicated that inhibition of ODC1 decreased the expression and nuclear location of β-catenin (Figure 6B). In addition, we also found that ODC1 was co-expressed with β-catenin in HCC tissues (Figure 6C).
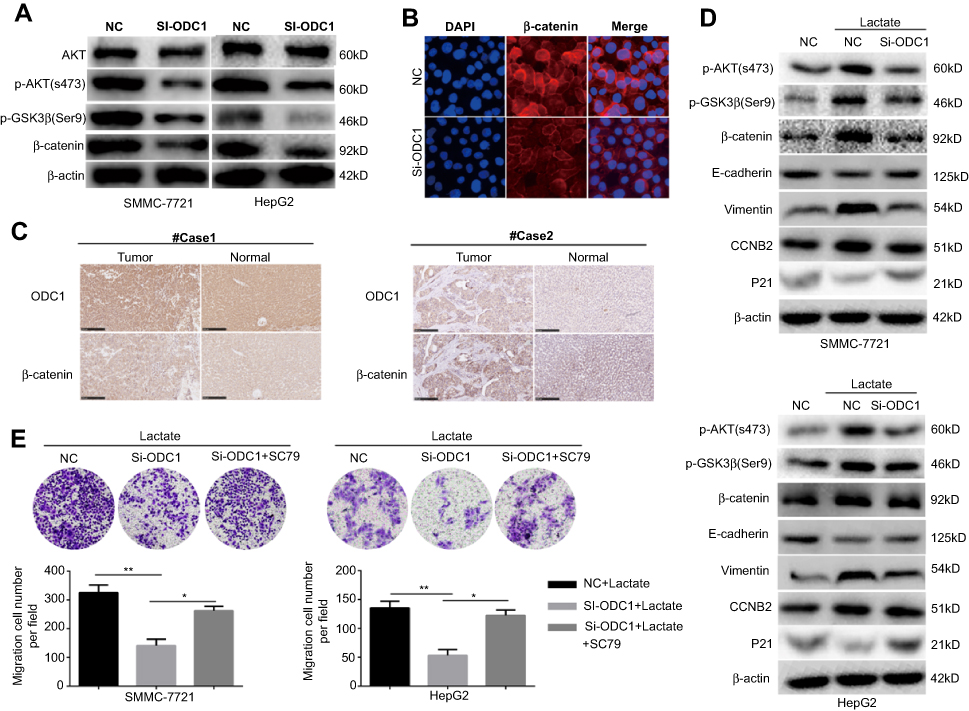 | Figure 6 ODC1 is linked to the acidosis microenvironment and the AKT/GSK3β/β-catenin pathway. (A) The expression of AKT/GSK3β/β-catenin pathway-related proteins was investigated using western blotting following the inhibition of ODC1. (B) Immunofluorescence staining was performed to evaluate the effect of ODC1 on the expression and nuclear localization of β-catenin. (C) The co-expression of ODC1 and β-catenin was determined through immunohistochemical staining in tissues obtained from patients with HCC. (D) The expression of AKT/GSK3β/β-catenin pathway-related proteins (ie, p-AKT, p-GSK3β, and β-catenin) and downstream proteins (ie, E-cadherin, vimentin, p21, and CCNB2) were determined through western blotting, following treatment with lactate or inhibition. (E) The role of the AKT/GSK3β/β-catenin pathway in ODC1-induced migration under the lactate microenvironment was assessed using a migration transwell assay. NC and Si-ODC1 group cells were treated with or without SC79 (5 µg/ml; an AKT activator) under the lactate microenvironment. *P<0.05; **P<0.01. Abbreviations: ODC1, ornithine decarboxylase 1; HCC, hepatocellular carcinoma. |
Moreover, we examined whether ODC1 may affect the AKT/GSK3β/β-catenin pathway in HCC cells under the mimetic acidotic microenvironment. We found that the acidotic microenvironment increased the levels of p-AKT(S473), p-GSK3β(Ser9), β-catenin, vimentin and cyclin B2 (CCNB2), and decreased those of E-cadherin and P21. In SMMC-7721 cells, inhibition of ODC1 reduced the effect of the acidotic microenvironment on the expression of p-AKT(S473), p-GSK3β(Ser9), β-catenin, E-cadherin, vimentin, CCNB2, and P21. These results were consistent with those observed in HepG2 cells, except for the expression of CCNB2 (Figure 6D). Collectively, these findings indicated that ODC1 is closely related to the acidotic microenvironment and the activity of the AKT/GSK3β/β-catenin pathway. Furthermore, SC-79 (an AKT activator) was used to verify whether the AKT/GSK3β/β-catenin pathway plays a role in ODC1-induced migration under the mimetic acidotic microenvironment. We found that inhibition of ODC1 decreased cell migration and SC-79 blocked this effect in both SMMC-7721 and HepG2 cells under this condition (Figure 6E).
Discussion
HCC is one of the deadliest malignant tumors of the digestive system worldwide. Although the treatment of HCC(ie, chemotherapy and radiotherapy) has advanced in the previous decades, metastasis and disease recurrence continue to pose challenges to treating physicians and patients. However, the latent mechanism involved in the migration and invasion of HCC has not been clarified. Hence, identification of novel key targets and potential mechanisms involved in the invasion of cancer cells and metastasis is warranted.
Previous studies have shown that ODC1 is an oncoprotein involved in numerous types of cancer. ODC1 is highly expressed in endometrial cancer and associated with poor overall survival and an increased rate of disease recurrence. Notably, ODC1 modulated by MCYN promotes cell proliferation in neuroblastoma.14 Choi et al21 previously demonstrated that targeting ODC1 inhibits tumor growth through a reduction of lipid metabolism in human HCC. However, the role of ODC1 in the mobility of HCC and its relation to the tumor microenvironment have not been clarified.
In our study, we provided evidence that ODC1 may serve as a potential prognostic biomarker or therapeutic target for HCC. Through an analysis of samples obtained from the TCGA database, we found that ODC1 was highly expressed in HCC tissues versus normal tissues and correlated with poor prognosis. In addition, the high expression of ODC1 was confirmed in our HCC samples and HCC cell lines. Subsequently, we evaluated the biological roles of ODC1 in HCC cells. Our results revealed that inhibition of endogenous ODC1 expression suppressed cell growth, migration, invasion, and the EMT phenotype in vitro. However, in contrast with the research performed by Choi Y on Huh7 and Huh1, we found that ODC1 induced cell cycle arrest, but did not affect the rate of apoptosis in HCC SMMC-7721 and HepG2 cells. Hence,we speculate that this observation may be attributed to the difference degree of dependence of HCC cell lines on polyamines.
A recently emerging concept states that cancer cells may reprogram their metabolism to meet their demands for proliferation and metastasis under the stimulation of the microenvironment. Owing to the abnormal vascular growth and the Warburg effect in carcinoma tissue, the external environment of cancer cells is hypoxic, nutrient-depleted, and acidotic.Notably, substantial research has been conducted to discover the relationship between the tumor microenvironment, metabolism reprogramming, and biological behavior.22–24 In the present study, we revealed that the mRNA and protein expression levels of ODC1 were upregulated only in the mimetic acidotic microenvironment. Furthermore, we found that the acidotic microenvironment stimulated the proliferation and migration of HCC cells and inhibition of ODC1 decreased this effect.
The activity of the AKT/GSK3β/β-catenin pathway has emerged as a key event for the proliferation and metastasis of certain types of cancer cells.25,26 The relationship between the metabolism of polyaminesand AKT/GSK3β/β-catenin-related pathway has been widely investigated. Blocking the metabolism of polyamine throughtreatment with a polyamine conjugate inhibits the activity of AKT/GSK3β/β-catenin, and the levels of apoptosis-related protein(ie, caspase3, caspase8 and p53).19 Inhibition of ODC1 using difluoromethylornithine has been shown to decrease the nuclear localization of β-catenin during intestinal epithelial cell migration.27 Therefore, we hypothesized that ODC1 may regulate the activity of the AKT/GSK3β/β-catenin pathway under normal culture and acidotic microenvironments in HCC. In the present study, we found that inhibition of ODC1 blocked the activity of the AKT/GSK3β/β-catenin pathway. Additionally, the expression and nuclear localization of β-catenin were decreased after inhibition of ODC1. Moreover, ODC1 was also co-expressed with β-catenin in HCC tissues. Furthermore, we indicated that the acidotic microenvironment activated the AKT/GSK3β/β-catenin pathway, and this effect can be reversed through inhibition of ODC1. Of note, the restored activity of the AKT/GSK3β/β-catenin pathway can block the effect induced by the inhibition of ODC1. Collectively, these results suggest a link between ODC1,the acidotic microenvironment, AKT/GSK3β/β-catenin pathway, and HCC proliferation and mobility.
Conclusion
In summary, ODC1 is highly expressed in HCC tissues and associated with poor patient outcome. A reduction in the expression of ODC1 inhibited the proliferation, migration, and invasion of HCC cell lines. ODC1 was upregulated in the acidotic microenvironment.Interference with the expression of ODC1 reversed the pro-proliferation and pro-migration effects of the acidotic microenvironment via the AKT/GSK3β/β-catenin pathway. Therefore, ODC1 may be a promising target in the clinical treatment of HCC.
Disclosure
This work was supported by a program for tackling key problems in science and technology [grant numbers 2007AA301B35-2]; the Natural Science Foundation of Hubei Province of China [grant numbers 2010CDB06807]; and the Important Project of Wuhan Administration of Science & Technology [grant numbers 2.008E+11]. The authors report no other conflicts of interest in this work.
References
1. Bray F, Ferlay J, Soerjomataram I, Siegel RL, Torre LA, Jemal A. Global cancer statistics 2018: GLOBOCAN estimates of incidence and mortality worldwide for 36 cancers in 185 countries. CA Cancer J Clin. 2018;68(6):394–424. doi:10.3322/caac.21492
2. An C, Kim MJ. Imaging features related with prognosis of hepatocellular carcinoma. Abdom Radiol. 2018;44(2): 509–516.
3. Laplane L, Duluc D, Larmonier N, Pradeu T, Bikfalvi A. The multiple layers of the tumor environment. Trends Cancer. 2018;4(12):802–809. doi:10.1016/j.trecan.2018.10.002
4. Jin F, Yang R, Wei Y, et al. HIF-1alpha-induced miR-23a approximately 27a approximately 24 cluster promotes colorectal cancer progression via reprogramming metabolism. Cancer Lett. 2019;440–441:211–222. doi:10.1016/j.canlet.2018.10.025
5. Golias T, Kery M, Radenkovic S, Papandreou I. Microenvironmental control of glucose metabolism in tumors by regulation of pyruvate dehydrogenase. Int J Cancer. 2018;144(4):674–686. doi:10.1002/ijc.31812
6. Zhao T, Wang H, Ma H, Wang H, Chen B, Deng Y. Starvation after cobalt-60 gamma-ray radiation enhances metastasis in U251 glioma cells by regulating the transcription factor SP1. Int J Mol Sci. 2016;17(4):386. doi:10.3390/ijms17040386
7. Sauvant C, Nowak M, Wirth C, et al. Acidosis induces multi-drug resistance in rat prostate cancer cells (AT1) in vitro and in vivo by increasing the activity of the p-glycoprotein via activation of p38. Int J Cancer. 2008;123(11):2532–2542. doi:10.1002/ijc.23818
8. Casero RA
9. Fattahi S, Ghadami E, Asouri M, Motevalizadeh Ardekanid A, Akhavan-Niaki H. Urtica dioica inhibits cell growth and induces apoptosis by targeting ornithine decarboxylase and adenosine deaminase as key regulatory enzymes in adenosine and polyamines homeostasis in human breast cancer cell lines. Cell Mol Biol (Noisy-Le-Grand). 2018;64(3):97–102. doi:10.14715/cmb/2018.64.3.16
10. Symes AJ, Eilertsen M, Millar M, et al. Quantitative analysis of BTF3, HINT1, NDRG1 and ODC1 protein over-expression in human prostate cancer tissue. PLoS One. 2013;8(12):e84295. doi:10.1371/journal.pone.0084295
11. Snezhkina AV, Krasnov GS, Lipatova AV, et al. The dysregulation of polyamine metabolism in colorectal cancer is associated with overexpression of c-Myc and C/EBPbeta rather than enterotoxigenic bacteroides fragilis infection. Oxid Med Cell Longev. 2016;2016:2353560. doi:10.1155/2016/2353560
12. Karlsson A, Helou K, Walentinsson A, Hedrich HJ, Szpirer C, Levan G. Amplification of Mycn, Ddx1, Rrm2, and Odc1 in rat uterine endometrial carcinomas. Genes Chromosomes Cancer. 2001;31(4):345–356. doi:10.1002/gcc.1153
13. Cho LY, Yang JJ, Ko KP, et al. Gene polymorphisms in the ornithine decarboxylase-polyamine pathway modify gastric cancer risk by interaction with isoflavone concentrations. Gastric Cancer. 2015;18(3):495–503. doi:10.1007/s10120-014-0396-5
14. Hogarty MD, Norris MD, Davis K, et al. ODC1 is a critical determinant of MYCN oncogenesis and a therapeutic target in neuroblastoma. Cancer Res. 2008;68(23):9735–9745. doi:10.1158/0008-5472.CAN-07-6866
15. Wang C, Ruan P, Zhao Y, et al. Spermidine/spermine N1-acetyltransferase regulates cell growth and metastasis via AKT/beta-catenin signaling pathways in hepatocellular and colorectal carcinoma cells. Oncotarget. 2017;8(1):1092–1109.
16. De Saedeleer CJ, Copetti T, Porporato PE, et al. Lactate activates HIF-1 in oxidative but not in warburg-phenotype human tumor cells. PLoS One. 2012;7(10):e46571. doi:10.1371/journal.pone.0046571
17. Dai F, Yu W, Song J, Li Q, Wang C, Xie S. Extracellular polyamines-induced proliferation and migration of cancer cells by ODC, SSAT, and Akt1-mediated pathway. Anticancer Drugs. 2017;28(4):457–464. doi:10.1097/CAD.0000000000000465
18. Uemura T, Takasaka T, Igarashi K, Ikegaya H. Spermine oxidase promotes bile canalicular lumen formation through acrolein production. Sci Rep. 2017;7(1):14841. doi:10.1038/s41598-017-14929-1
19. Li J, Tian R, Ge C, et al. Discovery of the polyamine conjugate with benzo[cd]indol-2(1 H)-one as a lysosome-targeted antimetastatic agent. J Med Chem. 2018;61(15):6814–6829. doi:10.1021/acs.jmedchem.8b00694
20. Ge H, Liang C, Li Z, et al. DcR3 induces proliferation, migration, invasion, and EMT in gastric cancer cells via the PI3K/AKT/GSK-3beta/beta-catenin signaling pathway. Onco Targets Ther. 2018;11:4177–4187. doi:10.2147/OTT.S172713
21. Choi Y, Oh ST, Won MA, et al. Targeting ODC1 inhibits tumor growth through reduction of lipid metabolism in human hepatocellular carcinoma. Biochem Biophys Res Commun. 2016;478(4):1674–1681. doi:10.1016/j.bbrc.2016.07.025
22. Wu Y, Gao B, Xiong QJ, Wang YC, Huang DK, Wu WN. Acid-sensing ion channels contribute to the effect of extracellular acidosis on proliferation and migration of A549 cells. Tumour Biol. 2017;39(6):1010428317705750. doi:10.1177/1010428317705750
23. Riemann A, Schneider B, Gundel D, Stock C, Gekle M, Thews O. Acidosis promotes metastasis formation by enhancing tumor cell motility. Adv Exp Med Biol. 2016;876:215–220.
24. Karagiota A, Kourti M, Simos G, Mylonis I. HIF-1alpha-derived cell-penetrating peptides inhibit ERK-dependent activation of HIF-1 and trigger apoptosis of cancer cells under hypoxia. Cell Mol Life Sci. 2018;76(4):809–825. doi:10.1007/s00018-018-2985-7
25. Liu M, Gao X, Liu CL. Increased expression of lncRNA FTH1P3 promotes oral squamous cell carcinoma cells migration and invasion by enhancing PI3K/Akt/GSK3b/Wnt/beta-catenin signaling. Eur Rev Med Pharmacol Sci. 2018;22(23):8306–8314.
26. Bodnar L, Stec R, Cierniak S, et al. Role of WNT/beta-Catenin pathway as potential prognostic and predictive factors in renal cell cancer patients treated with everolimus in the second and subsequent lines. Clin Genitourin Cancer. 2018;16(4):257–265. doi:10.1016/j.clgc.2018.01.008
27. Guo X, Rao JN, Liu L, Rizvi M, Turner DJ, Wang JY. Polyamines regulate beta-catenin tyrosine phosphorylation via Ca(2+) during intestinal epithelial cell migration. Am J Physiol Cell Physiol. 2002;283(3):C722–34. doi:10.1152/ajpcell.00154.2002
 © 2019 The Author(s). This work is published and licensed by Dove Medical Press Limited. The full terms of this license are available at https://www.dovepress.com/terms.php and incorporate the Creative Commons Attribution - Non Commercial (unported, v3.0) License.
By accessing the work you hereby accept the Terms. Non-commercial uses of the work are permitted without any further permission from Dove Medical Press Limited, provided the work is properly attributed. For permission for commercial use of this work, please see paragraphs 4.2 and 5 of our Terms.
© 2019 The Author(s). This work is published and licensed by Dove Medical Press Limited. The full terms of this license are available at https://www.dovepress.com/terms.php and incorporate the Creative Commons Attribution - Non Commercial (unported, v3.0) License.
By accessing the work you hereby accept the Terms. Non-commercial uses of the work are permitted without any further permission from Dove Medical Press Limited, provided the work is properly attributed. For permission for commercial use of this work, please see paragraphs 4.2 and 5 of our Terms.