")
Back to Journals » Clinical Ophthalmology » Volume 9
Ocular hypertension and hypotony as determinates of outcomes in uveitis
Authors Aman R, Engelhard S, Bajwa A, Patrie J, Reddy A
Received 17 June 2015
Accepted for publication 4 August 2015
Published 7 December 2015 Volume 2015:9 Pages 2291—2298
DOI https://doi.org/10.2147/OPTH.S90636
Checked for plagiarism Yes
Review by Single anonymous peer review
Peer reviewer comments 4
Editor who approved publication: Dr Scott Fraser
Rabia Aman,1 Stephanie B Engelhard,1 Asima Bajwa,1 James Patrie,2 Ashvini K Reddy1
1Department of Ophthalmology, 2Department of Public Health Sciences, University of Virginia, Charlottesville, VA, USA
Purpose: To assess ocular hypertension (OHT) and hypotony as outcomes of uveitis in patients managed in a mid-Atlantic tertiary care center.
Methods: Retrospective, observational study of uveitis patients seen at the University of Virginia from 1984 to 2014.
Results: A total of 442 patients (582 eyes) with uveitis were identified and included in the study. The patient population was 57.0% female. Overall, 61.9% were Caucasian and 26.6% were African American. Mean age was 46.8 years. Overall, 11.5% of the eyes had OHT at initial visit, and 7.9% had OHT at final visit (P=0.035). For each additional decade of life, the odds that an eye had OHT were elevated by a factor of 1.15 (95% confidence interval [CI]: [1.02, 1.30], P=0.027) at initial visit and by a factor of 1.15 (95% CI: [1.00, 1.32], P=0.055) at final visit. The odds that an anterior uveitis eye had OHT were greater by a factor of 2.50 (95% CI: [1.22, 5.14], P=0.013) than the odds for a nonanterior uveitis eye at initial visit and greater by a factor of 2.61 (95% CI: [1.24, 5.50], P=0.011) at final visit. For each additional 0.5 logarithm of the minimum angle of resolution increase in initial visual acuity, the odds that an affected eye had OHT were elevated by a factor of 1.18 (95% CI: [1.00, 1.39], P=0.047) at initial visit and 1.23 (95% CI: [0.99, 1.54], P=0.065) at final visit. Overall, 21 of 582 eyes (3.6%) were hypotonous initially, while 24 of 582 eyes (4.1%) were hypotonous at final follow-up (P=0.631).
Conclusion: OHT was associated with increasing age, anterior uveitis, and poor presenting visual acuity. Ocular hypotony was more common in anterior uveitis than in nonanterior uveitis. Fluctuations in intraocular pressure are an important cause of visual impairment in patients with uveitis. Careful monitoring of all uveitis patients, and especially those most at risk for fluctuations in intraocular pressure, can preserve vision and improve patient outcomes.
Keywords: uveitis, ocular hypertension, hypotony, intraocular pressure, uveitic glaucoma
Introduction
Both ocular hypertension (OHT) and hypotony are potentially blinding complications of uveitis. Cytokine release and the presence of inflammatory cells can alter the anatomy of the anterior chamber, leading to an increase in intraocular pressure (IOP) by affecting aqueous outflow.1,2 Furthermore, corticosteroids, a mainstay in the treatment of inflammation associated with uveitis, also cause increased IOP in patients who are steroid responders.1–3 Reports suggest that between 10% and 46% of uveitis patients develop elevated IOP; however, secondary glaucoma is most common in patients with chronic uveitis and in those with Fuchs heterochromic iridocyclitis, Posner–Schlossman syndrome, and uveitis associated with varicella zoster virus and herpes simplex virus.1,3 Elevated IOP in the setting of uveitis is associated with poor visual outcomes.4
Hypotony in uveitis, while less common than OHT, has been reported in up to 10% of uveitis patients and appears to be most prevalent in the pediatric setting, especially in patients with juvenile idiopathic uveitis.5 Uveitis-associated hypotony results from the failure of the ciliary body to produce aqueous humor or from an increase in uveoscleral outflow.1,5 As with OHT, the development of hypotony in the context of uveitis is associated with poor visual outcomes in both pediatric and adult populations.5
While other studies have assessed the prevalence and characteristics of OHT and hypotony in patients with uveitis, the purpose of this study was not only to analyze the characteristics of the patient population, but also to analyze in greater detail outcomes in patients with both OHT and hypotony over a 30-year period at the University of Virginia.
Methods
This was a retrospective, observational study of all uveitis patients seen in the Department of Ophthalmology at the University of Virginia. The study was approved by the Institutional Review Board and was conducted in accordance with the principles of the Declaration of Helsinki. This was a retrospective chart review study with a Health Insurance Portability and Accountability Act waiver and did not need patient consent. A database of all patients with a diagnosis of uveitis is maintained in the Department of Ophthalmology at the University of Virginia and includes 491 patients. The database was reviewed to identify uveitis patients with complete IOP data available for both eyes at initial and final visits over a 30-year period from 1984 through 2014. Forty-nine patients were excluded due to incomplete IOP data. Four hundred forty-two were identified from the database and analyzed. No minimum follow-up period was required for inclusion, and all data in the database were collected from patient charts completed at the time of patient visits. Time points for data collection in the database included patients’ initial visit to the clinic (baseline) and final follow-up visit. Disease classification was recorded in accordance with the Standardization of Uveitis Nomenclature Working Group criteria.6 The database was reviewed for patient demographic information including date of birth, sex, race/ethnicity, age at presentation, duration of follow-up, and number of clinic visits. Clinical information including final diagnosis with etiology, location, laterality, and chronicity of uveitis, best-corrected visual acuity, IOP, laboratory findings, relevant systemic and associated diagnoses, treatment modalities, and complications was also reviewed. Ocular hypotony was defined as IOP ≤7 mmHg.5 OHT was defined as IOP >21 mmHg, regardless of the presence or absence of glaucomatous optic disk appearance or visual field changes.1,7 Best-corrected visual acuity results were converted to the logarithm of the minimum angle of resolution (logMAR) units for analysis and are given as logMAR (standard deviation [SD]). Visual acuity of counting fingers was recorded as 2.0 logMAR; hand movements, 2.3 logMAR; light perception, 2.6 logMAR; and no light perception, 2.9 logMAR.8,9 Uveitis etiologies were confirmed by imaging with optical coherence tomography, fluorescein angiography, and automated perimetry and by further ancillary testing including serology, radiology, microbiology, and biopsy when appropriate. Intraocular infection was confirmed with fluid sampling or biopsy for microscopy and cytology and culture or polymerase chain reaction, when appropriate. Management including the use of local and systemic steroids, antihypertensive drops, intravitreal injections, sub-Tenon steroid injections, antimetabolites, anti-tumor necrosis factor agents, cataract surgery, pars plana vitrectomy, and glaucoma management (medical and surgical intervention) were recorded. Descriptive statistical analysis was performed where appropriate.
Statistical method
Descriptive summarization
Categorical data were summarized by frequencies and percentages, while continuous-scale data were summarized by the mean, SD, and range of the measurement distribution.
Change in IOP analyses
The initial to final changes in IOP were analyzed via a linear mixed model (LMM). The dependent variable of the LMM was the initial to final change in IOP, while the independent variables of the LMM were the uveitis location (anterior vs nonanterior) and follow-up time. Follow-up time represented a concomitant variable adjustment factor in the IOP analysis so that the “anterior” vs “nonanterior” uveitis comparison of the initial to final mean change in IOP would reflect a comparison between two sets of eyes that were followed for the same length of time. The intereye measurement correlations, induced by having bilateral uveitis cases present in the database, were accounted for in the LMM analysis by including a random “patient-specific” effect. With regard to hypothesis testing, a P≤0.05 decision rule was established a priori as the null hypothesis rejection criterion for the comparison of the initial to final mean change in IOP between the “anterior” and “nonanterior” uveitis eyes.
The relationship between follow-up time (years) and final IOP (mmHg) was examined by way of a Gaussian generalized estimating equation (GEE) regression model. The GEE model dependent variable was final IOP (mmHg), while the GEE model predictor variables were uveitis location (anterior vs nonanterior) and follow-up duration. It is important to note that the follow-up duration data that were utilized in the GEE model represented linear and nonlinear restricted cubic spline functions of the observed follow-up times. The GEE model was specified so that the regression curve was free to change depending on uveitis location. The Type III Wald statistic served as the pivotal test statistic for hypothesis testing. A P≤0.05 decision rule was established a priori as the null hypothesis rejection criterion for testing the null hypothesis to test the relationship between follow-up time and final IOP was not uveitis location dependent.
OHT and hypotony
Data for the initial and final frequencies for OHT and the data for the initial and final frequencies for ocular hypotony were analyzed via the McNemar test.
Factors associated with OHT
Multivariate binomial GEE models were utilized to determine if several patient and eye characteristics were associated with initial and final OHT. For initial OHT analysis, the set of patient and eye characteristics that were examined as potential predictors of initial OHT included age, sex, race, uveitis location, and initial visual acuity, while for final OHT analysis, the set of patient and eye characteristics that were examined as potential predictors of final OHT included age, sex, race, uveitis location, follow-up duration, number of clinical visits, and initial and final visual acuity as predictor variables. With regard to hypothesis testing, the GEE version of the Type III Wald statistic served as the pivotal test statistic. A P≤0.05 decision rule was established a priori as the rejection rule for the tests of OHT vs predictor variable association.
Software
The statistical software package SAS version 9.4 (SAS Institute Inc., Cary, NC, USA) was used to conduct the aforementioned analyses.
Results
A review of all 491 patients diagnosed with uveitis at the University of Virginia between 1984 and 2004 was conducted. Forty-nine patients were excluded from the analysis due to incomplete IOP data. The remaining 442 patients (582 eyes) were included in the analysis. Of the 442 patients, 252 were female (57.0%), 274 (61.9%) were Caucasian, 118 (26.6%) were African American, and 51 (11.5%) were of another race. The mean age of the cohort was 46.8 years (SD, 21.0). One hundred forty-three patients (32.4%) had bilateral disease, and 299 (67.6%) had unilateral disease. Of the 442 patients, 296 (67.0%) had anterior uveitis, and 146 (33.0%) had nonanterior uveitis (intermediate, posterior, or panuveitis). Patient demographics and characteristics are summarized in Table 1. A summary of the anatomic distribution of uveitis is found in Table 2.
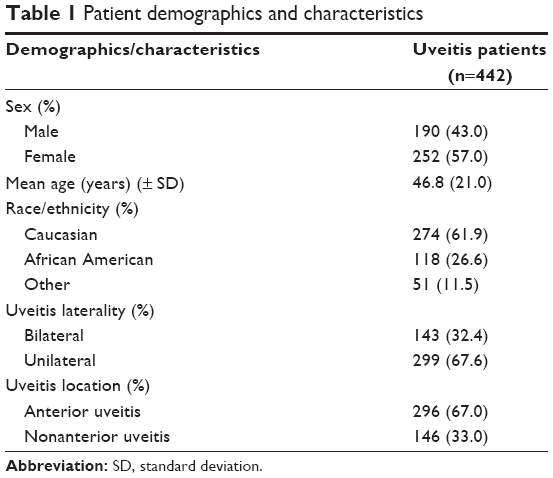 | Table 1 Patient demographics and characteristics |
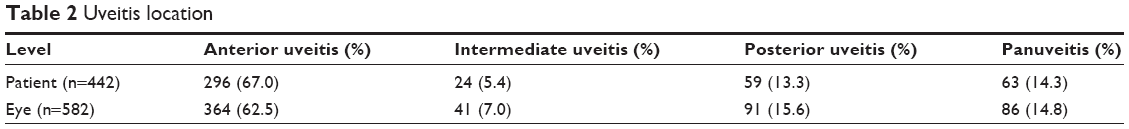 | Table 2 Uveitis location |
Initial IOP across all 582 eyes was 15.9 mmHg (SD, 6.7) and final IOP was 14.9 mmHg (SD, 5.3), representing a change of -0.9 mmHg (SD, 7.9). In the anterior uveitis group (n=364 eyes), initial IOP was 16.5 mmHg (SD, 7.2) and final IOP was 15.0 mmHg (SD, 5.2), representing a change of -1.5 mmHg (SD, 8.3). In the nonanterior uveitis group (n=218), initial IOP was 14.9 mmHg (SD, 5.7) and final IOP was constant at 14.9 mmHg (SD, 5.6), representing a change of 0 mmHg (SD, 7.1). The mean initial to final change in IOP was -1.5 mmHg (95% confidence interval [CI]: [-2.4, -0.7 mmHg], P<0.001) for the anterior uveitis eyes, while the change was approximately -0.1 mmHg (95% CI: [-1.1, 1.0 mmHg], P=0.904) for the nonanterior uveitis eyes. A summary of the initial and final IOP for each cohort is found in Table 3. The distributions of initial to final change in IOP for the anterior and the nonanterior uveitis groups are found in Figure 1.
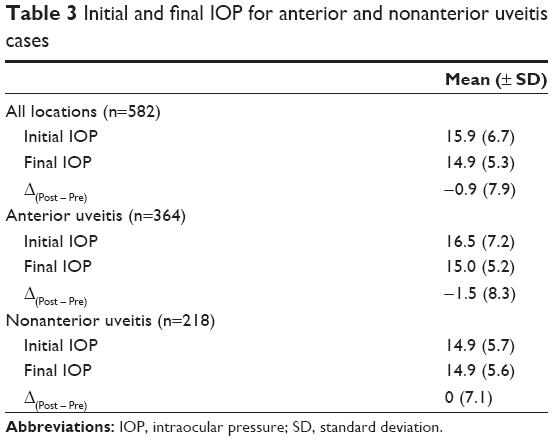 | Table 3 Initial and final IOP for anterior and nonanterior uveitis cases |
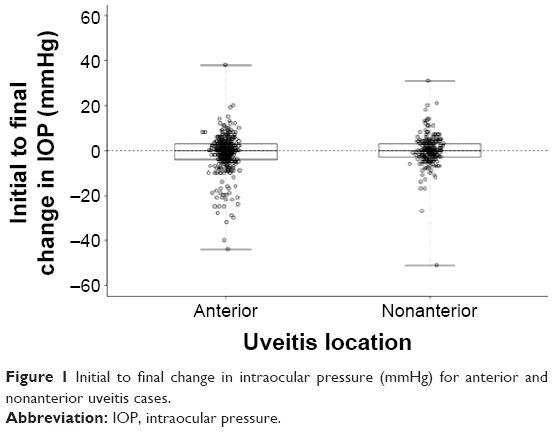 | Figure 1 Initial to final change in intraocular pressure (mmHg) for anterior and nonanterior uveitis cases. |
When adjusted for follow-up time, the estimated mean difference in the initial to final change in IOP between the anterior and nonanterior uveitis group was -1.58 mmHg (95% CI: [-3.04, -0.12 mmHg], P=0.034). The change in IOP during the study for anterior and nonanterior uveitis cases was also analyzed in terms of follow-up time (P=0.393). Figure 2 shows the relationship between follow-up time and final IOP in both the anterior and nonanterior uveitis groups.
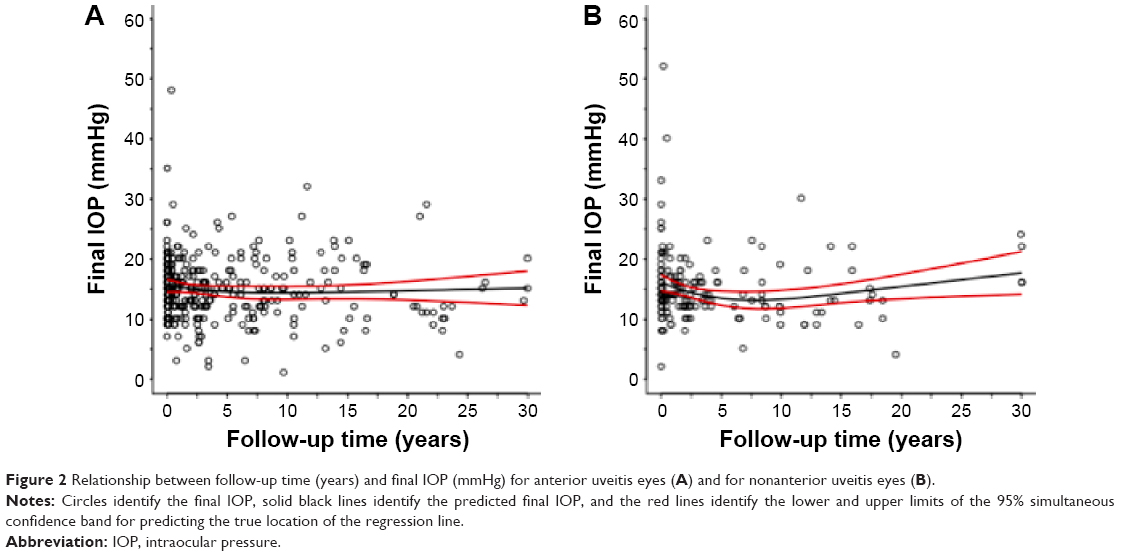 | Figure 2 Relationship between follow-up time (years) and final IOP (mmHg) for anterior uveitis eyes (A) and for nonanterior uveitis eyes (B). |
Overall, 67 of 582 eyes (11.5%) had OHT at initial visit, while 46 of 582 eyes (7.9%) had OHT at final visit (P=0.035). Of the 67 eyes with OHT at initial visit, 60 eyes (89.6%) were normotensive at final visit. Of the 515 eyes (88.5%) that were normotensive at initial visit, 39 eyes (7.6%) had OHT at final visit. In the anterior uveitis cohort, 52 of 364 eyes (14.3%) had OHT at initial visit, while 27 of 364 eyes (7.4%) had OHT at final visit (P=0.003). Of the 52 eyes that had OHT initially, 28 eyes (53.8%) were normotensive at final visit. Of the 312 eyes that were normotensive at initial visit, 23 eyes (7.4%) had OHT at final visit. In the nonanterior uveitis cohort, 15 of 218 eyes (6.9%) had OHT at initial visit, while 19 of 218 eyes (8.7%) had OHT at final visit (P=0.450). Of the 15 eyes that had OHT initially, 12 eyes (80.0%) were normotensive at final visit. Of the 203 eyes that were normotensive initially, 16 eyes (7.9%) had OHT at final visit.
Multivariate regression analyses were performed for the purposes of predicting initial OHT. Patient age (P=0.027), uveitis location (P=0.013), and initial visual acuity (logMAR) (P=0.047) were all uniquely associated with initial OHT when factors including patient age, sex, race, uveitis location, and initial visual acuity were examined simultaneously. For each additional decade of life, the odds that an eye had OHT initially were elevated by a factor of 1.15 (95% CI: [1.02, 1.30], P=0.027). The odds that an anterior uveitis eye had OHT initially were greater by a factor of 2.50 (95% CI: [1.22, 5.14], P=0.013) than the odds for a nonanterior uveitis eye. For each additional 0.5 logMAR increase in initial visual acuity, the odds that an affected eye had OHT were elevated by a factor of 1.18 (95% CI: [1.00, 1.39], P=0.047).
Multivariate regression analyses were also performed to predict OHT at final visit. The analyses indicated that age (P=0.055), uveitis location (P=0.011), and initial visual acuity (logMAR) (P=0.065) were significantly associated with or approached significant association with final OHT when factors including patient age, sex, race, uveitis location, follow-up duration, number of clinic visits, and initial and final visual acuity were examined simultaneously. For each additional decade of life, the odds that an eye had OHT at the final visit were increased by a factor of 1.15 (95% CI: [1.00, 1.32], P=0.055). The odds that an anterior uveitis eye had OHT at final follow-up were greater by a factor of 2.61 (95% CI: [1.24, 5.50], P=0.011) than the odds for a nonanterior uveitis eye. For each additional 0.5 logMAR increase in initial visual acuity, the odds that an affected eye had OHT at final follow-up was elevated by a factor of 1.23 (95% CI: [0.99, 1.54], P=0.065). A summary of characteristics of patients with OHT at initial and final visit is found in Table 4.
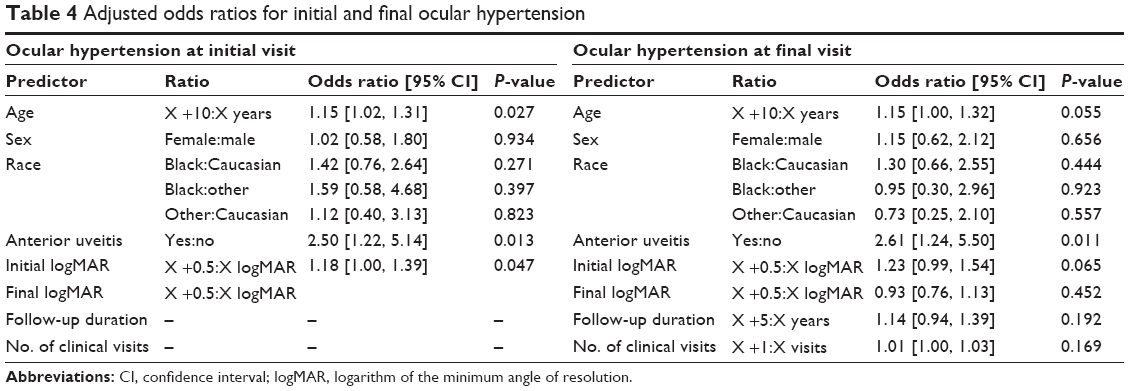 | Table 4 Adjusted odds ratios for initial and final ocular hypertension |
Overall, 21 of 582 eyes (3.6%) were hypotonous initially, while 24 of 582 eyes (4.1%) were hypotonous at final follow-up (P=0.631). Odds ratios using multivariate analysis could not be performed for hypotonous eyes because of the small sample size. A summary of hypotonous eyes by time point and anatomic location of uveitis is found in Table 5.
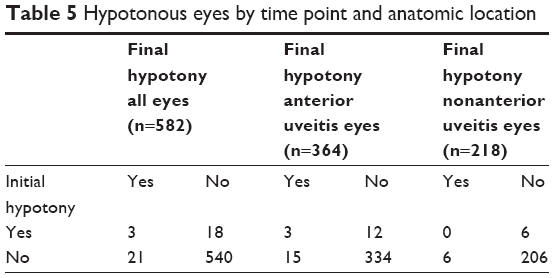 | Table 5 Hypotonous eyes by time point and anatomic location |
Numbers of eyes with OHT and hypotony by uveitis etiology were also analyzed. All patients with cytomegalovirus (CMV) posterior and panuveitis (n=7), herpetic panuveitis (n=1), ankylosing spondylitis–associated uveitis (n=5), acute posterior multifocal placoid pigment epitheliopathy (n=6), granulomatosis with polyangiitis (n=1), multiple evanescent white dot syndrome (n=3), polyarteritis nodosa (n=2), serpiginous choroiditis (n=5), syphilis (n=1), and ulcerative colitis (n=2) were normotensive at both initial and final visits. A summary of OHT and hypotony by time point and etiology is given in Table 6.
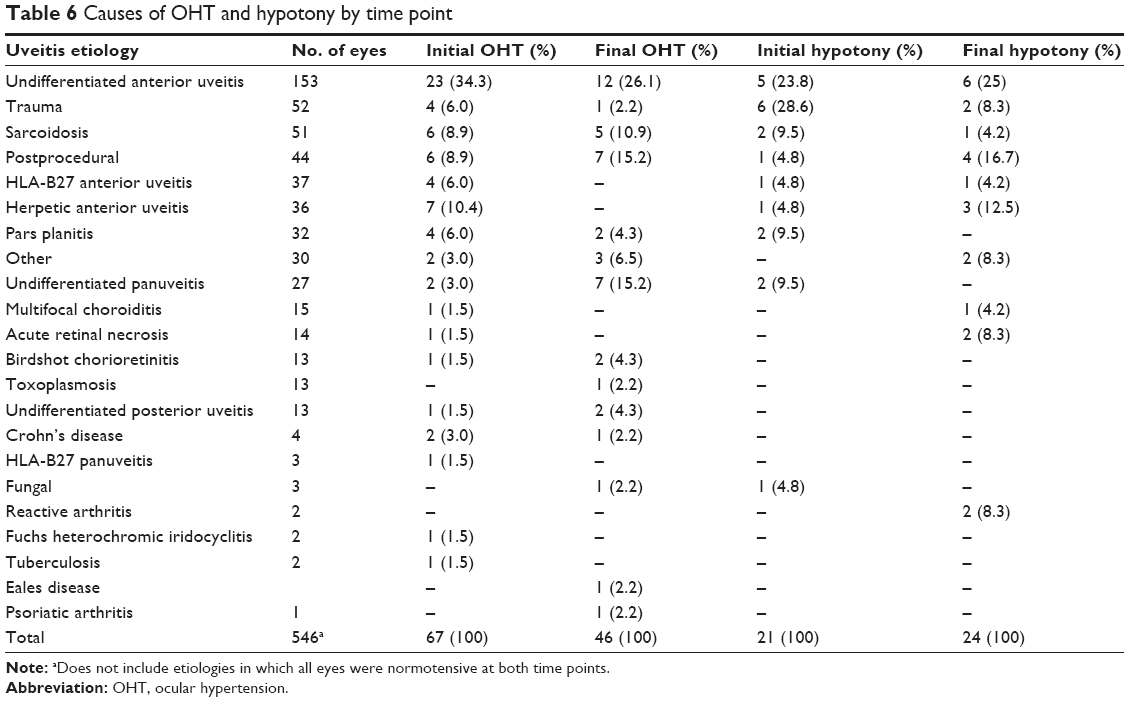 | Table 6 Causes of OHT and hypotony by time point |
Discussion
This retrospective study sought to describe the relationship between OHT and hypotony and outcomes in a population of 442 uveitis patients at a tertiary referral center in Virginia, USA. OHT was present at initial visit in 67 of 582 eyes (11.5%), which is consistent with rates of uveitic glaucoma reported in the literature.1,3 Ocular hypotony was noted in 3.6% (21 of 582 eyes) of patients at initial visit, which is also consistent with the range of hypotony reported in the literature.5
In our population, patients in the anterior uveitis group had slightly higher IOP values initially than did the nonanterior uveitis group (16.5 mmHg vs 14.9 mmHg); however, the difference in initial IOP between these groups was not clinically significant. Both the anterior and nonanterior uveitis groups had similar IOP values at final follow-up (15.0 mmHg vs 14.9 mmHg). The mean initial to final change in IOP in the anterior uveitis group was -1.5 mmHg (95% CI: [-2.4, -0.7 mmHg], P<0.001), which was statistically significant. In the nonanterior uveitis group, the initial to final change in IOP was small and insignificant, at approximately -0.1 mmHg (95% CI: [-1.1, 1.0 mmHg], P=0.904). Change in IOP during the study period for anterior and nonanterior uveitis cases was associated with uveitis location (P=0.034), but not follow-up time (P=0.393).
Of the 67 eyes that had OHT at initial visit, 89.6% were normotensive at final follow-up visit, indicating that OHT in these patients was most likely related to uveitis or transient steroid responsiveness. Of the 515 eyes that were normotensive at initial visit, 7.6% had OHT at final visit, suggesting that many patients developed OHT following corticosteroid treatment or due to the uveitis itself. Only seven patients had OHT at both initial and final visits.
Data were analyzed using multivariate regression analysis to identify factors associated with the development of OHT at either initial or final visit for the purpose of predicting patients at highest risk of developing elevated IOP during the course of their illness. Patient age (P=0.027), uveitis location (P=0.013), and initial visual acuity (logMAR) (P=0.047) were all uniquely associated with OHT in our series. For each additional decade of life, the odds that an eye had OHT initially were elevated by a factor of 1.15 (95% CI: [1.02, 1.30], P=0.027). A Taiwanese study also found that increasing age was a significant risk factor for the development of OHT at initial uveitis presentation; however, that study reported that increasing age was only significant in the adult age group (17–64 years), but not in the elderly (>64 years).10 That study also found that having anterior uveitis was a significant risk factor for the development of OHT, a finding echoed in the current study and in some previous reports,1 but not others.4,11 In our cohort, for each additional 0.5 logMAR increase in initial visual acuity, the odds that an affected eye had OHT were elevated by a factor of 1.18 (95% CI: [1.00, 1.39], P=0.047). The Taiwanese study found that being male was a significant risk factor for the development of OHT at the time of initial uveitis presentation;10 however, in the current series, neither race nor sex was associated with initial OHT.
A similar analysis was performed with the purpose of predicting OHT at final visit. The analyses indicated that age (P=0.055), uveitis location (P=0.011), and initial visual acuity (logMAR) (P=0.065) were associated or marginally associated with final OHT. A Taiwanese study reported that increasing age was associated with development of OHT later in the course of uveitis.10 In our study, increasing age was marginally associated with the development of OHT at final visit. For each additional decade of life, the odds that an eye had OHT at final visit were elevated by a factor of 1.15 (95% CI: [1.00, 1.32], P=0.055). Anterior uveitis was also associated with the development of OHT at final visit. The odds that an anterior uveitis eye had OHT at final follow-up were greater by a factor of 2.61 (95% CI: [1.24, 5.50], P=0.011) than the odds for a nonanterior uveitis eye, which was echoed in the Taiwanese study.10 Increasing logMAR visual acuity at initial visit was also marginally associated with the development of OHT at the final visit. For each additional 0.5 logMAR increase in initial visual acuity, the odds that an affected eye had OHT at final follow-up was elevated by a factor of 1.23 (95% CI: [0.99, 1.54], P=0.065). The association between age and visual acuity was less helpful in predicting final OHT than initial OHT because the administration of corticosteroids at the initial or subsequent visits likely plays a role in the elevation of IOP. A previous study found that the number of visits to the ophthalmology clinic was associated with higher rates of OHT late in the course of uveitis,10 but in our study, race, final logMAR visual acuity, follow-up duration, and number of clinic visits was not associated with the development of OHT at final visit.
Previous studies have found that secondary glaucoma is most common in patients with chronic uveitis and in those with Fuchs heterochromic iridocyclitis, Posner–Schlossman syndrome, and uveitis associated with varicella zoster virus and herpes simplex virus.1,3 A Boston study found that the etiologies most associated with OHT were herpes virus–associated uveitis, sarcoidosis, Fuchs heterochromic iridocyclitis, and intraocular lens–induced uveitis.12 Similarly, a Japanese report found that patients with sarcoidosis, Behçet’s disease, Vogt-Koyanagi-Harada disease, varicella zoster virus iridocyclitis, Posner–Schlossman syndrome, and acute and undifferentiated anterior uveitis were the etiologies most associated with the development of OHT.1 In our study, 19.4% of herpetic anterior uveitis, 15.0% of undifferentiated anterior uveitis, 13.6% of postprocedural uveitis, 12.5% of intermediate uveitis, 11.8% of sarcoidosis, 10.8% of HLA-B27 anterior uveitis, and 7.7% of traumatic uveitis patients had OHT at initial patient visit.
Rates of hypotony in our population were considerably lower than rates of OHT, which is consistent with prior reports.5 Overall, 21 of 582 eyes (3.6%) were hypotonous initially, while 24 of 582 eyes (4.1%) were hypotonous at final follow-up (P=0.631). Although the numbers of hypotonous eyes in our series were low and did not allow for the calculation of odds ratios, rates of hypotony in the anterior uveitis group were higher at both initial and final visit than in the nonanterior uveitis group. Other reports have demonstrated higher rates of hypotony in children, particularly those with juvenile idiopathic uveitis, which is an etiology of anterior uveitis; however, reports have also indicated that rates of hypotony are lower in adults with anterior uveitis compared to children.5,13,14 Daniel et al reported that rates of hypotony were highest in patients with panuveitis (4.8%), followed by anterior uveitis (1.8%).15 In their study, they found that younger age, African American race, previous diagnosis of hypertension or diabetes mellitus, and prior history of cataract surgery were all associated with hypotony at uveitis presentation. Hypotony at presentation was also associated with decreased visual acuity in that study. Sen et al found similar results and also found that hypotony was associated with chronic uveitis and that uveitis location was not predictive of the development of hypotony.5 Daniel et al reported that patients with sarcoidosis and HLA-B27-associated uveitis had increased risk of developing hypotony, as did Sen et al;5,15 however in our series, no patients with HLA-B27-associated uveitis developed hypotony during the follow-up period, and only two eyes with sarcoidosis were hypotonous at initial visit. Both patients with reactive arthritis, however, did develop hypotony at final visit. In our series, the majority of hypotonous eyes were diagnosed with undifferentiated anterior uveitis, traumatic uveitis, and postprocedural uveitis.
The major limitation of this study is its retrospective nature, which increased susceptibility to referral, treatment, and data collection biases. The ophthalmology clinic at the University of Virginia sees patients from the entire state of Virginia as well as referrals from other areas. Furthermore, our health system is located in Charlottesville, Virginia, which is an International Rescue Committee site for international refugees. These patients may affect the results in this study by alterations in the genetic, racial, and geographic predispositions to diseases associated with uveitis in our population. Because there was no standardized follow-up period required for inclusion in the study, it is possible that the visual and intraocular pressure outcomes represent only patients with more severe disease or those with longer follow-up periods. Owing also to the 30-year span of this study, patients were seen by different ophthalmologists. Additionally, a lack of uveitis specialists to make precise diagnoses at various times during the 30-year period may have influenced the management of patients.
Conclusion
In conclusion, our study demonstrates an association between OHT and increasing age, anterior uveitis, and poor presenting visual acuity. Ocular hypotony was more common in anterior uveitis than in nonanterior uveitis. These results indicate the importance of careful monitoring of IOP in the setting of uveitis. Identification of uveitis patients most at risk for fluctuations in IOP allows for better targeted management of these patients for the purpose of preserving vision and improving outcomes.
Disclosure
The authors report no conflicts of interest in this work.
References
Kanda T, Shibata M, Taguchi M, Ishikawa S, Harimoto K, Takeuchi M. Prevalence and aetiology of ocular hypertension in acute and chronic uveitis. Br J Ophthalmol. 2014;98:932–936. | ||
Herbert HM, Viswanathan A, Jackson H, Lightman SL. Risk factors for elevated intraocular pressure in uveitis. J Glaucoma. 2004;13(2):96–99. | ||
Sallam A, Sheth HG, Habot-Wilner Z, Lightman S. Outcomes of raised intraocular pressure in uveitic eyes with and without a corticosteroid-induced hypertensive response. Am J Ophthalmol. 2009;148(2):207–213. | ||
Neri P, Azuara-Blanco A, Forrester JV. Incidence of glaucoma in patients with uveitis. J Glaucoma. 2004;13(6):461–465. | ||
Sen HN, Drye LT, Goldstein DA, et al; Multicenter Uveitis Steroid Treatment (MUST) Trial Research Group. Hypotony in patients with uveitis: the multicenter uveitis steroid treatment (MUST) trial. Ocul Immunol Inflamm. 2012;20(2):104–112. | ||
Jabs DA, Nussenblatt RB, Rosenbaum JT; Standardization of Uveitis Nomenclature (SUN) Working Group. Standardization of uveitis nomenclature for reporting clinical data. Results of the first international workshop. Am J Ophthalmol. 2005;140(3):509–516. | ||
Varma R, Ying-Lai M, Francis BA, et al; Los Angeles Latino Eye Study Group. Prevalence of open-angle glaucoma and ocular hypertension in Latinos: the Los Angeles Latino Eye Study. Ophthalmology. 2004;111(8):1439–1448. | ||
Lange C, Feltgen N, Junker B, Schulze-Bonsel K, Bach M. Resolving the clinical acuity categories “hand motion” and “counting fingers” using the Freiburg visual acuity test (FrACT). Graefes Arch Clin Exp Ophthalmol. 2009;247(1):137–142. | ||
Kwon YH, Kim CS, Zimmerman MB, Alward WL, Hayreh SS. Rate of visual field loss and long-term visual outcome in primary open-angle glaucoma. Am J Ophthalmol. 2001;132(1):47–56. | ||
Hwang DK, Chou YJ, Pu CY, Chou P. Risk factors for developing glaucoma among patients with uveitis: a nationwide study in Taiwan. J Glaucoma. 2015;24(3):219–224. | ||
Sijssens KM, Rothova A, Berendschot TT, de Boer JH. Ocular hypertension and secondary glaucoma in children with uveitis. Ophthalmology. 2006;113(5):853–859. | ||
Merayo-Lloves J, Power WJ, Rodriguez A, Pedroza-Seres M, Foster CS. Secondary glaucoma in patients with uveitis. Ophthalmologica. 1999;213(5):300–304. | ||
Thorne JE, Woreta F, Kedhar SR, Dunn JP, Jabs DA. Juvenile idiopathic arthritis-associated uveitis: incidence of ocular complications and visual acuity loss. Am J Ophthalmol. 2007;143(5):840–846. | ||
Kump LI, Castañeda RAC, Androudi SN, Reed GF, Foster CS. Visual outcomes in children with juvenile idiopathic arthritis-associated uveitis. Ophthalmology. 2006;113(10):1874–1877. | ||
Daniel E, Pistilli M, Pujari SS, et al. Risk of hypotony in noninfectious uveitis. Ophthalmology. 2012;119(11):2377–2385. |
 © 2015 The Author(s). This work is published and licensed by Dove Medical Press Limited. The full terms of this license are available at https://www.dovepress.com/terms.php and incorporate the Creative Commons Attribution - Non Commercial (unported, v3.0) License.
By accessing the work you hereby accept the Terms. Non-commercial uses of the work are permitted without any further permission from Dove Medical Press Limited, provided the work is properly attributed. For permission for commercial use of this work, please see paragraphs 4.2 and 5 of our Terms.
© 2015 The Author(s). This work is published and licensed by Dove Medical Press Limited. The full terms of this license are available at https://www.dovepress.com/terms.php and incorporate the Creative Commons Attribution - Non Commercial (unported, v3.0) License.
By accessing the work you hereby accept the Terms. Non-commercial uses of the work are permitted without any further permission from Dove Medical Press Limited, provided the work is properly attributed. For permission for commercial use of this work, please see paragraphs 4.2 and 5 of our Terms.