")
Back to Journals » OncoTargets and Therapy » Volume 11
OCT4, SOX2, and NAN OG positive expression correlates with poor differentiation, advanced disease stages, and worse overall survival in HER2+ breast cancer patients
Authors Yang F, Zhang J, Yang H
Received 8 May 2018
Accepted for publication 24 August 2018
Published 6 November 2018 Volume 2018:11 Pages 7873—7881
DOI https://doi.org/10.2147/OTT.S173522
Checked for plagiarism Yes
Review by Single anonymous peer review
Peer reviewer comments 2
Editor who approved publication: Dr William C. Cho
Fan Yang,* Jiaming Zhang,* Hua Yang
Department of Thyroid and Breast Surgery, The Central Hospital of Wuhan, Tongji Medical College, Huazhong University of Science and Technology, Wuhan, China
*These authors contributed equally to this work
Objective: This study aimed to evaluate the correlations of expression of OCT4, SOX2, and NANOG with clinicopathological features and overall survival (OS) in human epidermal growth factor receptor 2-positive (HER2+) breast cancer (BC) patients.
Methods: One hundred and thirty-four surgical HER2+ BC patients who received doxorubicin and cyclophosphamide followed by paclitaxel and trastuzumab adjuvant therapy were enrolled in this study. Immunofluorescence assay was used to detect OCT4, SOX2, and NANOG expressions. The median follow-up duration was 104 months, and the last follow-up date was December 31, 2017.
Results: The expressions of OCT4 (P=0.001), SOX2 (P=0.003), and NANOG (P=0.005) were higher in tumor tissues compared with paired adjacent tissues. OCT4 positive expression was associated with poor pathological differentiation (P=0.028), larger tumor size (P=0.022), advanced N stage (P<0.001), and higher TNM stage (P<0.001). SOX2 positive expression was correlated with poor pathological differentiation (P=0.005), larger tumor size (P=0.013), and increased T stage (P=0.024). NANOG positive expression was associated with poor pathological differentiation (P=0.028), higher N stage (P=0.001), and elevated TNM stage (P=0.001). Kaplan–Meier curves disclosed that OCT4 (P=0.001) and NANOG (P=0.001) positive expressions were associated with worse OS, while SOX2 (P=0.058) positive expression was only numerically correlated with poor OS, but without statistical significance. Further analyses revealed that co-expression of these three biomarkers disclosed even better predictive value for shorter OS.
Conclusion: OCT4, SOX2, and NANOG positive expressions correlate with poor differentiation and advanced disease stage, and OCT4 and NANOG present with predictive values for poor OS in HER2+ BC patients.
Keywords: clinicopathological features, prognosis, biomarker, tumor tissue, predictive value
Introduction
Breast cancer (BC) is the most common malignancy and the leading cause of cancer-related deaths in females. It resulted in an estimated 1,676,600 new cases and 521,900 deaths in 2012 worldwide, and approximately 63,410 new cases and 40,610 deaths were recorded in the US in 2017.1,2 BC is classified into several molecular subtypes, among which human epidermal growth factor receptor 2-positive (HER2+) BC, as a common subtype of BC, accounts for nearly 15%–20% of all BC cases. HER2+ BC patients present with more aggressive disease, greater likelihood of lymph node involvement, reduced estrogen receptor (ER) expression, and increased resistance to endocrine therapy.3,4 In addition, the mortality of BC patients with HER2+ expression has been reported to be higher than that in patients with HER2-negative (HER2-) expression.5,6 Although great improvements in general screening, accurate diagnosis, and targeted treatments have been achieved, with the 5-year survival rate of BC sostenuto increased, the prognosis of HER2+ BC patients is still far from satisfactory. Therefore, it is vital to seek additional and convincing biomarkers to monitor disease progression and acquire better prognosis in HER2+ BC patients.
Cancer stem cells (CSCs), also called tumor-initiating cells, present with “stem-cell”-like properties such as self-renewal capacity and heterogeneity, which contribute to sustaining tumorigenesis and tumor progression.2,6,7 As common CSC markers, OCT4, SOX2, and NANOG are critical regulators of self-renewal as well as pluripotency of embryonic stem cells, and all of them could regulate cell proliferation and differentiation. According to accumulating evidence, OCT4, SOX2, and NANOG are identified as potential biomarkers for predicting poor prognosis in different malignancies, such as BC, hepatocellular carcinoma, cervical cancer, and non-small-cell lung cancer (NSCLC).8–11 Furthermore, all of them have been reported to be frequently involved in breast diseases, including BC, while information is rarely known about the effects of OCT4, SOX2, and NANOG expression on the prognosis of HER2+ BC patients. Therefore, we chose OCT4, SOX2, and NANOG as CSC markers for investigation and conducted this study to evaluate the correlations of expression of OCT4, SOX2, and NANOG with clinicopathological features and overall survival (OS) in HER2+ BC patients.
Methods
Patients
One hundred and thirty-four HER2+ BC patients underwent AC→T+H adjuvant therapy at the Department of Thyroid and Breast Surgery in The Central Hospital of Wuhan, Tongji Medical College, Huazhong University of Science and Technology, between January 1, 2007 and December 31, 2010, and were retrospectively reviewed in this study. The inclusion criteria were as follows: 1) diagnosed with primary BC by clinical, radiographic, and pathological findings; 2) age above 18 years at surgery; 3) HER2+ patients; 4) patients who received AC→T+H adjuvant therapy; 5) information on tumor properties was available to be retrieved from the Electronic Medical Record System of The Central Hospital of Wuhan, Tongji Medical College, Huazhong University of Science and Technology, and the information should include at least pathological grade, tumor size, and TNM stage, HER2 status, ER status, and progesterone receptor (PR) status; 6) regularly followed up with complete OS data; and 7) corresponding paraffin-embedded tumor tissue samples and paired adjacent tissue samples were available to obtain from the Specimen Storehouse of The Central Hospital of Wuhan, Tongji Medical College, Huazhong University of Science and Technology. Patients who had secondary BC or with a history of other solid tumors or hematological malignancies, or those who received neoadjuvant therapies were excluded from this study.
Ethics approval
The Ethics Committee of The Central Hospital of Wuhan, Tongji Medical College, Huazhong University of Science and Technology, had approved this study before initiation. All the patients or their guardians provided written informed consent or orally agreed to the informed consent by phone which was recorded.
OCT4, SOX2, and NANOG determination by immunofluorescence assay
Formaldehyde-fixed, paraffin-embedded tumor tissue samples and paired adjacent tissue samples were obtained from the Specimen Storehouse of The Central Hospital of Wuhan, Tongji Medical College, Huazhong University of Science and Technology. After being deparaffinized and dehydrated at 65°C for 3 hours, the sections were permeabilized in PBS/Triton X-100 (consisting of PBS, 1% BSA, 0.1% Triton) overnight, and then treated with methanol containing 0.3% hydrogen peroxide and autoclaved at 121°C for 10 minutes for antigen retrieval. Subsequently, the sections were blocked with 10% goat serum and incubated with rabbit antibody against OCT4 with dilution 1:1,600 (CST, Danvers, MA, USA), mouse antibody against SOX2 with dilution 1:400 (CST), and mouse antibody against NANOG with dilution 1:2,000 (CST) at 4°C overnight. After washing three times with PBS, Alexa Fluor® 488 conjugate-labeled antibody against rabbit IgG with dilution 1:500 (CST) or Alexa Fluor® 594 conjugate-labeled antibody against mouse IgG with dilution 1:500 (CST) was added as a secondary antibody. After staining, the sections were counterstained using Hoechst 33342. In addition, histological score (HSCORE) ranging from 0 (no staining) to 4 (maximal staining) was calculated as follows to assess immunofluorescent staining results according to the methods described previously:12 HSCORE = ΣPi(i+1). Here, Pi stands for the percentage of stained epithelial cells for each intensity which scores from 0% to 100%, i represents the intensity of staining with a value at 1, 2, or 3 (weak, moderate, or strong, respectively), and 1 is a correction for optimal density. A HSCORE of 0.7 was considered as a threshold to distinguish positivity and negativity of immunofluorescent staining.12
Treatment
All the patients included in this study received AC→T+H adjuvant therapy. The common treatment schedule was: doxorubicin 60 mg/m2 d1, and cyclophosphamide 600 mg/m2 d1 every 21 days for four cycles, followed by paclitaxel 175 mg/m2 d1 every 21 days for four cycles and trastuzumab 4 mg/kg for the first time, and trastuzumab 2 mg/kg every 1 week or 6 mg/kg every 3 weeks for 1 year.
Data acquisition
The patients’ characteristics including age, tumor location, pathological grade, tumor size, TNM stage, HER2 status, ER status, and PR status were retrieved from the Electronic Medical Record System of The Central Hospital of Wuhan, Tongji Medical College, Huazhong University of Science and Technology. The TNM stage was classified according to the sixth edition of the American Joint Committee on Cancer (AJCC) cancer staging manual. In the routine examinations of BC patients in our hospital, HER2+ was defined as either immunohistochemistry (IHC) 3+ or in situ hybridization ratio ≥2.0, while ER+ and PR+ were defined as ≥10% staining by IHC. In addition, OS was calculated from the time of adjuvant chemotherapy to the date of death from any cause. The median follow-up time was 104 months, and the last follow-up date was December 31, 2017.
Statistics
Statistical analysis was performed using SPSS Software 22.0 (IBM, Armonk, NY, USA) and GraphPad Prism 6.01 (GraphPad, La Jolla, CA, USA). Data were mainly presented as mean ± SD or count (percentage). The comparison between two individual groups was performed using chi-squared test or Wilcoxon rank sum test, and the comparison between two paired groups was performed using McNemar test. OS was analyzed by Kaplan–Meier curves and log-rank test. Univariate Cox proportional hazards regression was performed to detect the correlation and calculate the HR of factors for OS analysis. P<0.05 was considered significant.
Results
Baseline characteristics
The mean age of HER2+ BC patients was 53.8±13.2 years (Table 1). There were 52 (38.8%) patients with tumor in the left side and 82 (61.2%) patients with tumor in the right side. The numbers of patients with well differentiation (G1), moderate differentiation (G2), and poor differentiation (G3) were 15 (11.2%), 108 (80.6%), and 11 (8.2%), respectively. There were 34 (25.4%) patients in T1 stage, 95 (70.9%) patients in T2 stage, and 5 (3.7%) patients in T3 stage. As for the N stage, there were 59 (44.0%) patients in N0 stage, 47 (35.1%) patients in N1 stage, 23 (17.2%) patients in N2 stage, and 5 (3.7%) patients in N3 stage. As for the TNM stage, 10 (7.5%), 69 (51.5%), 25 (18.7%), 25 (18.7%), and 5 (3.6%) patients were in TNM stage I, IIA, IIB, IIIA, and IIIC, respectively. Other baseline characteristics are shown in Table 1.
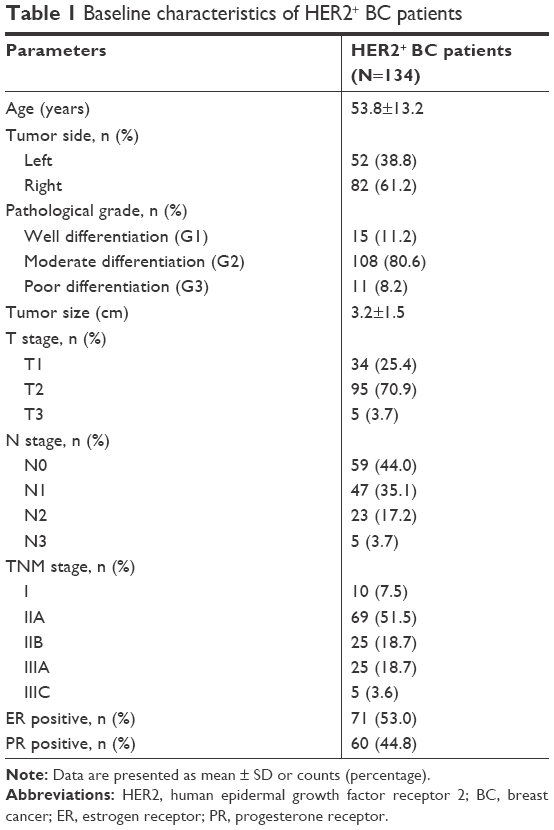 | Table 1 Baseline characteristics of HER2+ BC patients |
OCT4, SOX2, and NANOG expressions in tumor tissues and paired adjacent normal tissues
As shown in Figure 1A–C and Table 2, the expressions of OCT4 (P=0.001), SOX2 (P=0.003), and NANOG (P=0.005) were upregulated in tumor tissues compared to paired adjacent tissues.
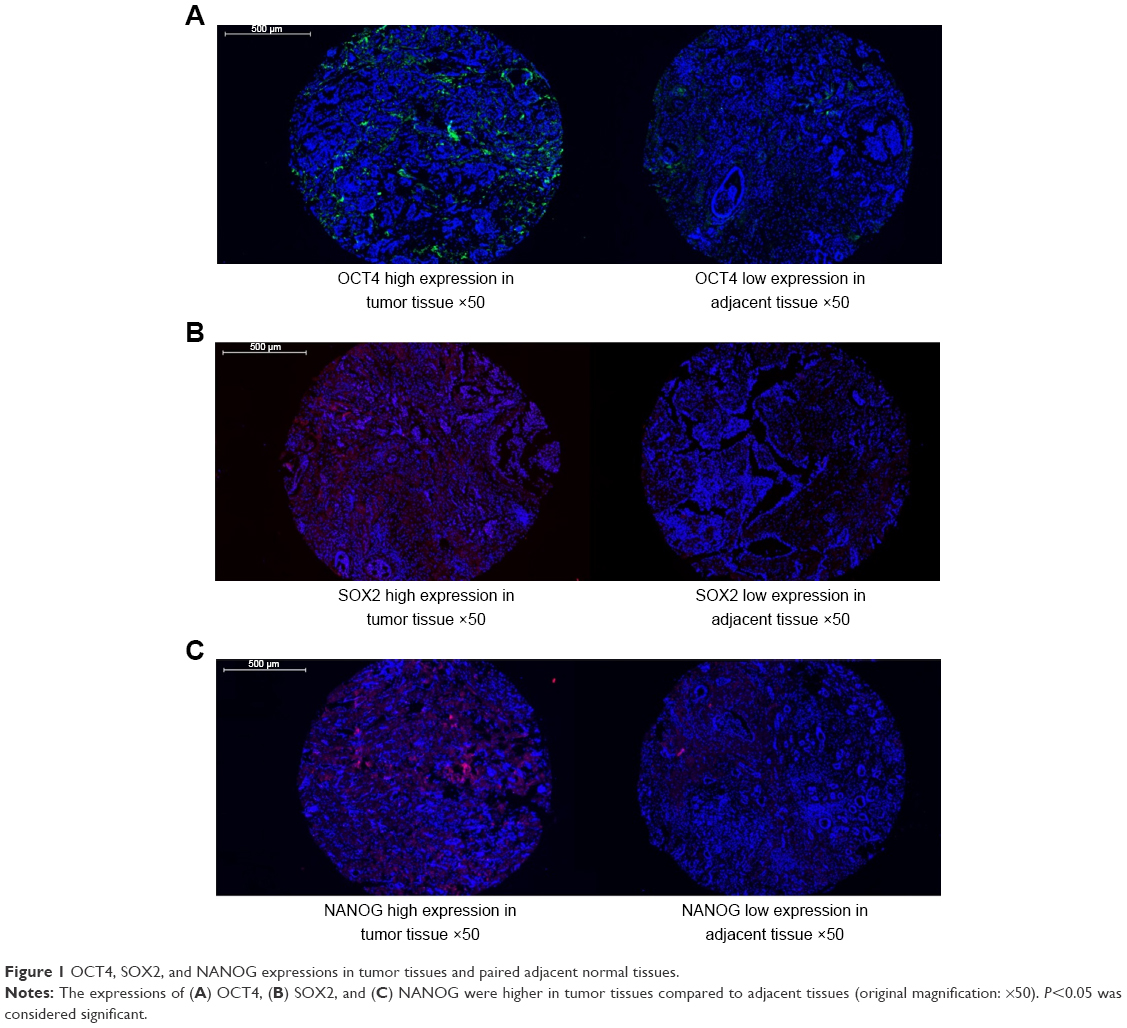 | Figure 1 OCT4, SOX2, and NANOG expressions in tumor tissues and paired adjacent normal tissues. |
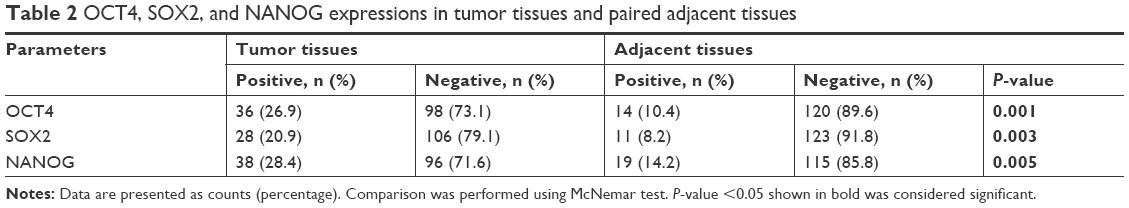 | Table 2 OCT4, SOX2, and NANOG expressions in tumor tissues and paired adjacent tissues |
Co-expressions of OCT4, SOX2, and NANOG in BC tissues
There were 36 (26.9%) patients with OCT4 positive expression, 28 (20.9%) patients with SOX2 positive expression, and 38 (28.4%) patients with NANOG positive expression in tumor tissues. Co-expression status of OCT4, SOX2, and NANOG in BC tissues is presented in Table 3, which shows that the numbers of patients with no positive marker expression, at least one positive marker expression, two positive expressions, at least two positive markers expressions, and all three positive markers expressions were 76 (56.7%), 58 (43.3%), 31 (23.1%), 57 (42.6%), and 13 (9.7%), respectively. As for two positive markers expressions, there were 17 (12.7%) patients with OCT4 and SOX2 positive expressions, 23 (17.2%) patients with OCT4 and NANOG positive expressions, and 17 (12.7%) patients with SOX2 and NANOG positive expressions.
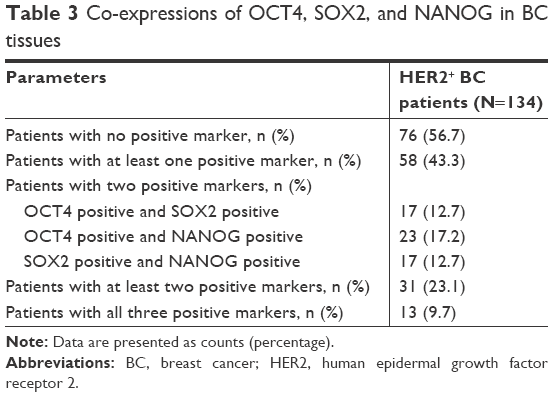 | Table 3 Co-expressions of OCT4, SOX2, and NANOG in BC tissues |
Correlation of OCT4, SOX2, and NANOG expressions with baseline characteristics in HER2+ BC patients
The positive expression of OCT4 was associated with poor pathological differentiation (P=0.028), larger tumor size (P=0.022), increased N stage (P<0.001), and higher TNM stage (P<0.001; Table 4). The positive expression of SOX2 was correlated with poor pathological differentiation (P=0.005), larger tumor size (P=0.013), and advanced T stage (P=0.024). The positive expression of NANOG was associated with poor pathological differentiation (P=0.028), elevated N stage (P=0.001), and higher TNM stage (P=0.001). No correlation between the expression of OCT4, SOX2, or NANOG and other baseline characteristics was found.
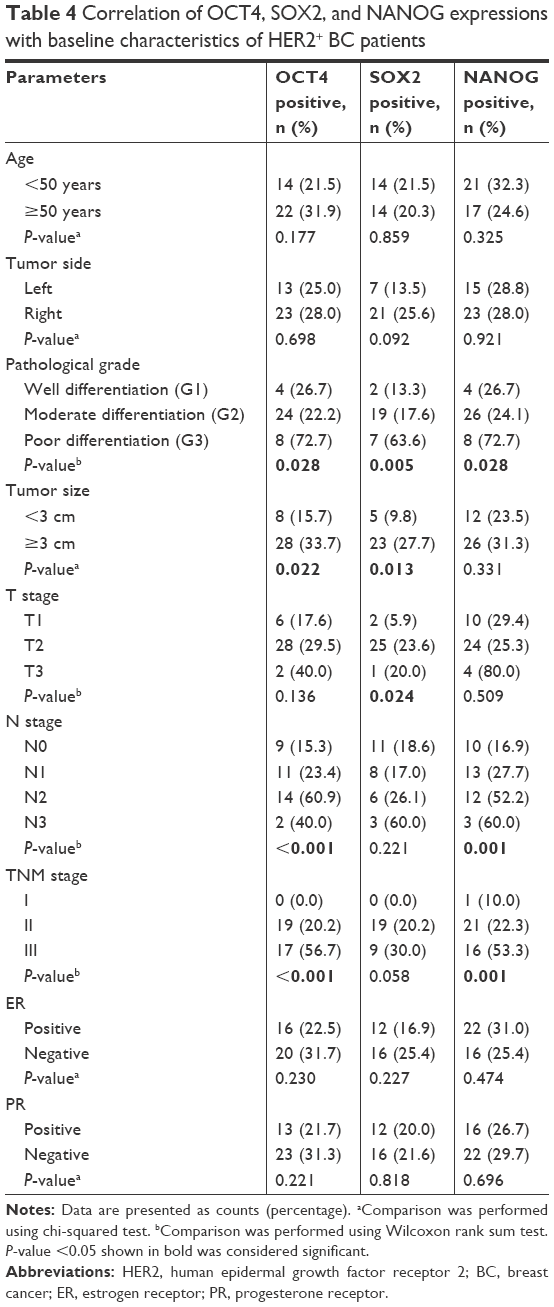 | Table 4 Correlation of OCT4, SOX2, and NANOG expressions with baseline characteristics of HER2+ BC patients |
Correlation of OCT4, SOX2, and NANOG expressions with OS in HER2+ BC patients
The OCT4 positive expression was associated with worse OS compared with OCT4 negative expression (P=0.001; Figure 2A), and NANOG positive expression was also associated with poor OS compared with NANOG negative expression (P=0.001; Figure 2C). However, SOX2 positive expression was numerically associated with shorter OS in HER2+ BC patients but without statistical significance (P=0.058; Figure 2B).
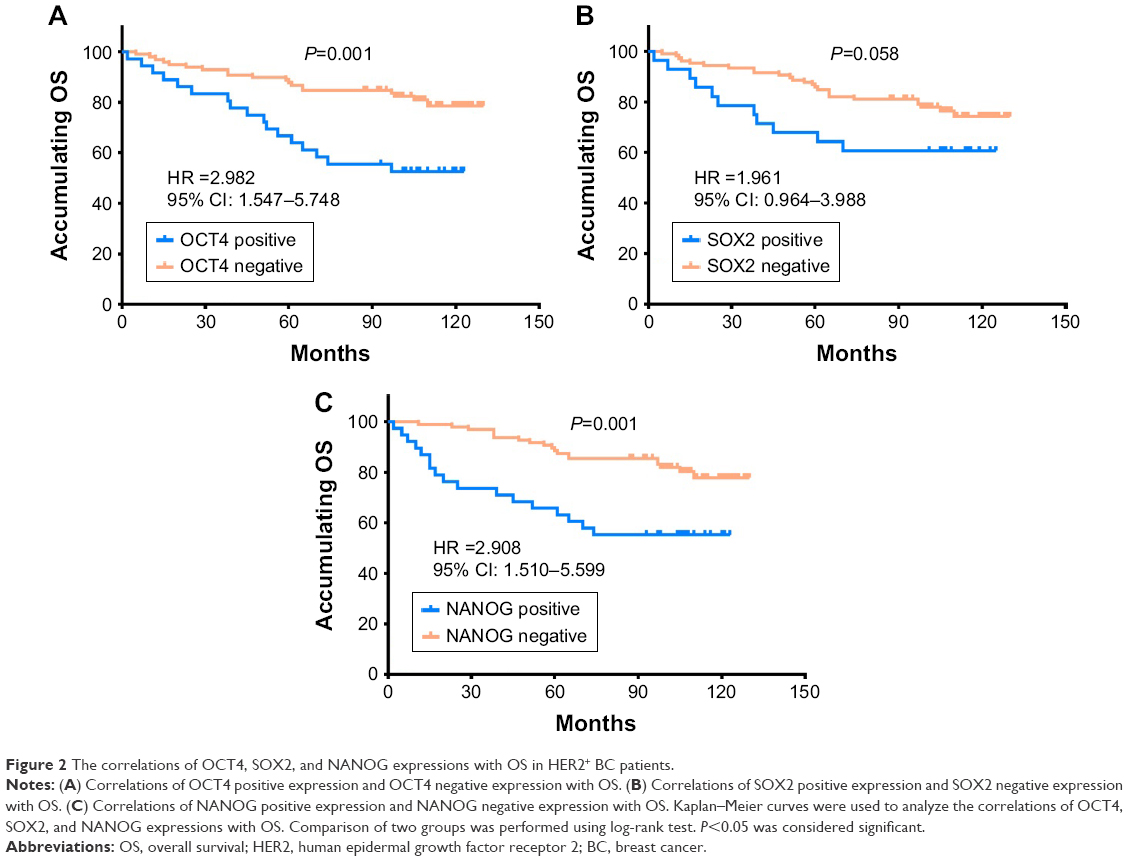 | Figure 2 The correlations of OCT4, SOX2, and NANOG expressions with OS in HER2+ BC patients. |
Correlation between numbers of positive markers and OS in HER2+ BC patients
Compared to patients with no positive marker, patients with at least one positive marker had more unsatisfactory OS (HR 2.879, P=0.001; Figure 3A). Also, patients with at least two positive markers presented with worse OS than patients with one or no positive marker (HR 2.568, P=0.004; Figure 3B). Meanwhile, patients with all three positive markers had shorter OS compared with patients with two or less positive markers (HR 3.773, P<0.001; Figure 3C). These results suggested that co-expression of the three biomarkers disclosed even better predictive value for worse prognosis.
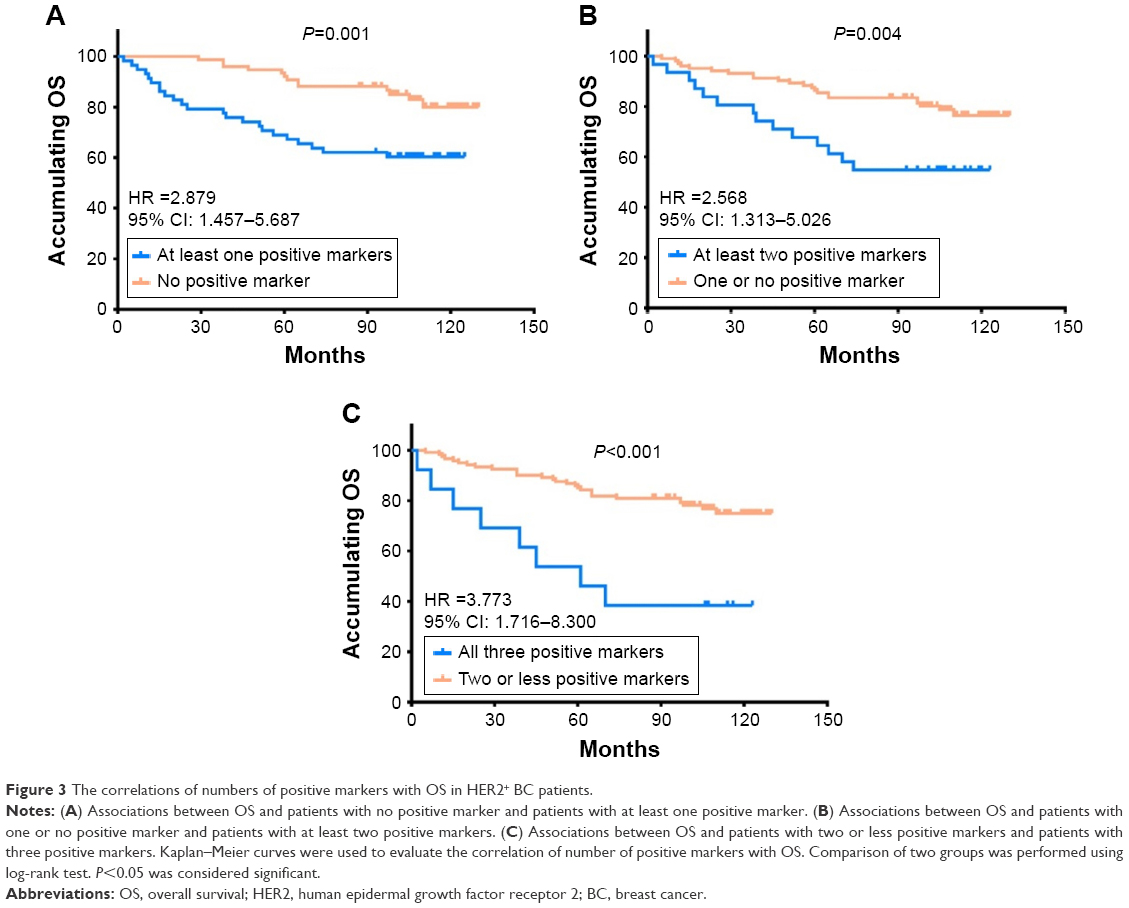 | Figure 3 The correlations of numbers of positive markers with OS in HER2+ BC patients. |
Factors influencing OS analyzed by Cox proportional hazards regression model analysis
The univariate Cox regression analysis revealed that OCT4 positive expression (P=0.001), NANOG positive expression (P=0.001), age ≥50 years (P=0.004), higher pathological grade (P<0.001), tumor size ≥3 cm (P=0.018), higher T stage (P=0.002), higher N stage (P=0.021), and higher TNM stage (P=0.002) were associated with worse OS, while ER positive expression (P=0.017) and PR positive expression (P=0.015) were correlated with better OS (Table 5). Multivariate Cox regression analysis showed that NANOG positive expression (P=0.003), age ≥50 years (P=0.015), and higher pathological grade (P=0.001) could independently predict shorter OS in HER2+ BC patients.
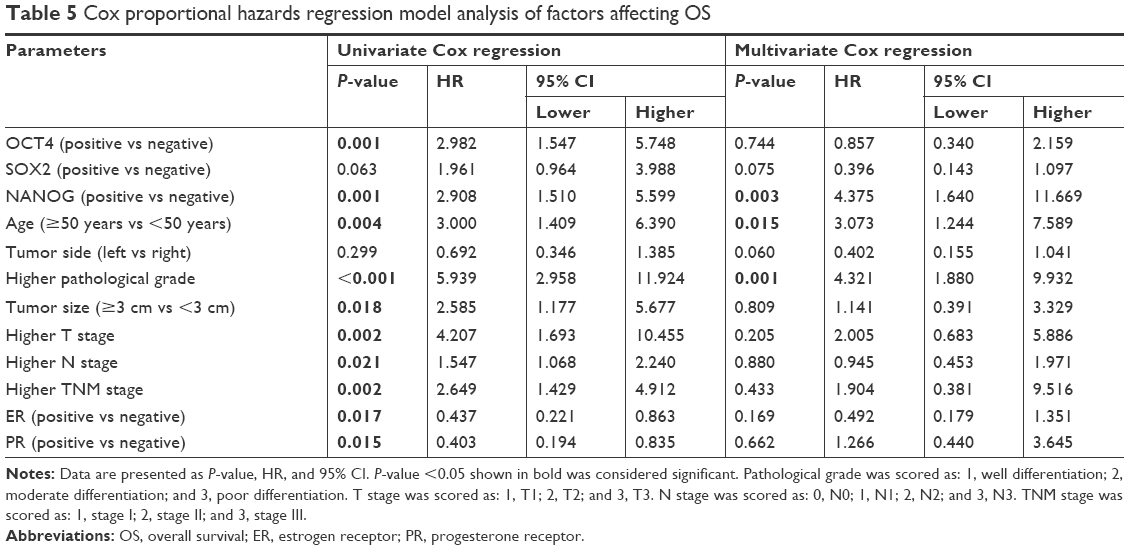 | Table 5 Cox proportional hazards regression model analysis of factors affecting OS |
Discussion
In this study, we observed that in HER2+ BC patients: 1) OCT4, SOX2, and NANOG were overexpressed in tumor tissues compared with paired adjacent tissues. 2) The expressions of OCT4, SOX2, and NANOG were positively associated with poor pathological differentiation and advanced disease stage. 3) OCT4 and NANOG positive expressions were associated with worse OS, while SOX2 positive expression correlated with poor OS but without statistical significance. In addition, co-expression of the three biomarkers revealed an even better predictive value for prognosis.
OCT4, one of the most typical markers of CSCs, has been discovered to play a critical role in the regulation of several genes or signal pathways impacting the function of carcinoma cells. For instance, Chen et al showed that OCT4 has the capacity to induce lung cancer cell metastasis via promoting epithelial–mesenchymal transition (EMT).13 Knockout of OCT4 decreased cell proliferation rate by modulating EMT processes in hepatocellular carcinoma cell lines.8 Moreover, OCT4 overexpression promoted tumorigenesis while inhibiting cell apoptosis through regulation of miR-125b/BAK1 pathways in cervical cancer.9 SOX2 is also an essential CSC marker and regulates cancer cell physiology by promoting oncogenic signaling. Recent studies have demonstrated that SOX2 participates in the regulation of cell functions including cellular proliferation, apoptosis, invasion, migration, and metastasis in various cancers.14 Particularly in BC, SOX2 increased cell proliferation, colony formation, and cell metastasis via upregulating WNT/β-catenin pathway and EMT, as well as downregulating AMPK/mTOR.14–17 NANOG contributes to carcinogenesis via activating and preserving CSC properties by regulating some genes or pathways such as Stat3/Snail signaling, EMT, or FAK signaling in many carcinomas including BC.18–20 Thus, these data suggest that OCT4, SOX2, or NONAG may act as a critical biomarker of tumor progression and development in various cancers.
In clinical studies, OCT4, SOX2, or NONAG is known to be highly expressed and correlated with advanced disease stage in various cancers such as BC, NSCLC, and renal carcinoma.21–23 For example, OCT4 is overexpressed and correlated with higher histological grade, advanced TNM stage, and worse lymph node metastasis in renal carcinoma patients.22 SOX2 is exceedingly expressed and positively associated with lymph node metastasis in NSCLC patients.23 Also, NANOG expression is increased in BC patients and found to be correlated with lymph node metastasis.21 Thus, the previous studies indicate that OCT4, SOX2, and NANOG expressions are associated with advanced disease conditions in patients with several carcinomas. In line with the previous data, we found that OCT4, SOX2, and NANOG contributed to poor pathological differentiation, larger tumor size, and elevated TNM stage in HER2+ BC patients. This result might be because OCT4, SOX2, or NANOG promotes cell proliferation, migration, and invasion via mediating multiple functional pathways, such as WNT/β-catenin, EGFR, mTOR, and HH signaling, thereby contributing to poor differentiation and advanced disease stage in HER2+ BC patients.
Concerning the predictive value for patients’ outcomes, several previous studies have demonstrated that high expression of OCT4, SOX2, or NANOG is associated with shorter OS in patients with other carcinomas including colorectal cancer, gastric cancer, rectal cancer, and so on.21,24–31 Partly in accordance with these previous data, we discovered that OCT4 and NANOG overexpressions were correlated with poor OS in HER2+ BC patients, which might result from the following: 1) OCT4 and NANOG impact on cancer cell functions such as proliferation, migration, invasion, and metastasis via mediating multiple pathways to aggravate disease severity, thereby leading to unfavorable prognosis in HER2+ BC patients and 2) OCT4 and NANOG can increase chemoresistance to weaken drug efficacy, thereby causing poor prognosis in HER2+ BC patients. However, we also found that SOX2 positive expression was numerically associated with shorter OS in HER2+ BC patients, but without statistical significance, which might be caused by insufficient statistical power resulting from relatively small sample size and tumor heterogeneity in this study. In addition, co-expression of the three CSC markers including OCT4, SOX2, and NANOG exhibited even better prognostic value than individual parameters, which might facilitate the application of individual therapy in HER2+ BC patients to some extent.
There were some limitations in our study. Firstly, all patients included in this study were from one center, and hence, the study was subject to selection bias. Secondly, the sample size was relatively small, which might cause less statistical power. Thirdly, the underlying mechanisms of OCT4, SOX2, and NANOG in HER2+ patients were not investigated in this study. Thus, further study with a larger sample size from multiple centers is needed.
In summary, OCT4, SOX2, and NANOG positive expressions correlate with poor differentiation and advanced disease stage, and OCT4 and NANOG present with predictive values for poor OS in HER2+ BC patients.
Disclosure
The authors report no conflicts of interest in this work.
References
Siegel RL, Miller KD, Jemal A. Cancer Statistics, 2017. CA Cancer J Clin. 2017;67(1):7–30. | ||
Haghighat S, Akbari ME, Ghaffari S, Yavari P. Standardized breast cancer mortality rate compared to the general female population of Iran. Asian Pac J Cancer Prev. 2012;13(11):5525–5528. | ||
Carlomagno C, Perrone F, Gallo C, et al. c-erb B2 overexpression decreases the benefit of adjuvant tamoxifen in early-stage breast cancer without axillary lymph node metastases. J Clin Oncol. 1996;14(10):2702–2708. | ||
Pritchard KI, Shepherd LE, O’Malley FP, et al. HER2 and responsiveness of breast cancer to adjuvant chemotherapy. N Engl J Med. 2006;354(20):2103–2111. | ||
Wolff AC, Hammond ME, Hicks DG, et al. Recommendations for human epidermal growth factor receptor 2 testing in breast cancer: American Society of Clinical Oncology/College of American Pathologists clinical practice guideline update. J Clin Oncol. 2013;31(31):3997–4013. | ||
Asada S, Choi Y, Yamada M, et al. External control of Her2 expression and cancer cell growth by targeting a Ras-linked coactivator. Proc Natl Acad Sci U S A. 2002;99(20):12747–12752. | ||
Arteaga CL, Sliwkowski MX, Osborne CK, Perez EA, Puglisi F, Gianni L. Treatment of HER2-positive breast cancer: current status and future perspectives. Nat Rev Clin Oncol. 2011;9(1):16–32. | ||
Xu G, Qi F, Zhang J, Xu J, Shi T, Miao Y. Overexpression of OCT4 contributes to progression of hepatocellular carcinoma. Tumour Biol. 2016;37(4):4649–4654. | ||
Wang YD, Cai N, Wu XL, Cao HZ, Xie LL, Zheng PS. OCT4 promotes tumorigenesis and inhibits apoptosis of cervical cancer cells by miR-125b/BAK1 pathway. Cell Death Dis. 2013;4:e760. | ||
Toschi L, Finocchiaro G, Nguyen TT, et al. Increased SOX2 gene copy number is associated with FGFR1 and PIK3CA gene gain in non-small cell lung cancer and predicts improved survival in early stage disease. PLoS One. 2014;9(4):e95303. | ||
Zhang JM, Wei K, Jiang M. OCT4 but not SOX2 expression correlates with worse prognosis in surgical patients with triple-negative breast cancer. Breast Cancer. 2018;25(4):447–455. | ||
Lessey BA, Castelbaum AJ, Sawin SW, et al. Aberrant integrin expression in the endometrium of women with endometriosis. J Clin Endocrinol Metab. 1994;79(2):643–649. | ||
Chen ZS, Ling DJ, Zhang YD, Feng JX, Zhang XY, Shi TS. Octamer-binding protein 4 affects the cell biology and phenotypic transition of lung cancer cells involving β-catenin/E-cadherin complex degradation. Mol Med Rep. 2015;11(3):1851–1858. | ||
Liu K, Lin B, Zhao M, et al. The multiple roles for Sox2 in stem cell maintenance and tumorigenesis. Cell Signal. 2013;25(5):1264–1271. | ||
Stolzenburg S, Rots MG, Beltran AS, et al. Targeted silencing of the oncogenic transcription factor SOX2 in breast cancer. Nucleic Acids Res. 2012;40(14):6725–6740. | ||
Li X, Xu Y, Chen Y, et al. SOX2 promotes tumor metastasis by stimulating epithelial-to-mesenchymal transition via regulation of WNT/β-catenin signal network. Cancer Lett. 2013;336(2):379–389. | ||
Lengerke C, Fehm T, Kurth R, et al. Expression of the embryonic stem cell marker SOX2 in early-stage breast carcinoma. BMC Cancer. 2011;11:42. | ||
Wong OG, Cheung AN. Stem cell transcription factor NANOG in cancers – is eternal youth a curse? Expert Opin Ther Targets. 2016;20(4):407–417. | ||
Yin X, Zhang BH, Zheng SS, et al. Coexpression of gene Oct4 and Nanog initiates stem cell characteristics in hepatocellular carcinoma and promotes epithelial-mesenchymal transition through activation of Stat3/Snail signaling. J Hematol Oncol. 2015;8:23. | ||
Golubovskaya VM. FAK and Nanog cross talk with p53 in cancer stem cells. Anticancer Agents Med Chem. 2013;13(4):576–580. | ||
Gwak JM, Kim M, Kim HJ, Jang MH, Park SY. Expression of embryonal stem cell transcription factors in breast cancer: Oct4 as an indicator for poor clinical outcome and tamoxifen resistance. Oncotarget. 2017;8(22):36305–36318. | ||
Yu B, Cai H, Xu Z, Xu T, Zou Q, Gu M. Expressions of stem cell transcription factors Nanog and Oct4 in renal cell carcinoma tissues and clinical significance. Artif Cells Nanomed Biotechnol. 2016;44(8):1818–1823. | ||
Li X, Wang J, Xu Z, et al. Expression of Sox2 and Oct4 and their clinical significance in human non-small-cell lung cancer. Int J Mol Sci. 2012;13(6):7663–7675. | ||
Wang D, Lu P, Zhang H, et al. Oct-4 and Nanog promote the epithelial-mesenchymal transition of breast cancer stem cells and are associated with poor prognosis in breast cancer patients. Oncotarget. 2014;5(21):10803–10815. | ||
Liu CG, Lu Y, Wang BB, et al. Clinical implications of stem cell gene Oct-4 expression in breast cancer. Ann Surg. 2011;253(6):1165–1171. | ||
Liu T, Sun B, Zhao X, et al. OCT4 expression and vasculogenic mimicry formation positively correlate with poor prognosis in human breast cancer. Int J Mol Sci. 2014;15(11):19634–19649. | ||
Neumann J, Bahr F, Horst D, et al. SOX2 expression correlates with lymph-node metastases and distant spread in right-sided colon cancer. BMC Cancer. 2011;11:518. | ||
Tian Y, Jia X, Wang S, et al. SOX2 oncogenes amplified and operate to activate AKT signaling in gastric cancer and predict immunotherapy responsiveness. J Cancer Res Clin Oncol. 2014;140(7):1117–1124. | ||
Saigusa S, Tanaka K, Toiyama Y, et al. Correlation of CD133, OCT4, and SOX2 in rectal cancer and their association with distant recurrence after chemoradiotherapy. Ann Surg Oncol. 2009;16(12):3488–3498. | ||
Nagata T, Shimada Y, Sekine S, et al. KLF4 and NANOG are prognostic biomarkers for triple-negative breast cancer. Breast Cancer. 2017;24(2):326–335. | ||
Jin C, Zhang X, Sun M, Zhang Y, Zhang G, Wang B. Clinical implications of the coexpression of SRC1 and NANOG in HER-2-overexpressing breast cancers. Onco Targets Ther. 2016;9:5483–5488. |
 © 2018 The Author(s). This work is published and licensed by Dove Medical Press Limited. The full terms of this license are available at https://www.dovepress.com/terms.php and incorporate the Creative Commons Attribution - Non Commercial (unported, v3.0) License.
By accessing the work you hereby accept the Terms. Non-commercial uses of the work are permitted without any further permission from Dove Medical Press Limited, provided the work is properly attributed. For permission for commercial use of this work, please see paragraphs 4.2 and 5 of our Terms.
© 2018 The Author(s). This work is published and licensed by Dove Medical Press Limited. The full terms of this license are available at https://www.dovepress.com/terms.php and incorporate the Creative Commons Attribution - Non Commercial (unported, v3.0) License.
By accessing the work you hereby accept the Terms. Non-commercial uses of the work are permitted without any further permission from Dove Medical Press Limited, provided the work is properly attributed. For permission for commercial use of this work, please see paragraphs 4.2 and 5 of our Terms.