")
Back to Journals » Clinical Ophthalmology » Volume 16
OCT-Angiography Changes in Patients with Diabetic Macular Edema Treated with Intravitreal Dexamethasone Implant
Authors Carnota-Méndez P, Méndez-Vázquez C, Pérez-Gavela C
Received 23 October 2021
Accepted for publication 10 January 2022
Published 2 February 2022 Volume 2022:16 Pages 247—263
DOI https://doi.org/10.2147/OPTH.S345947
Checked for plagiarism Yes
Review by Single anonymous peer review
Peer reviewer comments 3
Editor who approved publication: Dr Scott Fraser
Pablo Carnota-Méndez, Carlos Méndez-Vázquez, Conchi Pérez-Gavela
Centro de Ojos de La Coruña, A Coruña, Spain
Correspondence: Pablo Carnota-Méndez
Centro de Ojos de La Coruña, Avenida, Rúa Santiago Rey Fernández Latorre, 120, A Coruña, 15006, Spain
, Tel +34 981168012
, Email [email protected]
Purpose: To evaluate, using optical coherence tomography angiography (OCTA), the impact of intravitreal dexamethasone (DEX) implant on quantitative vascular measurements in patients with diabetic macular edema (DME).
Methods: Prospective, randomized, and open-label study. Primary endpoints were mean changes in vessel density (VD) and vascular perfusion (VP) in superficial capillary plexus (SCP) and VP in deep capillary plexus (DCP) and peripapillary capillary plexus (PCP).
Results: Thirty-four eyes from 19 patients were included. Mean age was 67.4± 7.3 years and 24 (76.5%) were men. VD in SCP in the 6 mm × 6 mm perifoveal ring was significantly decreased from 15.2± 2.7 mm/mm2 at baseline to 13.5± 3.1 at month-2, p, 0.0029. VP in SCP in the 6 mm × 6 mm perifoveal ring decreased significantly from baseline to month-2 (mean change − 3.8%; 95% confidence-interval: − 7.7% to − 1.7%, p, 0.0028). Compared to baseline, the VP in DCP was significantly reduced at month 2 in the perifoveal ring of the 6 mm × 6 mm scan (p, 0.0063), and in the parafoveal ring of the 6 mm × 6 mm scan (p, 0.0048). Foveal avascular zone (FAZ) area did not change throughout the study. Central macular thickness significantly decreased from baseline in 210.3 μm (149.9– 270.8 μm) and 201.8 μm (140.4– 263.3 μm), p < 0.0001 each at month-2 and month-3, respectively.
Conclusions: Besides functional and anatomical improvements, DEX implant significantly reduced VD and VP in DME patients.
Keywords: diabetes, diabetic macular edema, OCTA, vessels density, vascular perfusion, diabetic retinopathy
Introduction
As the prevalence of diabetes rises, the relevance of diabetic eye disease increases.1–3 Diabetic macular edema (DME) is the leading cause of vision loss in diabetic patients. DME is a chronic, multifactorial, sight-threatening condition that critically impacts on the patient’s quality of life.4,5 The prevalence of any type of DME in Europe was 3.7%, and its pooled mean annual incidence in type-2-diabetes patients was 0.4%.3
Although the pathophysiology of DME is not fully understood, hyperglycemia seems to be the main risk factor involved in its development. Through several pathways, proinflammatory molecules (interleukins, adhesion molecules and other cytokines) and apoptotic factors are released. All these molecular changes lead to endothelial cells and pericytes degeneration and breakdown of the blood retinal barrier. Furthermore, a disbalance between pro- and antiangiogenic factors occurs. Thus, vascular endothelial growth factor (VEGF) is upregulated, and platelet-derived growth factor (PEDF) is downregulated. All these changes result in diabetic retinopathy (DR) and DME.6,7
In addition to molecular changes, vision in patients with DME can also be impaired by mechanical factors, such as epiretinal membrane and vitreomacular traction syndrome.8
Among the different options for treating DME, intravitreal therapy, either with VEGF inhibitors, or with sustained-released dexamethasone (DEX) implants, has emerged as the first-line treatment in center-involving DME.9
Fluorescein angiography (FA) first and optical coherence tomography (OCT) later have been used to assess diagnosis and follow-up of DME.
Optical coherence tomography angiography (OCTA) has further improved the knowledge of vascular changes underlying DR and DME.10,11
OCTA detects the motion of erythrocytes through a series of technical improvements, in speed and sensitivity, of OCT imaging platform.12 OCTA allows the possibility to study both qualitative and quantitative vascular changes in the four vascular plexuses that supply blood to the retina, namely the superficial (SCP) and deep (DCP) capillary plexuses, the choriocapillaris, and the radial peripapillary capillary network.12,13
Because DME is associated with retinal microvascular changes,14 OCTA may be a useful tool to assess the effect of DEX implant on the retinal vascular plexuses and to evaluate the ability of this treatment to reverse diabetic pathological features. There are several studies that analyze the macular perfusion changes using OCTA in patients with DME treated with anti-VEGF drugs with inconclusive results.15–17 On the other hand, there is evidence suggesting qualitative changes in both the SCP and DCP in DME patients treated with DEX implant.18,19 However, no quantitative changes in OCTA measures have been found.18
This study aimed to evaluate the impact of DEX implant on quantitative vascular measurements, assessed by OCTA, in DME patients. Additionally, this study also aimed to evaluate the potential relationship between quantitative vascular changes and clinical, either functional or anatomic, outcomes.
Methods
Design
Prospective, non-randomized, and open-label study. The study protocol was approved by the Ethical Committee for Clinical Research of Galicia (CEIC). Informed consent was obtained from all individual participants included in the study. This study complied with the guidelines of Good Clinical Practice and adhered to the tenets of the Declaration of Helsinki.
Participants
The study was conducted on consecutive referred or recruited patients with DME, who underwent treatment with DEX implant between September 2019 and August 2020.
Inclusion criteria were type 1 or 2 diabetes and center-involving DME; age ≥50 years; baseline best-corrected visual acuity (BCVA) from 0.1 to 1.0 (logMar test); baseline central macular thickness (CMT) ≥250 µm as measured by spectral-domain OCT (SD-OCT).
Patients with macular edema secondary to other causes than diabetes mellitus; history of glaucoma or ocular hypertension (defined as intraocular pressure, IOP, > 21 mm Hg under ocular hypotensive treatment); those who underwent DEX implant in the prior 6 months or anti-VEGF drugs in the prior 3 months; and/or those who underwent any major surgical procedure, including cataract, within 6 months preceding the baseline visit, were excluded of the study.
Procedures
Study subjects underwent basic ophthalmic exams, including BCVA, IOP, slit-lamp, and fundus examination. Patients with high clinical suspicion of DME were definitely diagnosed after an SD-OCT exam. Quantitative data obtained from SD-OCT were CMT (automatic value of mean retinal thickness of the central circle of 1 mm of diameter), macular volume (MV) (automatic value of retinal volume of central 6 mm × 6 mm cube) and central choroidal thickness (CCT) (manually measured subfoveal choroidal thickness). SD-OCT biomarkers of DME were also registered. All subjects underwent an OCTA examination with the AngioPlex Cirrus 5000 (Carl Zeiss Meditec) system that uses the optical microangiography (OMAG) algorithm. OCTA imaging included macular scans of 3 mm × 3 mm and 6 mm × 6 mm centered at the fovea, and peripapillary scans of 4.5 mm × 4.5 mm centered at the disc. OCT-A scans with a signal strength index worse than 7 were discarded. Best quality images were retained for further quantitative and qualitative analysis.
Segmentation of both SCP and DCP plexuses and quantitative analyses of SCP plexus and peripapillary capillary plexus (PCP) were based on the default settings of the automated software algorithm of the AngioPlex. Quantitative analysis of DCP was performed by a custom analysis.
Quantitative vascular measurements of SCP were vessel density (VD) (mm of vessels per mm2 of area) and vascular perfusion (VP) (% of area occupied by vessels). Since SCP has vessels of different caliber, VP could be influenced more by large caliber vessels. To avoid this theoretical bias, vessels are skeletonized to measure the millimeters of vessel length per area unit. Thus, vessel density is obtained. This difference between VD and VP does not occur in DCP since all vessels within this plexus have the same caliber.20 This is the reason VD and VP were measured in the SCP but only VP was measured in the DCP in our study. In PCP, only VP was measured, since the software does not have the function of skeletonizing this plexus (Figure 1).
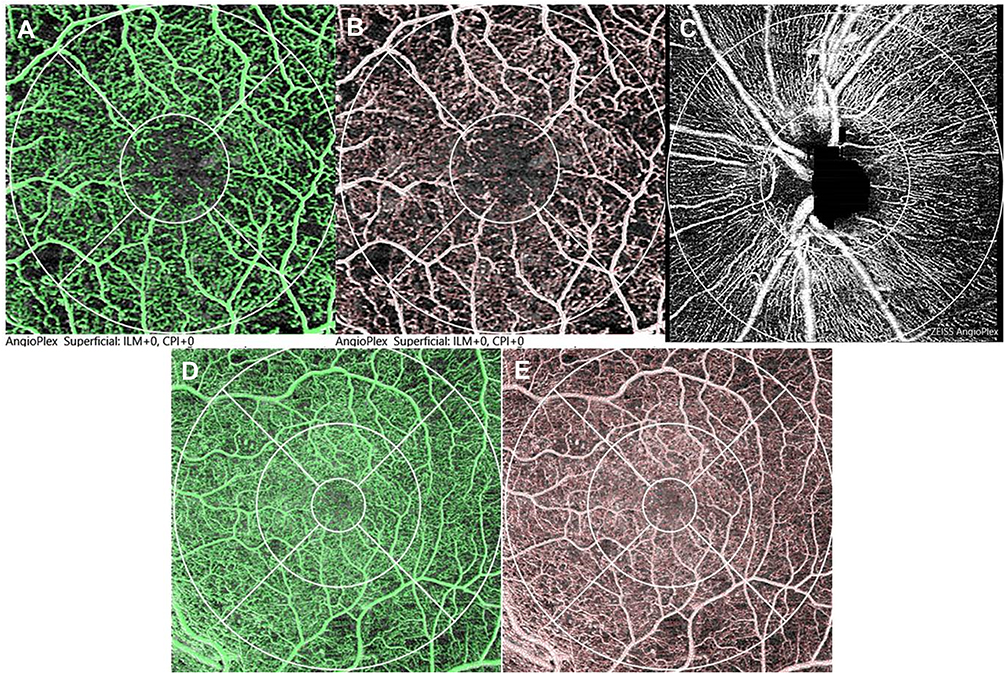 |
Figure 1 Optical coherence tomography angiography (OCT-A) images. (A) OCT-A 3 mm x 3 mm scans showing vascular perfusion (VP) (green pixels) in superficial capillary plexus (SCP). The grid shows center (1 mm diameter circle, centered in fovea) and perifoveal ring (1 mm to 3 mm from fovea). (B) OCT-A 3 mm x 3mm scans showing vascular density (VD) (red lines, (B) SCP. The grid shows center (1 mm diameter circle, centered in fovea) and perifoveal ring (1 mm to 3 mm from fovea). (C) OCT-A 4.5 mm x 4.5 mm scan showing VP (white pixels) in peripapillary capillary plexus. The grid shows peripapillary ring (1.5 mm to 4.5 mm from disc center). (D) OCT-A 6 mm x 6 mm scans showing VP (green pixels) in deep capillary plexus (DCP). The grid shows center (1 mm diameter circle, centered in fovea), perifoveal ring (1 mm to 3 mm from fovea) and parafoveal ring (3 mm to 6 mm from fovea). E. OCT-A 6 mm x 6 mm scans showing VD (red lines, (E) in deep capillary plexus (DCP). The grid shows center (1 mm diameter circle, centered in fovea), perifoveal ring (1 mm to 3 mm from fovea) and parafoveal ring (3 mm to 6 mm from fovea). |
Vascular perfusion of DCP was obtained as follows: images obtained from the built-in software of AngioPlex were processed first with the Adobe Photoshop program (Adobe Systems Inc., Mountain View, CA). The perfusion area was calculated within a user defined circular region of interest (ROI). Perifoveal ring (3 mm of diameter, centered at the fovea) in 3 × 3 scans and perifoveal and parafoveal rings (3 mm and 6 mm of diameter, respectively, centered at the fovea) in 6 × 6 scans were obtained. The images were then consecutively converted to 8-bit grayscale images, binarized and thresholded with ImageJ software version 1.52 (National Institutes of Health, Bethesda, MD). Percentages of white and black pixels were automatically counted. Vascular perfusion was calculated by scoring the percentage of white pixels in relation to the number of total pixels.
FAZ area and circularity index were also automatically measured with OCTA. FAZ size is smaller in DCP than in SCP. However, many OCTA devices, including AngioPlex, do not properly segment the FAZ and include the DCP FAZ within the SCP.12 This is the reason we did not consider making a difference between FAZ in SCP and FAZ in DCP (as it is done in many papers), and we mention it simply as FAZ.
Patient Visits
This protocol included one baseline visit and three follow-up visits at months 1, 2, and 3 (± 2 weeks) after DEX implant.
Outcomes
Primary endpoints were mean changes from baseline to month-2 in VD and VP in SCP and VP in DCP in perifoveal ring in 3 mm × 3 mm scans and in perifoveal and parafoveal rings in 6 mm × 6 mm scans. Another primary endpoint was a change from baseline to month-2 in VP in PCP.
Secondary endpoints included mean changes in BCVA; CMT; MV; CCT; total VD and VP in 3 × 3 and 6 × 6 scans; mean changes in VD and VP in superior, inferior, temporal, and nasal retinal quadrants of perifoveal and parafoveal rings; and mean changes in FAZ area and circularity index.
Statistical analysis
A standard statistical analysis was performed using the MedCalc® Statistical Software version 20.013 (MedCalc Software Ltd, Ostend, Belgium; https://www.medcalc.org; 2021).
Thirty-two subjects need to be included for detecting a mean difference of 1.5 mm/mm2 in VD, with a type I error of 0.05 and a power of the 90%, assuming a standard deviation of 2.5 mm2.
Missing data of continuous variables were allocated using an algorithm of multiple imputation.21
Data were tested for normal distribution using a D’Agostino-Pearson test.
A repeated measures ANOVA or a Friedman’s two-way analysis test, as appropriate, were used to assess changes in quantitative variables throughout the study. Post hoc analysis of pairwise comparisons was done with the Scheffé’s method (ANOVA) or the Conover method (Friedman).
To explore the relationship between quantitative OCTA values (VD and VP in SCP; VP in DCP; and FAZ area) and clinical outcomes (BCVA and CMT) a partial correlation coefficient, adjusted by age and duration of diabetes, was performed.
Categorical variables were compared using a Chi-square test and a Fisher’s exact test, as needed. P value of less than 0.05 was considered significant.
Results
Among the 34 subjects who fulfilled the respective demands of the inclusion and exclusion criteria, eight patients were lost to follow-up due to coronavirus disease (COVID)-19 pandemic lockdowns and restrictions, and seven had poor quality baseline OCTA images. A total of 34 eyes from 19 patients of the 34 selected patients were included in the analysis. Mean (95% confidence interval; CI) age was 67.4 (64.9 to 69.9) years and 8 (23.5%) were women. Baseline demographic and clinical characteristics are summarized in Table 1.
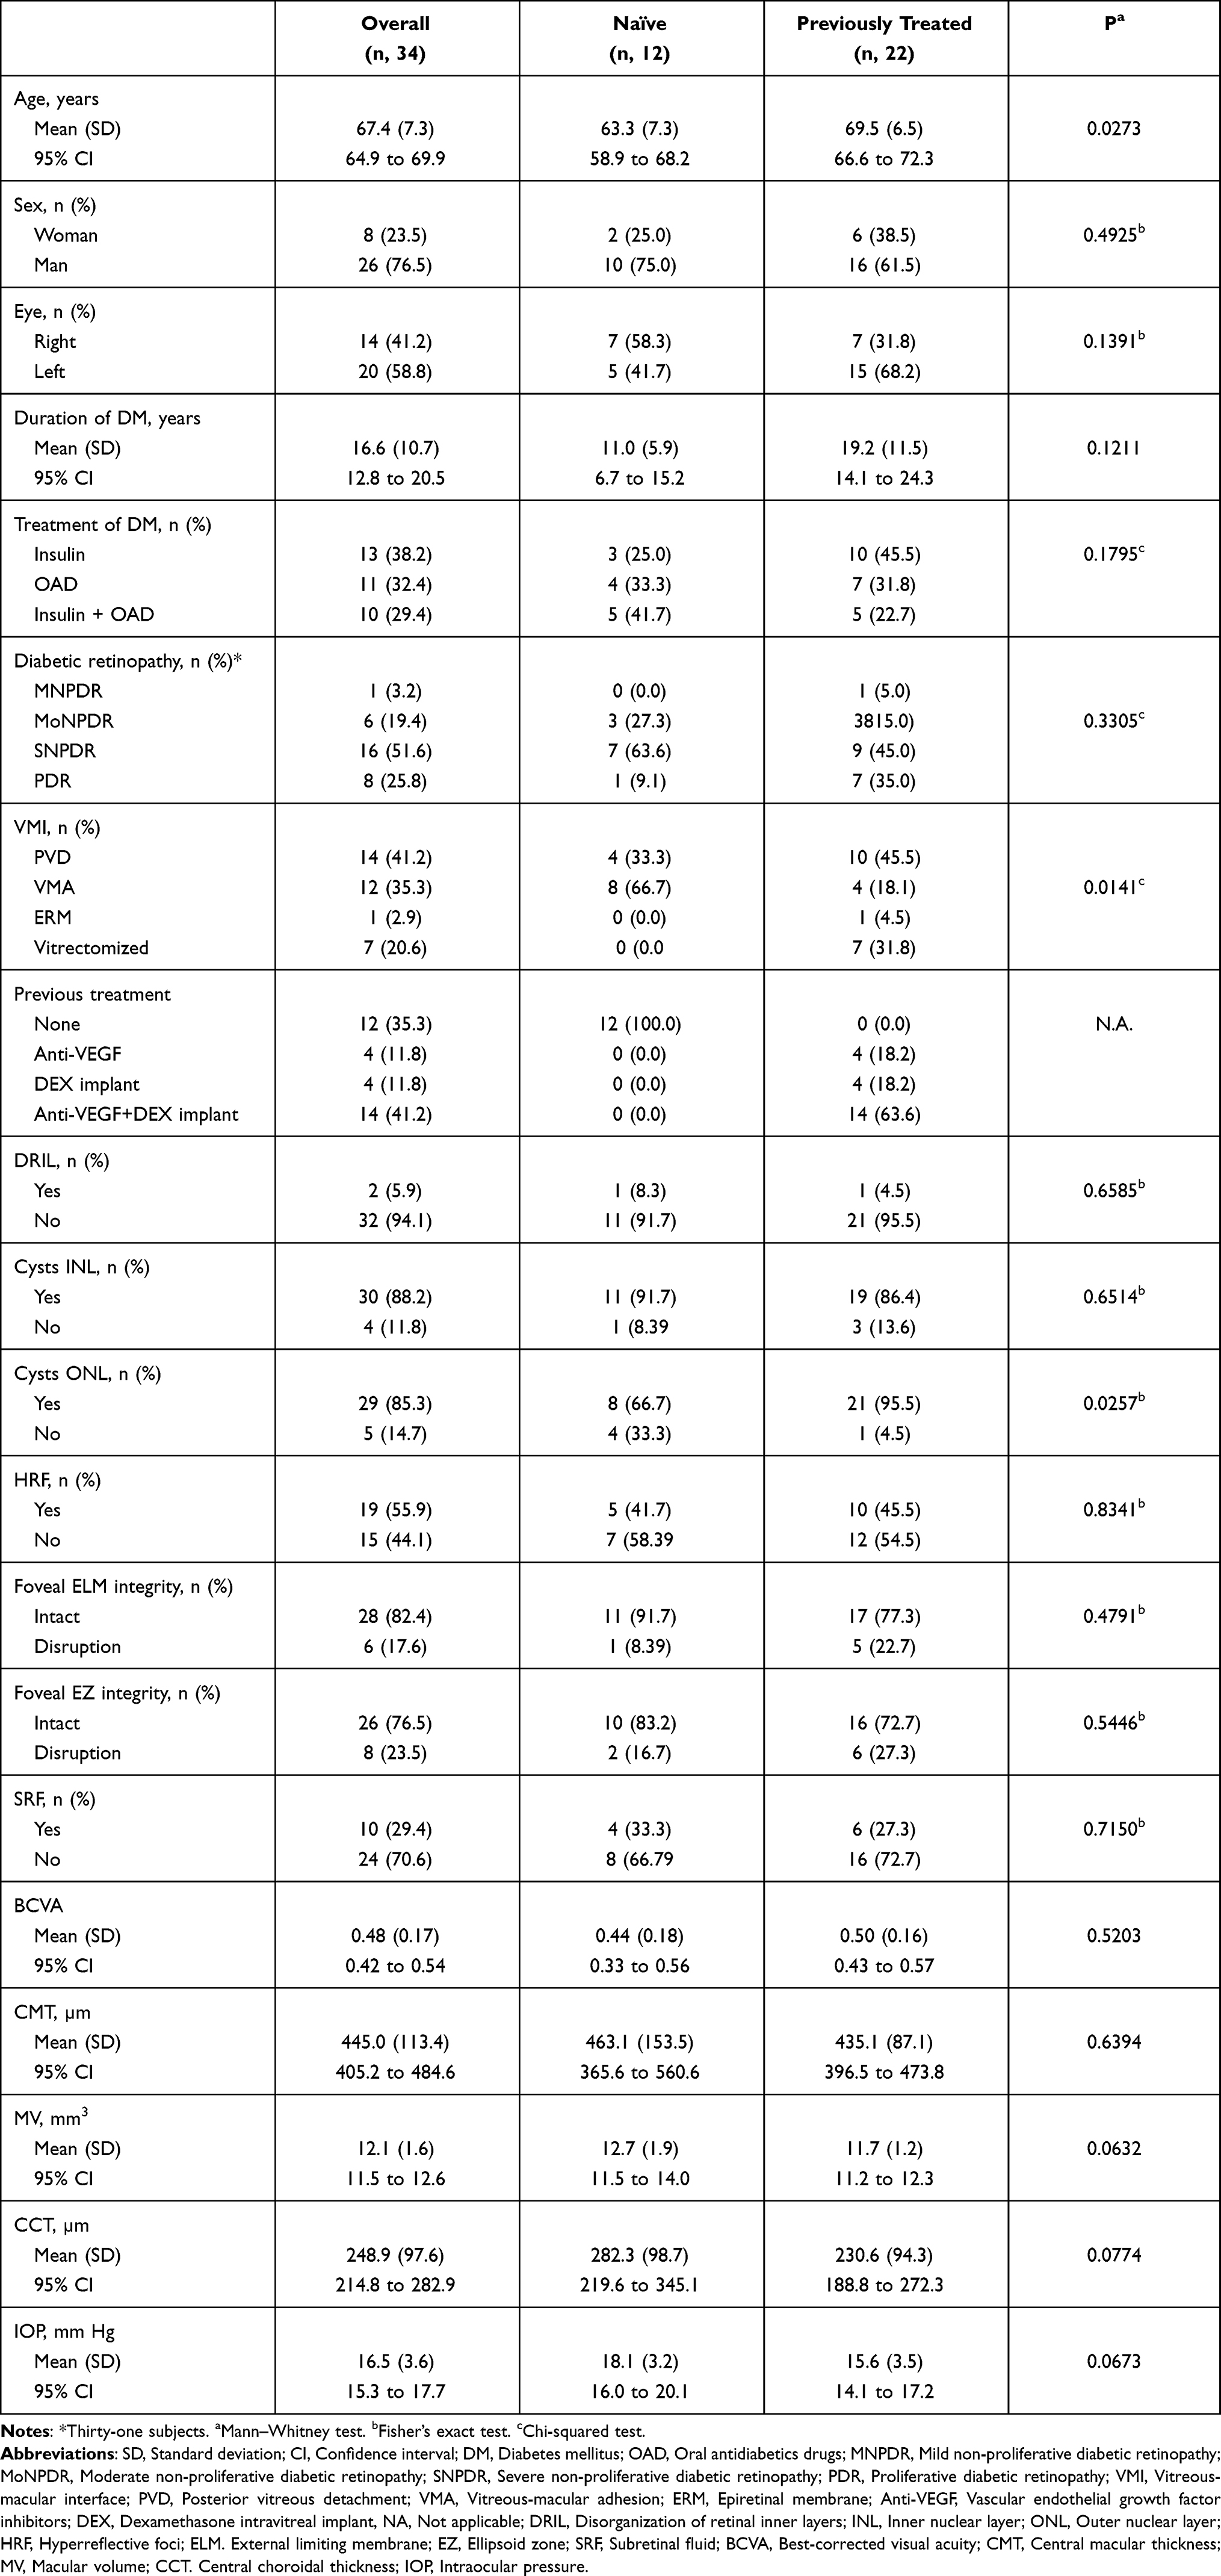 |
Table 1 Main Baseline Demographic and Clinical Characteristics |
Table 2 shows the VD of the SCP in 3 mm × 3 mm and 6 mm × 6 mm scans. In month 2, VD in the 6 mm × 6 mm perifoveal ring was significantly lower as compared to the baseline (mean difference −1.75; 95% CI: −2.84 to −0.64, p, 0.0029). Although the values in all quadrants of the 6 mm × 6 mm perifoveal ring showed a trend (p < 0.1000), only the nasal quadrant was statistically significant (mean difference −1.58; 95% CI: −3.25 to −0.76, p, 0.0021) (Table 2). None of the other VD measurements (perifoveal ring in 3 × 3 scan and parafoveal ring in 6 × 6 scan) experienced significant changes, although numerical values at month 2 were lower, when compared to baseline (Table 2).
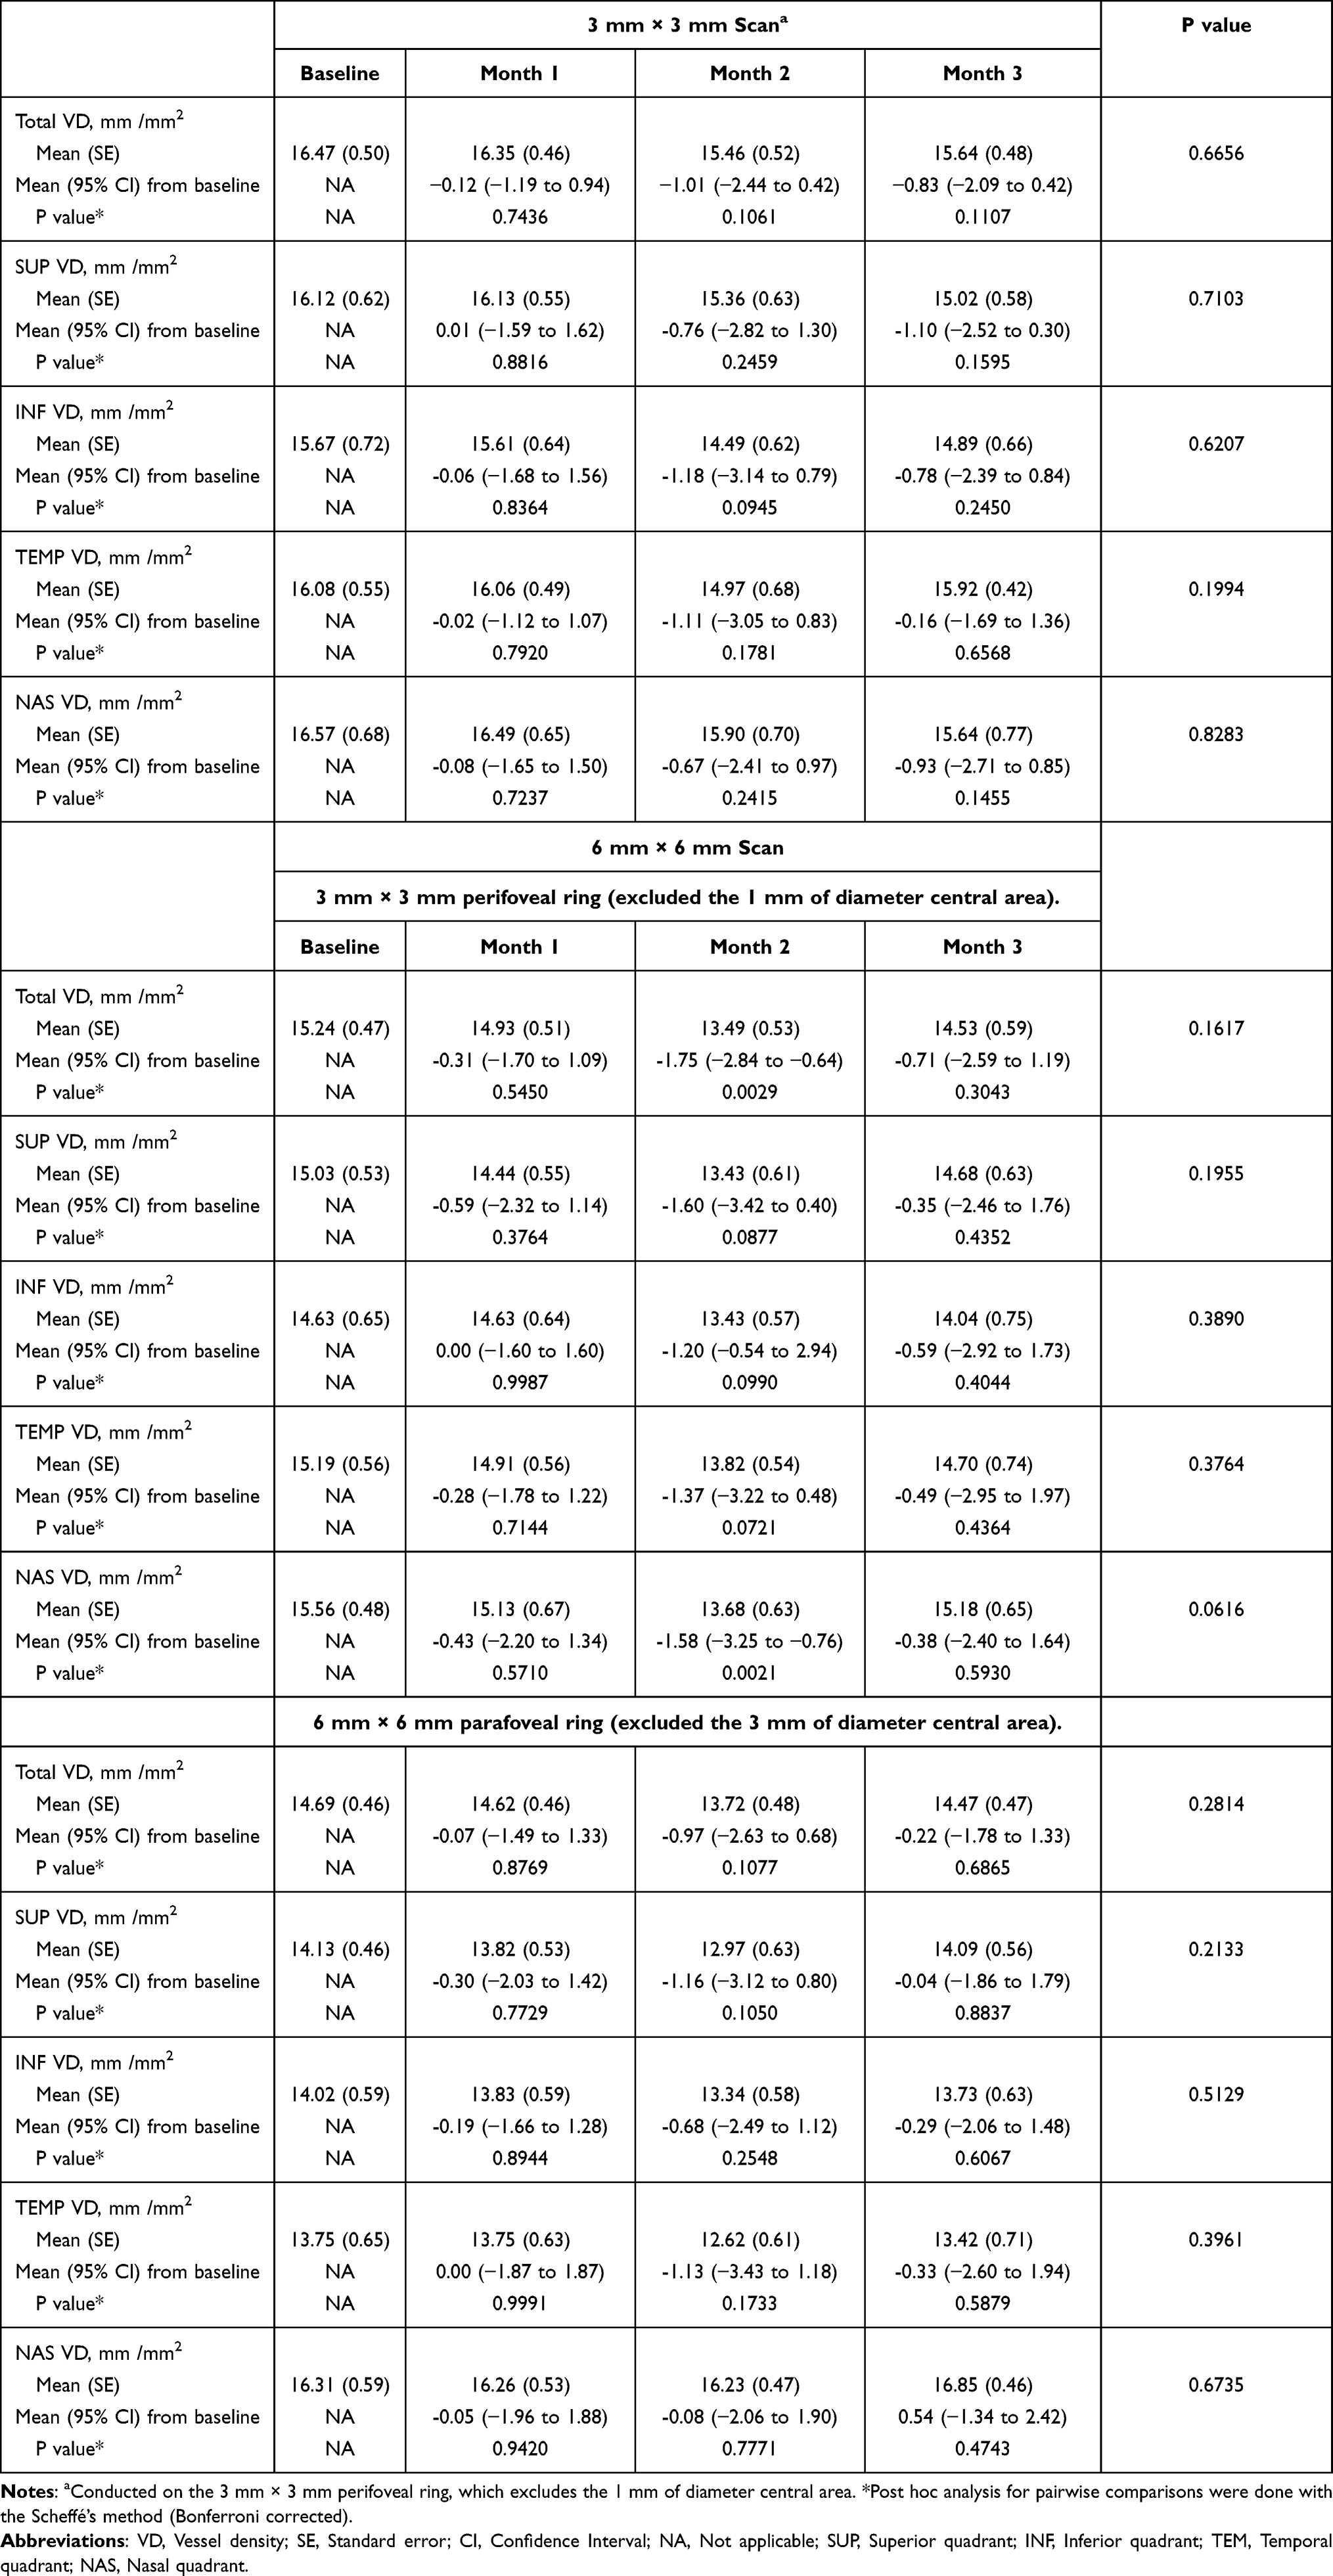 |
Table 2 Overview of Vessel Density in the Superficial Capillary Plexus in 3 mm × 3 mm and 6 mm × 6 mm Scans. P Values were Calculated Using Repeated Measures ANOVA and the Greenhouse–Geisser Correction |
Regarding VP in SCP, there were no changes in 3 mm × 3 mm scan throughout the study, with the exception of the temporal quadrant at month 2. Nevertheless, at month 2, VP was significantly decreased in the 6 mm × 6 mm perifoveal ring in the overall (mean difference −3.79%, 95% CI: −7.70% to −1.68%, p, 0.0028) and in all the different quadrants (p, 0.0131, p, 0.0144, p, 0.0112, and p, 0.0022 at the superior, inferior, temporal, nasal quadrants, respectively) as compared to baseline (Table 3). VP changes in the 6 mm × 6 mm parafoveal ring showed a trend (p < 0.10) in the overall and in all quadrants except in the inferior quadrant, but none of them were significant.
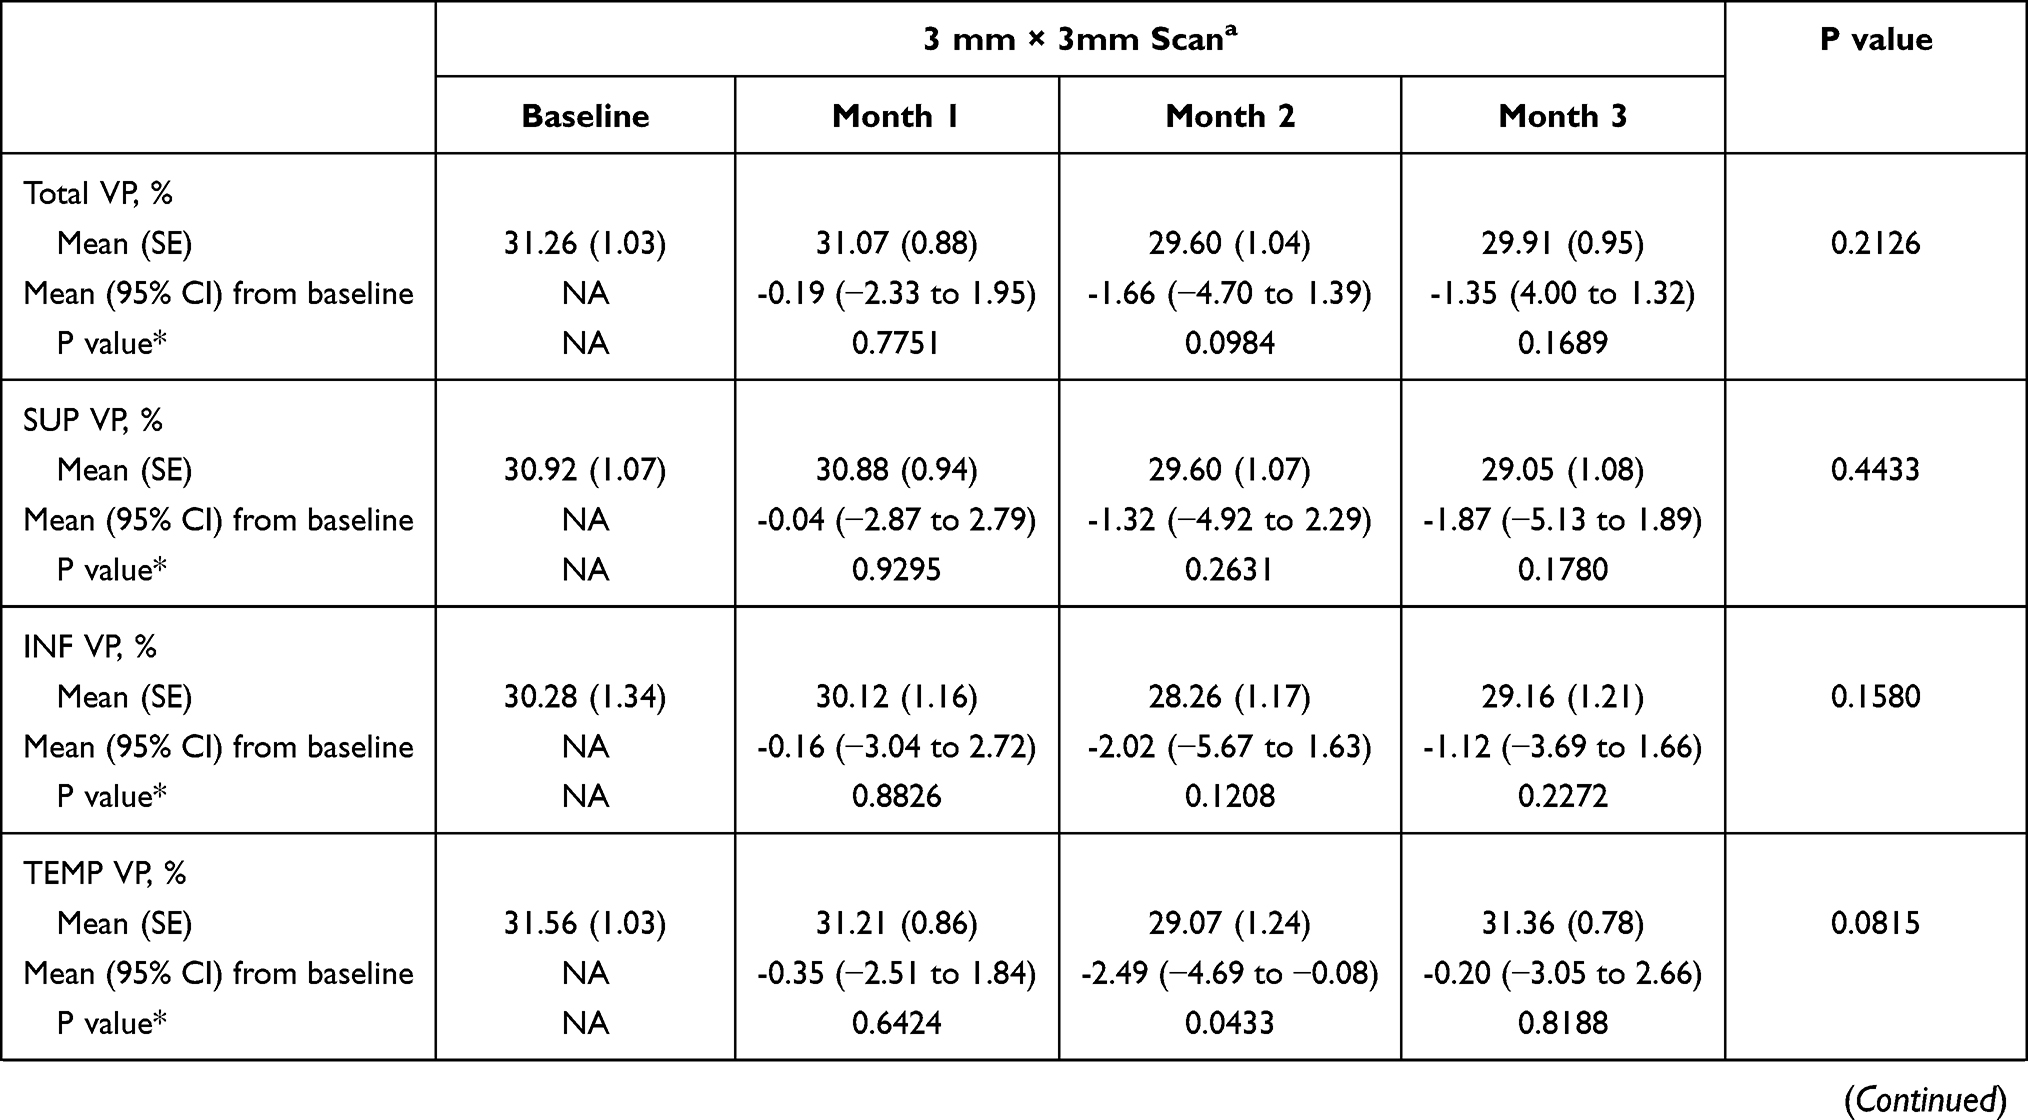 | 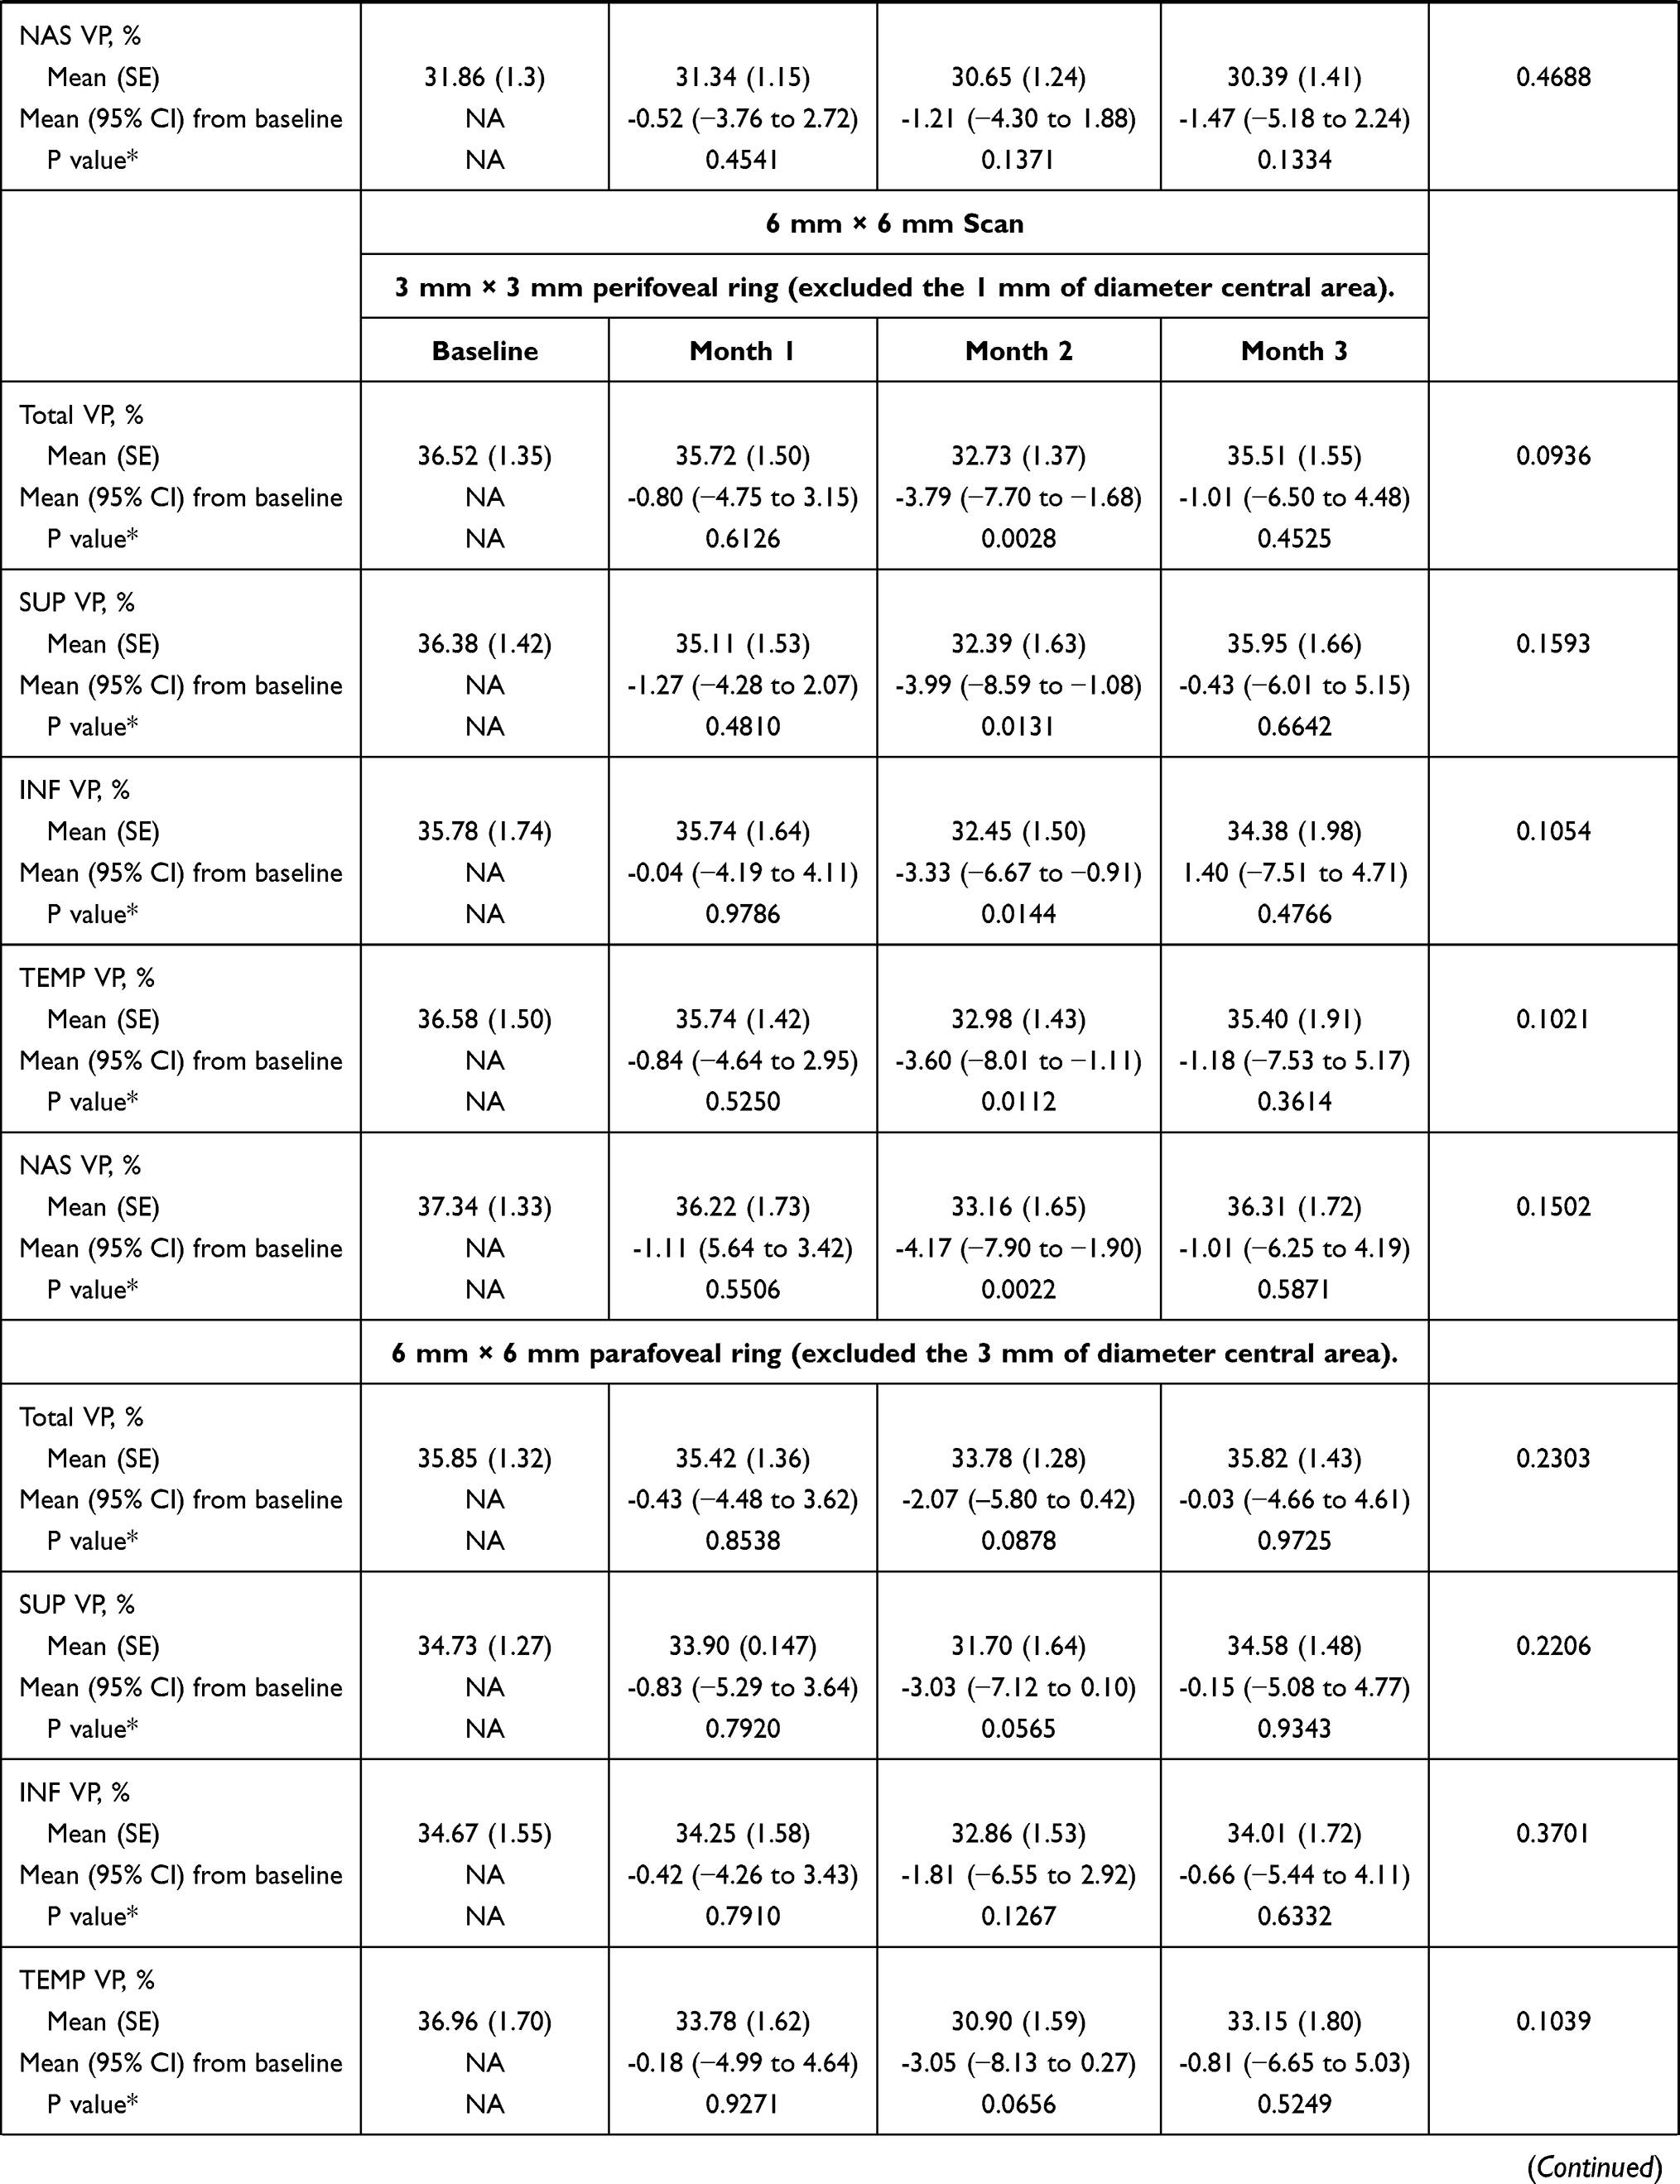 | 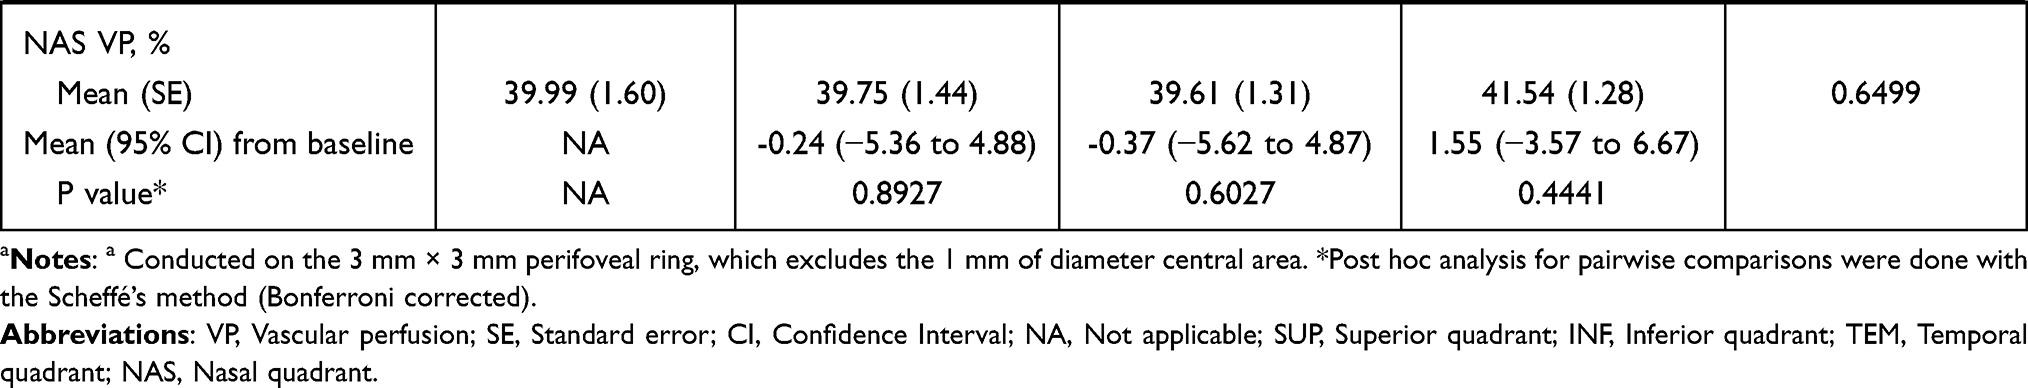 |
Table 3 Overview of the Vascular Perfusion (VP) in the Superficial Capillary Plexus in 3 mm × 3 mm and 6 mm × 6 mm Scans. P values were Calculated Using Repeated Measures ANOVA and the Greenhouse–Geisser Correction |
When compared to baseline, DCP VP was significantly reduced in the perifoveal ring of the 6 mm × 6 mm scan at months 2 and 3 (Table 4). Additionally, DCP VP in the parafoveal ring of the 6 mm × 6 mm scan was significantly lower at month 2 when compared to baseline (Table 4). However, no significant changes were observed in the DCP VP in the 3 mm x 3 mm scan (Table 4).
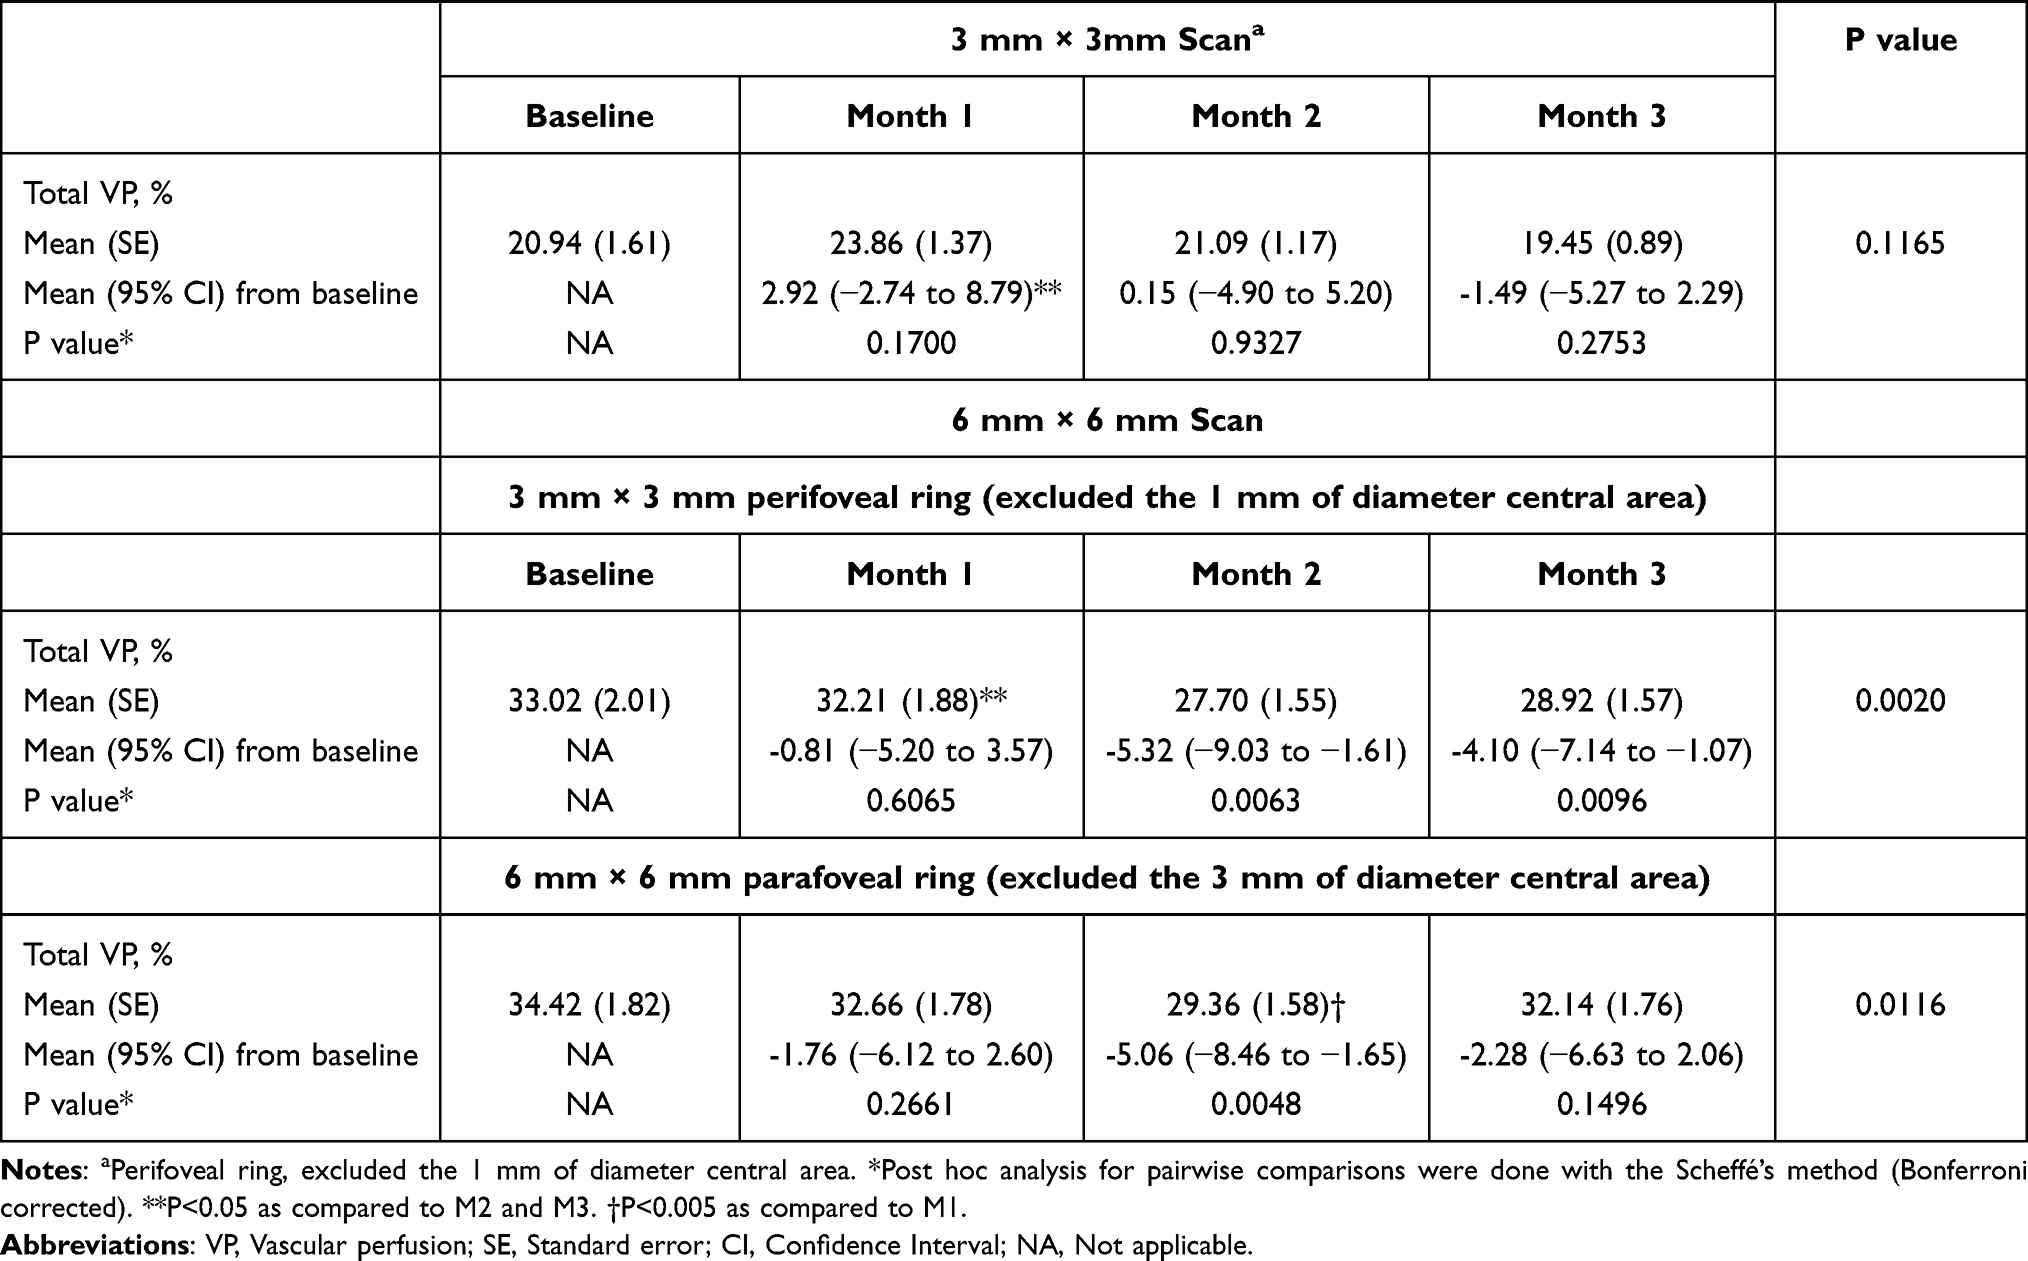 |
Table 4 Overview of the Vascular Perfusion in the Deep Capillary Plexus Over the Course of the Study Follow-Up. P values were Calculated Using Repeated Measures ANOVA and the Greenhouse–Geisser Correction |
As compared to baseline, mean (95% CI) change in PCP VP was 0.29 (−0.05 to 0.63), 0.0966; 0.11 (−0.30 to 0.53); 0.5899; and 0.02 (−0.37 to 0.41), p, 0.9218 at month 1, 2, and 3, respectively.
Mean (95% CI) FAZ area in the 3 mm × 3 mm scan was 0.28 (0.32 to 0.34) mm2; 0.27 (0.22 to 0.33) mm2; 0.29 (0.24 to 0.34) mm2; and 0.28 (0.23 to 0.34) at baseline and months 1, 2, and 3, respectively (p, 0.9557; repeated measures ANOVA and the Greenhouse–Geisser correction) (Table 5). Similarly, there were no significant changes in mean (95% CI) FAZ area in the 6 mm × 6 mm scan from baseline [0.28 (0.25 to 0.31) mm2] to month 1 [0.25 (0.22 to 0.29) mm2, p, 0.7473]; month 2 [0.27 (0.23 to 0.31) mm,2 p, 0.9337], and month 3 [0.27 (0.24 to 0.30), p, 0.7975] (Table 5).
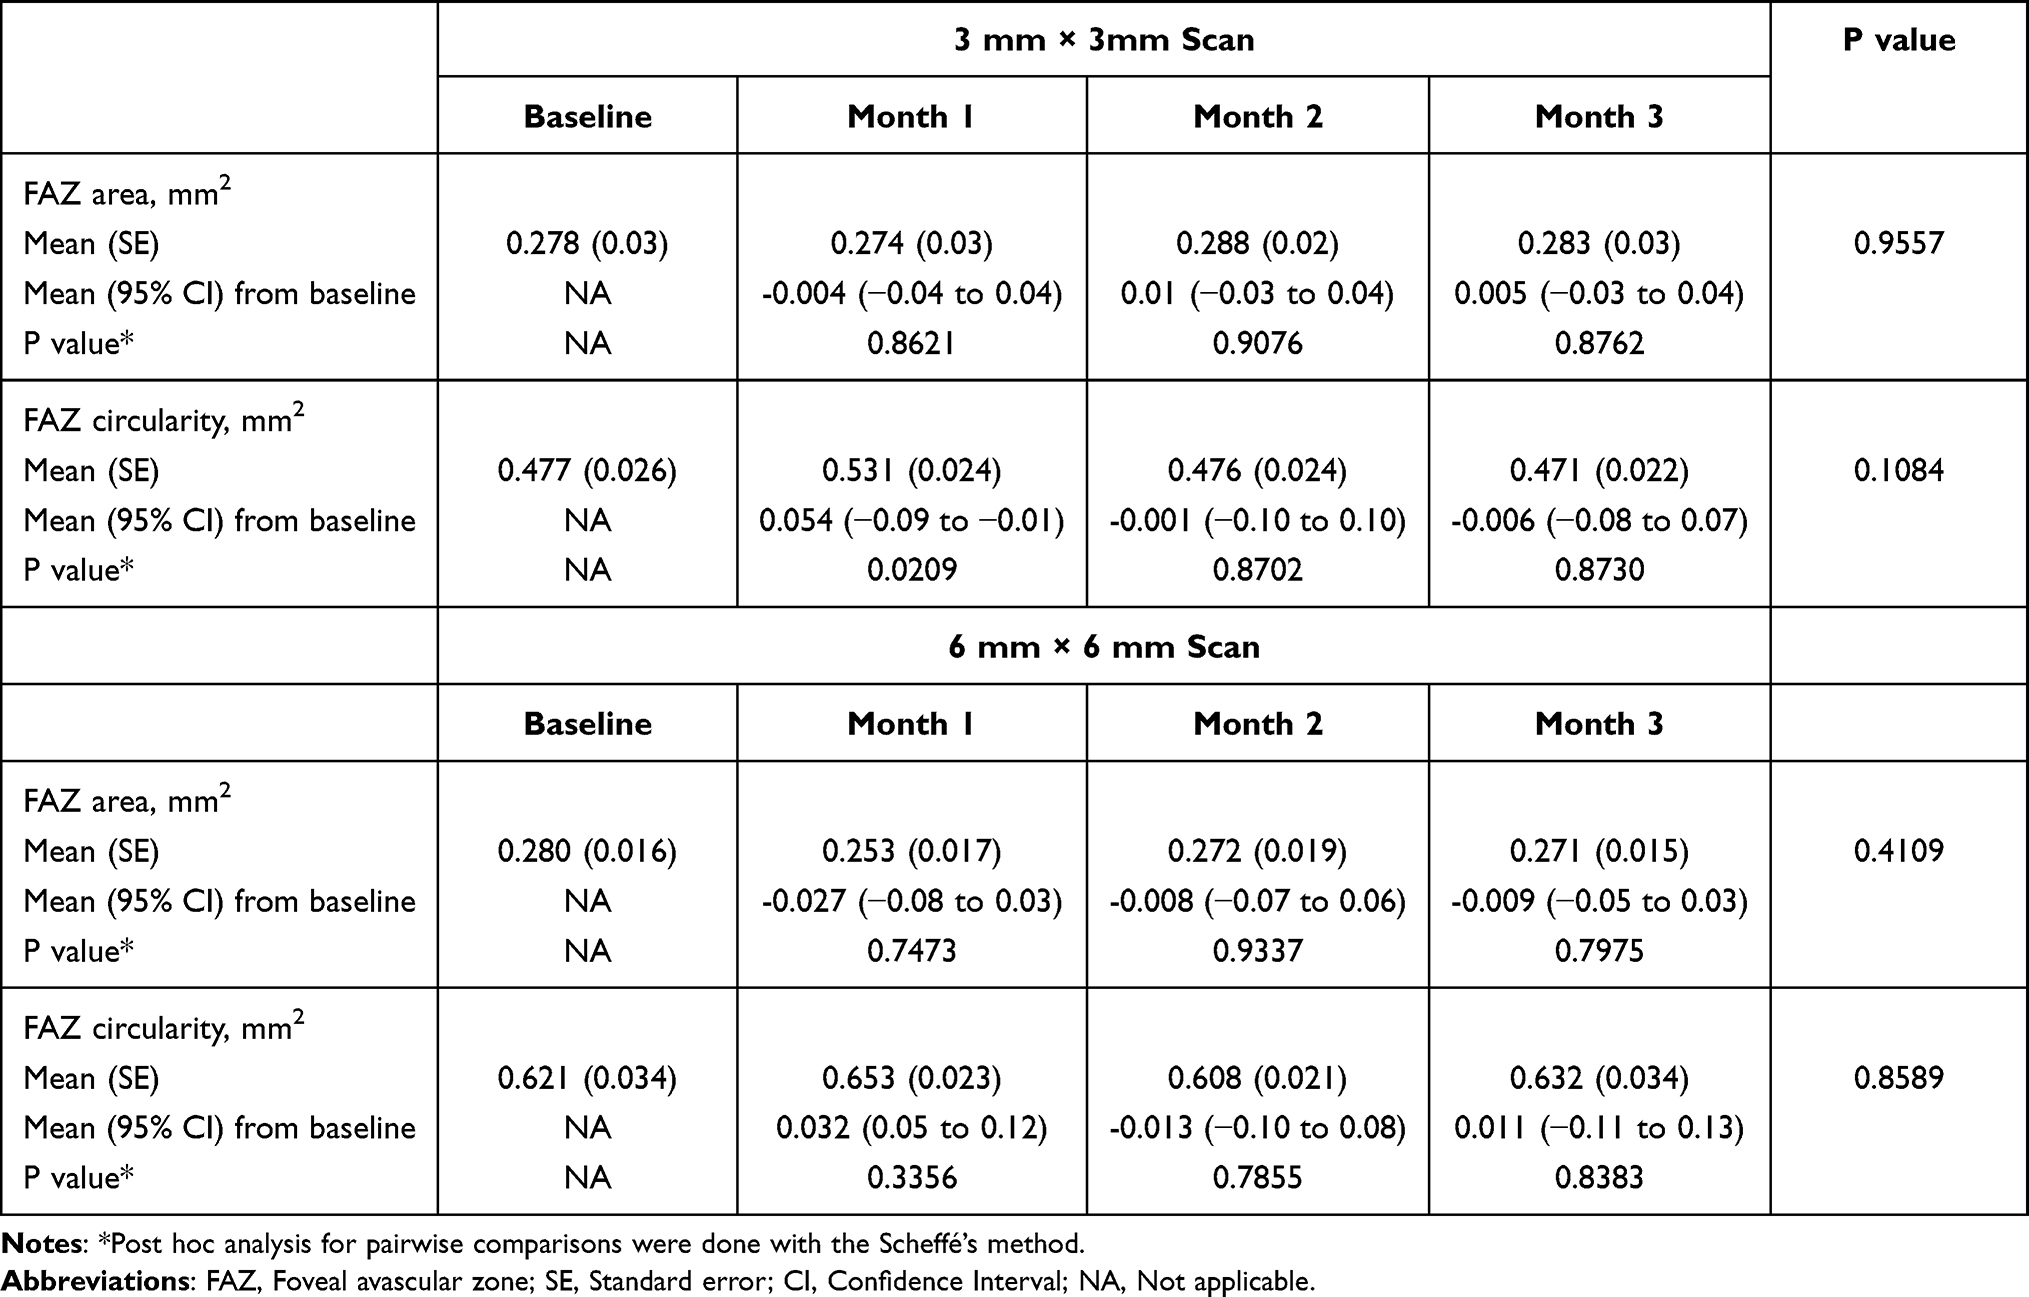 |
Table 5 Overview of the Foveal Avascular Zone (FAZ) Area and Circularity in the Superficial Plexus. And 6 mm × 6 mm Scan (B) Over the Course of the Study Follow-Up. P values were Calculated Using Repeated Measures ANOVA and the Greenhouse–Geisser Correction |
No significant changes were observed at any time-point measures of circularity index in either 3 mm × 3 mm or 6 mm × 6 mm scans.
Figure 2 summarizes the overview of VD in the 6 mm × 6 mm perifoveal ring and VP in the SCP and DCP in the 6 mm × 6 mm perifoveal ring.
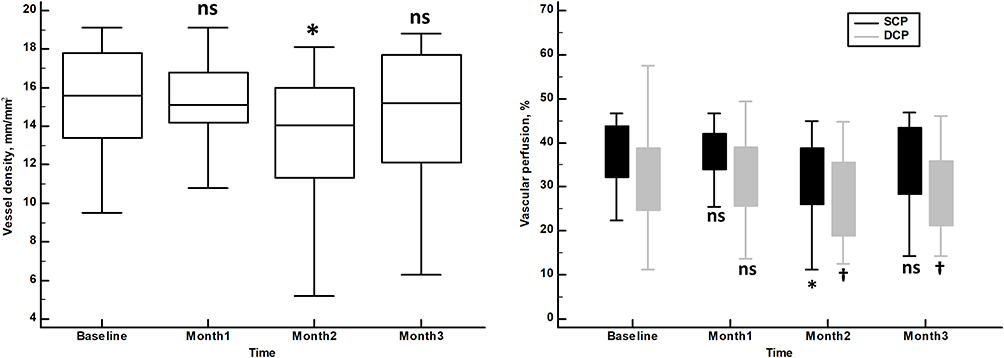 |
Figure 2 Vessel density in the 6 mm × 6 mm perifoveal ring (left) and vascular perfusion in the superficial capillary plexus (SCP) and deep capillary plexus (DCP) in the 6 mm × 6 mm perifoveal ring (right). Vertical bars represent 95% confidence interval. *p<0.005 as compared to baseline (Repeated measures ANOVA and the Greenhouse–Geisser correction). †<p<0.01 as compared to baseline (Repeated measures ANOVA and the Greenhouse–Geisser correction). Abbreviations: ns, not significant; SCP, superficial capillary plexus; DCP, deep capillary plexus. |
BCVA significantly improved from baseline to month 1 and 2 (p < 0.0001, each), and 3 (p, 0.0001) (Table 6).
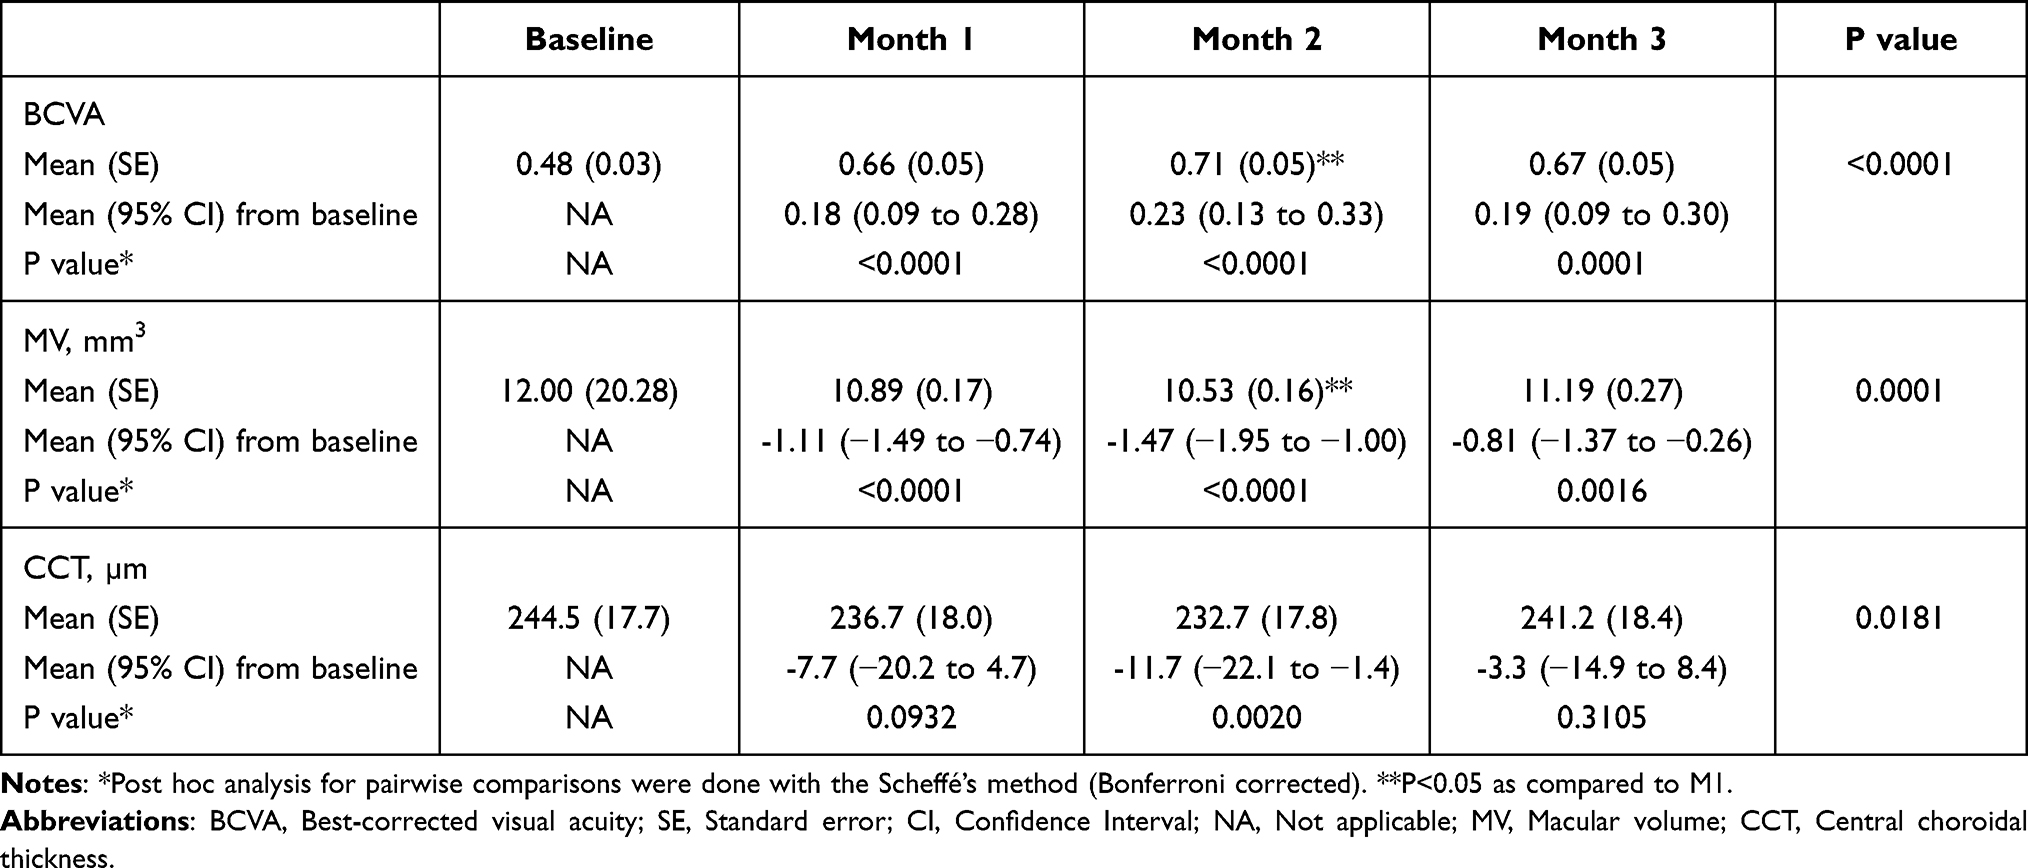 |
Table 6 Overview of the Best-Corrected Visual Acuity (BCVA), Macular Volume (MV), and Central Choroidal Thickness Over the Course of the Study Follow-Up. P values were Calculated Using Repeated Measures ANOVA and the Greenhouse–Geisser Correction |
Mean (95% CI) CMT was significantly reduced from baseline in 124.8 (87.5 to 162.2) µm, p < 0.0001; 210.3 (149.9 to 270.8) µm, p < 0.0001; and 201.8 (140.4 to 263.3) µm, p < 0.0001 at months 1, 2, and 3, respectively.
Mean MV was significantly decreased at all the different time-points measured. Mean CCT decreased significantly at month 2 (Table 6).
The percentage of eyes who experienced a complete resolution of their DME at 30, 60 and 90 days after DEX administration were 32.4% (11/34); 29.4% (10/34); and 8.8% (3/34).
Over the course of the study, the number of eyes who experienced a rise in IOP ≥ 10 mm Hg as compared to baseline was 2 (5.7%), 4 (11.4%), and 2 (5.7%) at month 1, 2, and 3, respectively. All the cases were successfully managed with topical hypotensive medication.
There was a significant correlation between baseline FAZ area (in both 3 mm × 3 mm and 6 mm × 6 mm scans) and mean change in CMT, p, 0.0157 and p, 0.0014, respectively (Table 7). No other relationships between quantitative OCTA values and clinical outcomes (BCVA and CMT) were found.
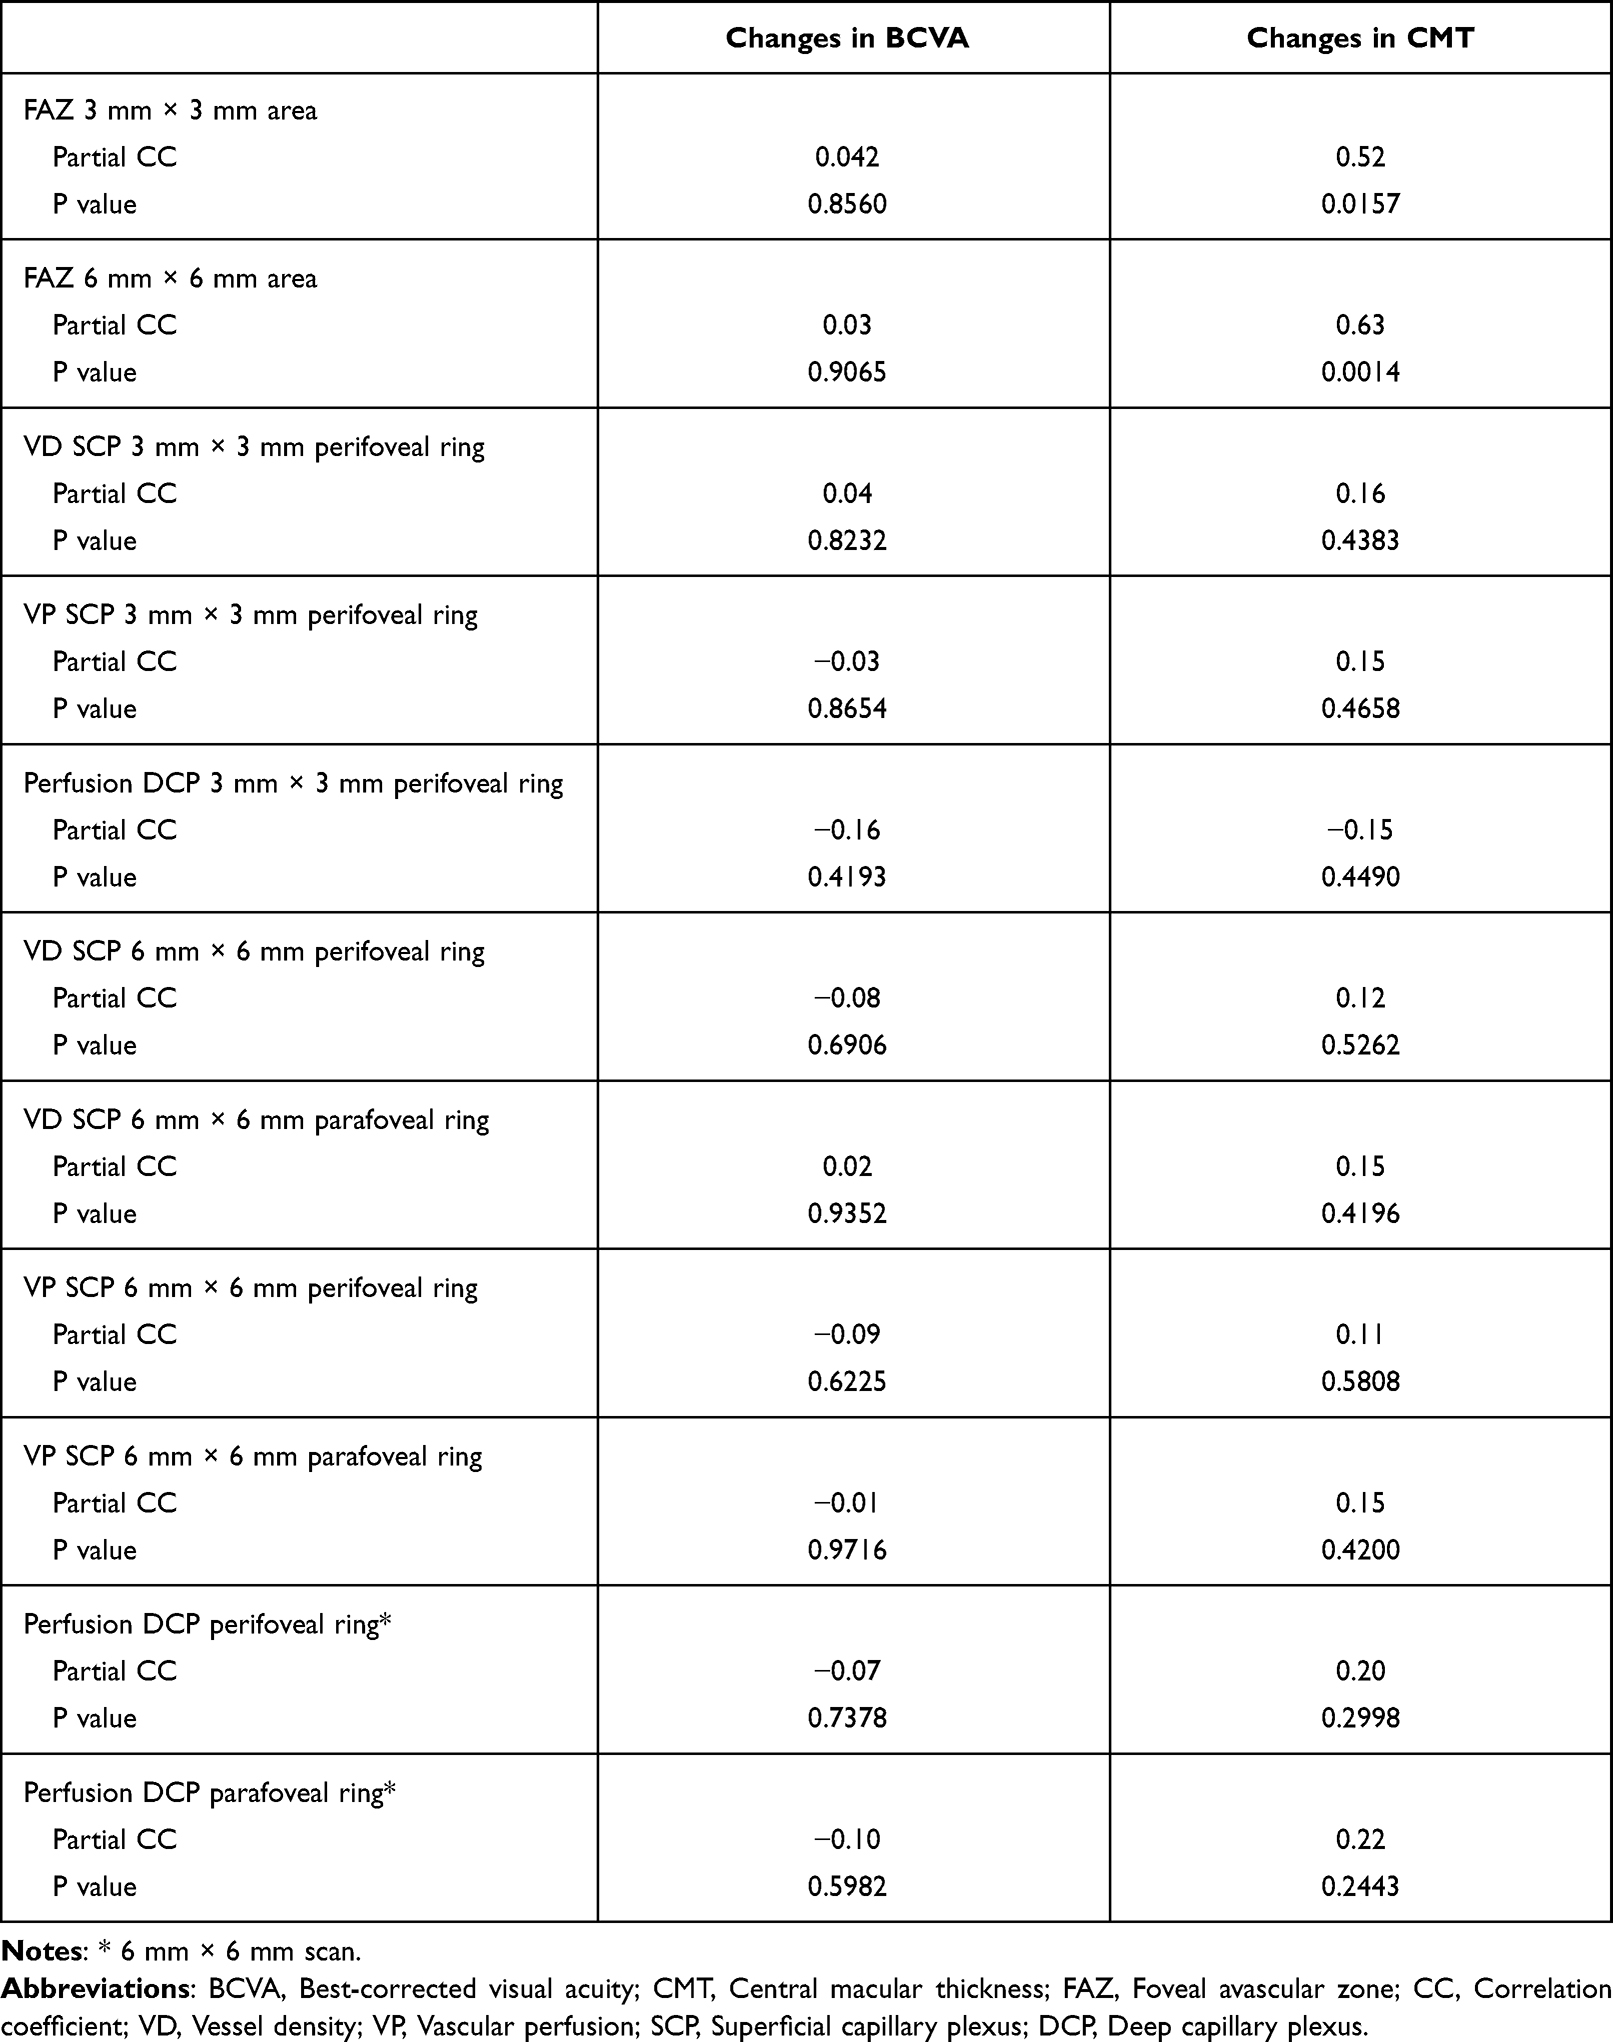 |
Table 7 Correlation Coefficient of Mean Changes in Best-Corrected Visual Acuity (BCVA) and Central Macular Thickness (CMT) with Baseline Vascular Parameters. Correlation Coefficient Have Been Adjusted by Age and Duration of Diabetes |
No serious adverse events were reported during the study.
Discussion
The multifactorial nature of the pathophysiology of DME makes it necessary to search for tools and biomarkers that help us understand the disease.4,5
The OCTA is a technical device that allows the acquisition of very high-resolution images of all the vascular layers of the retina in a rapid and, unlike the standard fluorescein angiography, non-invasive fashion.12
Additionally, OCTA is able to provide quantitative information, such as VD and VP, which may be useful for monitoring both the course of the disease and the treatment response.11,12,22
VD and VP are two parameters that evaluate the retinal vessels. VP represents the area occupied by vessels divided by the selected area, while VD is the linear length of vessels divided by the selected area.23,24
The current study evaluated the effect of a unique DEX implant on vascular parameters of OCTA, and functional and anatomic clinical outcomes in a cohort of DME patients.
Besides the significant improvements in both functional and anatomic outcomes observed after DEX implant administration, the results of this study also found a significant reduction of the quantitative vascular parameters.
VD in the SCP in the perifoveal ring of the 6 mm × 6 mm scan analysis at month 2 was significantly decreased. This change was mainly due to the nasal quadrant, which is where the papillo-macular bundle is located. At month 2, VP in the SCP was significantly decreased from baseline in the perifoveal ring of the 6 mm × 6 mm scan in the overall and in each of the four quadrants. Additionally, we also observed an additional VP reduction in the parafoveal ring of the 6 mm × 6 mm scan from month 1 and month 2.
Regarding VP in the DCP, we found a significant reduction in the perifoveal ring of the 6 mm × 6 mm scan at months 2 and 3.
Our study did not find any changes in FAZ area in both 3 mm × 3 mm and 6 mm × 6 mm scans.
The effect of corticosteroids on retinal vessels has been previously described.25,26 Semeraro et al,25 in a cohort of patients with retinal vein occlusion, reported a reduction in arteriolar lumen diameter, assessed by scanning-laser Doppler flowmetry, after DEX implant, which may have a positive impact on vascular leakage and macular swelling. Additionally, intravitreal triamcinolone appeared to reduce the caliber in both retinal arterioles and venules in eyes with refractory DME.26
Toto et al14 did not find significant changes in VP after DEX implant in both superficial and deep capillary plexuses. However, they found a “normalization in the caliber of the deep vessels”. We must take into account that OCT-A signal does not correspond to vascular caliber but to lumen. Thus, they should have better stated that “normalization in the lumen of the deep vessels” was found.
In agreement with their results, we did not observe significant changes in total VD or VP (SCP and DCP) in the 3 mm x 3 mm and 6 mm x 6 mm scans. Nevertheless, at month 2, VD, VP in SCP and VP in DCP in the 6 mm x 6 mm perifoveal ring showed a significant decrease as compared to baseline.
Changes in VD and VP may be due either to an indirect or to a direct effect of DEX. DEX reduces DME, with the subsequent reduction in central retinal thickness, which could modify the vessels distribution (indirect effect). On the other hand, as mentioned above, DEX implant can reduce the vascular diameter (direct effect).25,26 However, this would explain a reduction in VP but not in VD.
If changes in VD were caused by a purely mechanical effect of reducing edema (indirect effect), there would be a relationship between CMT reduction and VD changes. However, our study did not find any relationship between changes in CMT and changes in VD (r: 0.037, p, 0.8342). Thus, indirect effect is not the most likely explanation for changes in VD and VP.
Regarding the direct effect, it has been previously suggested that retinal arteriolar and venular calibers are larger in patients with DR.27 On the other hand, it has been reported that VP is decreased in both SCP and DCP in patients with DR and the higher the DR degree the lower the VP measured with OCTA.28,29 This may indicate that capillary loss that occurs in DR has a greater impact on VP than the increase in the caliber of large and medium vessels. Since there is evidence suggesting that vessel caliber enlargement in diabetes is related to inflammation,30 it would make sense to suppose that DEX implant reduces VP, by reducing vessels diameter and, specifically, vessels lumen. However, variations in vessels lumen would impact on VP, but not in VD (where it does not matter if vessels are thick or thin).
In our study, VP reduction seems to be associated with changes in VD. There was a significant relationship between the changes in VD and changes in VP in SCP in the 3 mm x 3 mm scan (r: 0.992, 95% CI: 0.983 to 0.996; p < 0.0001) and in the 6 mm x 6 mm scan (r: 0.997, 95% CI: 0.993 to 0.998; p < 0.0001).
The underlying mechanism behind VD reduction is not so clear. The phenomenon of suspended scattering particles in motion (SSPiM) could be a plausible explanation for our results. This phenomenon is frequently observed in vascular cystic macular edema, in which some cysts have hyperreflective material as seen by OCT. This material is composed of particles with a Brownian movement that give a false-positive signal in OCTA.31 The presence of SSPiM may lead to an overestimation of VP and VD.32 This type of cysts is potentially more sensitive to steroids than to anti-VEGF (as other types of lipid exudation as hard exudates or hyperreflective foci). A reduction or disappearance of these hyperreflective cysts after DEX treatment would result in a reduction of the OCTA flow signal.
Retinal hypoxia, caused by either obstruction or loss of retinal capillaries, seems to be the responsible for the high levels of VEGF and several inflammatory cytokines, which are critical in the pathogenesis of DR and DME.6–8 These inflammatory molecules cause a significant increase in leukocyte adhesion to the retinal microvasculature (leukostasis), which appears to have a central role in the development of DR and DME.6–8 The capillary blockage secondary to leukostasis would lead to the development of non-perfusion areas, especially in the DCP.33,34
Intravitreal corticosteroids block the production of inflammatory mediators, and inhibit leukostasis.35,36 Inhibition of leukostasis would lead to the opening of capillaries and the subsequent increase in perfusion.6
However, the reduction in VD and VP observed in the current study did not confirm this assumption. Based on the results of our study, it may be hypothesized that despite DEX implant might be able to open capillaries, capillary loss associated with DR and DME seems to be due to permanent vascular occlusion instead of leukostasis.14,30
Our study found different outcomes in the 3 mm × 3 mm and the 6 mm × 6 mm scans in both SCP and DCP. These findings are in agreement with those of Lei et al, who reported differences in VD depending on the pattern (3 mm × 3 mm or 6 mm × 6 mm) and the location (inner or outer) of the scans.37
This study did not find any change in FAZ area.
We found a significant direct relationship between baseline FAZ size and CMT reduction after DEX. Such a relationship was not observed between FAZ size and BCVA changes. A larger baseline FAZ size reflects a greater macular vascular compromise. This could lead to a greater baseline CMT and therefore a greater decrease in edema after treatment. None of the other OCTA parameters had any relationship with either functional or anatomic outcomes.
In addition to the vascular effects, DEX implant significantly improved both functional and anatomic outcomes. These findings do not differ from the currently available scientific evidence.38–42
Our study showed a significant improvement in BCVA and anatomic outcomes 1 month after DEX. However, VD and VP did not show any change until month 2.
Additionally, at month 3, most quantitative vascular parameters showed similar values to baseline, despite BCVA and anatomic outcomes still remained better than at baseline. The relevance of these findings critically depends on whether vascular parameters behavior may predict the evolution of the DME. Further research is needed to elucidate the predictive ability of OCTA parameters to detect the recurrence of DME.
Regarding safety, 8 (22.9%) eyes had a raise in IOP ≥ 10 mm Hg as compared to baseline. In all cases, increased IOP was managed with topical medication and none required surgery. These results are in line with those reported in other studies.38–41
Finally, it should be mentioned that eight patients were lost of follow-up because the COVID-19 pandemic lockdowns and restrictions. Due to COVID-19 outbreak over the last 2 years, the strategies adopted by the different Governments for reducing the risk of infection spreading have dramatically disrupted the provision of health care resulting from deferral of routine aesthetic procedures.43 In the current times of pandemic, DEX implant may entail an advantage over routine monthly anti-VEGF therapy because it avoids visits to medical centers,44,45 but this is beyond the objective of our study.
The current study has a few limitations. The first one is the lack of a reproducibility assessment before starting the study. Nevertheless, it should be taken into consideration that repeatability and reproducibility of OCTA are high, although might be affected by different artifacts, especially in pathologic conditions such as DME.37,46,47 Another limitation is its open-label design. However, data have been analyzed by an independent statistician, who was blind to the intervention. Finally, we evaluated a heterogeneous cohort of DME, which may artifact the results. Nevertheless, our cohort reflects the reality of routine clinical practice, which may add clinical relevance to this paper.
Conclusions
Despite these limitations, the results of this study suggested that a single DEX implant may modify quantitative vascular parameters assessed by OCTA. In addition to the functional and anatomic improvements, DEX implant significantly reduced vessel density and vascular perfusion in patients with DME. Further research is needed, particularly prospective, multicenter, and long-term follow-up studies, to better assess the role of DEX in vascular remodeling, the role of the phenomenon of SSPiM in this process, and the role of OCTA parameters as potential biomarkers in DME outcomes.
Data Sharing Statement
The data that support the findings of this study are available from the corresponding author [PCM], upon reasonable request.
Statement of Ethics
“All procedures performed in studies involving human participants were in accordance with the ethical standards of the institutional and/or national research committee and with the 1964 Helsinki declaration and its later amendments or comparable ethical standards. The study protocol was approved by the Ethical Committee for Clinical Research of Galicia (CEIC). Informed consent was obtained from all individual participants included in the study.
Acknowledgments
Medical writing and editorial assistant services have been provided by Antonio Martínez (MD) of Ciencia y Deporte S.L.
Author Contributions
All authors made substantial contributions to conception and design, acquisition of data, or analysis and interpretation of data; took part in drafting the article or revising it critically for important intellectual content; agreed to submit to the current journal; gave final approval for the version to be published; and agreed to be accountable for all aspects of the work.
Funding
Logistic for writing services has been provided by Allergan, an AbbVie company. Allergan did not participate in either data analysis or redaction of the manuscript.
Disclosure
Dr. Pablo Carnota-Mémdez has received a Grant from Allergan during the conduct of the study and also received non-financial support from Ciencia y Deporte S.L., during the conduct of the study. The other coauthors do not have any financial/non-financial interest to report.
References
1. Cho NH, Shaw JE, Karuranga S, et al. IDF Diabetes Atlas: global estimates of diabetes prevalence for 2017 and projections for 2045. Diabetes Res Clin Pract. 2018;138:271–281.
2. Bourne RRA, Jonas JB, Bron AM; Vision Loss Expert Group of the Global Burden of Disease Study, et al. Prevalence and causes of vision loss in high-income countries and in Eastern and Central Europe in 2015: magnitude, temporal trends and projections. Br J Ophthalmol. 2018;102(5):575–585.
3. Li JQ, Welchowski T, Schmid M, et al. Prevalence, incidence and future projection of diabetic eye disease in Europe: a systematic review and meta-analysis. Eur J Epidemiol. 2020;35(1):11–23.
4. Kocur I, Resnikoff S. Visual impairment and blindness in Europe and their prevention. Br J Ophthalmol. 2002;86(7):716–722. doi:10.1136/bjo.86.7.716
5. Cunha-Vaz J, Coscas G. Diagnosis of macular edema. Ophthalmologica. 2010;224(Suppl 1):2–7.
6. Daruich A, Matet A, Moulin A, et al. Mechanisms of macular edema: beyond the surface. Prog Retin Eye Res. 2018;63:20–68.
7. Romero-Aroca P, Baget-Bernaldiz M, Pareja-Rios A, Lopez-Galvez M, Navarro-Gil R, Verges R. Diabetic macular edema pathophysiology: vasogenic versus inflammatory. J Diabetes Res. 2016;2016:2156273.
8. Usui Y. Elucidation of pathophysiology and novel treatment for diabetic macular edema derived from the concept of neurovascular unit. JMA J. 2020;3(3):201–207.
9. Schmidt-Erfurth U, Garcia-Arumi J, Bandello F, et al. Guidelines for the management of diabetic macular edema by the European Society of Retina Specialists (EURETINA). Ophthalmologica. 2017;237(4):185–222.
10. Chua J, Sim R, Tan B, et al. Optical coherence tomography angiography in diabetes and diabetic retinopathy. J Clin Med. 2020;9(6):1723.
11. Markan A, Agarwal A, Arora A, Bazgain K, Rana V, Gupta V. Novel imaging biomarkers in diabetic retinopathy and diabetic macular edema. Ther Adv Ophthalmol. 2020;12:2515841420950513.
12. Spaide RF, Fujimoto JG, Waheed NK, Sadda SR, Staurenghi G. Optical coherence tomography angiography. Prog Retin Eye Res. 2018;64:1–55.
13. Matsunaga DR, Yi JJ, De Koo LO, Ameri H, Puliafito CA, Kashani AH. Optical coherence tomography angiography of diabetic retinopathy in human subjects. Ophthalmic Surg Lasers Imaging Retina. 2015;46(8):796–805.
14. Shi Y, Vanhoutte PM. Macro- and microvascular endothelial dysfunction in diabetes. J Diabetes. 2017;9(5):434–449.
15. Elnahry AG, Abdel-Kader AA, Raafat KA, Elrakhawy K. Evaluation of changes in macular perfusion detected by optical coherence tomography angiography following 3 intravitreal monthly bevacizumab injections for diabetic macular edema in the IMPACT study. J Ophthalmol. 2020;2020:5814165. doi:10.1155/2020/5814165
16. Sorour OA, Elsheikh M, Chen S, et al. Mean macular intercapillary area in eyes with diabetic macular oedema after anti-vascular endothelial growth factor therapy and its association with treatment response. Clin Exp Ophthalmol. 2021;49(7):714–723.
17. Elnahry AG, Elnahry GA. Optical coherence tomography angiography of macular perfusion changes after anti-VEGF therapy for diabetic macular edema: a systematic review. J Diabetes Res. 2021;2021:6634637. doi:10.1155/2021/6634637
18. Toto L, D’Aloisio R, Di Nicola M, et al. Qualitative and quantitative assessment of vascular changes in diabetic macular edema after dexamethasone implant using optical coherence tomography angiography. Int J Mol Sci. 2017;18(6):1181.
19. Minnella AM, Federici M, Pagliei V, et al. Short-term assessment of intravitreal dexamethasone implant using enhanced-depth image optical coherence tomography and optical coherence tomography angiography in patients with retinal vascular diseases. Adv Ther. 2019;36(2):416–425.
20. Bonnin S, Mané V, Couturier A, et al. New insight into the macular deep vascular plexus imaged by optical coherence tomography angiography. Retina. 2015;35(11):2347–2352.
21. Lang KM, Little TD. Principled missing data treatments. Prev Sci. 2018;19:284–294.
22. Mastropasqua R, Di Antonio L, Di Staso S, et al. Optical coherence tomography angiography in retinal vascular diseases and choroidal neovascularization. J Ophthalmol. 2015;2015:343515.
23. You Q, Freeman WR, Weinreb RN, et al. Reproducibility of vessel density measurement with optical coherence tomography angiography in eyes with and without retinopathy. Retina. 2017;37(8):1475–1482.
24. Yu L, Jiao Q, Cheng Y, Zhu Y, Lin Z, Shen X. Evaluation of retinal and choroidal variations in thyroid-associated ophthalmopathy using optical coherence tomography angiography. BMC Ophthalmol. 2020;20(1):421.
25. Semeraro F, Russo A, Rizzoni D, Danzi P, Morescalchi F, Costagliola C. Diameters and wall-to-lumen ratio of retinal arterioles in patients with retinal vein occlusion before and after treatment with dexamethasone intravitreal implants. J Ocul Pharmacol Ther. 2014;30(7):573–579.
26. Wickremasinghe SS, Rogers SL, Gillies MC, Zhu MD, Wong TY. Retinal vascular caliber changes after intravitreal triamcinolone treatment for diabetic macular edema. Invest Ophthalmol Vis Sci. 2008;49(11):4707–4711.
27. Nguyen TT, Wang JJ, Sharrett AR, et al. Relationship of retinal vascular caliber with diabetes and retinopathy: the Multi-Ethnic Study of Atherosclerosis (Mesa). Diabetes Care. 2008;31(3):544–549.
28. Al-Sheikh M, Akil H, Pfau M, Sadda SR. Swept-source OCT angiography imaging of the foveal avascular zone and macular capillary network density in diabetic retinopathy. Invest Ophthalmol Vis Sci. 2016;57(8):3907–3913.
29. Agemy SA, Scripsema NK, Shah CM, et al. Retinal vascular perfusion density mapping using optical coherence tomography angiography in normals and diabetic retinopathy patients. Retina. 2015;35(11):2353–2363.
30. Pournaras CJ, Rungger-Brändle E, Riva CE, Hardarson SH, Stefansson E. Regulation of retinal blood flow in health and disease. Prog Retin Eye Res. 2008;27(3):284–330.
31. Kashani AH, Green KM, Kwon J, AL ET. Suspended scattering particles in motion: a novel feature of OCT angiography in exudative maculopathies. Ophthalmol Retina. 2018;2(7):694–702.
32. Maltsev DS, Kulikov AN, Kazak AA, Freund KB. suspended scattering particles in motion may influence optical coherence tomography angiography vessel density metrics in eyes with diabetic macular edema. Retina. 2021;41(6):1259–1264.
33. Mané V, Dupas B, Gaudric A, et al. Correlation between cystoid spaces in chronic diabetic macular edema and capillary nonperfusion detected by optical coherence tomography angiography. Retina. 2016;36(Suppl 1):S102–S110.
34. Spaide RF. Vascular cystoid macular edema: review and new theory. Retina. 2016;36(10):1823–1842.
35. Wang K, Wang Y, Gao L, Li X, Li M, Guo J. Dexamethasone inhibits leukocyte accumulation and vascular permeability in retina of streptozotocin-induced diabetic rats via reducing vascular endothelial growth factor and intercellular adhesion molecule-1 expression. Biol Pharm Bull. 2008;31(8):1541–1546.
36. Tamura H, Miyamoto K, Kiryu J, et al. Intravitreal injection of corticosteroid attenuates leukostasis and vascular leakage in experimental diabetic retina. Invest Ophthalmol Vis Sci. 2005;46(4):1440–1444.
37. Lei J, Durbin MK, Shi Y, et al. Repeatability and reproducibility of superficial macular retinal vessel density measurements using optical coherence tomography angiography enFace images. JAMA Ophthalmol. 2017;135(10):1092–1098.
38. Boyer DS, Yoon YH, Jr BR; Ozurdex MEAD Study Group, et al. Three-year, randomized, sham-controlled trial of dexamethasone intravitreal implant in patients with diabetic macular edema. Ophthalmology. 2014;121(10):1904–1914.
39. Guigou S, Pommier S, Meyer F, et al. Efficacy and safety of intravitreal dexamethasone implant in patients with diabetic macular edema. Ophthalmologica. 2015;233(3–4):169–175.
40. Malclès A, Dot C, Voirin N, et al. Real-life study in diabetic macular edema treated with dexamethasone implant: the Reldex Study. Retina. 2017;37(4):753–760.
41. Iglicki M, Busch C, Zur D, et al. Dexamethasone implant for diabetic macular edema in naive compared with refractory eyes: the International Retina Group Real-Life 24-month multicenter study. The IRGREL-DEX Study. Retina. 2019;39(1):44–51.
42. Castro-Navarro V, Cervera-Taulet E, Navarro-Palop C, Monferrer-Adsuara C, Hernández-Bel L, Montero-Hernández J. Intravitreal dexamethasone implant Ozurdex® in naïve and refractory patients with different subtypes of diabetic macular edema. BMC Ophthalmol. 2019;19(1):15.
43. Iovino C, Peiretti E, Giannaccare G, Scorcia V, Carnevali A. Evolving treatment paradigm in the management of diabetic macular edema in the era of COVID-19. Front Pharmacol. 2021;12:670468. doi:10.3389/fphar.2021.670468
44. Carnevali A, Giannaccare G, Gatti V, Scuteri G, Randazzo G, Scorcia V. Intravitreal injections during COVID-19 outbreak: real-world experience from an Italian tertiary referral center. Eur J Ophthalmol. 2021;31(1):10–12.
45. Scorcia V, Giannaccare G, Gatti V, et al. Intravitreal dexamethasone implant in patients who did not complete Anti-VEGF loading dose during the COVID-19 pandemic: a retrospective observational study. Ophthalmol Ther. 2021;10(4):1015–1024.
46. Zhang M, Hwang TS, Dongye C, Wilson DJ, Huang D, Jia Y. Automated quantification of nonperfusion in three retinal plexuses using projection- resolved optical coherence tomography angiography in diabetic retinopathy. Invest Ophthalmol Vis Sci. 2016;57(13):5101–5106.
47. Kim KM, Lee MW, Lim HB, Koo HM, Shin YI, Kim JY. Repeatability of measuring the vessel density in patients with retinal vein occlusion: an optical coherence tomography angiography study. PLoS One. 2020;15(6):e0234933.
 © 2022 The Author(s). This work is published and licensed by Dove Medical Press Limited. The full terms of this license are available at https://www.dovepress.com/terms.php and incorporate the Creative Commons Attribution - Non Commercial (unported, v3.0) License.
By accessing the work you hereby accept the Terms. Non-commercial uses of the work are permitted without any further permission from Dove Medical Press Limited, provided the work is properly attributed. For permission for commercial use of this work, please see paragraphs 4.2 and 5 of our Terms.
© 2022 The Author(s). This work is published and licensed by Dove Medical Press Limited. The full terms of this license are available at https://www.dovepress.com/terms.php and incorporate the Creative Commons Attribution - Non Commercial (unported, v3.0) License.
By accessing the work you hereby accept the Terms. Non-commercial uses of the work are permitted without any further permission from Dove Medical Press Limited, provided the work is properly attributed. For permission for commercial use of this work, please see paragraphs 4.2 and 5 of our Terms.