")
Back to Journals » Journal of Pain Research » Volume 10
Observing continuous change in heart rate variability and photoplethysmography-derived parameters during the process of pain production/relief with thermal stimuli
Authors Ye JJ , Lee KT, Lin JS, Chuang CC
Received 2 December 2016
Accepted for publication 12 January 2017
Published 6 March 2017 Volume 2017:10 Pages 527—533
DOI https://doi.org/10.2147/JPR.S129287
Checked for plagiarism Yes
Review by Single anonymous peer review
Peer reviewer comments 2
Editor who approved publication: Dr Michael Schatman
Jing-Jhao Ye, Kuan-Ting Lee, Jing-Siang Lin, Chiung-Cheng Chuang
Department of Biomedical Engineering, Chung Yuan Christian University, Chung Li, Taiwan
Abstract: Continuously monitoring and efficiently managing pain has become an important issue. However, no study has investigated a change in physiological parameters during the process of pain production/relief. This study modeled the process of pain production/relief using ramped thermal stimulation (no pain: 37°C water, process of pain production: a heating rate of 1°C/min, and subject feels pain: water kept at the painful temperature for each subject, with each segment lasting 10 min). In this duration, the variation of the heat rate variability and photoplethysmography-derived parameters was observed. A total of 40 healthy individuals participated: 30 in the trial group (14 males and 16 females with a mean age of 22.5±1.9 years) and 10 in the control group (7 males and 3 females with a mean age of 22.5±1.3 years). The results showed that the numeric rating scale value was 5.03±1.99 when the subjects felt pain, with a temperature of 43.54±1.70°C. Heart rate, R-R interval, low frequency, high frequency, photoplethysmography amplitude, baseline, and autonomic nervous system state showed significant changes during the pain production process, but these changes differed during the period Segment D (painful temperature 10: min). In summary, the study observed that physiological parameters changed qualitatively during the process of pain production and relief and found that the high frequency, low frequency, and photoplethysmography parameters seemed to have different responses in four situations (no pain, pain production, pain experienced, and pain relief). The trends of these variations may be used as references in the clinical setting for continuously observing pain intensity.
Keywords: pain production, heart rate variability, photoplethysmography, thermal stimuli
Introduction
Pain is considered to be a sensory response to tissue damage, which often results in an uncomfortable feeling and thus affects the physiological activity and psychological level of a patient.1,2 In a clinical setting, pain will result in a patient’s poor recovery from a wound and will even trigger complications if it cannot be appropriately relieved.3–5 In 2001, the standards of the Joint Commission on the Accreditation of Health Care Organizations advocated the consideration of pain as a fifth vital sign and emphasized the necessity of recording pain.6 A quality pain assessment is the foundation of pain management. Thus, achieving a better comprehension of the detailed action of pain production/relief is a challenge and an important issue.7
In a clinical setting, pain production/relief is a progressive process (no pain to pain/pain to no pain) over time. Therefore, pain may be effectively controlled if we can continuously observe a patient’s pain intensity change. Pain is considered to be an autonomic nervous response to severe stress, and there are relationships between pain and physiological responses. The heart rate variability (HRV) and photoplethysmography (PPG)-derived parameters are considered to be responses of the autonomic nervous system and have also been applied in the pain field.8–15 However, no study has explored physiological methods for continuously monitoring pain.
The goal of this study was to understand the change in the HRV and PPG parameters during the process of pain production/relief. Therefore, the study modeled a tonic pain stimulation system using a heat control method and observed these physiological responses during the process. We hope that this information can serve as a reference for continuously monitoring pain and provide a better method of pain management.
Methods
Subjects
The study was approved by the Institutional Review Board of En Chu Kong Hospital (ECK-IRB No. 1041101). In this study, 30 healthy participants (16 females and 14 males) were recruited for the trial group, and 10 participants (3 females and 7 males) were recruited for the control group, all of whom were between the ages of 20 and 27 years. All of them were from Chung Yuan Christian University, Taiwan, and provided written informed consent before the experiment. The exclusion criteria were 1) alcohol, opioid, and coffee abuse or dependence; 2) a known history of structural cardiac abnormalities, any concomitant inflammatory rheumatic diseases, or any other illnesses known to affect the autonomic nervous system; 3) an implanted pacemaker; 4) the use of any drug that affects cardiac functions; and 5) chronic/acute pain.
Study design
Heat pain stimulation
During the study periods, the room in which the measurements were taken was quiet and had a constant temperature (25°C). Each of the subjects sat in a comfortable armchair, and electrocardiography (ECG) and PPG signals were simultaneously recorded.
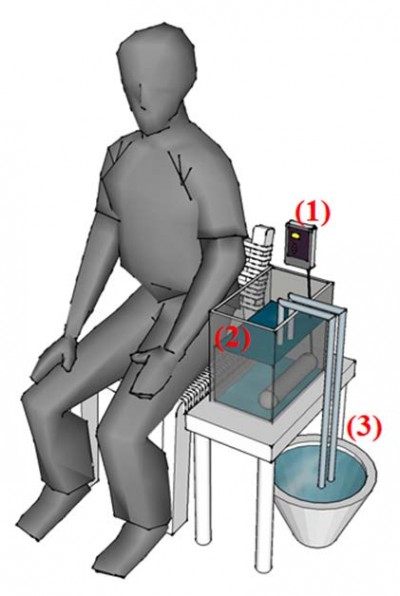
Heat stimulation has been considered to be a mode that can reflect clinical pain.15–18 Therefore, the study used a heat stimulation system to model a stimulation condition for pain production/relief. We made a ramped stimulation condition of tonic pain using an IC thermostat (SH-958-LC; ISTA-Tzong Yang Aquarium Company, LTD, Tainan City, Taiwan) with a 900 W silica glass heater, which could produce a temperature rise of 1°C/min in 12 L of circulating water. In addition, water at 25°C was injected using a throttle switch to model pain relief (Figure 1).
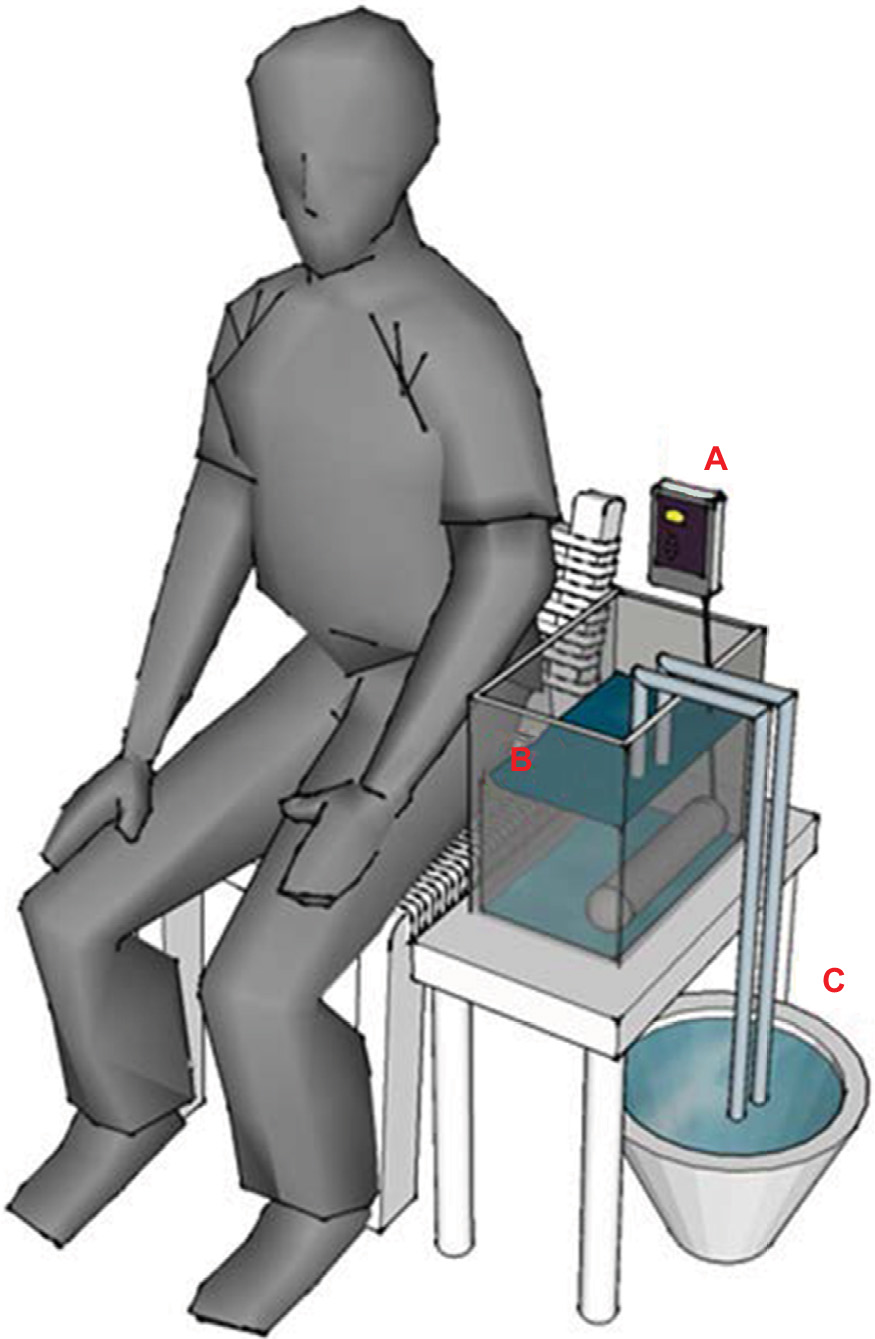 | Figure 1 Diagram of heat stimulation system. Notes: (A) The IC thermostat, (B) 12 L of water and a 900 W silica glass heater at bottom right, and (C) water (25°C) with a throttle switch exchanger. |
The study divided the entire experimental procedure into Segments A–E. Each subject was asked about their numeric rating scale (NRS) degree of pain before the end of each segment, and their ECG and PPG signals were recorded during the entire period. In Segment A, the participants remained in a calm state for 10 min. In Segments B–E, the participants immersed their left hand in the 12 L of circulating water for 10 min per segment. In Segment B, the circulating water was kept at 37°C. Segment C was the process of pain production. The water temperature was increased at a rate of 1°C/min and stopped when the participant felt pain or the water temperature reached 47°C. In Segment D, the painful temperature was maintained. Finally, Segment E was the process of pain relief. This was accomplished by injecting 25°C water into the circulating water using a throttle switch until the temperature was <32°C (Figure 2, upper panel). However, the temperature reached in Segment C differed per person, because the pain sense differs by individual. Therefore, the study used linear interpolation to calibrate the data in Segment C.
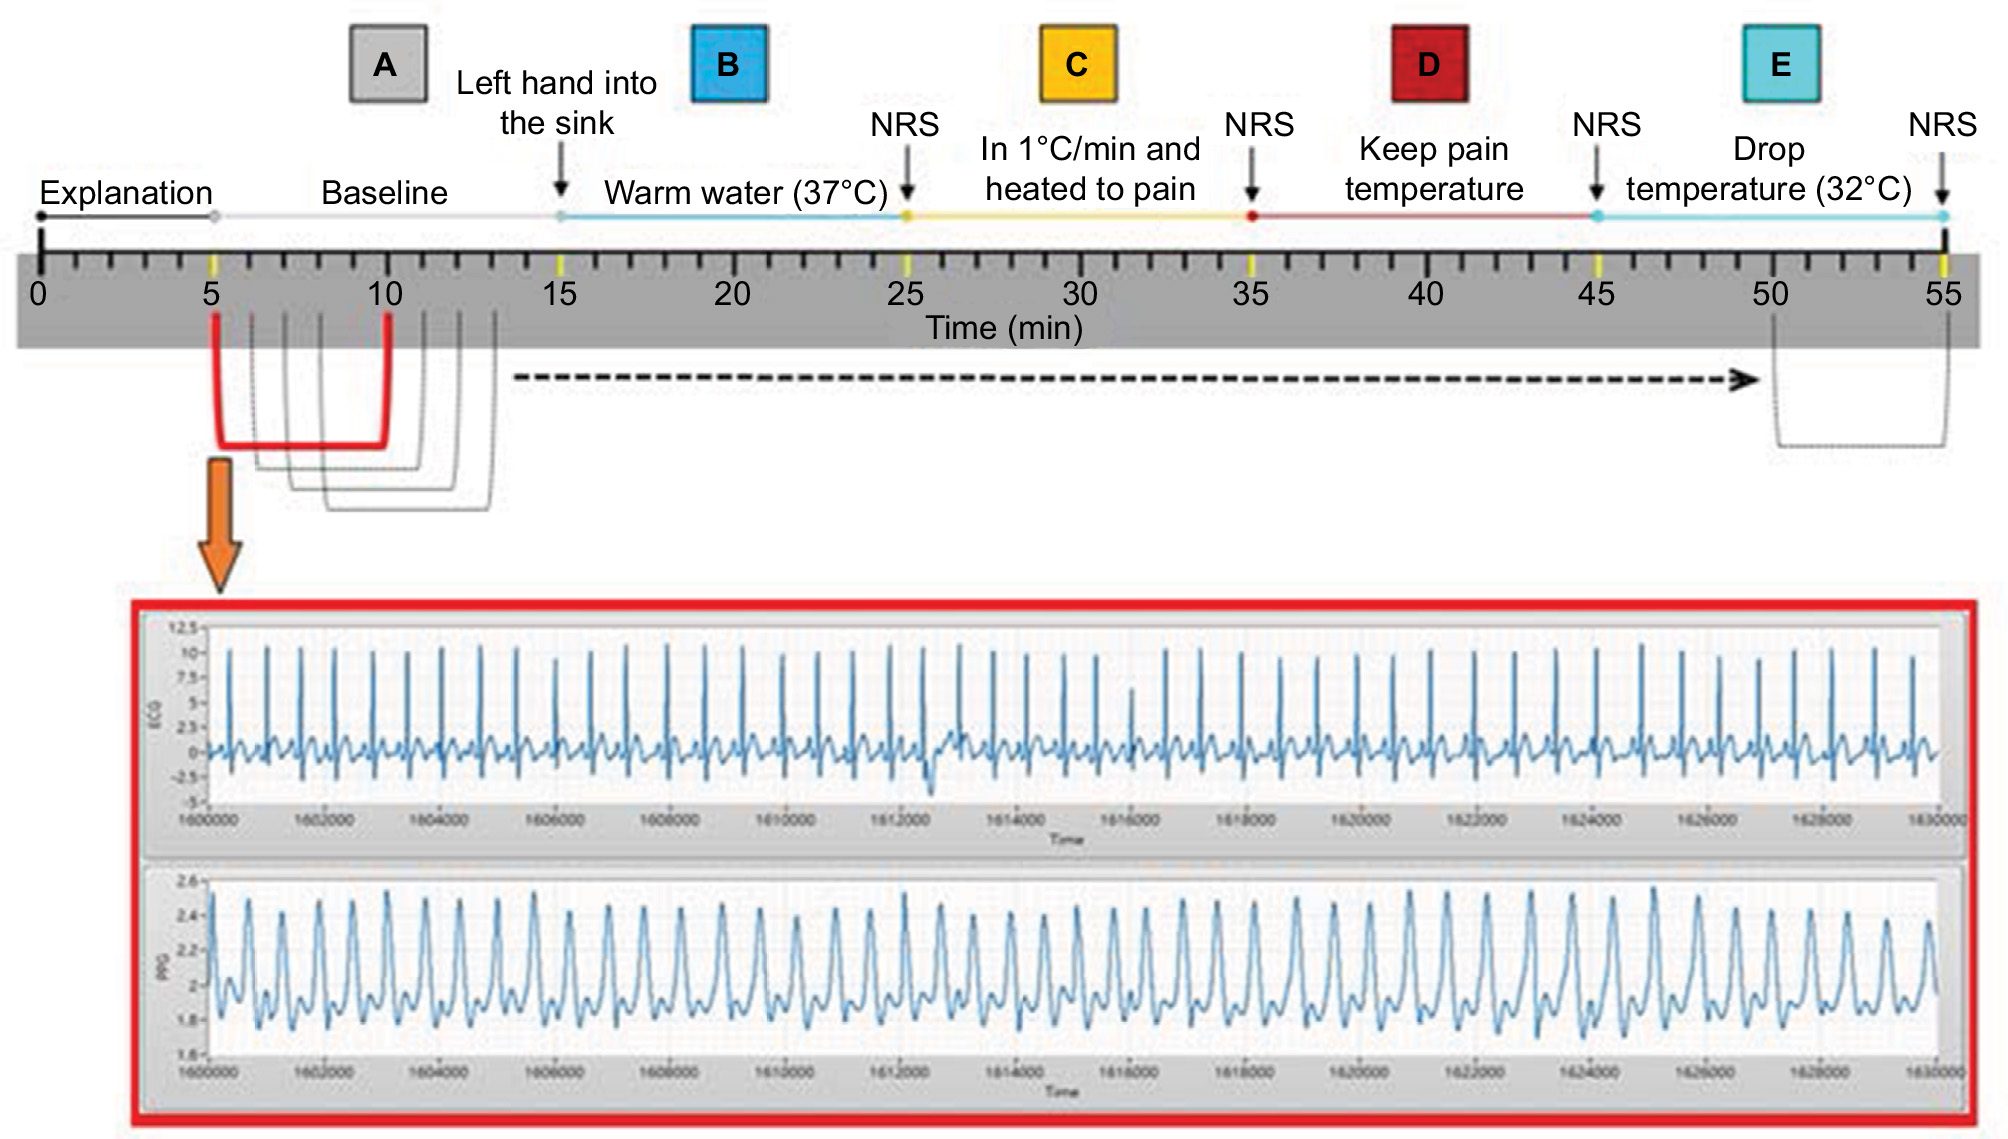 | Figure 2 Experimental process. Notes: The upper panel shows experimental process. The lower panel shows the repeat window method, which had a base unit of 5 min and a delay time of 1 min. Numeric Rating Scale (NRS) is an 11–point scale (0–10) for patient self-reporting of pain. |
Physiological signal recording
We obtained HRV and PPG parameter values by detecting ECG and PPG signals. ECG signal was detected using Ag/AgCl electrodes (35×40 mm; F-TC1; Sofmed, Gangw on-do, Korea) for lead II. The signal was processed using a second-order Butterworth filter (frequency range: 0.05–150 Hz) and a T-type rejection filter (rejected frequency: 60 Hz), with an amplified gain of 1,000. A PPG signal was obtained from a PPG sensor (DS-100A, Nellcor Inc., Pleasanton, CA, USA) attached to the index finger and processed using a second-order Butterworth filter (band pass: 0.01–33 Hz), with an amplified gain of 330. The ECG and PPG signals were connected to a data acquisition device (NI USB-6341, Micro Precision Test Equipment, Grass Valley, CA, USA) and then transferred to a personal computer for simultaneous recording. The sample rate was 1 kHz.
In this study, the total time for signal recording was 50 min. We used LabVIEW (Austin, TX, USA) 2012 to observe the signal changes in greater detail and considered their validity. For the signal analysis, we used a sliding window to resample, with a basic unit of 5 min and a delay time of 1 min, and acquired 45 data samples (we deleted the first 5 min) (Figure 2, lower panel).
After acquiring these 45 data samples, we calculated the HRV and PPG parameters for each sample. The study used a dynamic threshold to acquire the R-wave peak position of the ECG to calculate heart rate (HR) and R-R interval (RRI), measured the RRI using the resampling method proposed by Berger, and acquired high frequency (HF) and low frequency (LF) from the fast Fourier transform.19,20
Based on a review of the previous literature, we found that the pulse of the PPG signal has a direct relationship with the heartbeat. We found the PPG peak point (P peak) and valley point (P valley) from the pulse–pulse interval of PPG. Then, we calculated the PPG parameters according to the 2010 study by Paloheimo et al, including the PPG amplitude (PPGA), baseline (BL), and autonomic nervous system state (ANSS; PPGA × PPI), which are related to the autonomic nervous system activity.21,22
The dynamic threshold formula of HRV is as follows:
|
|
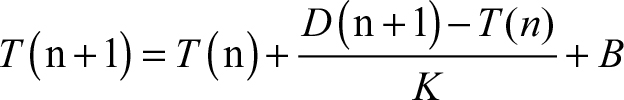
where T(n+1) is the updating threshold, T(n) is the threshold before, D(n+1) is the ECG signal input, K is the weight value, B is the offset, and PPI is the pulse–pulse interval.
Statistical analysis
This study demonstrated the differences between the segments for all the parameters using the repeated measures analysis of variance and was done using IBM SPSS Statistics 22 (IBM Corporation, Armonk, NY, USA). Data are presented as the mean ± standard derivation. We also compared the difference between the trial and control groups using an independent-samples t-test to confirm that there was no basic difference in the information for the participants between the two groups. A P-value <0.05 was considered to indicate a statistically significant difference.
Results
This study included 40 healthy participants: 30 participants in the trial group (14 males and 16 females with a mean age of 22.5±1.9 years) and 10 participants in the control group (7 males and 3 females with a mean age of 22.5±1.3 years) (Table 1). There was no difference between the trial and control groups in relation to their basic information (age, body mass index, and so on). Each subject in the control group immersed their left hand in the 37°C water for 40 min. According to the results, the physiological parameters did not significantly change with the immersion time (Table 2).
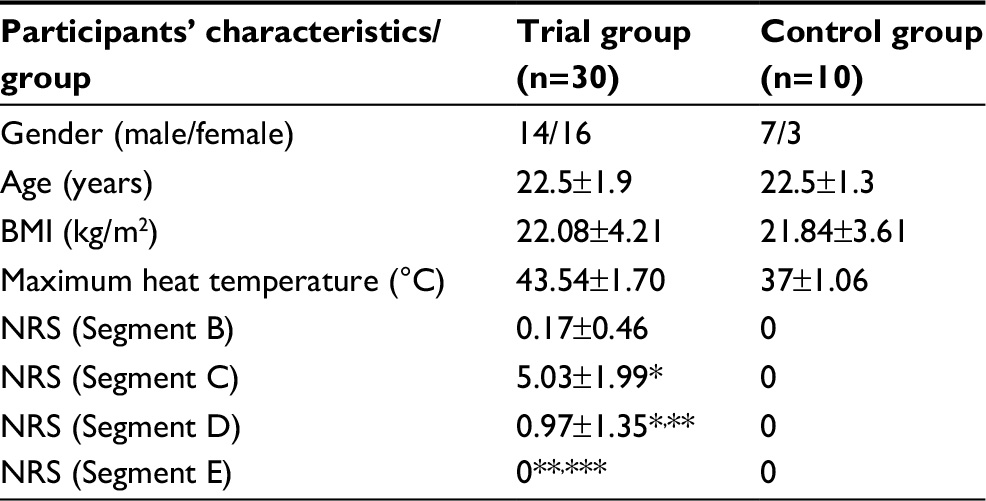 | Table 1 Participants’ characteristics Notes: *p<0.05 versus Segment B; **p<0.05 versus Segment C, ***p<0.05 versus Segment D in the trial group. Abbreviations: BMI, body mass index; NRS, numeric rating scale. |
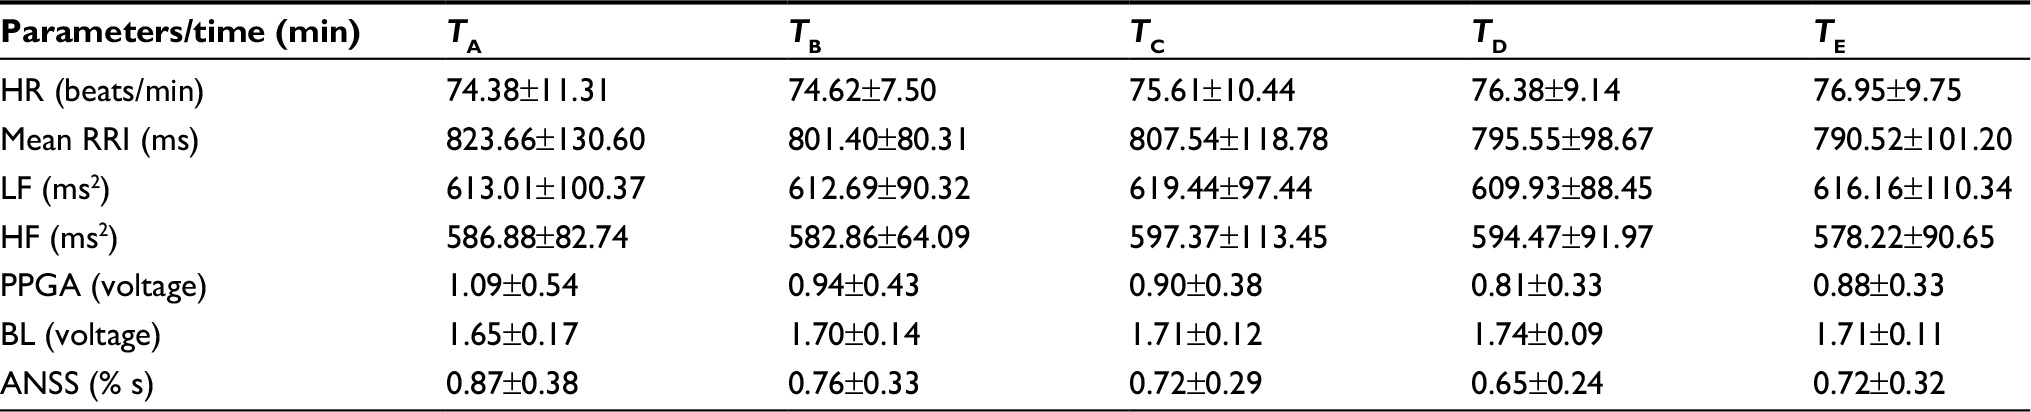 | Table 2 Comparison of results for physiological parameters of control group in each segment Note: There was no significant difference between each segment. Abbreviations: HR, heart rate; RRI, R-R interval; LF, low frequency; HF, high frequency; PPGA, photoplethysmography amplitude; BL, baseline; ANSS, autonomic nervous system state. |
For the trial group, we needed to determine whether there were significant changes in the subjects’ physiological parameters after heat stimulation. The NRS values of the subjects were recorded in the four situations (Segments B, C, D, and E). Their NRS values were 5.03±1.99 at the end of Segment C (in the 31st min) when the temperature was 43.54±1.70°C (Table 1). Table 3 shows that there is no difference between Segments A and B for all the parameters; all the parameters show significant changes in Segment B compared with Segments C and D; some parameters (except HF and LF) also show significant differences between Segments C and D; and HR, RRI, LF, PPGA, and BL show significant differences when comparing Segments D and E.
 | Table 3 Comparison of results for physiological parameters of trial group in each segment Notes: *p<0.05 versus Segment B; **p<0.05 versus Segment C; ***p<0.05 versus Segment D. Abbreviations: HR, heart rate; RRI, R-R interval; LF, low frequency; HF, high frequency; PPGA, photoplethysmography amplitude; BL, baseline; ANSS, autonomic nervous system state. |
To observe the signal changes in more detail in the process of pain production/relief, we used a repeat window to resample and acquired 45 data samples within 45 min (we deleted the first 5 min) for each parameter. Figure 3 shows that all the parameters experience little change in Segment B (11th to 21st min); in Segment C (21st to 31st min), HR increases as the temperature increases, and LF, HF, and PPGA decrease; in the Segment D (31st to 41st min), the water temperature is maintained at the painful level for each subject, HR continuously increases, and the other parameters remain at a horizontal level in the beginning. Then, PPGA quickly rises after 3 min (34th min). LF and HF also rise quickly after 8 min (38th min); during Segment E (41st to 51st min), when cold water is injected into the circulating water to eliminate the pain for all the participants, all the parameters show an opposite change. During the whole process (Segments A–E), RRI changes adversely with HR, the change in ANSS is similar to that of PPGA, and BL shows an adverse change.
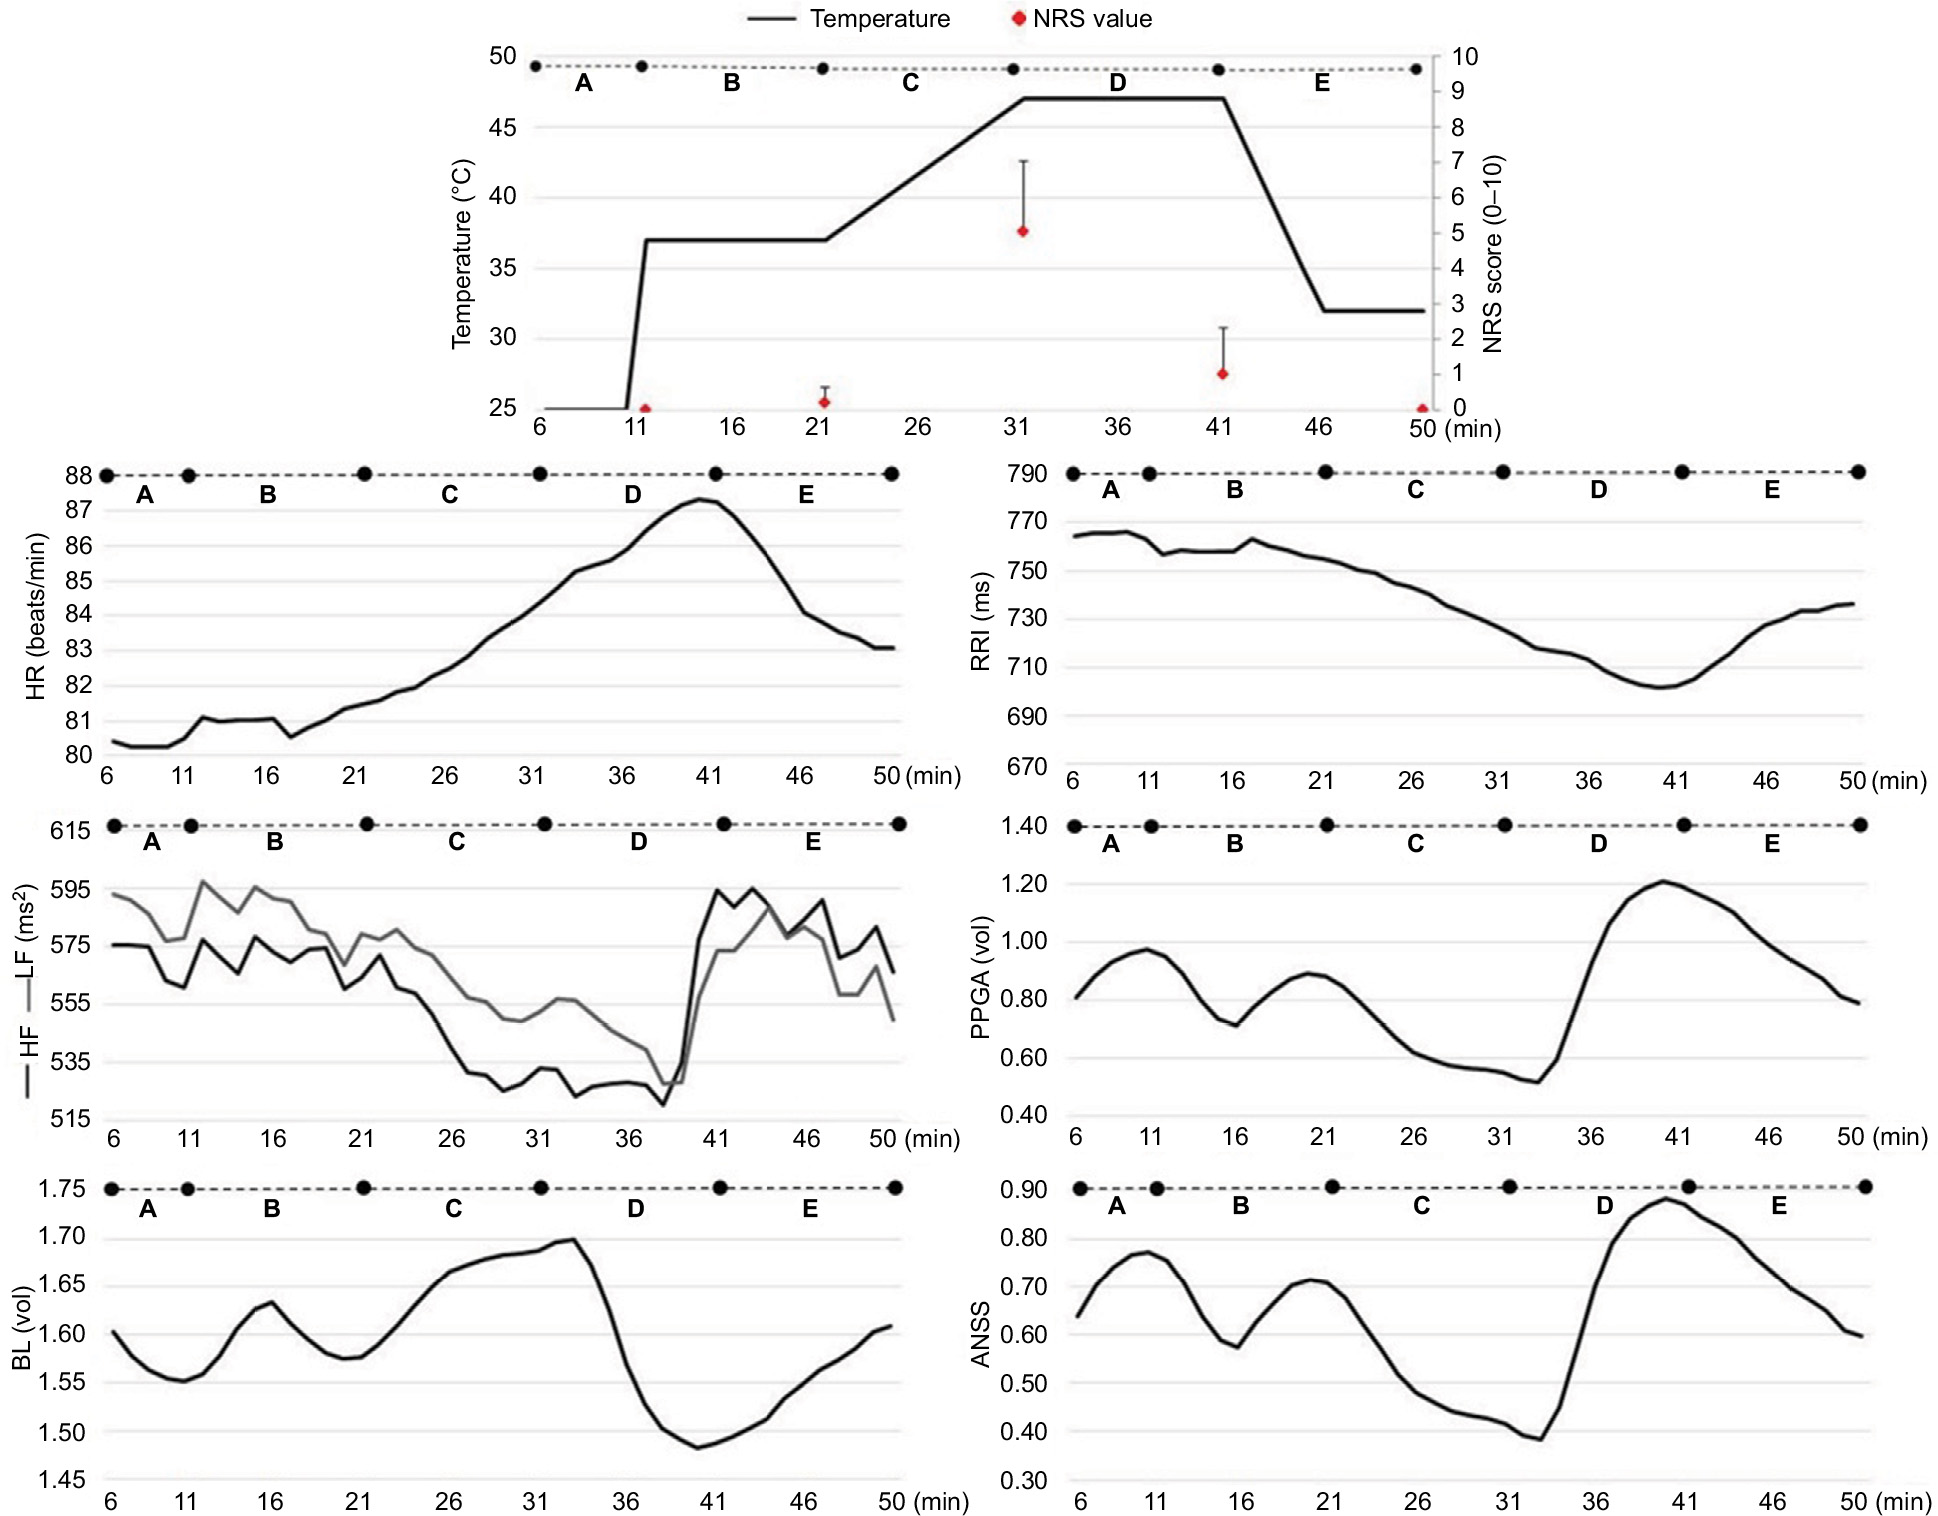 | Figure 3 Physiological parameter fluctuation in each segment. Note: The top panel shows the change in the temperature and NRS of each segment. Abbreviations: NRS, numeric rating scale; RRI, R-R interval; HR, heart rate; LF, low frequency; HF, high frequency; PPGA, photoplethysmography amplitude; BL, baseline; ANSS, autonomic nervous system state. |
Discussion
Although the issue of pain is being taken more seriously than in the past, pain assessment still uses a subjective pain scale or questionnaires to record pain levels in clinical practice. However, these cannot provide continuous observation, and these also have shortcomings or blind spots that limit their usefulness, including inadequate assessment accuracy because of their subjective nature or unclear description. Therefore, this study considered whether finding variation trends in physiological parameters during pain production/relief would make it possible to continuously observe pain intensity. In a clinical setting, HRV is considered to be an index for autonomic nervous activity assessment. When pain is produced, the human body will produce an algogenic substance that affects the autonomic nervous system, thereby causing sympathetic activity and parasympathetic suppression, which in turn increase HR and decrease RRI, LF, and HF.16,23–25 The PPG parameters are considered to be related to the balance of nociception and sympathetic activity and have recently been applied in the anesthesia and pain fields. According to previous studies, PPG parameters immediately showed a response to nociceptive stimulation, and PPGA and ANSS decreased following pain stimulation.14,22,26
In this study, subjects in control group immersed their hand in 37°C water for 40 min, but the HRV and PPG parameters did not change over time. This showed that the changes in the parameters of the trial group were related to pain production/relief. In the trial group, the HRV results for each segment compared were similar to the results of previous studies, but the change we observed in the PPG parameters was different.14,15,24,27 The NRS values were recorded at the end of Segments B–E. Figure 3 shows that the highest NRS value was 5.03±1.99 at the end of Segment C (31st min), which had a medium pain level, but it was decreased to 0.97±1.35 at the end of Segment D (41st min). This may have been because a human’s pain sense is the most intense in the first minute when tonic pain stimulates, and then the pain sense depresses over time.13 Therefore, there was a decrease in the NRS value for Segment D.
At the start of Segment B (11th min), all the parameters slightly changed when the hand was immersed in 37°C water from the room temperature environment, but there was no significant difference in the data between Segments A and B. We consider that this slight change may have been caused by the subjects’ contact with a different environment. In the Segment C, while heating the water at 1°C/min to a painful temperature for each subject, all the parameters seemed to change linearly with the temperature rise. However, in Segment D, each parameter had a different response over time. HR still rose until pain relief; LF and HF remained at a horizontal level in the beginning, but rose from the 37th to 41st min. This may have been because the subjects habituated to the pain or temperature, which caused parasympathetic activity. PPGA and ANSS first dropped to the lowest level and then rose substantially after 2 min (33rd min). Fazalbhoy et al28 found that temporal pain stimulation may cause individual differences in cardiovascular responses and heighten blood pressure. Hence, we conjecture that the response of the PPG parameters may have been caused by prolonged pain stimulation and the baroreceptors being excited by prolonged involvement. That caused the subjects’ blood pressure to increase, and PPGA and ANSS increased following the blood pressure.29,30 In Segment E, when the cold water was injected, the pain progressively disappeared, and most parameters seemed to return to their BL values in Segment B (except HR and RRI).
According to the earlier mentioned results, the responses of the PPG parameters were different from the results of previous studies. PPGA and ANSS decreased when pain was stimulated in previous studies, but in this study, those parameters rose after 3 min during the tonic pain stimulation. We consider that this difference was because the stimulation time was longer in this study. When the HR rises or arterial pressure drops too low, the baroreceptor will produce a reflex to return the arterial pressure to normal, resulting in the vascular center being excited, and an increase in the arterial pressure.31,32 This will cause PPGA to increase and affect other PPG parameters. However, more research data are needed to confirm this inference in the future.
There are two limitations in this study. 1) The study used a repeat window with a basic unit of 5 min and delay time of 1 min for signal processing, which may ignore some detailed information for signals. 2) PPG parameters’ changes were different from those recorded in previous studies, and we consider that this was related to blood pressure. However, continuous blood pressure was not recorded in the study, because the cuff of blood pressure measuring equipment could affect PPG signal.
Conclusion
In this study, we observed the qualitative changes in physiological parameters during the process of pain production and relief and found that the HF, LF, and PPG parameters seemed to have different responses in four situations (no pain, pain production, presence of pain, and pain relief). These variation trends may be used as a reference in the clinical setting for continuously observing pain intensity. In the future, we can add an appropriate method for blood pressure recording to confirm the change of PPG signal, to record the subjective pain sense in greater detail during the process of pain production (in Segments C and D), to quantify the variation in pain production/relief using mathematical methods, and to predict pain production. This could further be applied to cases of clinical pain, and at the same time, may be used to better observe any further changes in such signals.
Author contributions
Jing-Jhao Ye assisted with design of the pain stimulation situation and writing the article and assisted with explaining the results in this article; Kuan-Ting Lee assisted with the related physiological background information research; Jing-Siang Lin assisted with data (participants’ information and signal measurement) collection, as well as data analysis, and statistics; Chiung-Cheng Chuang is responsible for the research execution, including the design of the study procedure, and for writing the article, including the results and discussion explaining the physiological signal variation mechanism. All authors contributed toward data analysis, discussed the best methods for data analysis, drafting and critically revising the paper and agree to be accountable for all aspects of the work.
Disclosure
The authors report no conflicts of interest in this work.
References
Merskey HE. Classification of chronic pain: descriptions of chronic pain syndromes and definitions of pain terms. Pain. 1986;3:1–225. | ||
Loeser JD, Melzack R. Pain: an overview. Lancet. 1999;353(9164):1607–1609. | ||
Polomano RC, Dunwoody CJ, Krenzischek DA, Rathmell JP. Perspective on pain management in the 21st century. J Perianesth Nurs. 2008;23(Suppl 1):S4–S14. | ||
Filos KS, Lehmann KA. Current concepts and practice in postoperative pain management: need for a change? Eur Surg Res. 1999;31(2):97–107. | ||
Apfelbaum JL, Chen C, Mehta SS, Gan TJ. Postoperative pain experience: results from a national survey suggest postoperative pain continues to be undermanaged. Anesth Analg. 2003;97(2):534–540. | ||
Phillips DM. JCAHO pain management standards are unveiled. JAMA. 2000;284(4):428–429. | ||
White MC, Wolf AR. Pain and stress in the human fetus. Best Pract Res Clin Anaesthesiol. 2004;18(2):205–220. | ||
Chuang CC, Chung WY, Shu C, Chen MW. Pain assessment in musculoskeletal pain patients by heart rate variability. J Musculoskelatal Pain. 2007;15(4):67–74. | ||
Benarroch EE. Pain-autonomic interactions: a selective review. Clin Auton Res. 2001;11(6):343–349. | ||
Janig W. The sympathetic nervous system in pain. Eur J Anaesthesiol Suppl. 1995;10:53–60. | ||
Loggia ML, Juneau M, Bushnell MC. Autonomic responses to heat pain: heart rate, skin conductance, and their relation to verbal ratings and stimulus intensity. Pain. 2011;152(3):592–598. | ||
Ikeda K. Quantitative evaluation of pain by analyzing non-invasively obtained physiological data with particular reference to joint healing with continuous passive motion. In: Engineering in Medicine and Biology Society, 1995 and 14th Conference of the Biomedical Engineering Society of India. An International Meeting, Proceedings of the First Regional Conference. IEEE; 1995. | ||
Wolf S, Hardy JD. Studies on pain. Observations on pain due to local cooling and on factors involved in the “cold pressor” effect. J Clin Invest. 1941;20(5):521. | ||
Hamunen K, Kontinen V, Hakala E, Talke P, Paloheimo M, Kalso E. Effect of pain on autonomic nervous system indices derived from photoplethysmography in healthy volunteers. Br J Anaesth. 2012:838–844. | ||
Treister R, Kliger M, Zuckerman G, Goor Aryeh I, Eisenberg E. Differentiating between heat pain intensities: the combined effect of multiple autonomic parameters. Pain. 2012;153(9):1807–1814. | ||
Tousignant-Laflamme Y, Rainville P, Marchand S. Establishing a link between heart rate and pain in healthy subjects: a gender effect. J Pain. 2005;6(6):341–347. | ||
Tousignant-Laflamme Y, Page S, Goffaux P, Marchand S. An experimental model to measure excitatory and inhibitory pain mechanisms in humans. Brain Res. 2008;1230: 73–79. | ||
Rainville P, Bao QV, Chretien P. Pain-related emotions modulate experimental pain perception and autonomic responses. Pain. 2005;118(3):306–318. | ||
Berger RD, Akselrod S, Gordon D, Cohen RJ. An efficient algorithm for spectral analysis of heart rate variability. IEEE Trans Biomed Eng. 1986;33(9):900–904. | ||
Chang CL, Lin KP, Tao TH, Chang WH. Validation of automated arrhythmia detection for Holter ECG. In: Engineering in Medicine and Biology Society, 1998. Proceedings of the 20th Annual International Conference of the IEEE. 1998. IEEE. | ||
Nitzan M, Turivnenko S, Milston A, Babchenko A, Mahler Y. Low-frequency variability in the blood volume and in the blood volume pulse measured by photoplethysmography. J Biomed Opt. 1996;1(2):223–229. | ||
Paloheimo MPJ, Sahanne S, Uutela KH. Autonomic nervous system state: the effect of general anaesthesia and bilateral tonsillectomy after unilateral infiltration of lidocaine. Br J Anaesth. 2010;104(5):587–595. | ||
Pollatos O, Fustos J, Critchley HD. On the generalised embodiment of pain: how interoceptive sensitivity modulates cutaneous pain perception. Pain. 2012;153(8):1680–1686. | ||
Koenig J, Jarczok M, Ellis RJ, Hillecke TK, Thayer JF. Heart rate variability and experimentally induced pain in healthy adults: a systematic review. Eur J Pain. 2014;18(3):301–314. | ||
Xhyheri B, Manfrini O, Mazzolini M, Pizzi C, Bugiardini R. Heart rate variability today. Prog Cardiovasc Dis. 2012;55(3):321–331. | ||
Huiku M, Uutela K, van Gils M, et al. Assessment of surgical stress during general anaesthesia. Br J Anaesth. 2007;98(4):447–455. | ||
Appelhans BM, Luecken LJ. Heart rate variability and pain: associations of two interrelated homeostatic processes. Biol Psychol. 2008;77(2):174–182. | ||
Fazalbhoy A, Birznieks I, Macefield VG. Individual differences in the cardiovascular responses to tonic muscle pain: parallel increases or decreases in muscle sympathetic nerve activity, blood pressure and heart rate. Exp Physiol. 2012;97(10):1084–1092. | ||
Hall JE. Guyton and Hall Textbook of Medical Physiology. Philadelphia, PA: Elsevier Health Sciences; 2015. | ||
Meel-van den Abeelen AS, Lagro J, Gommer ED, Reulen JP, Claassen JA. Baroreflex function is reduced in Alzheimer’s disease: a candidate biomarker? Neurobiol Aging. 2013;34(4):1170–1176. | ||
Chang WD, Lin HY, Lai PT. Comparison of blood pressure and heart rate variability in Saunders cervical traction at three different forces. J Phys Ther Sci. 2012;24(6):509–514. | ||
Hall JE. Guyton and Hall textbook of Medical Physiology. Philadelphia, PA: Elsevier Health Sciences; 2010. |
 © 2017 The Author(s). This work is published and licensed by Dove Medical Press Limited. The full terms of this license are available at https://www.dovepress.com/terms.php and incorporate the Creative Commons Attribution - Non Commercial (unported, v3.0) License.
By accessing the work you hereby accept the Terms. Non-commercial uses of the work are permitted without any further permission from Dove Medical Press Limited, provided the work is properly attributed. For permission for commercial use of this work, please see paragraphs 4.2 and 5 of our Terms.
© 2017 The Author(s). This work is published and licensed by Dove Medical Press Limited. The full terms of this license are available at https://www.dovepress.com/terms.php and incorporate the Creative Commons Attribution - Non Commercial (unported, v3.0) License.
By accessing the work you hereby accept the Terms. Non-commercial uses of the work are permitted without any further permission from Dove Medical Press Limited, provided the work is properly attributed. For permission for commercial use of this work, please see paragraphs 4.2 and 5 of our Terms.