")
Back to Journals » Chronic Wound Care Management and Research » Volume 1
Objective evaluation for venous leg ulcer-related nociceptive pain using thermography
Authors Goto T , Naito A, Tamai N , Nakagami G, Mo M, Sanada H
Received 30 April 2014
Accepted for publication 22 May 2014
Published 14 August 2014 Volume 2014:1 Pages 23—30
DOI https://doi.org/10.2147/CWCMR.S67054
Checked for plagiarism Yes
Review by Single anonymous peer review
Peer reviewer comments 3
Taichi Goto,1 Ayumi Naito,1,2 Nao Tamai,1 Gojiro Nakagami,1 Makoto Mo,3 Hiromi Sanada1
1Department of Gerontological Nursing/Wound Care Management, Graduate School of Medicine, The University of Tokyo, Bunkyo-ku, Tokyo, Japan; 2Fujisawa City Hospital, Fujisawa, Kanagawa, Japan; 3Department of Cardiovascular Surgery, Yokohama Minami Kyosai Hospital, Yokohama, Kanagawa, Japan
Purpose: We aimed to identify distinguishing characteristics in thermographic images of venous leg ulcer (VLU), for objective evaluation of VLU-related nociceptive pain.
Patients and methods: Secondary analysis was performed, using existing data obtained from April to November 2010, for patients with VLU. Thermographic images of wounds and their surrounding area were classified according to the periwound temperature pattern as "normal temperature" or "high temperature". These results were compared with the self-reported pain intensity assessed by the short-form McGill Pain Questionnaire. Cohen's kappa coefficients were used to evaluate the interrater reliability for temperature assessment, and Wilcoxon rank sum test was used to compare pain intensities between the two groups.
Results: Among 39 thermographic examinations in eight patients, 22 were classified into the high-temperature group and 17 into the normal-temperature group. Kappa coefficients for the temperature classification were 0.90 between the wound, ostomy, and continence nurse and a wound care specialist, and 0.90 between the wound, ostomy, and continence nurse and a graduate student. The pain rating index (Z=−2.981, P=0.003), sensory pain (Z=−3.083, P=0.002), affective pain (Z=−2.764, P=0.006), and present pain intensity (Z=−2.639, P=0.006) ratings were significantly higher in the high-temperature group than in the normal-temperature group, but the visual analog scale (Z=−0.632, P=0.527) was not significantly different between the two groups.
Conclusion: Thermographic pattern may reflect VLU-related nociceptive pain due to inflammation and has the possibility of being an easy and rapid tool for objective pain evaluation.
Keywords: short-form McGill Pain Questionnaire, temperature, wound assessment
Introduction
Pain is a common problem in patients with wounds. Wound-related pain can be classified into two types. One is nociceptive pain, defined by the International Association for the Study of Pain as “Pain that arises from actual or threatened damage to non-neural tissue and is due to the activation of nociceptors”, while the other is neuropathic pain, defined as “Pain caused by a lesion or disease of the somatosensory nervous system”.1 Nociceptive pain caused by wound inflammation informs us of the presence of tissue injury and has a harmful role in that it is associated with, not only decreased quality of life, but also, with delayed wound healing.2–4 Moreover, nociceptive pain can lead to hyperalgesia and/or allodynia that are kinds of neuropathic pain.5 Therefore, rapid assessment and appropriate care, for prevention and minimization of wound-related nociceptive pain, are quite important.
Pain is defined by the International Association for the Study of Pain1 as “An unpleasant sensory and emotional experience associated with actual or potential tissue damage, or described in terms of such damage.” Subjective evaluation tools, such as the Visual Analog Scale (VAS), Numerical Rating Scale, or short-form McGill Pain Questionnaire (SF-MPQ) are regarded as “gold standard” pain assessment tools because pain is a subjective experience.6,7 However, these tools cannot be used for patients with cognitive impairment or disturbance of consciousness. Several methods that may be able to evaluate pain objectively have been reported, such as functional magnetic resonance imaging or brain wave that visualize brain function,8–12 or alpha-amylase or skin conductance evaluations of autonomic function,13–15 but these methods cannot be performed rapidly in clinical situations. One promising objective pain evaluation scale for cognitively impaired patients is the Abbey Pain Scale, which consists of subscales for vocalization, facial expression, change in body language, behavioral change, physiological change, and physical changes. A Japanese version has been developed but because of subtle cultural influences on body language, there have been some difficulties with using this scale in Japan.16,17 Furthermore, it cannot be used for bedridden individuals who have total loss of consciousness. A new method is required for objective pain assessment that is performed rapidly and easily at the bedside and that can even be used for patients who cannot communicate.
To address these challenges, we focused on a wound assessment method using thermography. Our laboratory has previously reported that thermography can be used to detect inflammation without clinical manifestations, in pressure ulcer and calluses with diabetic neuropathy.18,19 Wound temperature increases during inflammatory responses, including the immune response of inflammatory cytokine-induced vasodilation, and thus increased tissue metabolism and wound temperature change are possible indicators of inflammation. Chronic ulcer is characterized by prolonged inflammation, defective re-epithelialization, and impaired matrix remodeling.20 Therefore, wound temperature can be a useful indicator of wound-related inflammation and may be useful for evaluation for wound-related nociceptive pain.
In order to investigate the possibility of thermographic assessment for wound-related pain, we focused on patients with venous leg ulcer (VLU) who were experiencing severe or continuous pain. VLU is almost always caused by chronic venous insufficiency. In Western adult populations, the prevalence of VLU is 1%, and the incidence increases with age.21,22 VLU accounts for 50%–80% of all lower extremity ulcers.23,24 Importantly, around 80% of patients with VLU experience pain.25,26 VLU-related pain is classified as either nociceptive pain or neuropathic pain and the nociceptive pain, which is associated with inflammation, accounts for nearly 60 % of all ulcer-related pain.23 Especially in VLU, previous studies have suggested that a possible reason for the prolonged inflammation is that leukocytes are trapped in limbs with venous insufficiency.25 Furthermore, increased temperature related to skin inflammation is considered a sign of VLU development.26 We can identify inflammation by clinical manifestations such as erythema; however, erythema associated with VLU may be masked by pigmentation. Due to this, other objective pain-associated parameters are required. Therefore, wound temperature may be a useful indicator of wound-related nociceptive pain status.
The aim of this study was to investigate characteristics of VLU thermographic images, in order to establish a rapid, easy, and objective evaluation method for VLU-related nociceptive pain.
Material and methods
Study design
This study was a secondary analysis, using previously collected study data.27
Patients were recruited between April and November 2010. The study setting was a general hospital in an urban area located in Kanagawa, Japan. The inclusion criteria were adult patients diagnosed with VLU who had treatments scheduled in the facility. The exclusion criteria were difficulty in communication; arterial ulcers or mixed ulcers (venous and arterial), with an Ankle Brachial Pressure Index score <0.8;28 wound infection, by bacteriological culture and/or appearance; and no previous record of thermographic or SF-MPQ data. Examinations were performed every 1 or 2 weeks until wound closure or end of the follow-up period (up to 24 weeks); in some cases, the interval exceeded 2 weeks because of schedules of care at the clinic. Any analgesic use was not controlled.
Study protocol
The protocol received approval from the Ethical Committee of the Graduate School of Medicine, University of Tokyo, and the Yokohama Minami Kyosai Hospital. Written informed consent was obtained from the enrolled patients.
Data collection
A wound, ostomy, and continence nurse (WOCN) and a graduate student in nursing evaluated the patients during their routine treatments. Demographic data including age, sex, body mass index (BMI), and Clinical, Etiological, Anatomical, and Pathophysiological (CEAP) classification29 were obtained from medical records. Every evaluation included a thermographic assessment, photography, and the Japanese version of the SF-MPQ, which has been shown to have good reliability and validity.30 Thermographic and photographic images included the wound bed and the periwound skin. The SF-MPQ consists of 15 descriptors, with the total score for descriptors 1–11 representing the sensory dimension of the pain experience and the total score for descriptors 12–15 representing the affective dimension; the total score of all 15 descriptors represents the pain rating index. Each descriptor is ranked on an intensity scale of 0= none, 1= mild, 2= moderate, and 3= severe. The present pain intensity, ranked on an intensity scale of 0= none, 1= mild, 2= discomforting, 3= distressing, 4= horrible, and 5= excruciating, and the 0.0–10.0 cm VAS, anchored with ‘‘none’’ and ‘‘worst imaginable pain”, were also included to provide the overall intensity score.7
Thermographic assessment
Thermographic images of the wound bed and periwound skin were obtained using infrared thermography (Thermo Tracer TH5108ME; Nippon Avionics Co., Ltd., Tokyo, Japan [originally developed by NEC Sanei Co. Ltd., Tokyo, Japan]). The measurable range of the device was 0°C–70°C, with an error range of ±0.7°C, and accuracy to 0.1°C. According to the thermographic data, wound bed temperature was lower than periwound temperature (Figure 1). This feature was observed in almost all cases that healed normally, and in some cases, a temperature increase occurred specifically at the periwound area (Figure 1B). On the other hand, in cases where epithelialization was occurring within the wound bed, the temperature of the sites of epithelialization was nearly equal to the periwound temperature (Figure 2). Due to this, we focused on graphical assessment instead of the detailed temperature.18 We classified the thermography results into two groups: “normal temperature” (uniform periwound skin temperature) (Figure 1A) and “high temperature” (periwound skin temperature is not uniform, with specifically high temperatures at some areas of the periwound skin) (Figure 1B). Three research nurses, including a WOCN with a PhD degree in medicine (different from the first WOCN who collected data), a wound care specialist with a PhD degree in nursing, and a graduate student in nursing (different from the first graduate student who collected data), classified the thermographic images as normal temperature or high temperature without receiving any information regarding pain intensities. Kappa coefficients were calculated to assess interrater reliability, and if the opinions were inconsistent, consensus was reached by discussion among the three nurses.
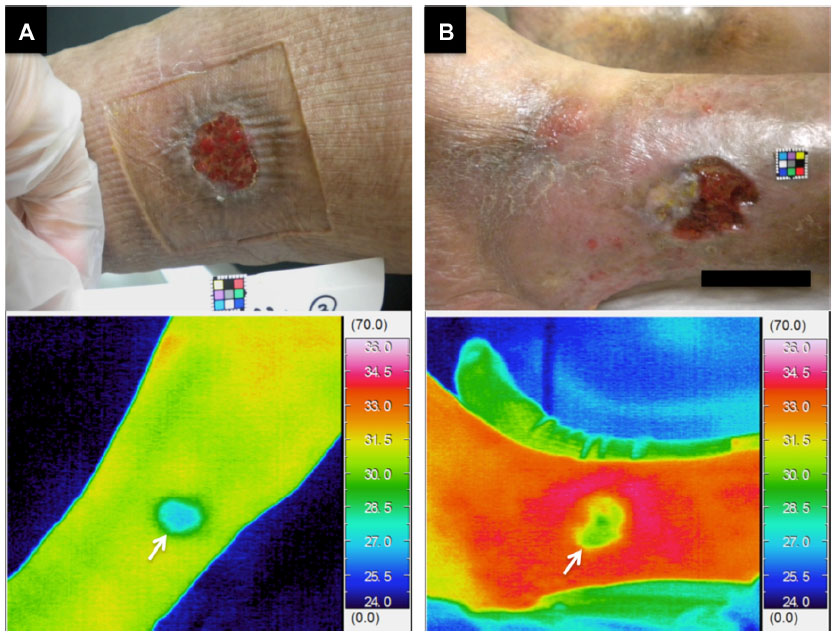 | Figure 1 Gross appearance and thermography of venous leg ulcers (left, patient number 2; right, patient number 1). |
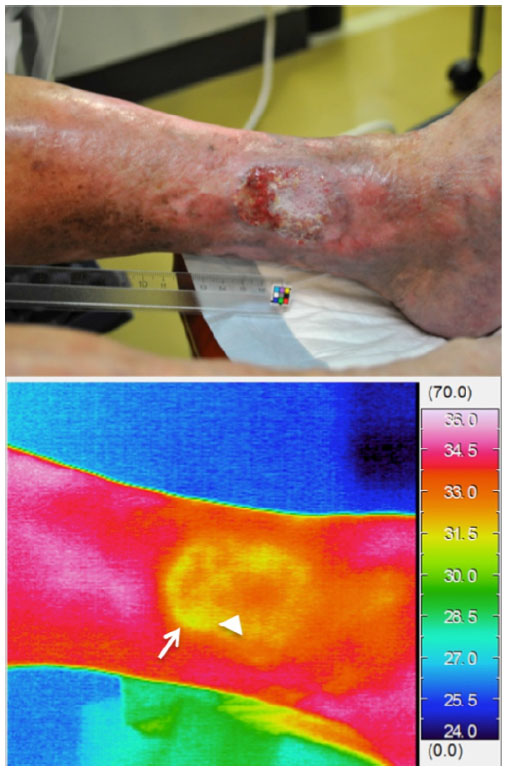 | Figure 2 Gross appearance and thermography of venous leg ulcer in patient number 3. |
Statistical analysis
Values were presented as median with interquartile range (IQR) unless otherwise indicated. Cohen’s kappa coefficients were used to evaluate the interrater reliability for the thermographic temperature assessment. The Wilcoxon rank sum test was used to compare SF-MPQ pain scores between the high- and normal-temperature groups. A P-value less than 0.05 was regarded as statistically significant. All statistical analyses were performed using JMP Pro Version 10.0.2 (SAS Institute Inc., Cary, NC, USA).
Results
The patient characteristics and demographic data are shown in Table 1. Results from 39 examinations (two results for the VAS were missing) were available from eight patients, including six women and two men. The median (IQR) age was 76.5 (65.8–82.8) years, and body mass index (BMI) was 25.3 (22.1–28.4) kg/m2. The wound age was 15.5 (6.0–23.0) weeks.
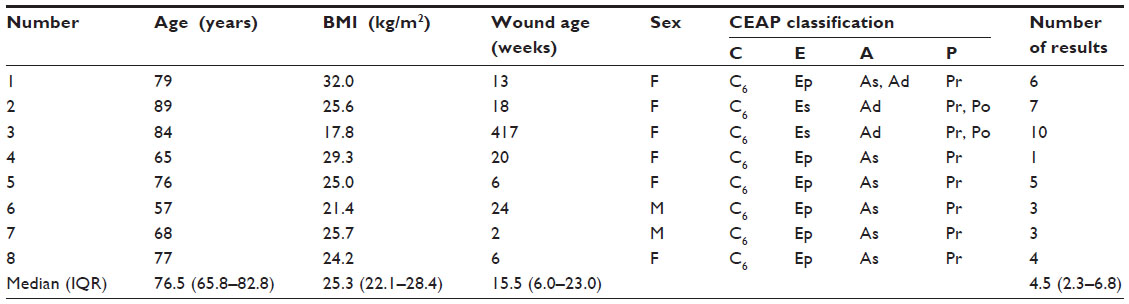 | Table 1 Patient characteristics |
A total of 22 thermographic images were classified as high temperature and 17 as normal temperature. Kappa coefficients for the interrater reliability of temperature classification were 0.90 between the WOCN and the wound care specialist with PhD degree, and 0.90 between the WOCN and the graduate student in nursing. On the SF-MPQ, the intensities scores ≥1 in over 50% of the responses were for “throbbing” (66.7%), “aching” (51.3%), and “tender” (82.1%) (Table 2). According to the comparison of pain intensity between the high- and normal-temperature groups by Wilcoxon rank sum tests, the pain rating index (median [IQR] =5.0 [2.0–13.0]) (Z=−2.981, P=0.003), sensory pain (median [IQR] =4.0 [2.0–11.0]) (Z=−3.083, P=0.002), affective pain (median [IQR] =0.0 [0.0–3.0]) (Z=−2.764, P=0.006), and present pain intensity (median [IQR] =1.0 [1.0–2.0]) (Z=−2.639, P=0.006) were significantly higher in the high-temperature group than in the normal-temperature group, but the VAS (median [IQR] =5.0 [3.0–7.3]) (Z=−0.632, P=0.527) was not significantly different between the two groups (Figure 3).
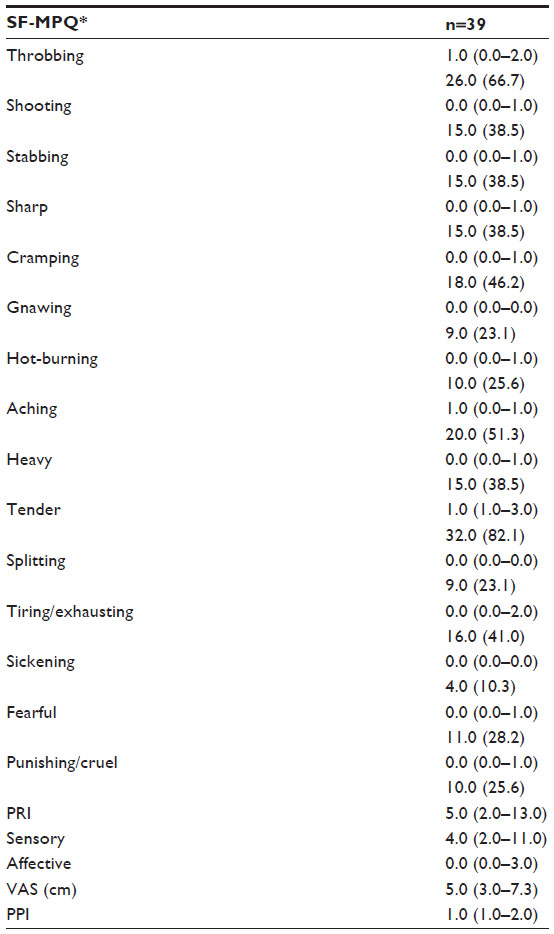 | Table 2 Short-form McGill Pain Questionnaire results |
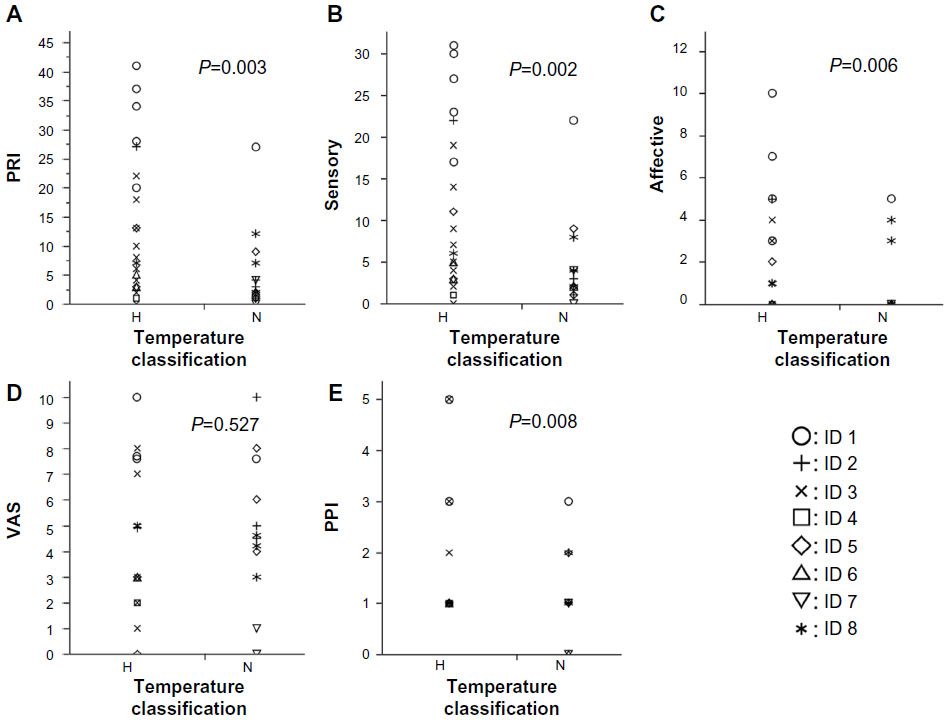 | Figure 3 Comparison of pain intensity levels between the high- and normal-temperature groups: (A) pain rating index; (B) sensory pain; (C) affective pain; (D) visual analog scale; and (E) present pain intensity. |
Discussion
We investigated whether VLU temperature classification using thermography could reflect VLU-related pain evaluated by the SF-MPQ. To our knowledge, the results of this study are the first to suggest that a temperature increase occurring specifically at the periwound skin is a possible indicator for VLU-related pain. The kappa coefficients indicating a high reliability of the thermographic assessment suggest that this assessment can be performed easily and reliably.
We previously reported a novel method to predict delayed healing in pressure ulcers, using thermographic assessment, which is easily applied in the clinical setting as it is noninvasive and takes only a few minutes to perform.18 The thermographic assessment method used in this study was similar to the previous method. In the previous study, when inflammation occurred in a pressure ulcer, the wound bed temperature was higher than the periwound temperature, and the temperature difference was associated with delayed healing. In the present study, we focused on periwound skin temperature rather than on wound bed temperature, because in VLU the wound bed temperature may not change according to the presence of inflammation. Interestingly, in the present study, thermography indicated that the wound bed temperatures in VLUs were lower than the periwound temperatures, or of the entire lower extremity. It is conceivable that this occurred because wounds of VLU are relatively shallow and wide and produce large amounts of exudate. Moreover, epithelialization of the VLU may occur, not only from the wound edge, but also, within the wound bed, and relatively high temperatures were observed in the epithelialized wound bed (Figure 2). For these reasons, it is difficult to distinguish temperature increase due to inflammation from that due to epithelialization. Thus, we focused on the periwound temperature in this study and observed a certain level of reliability of the method.
As shown in Table 2, frequently observed expressions of pain included “throbbing”, “aching”, and “tender”. In a previous study, “throbbing”, “burning”, “itchy”, “stinging”, and “tender” were extracted as specific sensory pain descriptions for VLU, and our result is consistent with that study.31 This suggested that SF-MPQ was valid for expressing the pain of VLU in the present study.
In this study, we classified the thermographic images into two groups and compared pain intensity between the groups. The high-temperature group showed significantly higher sensory pain scores (possibly related to inflammatory pain) and affective pain scores (possibly related to emotional experience) and a resulting higher pain rating index compared with the normal-temperature group. This suggests that pain and temperature increase as symptoms of inflammation occur at the same time. On the other hand, there was no significant difference in the results of the VAS between the two groups. Because VAS 10.0 cm indicates maximum pain that subjects have felt so far, the meaning of the score varies among patients. Therefore, it is not surprising that the thermographic assessment did not relate to VAS in the present study.
There may be several reasons for the association of periwound temperature increase in VLU and pain presence. It is possible that inflammatory responses in the wound affect the periwound skin temperature. During the acute phase of wound healing, this may be due to the acute inflammatory response with the occurrence of ulcer. Previous studies have suggested that a consistent feature of VLU formation is chronic inflammation associated with the trapping of activated leukocytes in limbs with venous insufficiency.25 In addition, it has been shown that chronically inflamed tissues contain high numbers of activated neutrophils, which release an excessive quantity of proteases. As a result, tissue destruction and persistent inflammation can occur. The inflammatory response is firstly caused by the degranulation of platelets and chemotaxis of neutrophils.32 Next, increased blood flow, caused by significant vasodilation, leads to wound bed temperature increase, and the response spreads to periwound tissues. The proinflammatory cytokines that cause peripheral sensitization and pain are mainly released during this phase. The wound age of the patients in this study was from 2 to 417 weeks, and it is conceivable that the pain of some of the patients with short duration age of wounds may have been caused by this mechanism. In addition, in cases with exacerbation of edema during the chronic phase, an inflammatory response by similar mechanisms may cause periwound temperature increase and pain. Extravasation of leukocytes, caused by edema exacerbation, induces a recurrent inflammatory response, and indeed, some examinations in the current study showed transient increases of periwound temperature and pain intensity during the healing process.
There were several limitations of this study. First, the sample size was limited, and the numbers of results varied in patients. Due to this small number of patients, it was difficult to control the intraindividual correlation that might affect the relationship between wound temperature classification and pain ratings. To address this limitation, we plotted each result in Figure 3 and found no particular data that might distort the their distributions and cause unintentional biases. Second, there could be several factors affecting VLU-related inflammation, but the thermographic assessment cannot reveal the causes of inflammation and pain presence. Third, we included only patients with VLU who were ambulatory and could visit the clinic by themselves, so generalization of our findings may be limited to such a population and difficult to extend to patients with severe pain. Nonetheless, the results of this study suggest that thermographic assessment may be an objective indicator of VLU-related pain. It could lead to the possibility of an assessment tool for those patients who are not able to complain of pain because of cognitive disorder or disturbance of consciousness. Furthermore, in a nursing practice, early detection of pain can encourage preemptive measures against, and rapid and appropriate care for, painful events. Further study, to account for the cause of wound inflammation, is required to provide specific pain care. Other wound-related factors should be investigated, such as wound fluid content as well as the bacteria that can indicate wound status in detail, to comprehensively assess wound-related pain in combination with thermography.
Conclusion
Thermographic images reflect VLU-related nociceptive pain due to inflammation, and its classification method can be a novel technique for objective pain evaluation.
Disclosure
The authors declare no conflicts of interest regarding this work.
References
IASP Taxonomy - IASP [homepage on the Internet]. International Association for the Study of Pain online resources. IASP; 2012 [update May 22, 2012; cited May 15, 2014]. Available from: https://www.iasp-pain.org/Education/Content.aspx?ItemNumber=1698. Accessed May 15, 2014. | |
Persoon A, Heinen MM, van der Vleuten CJ, de Rooij MJ, van de Kerkhof PC, van Achterberg T. Leg ulcers: a review of their impact on daily life. J Clin Nurs. 2004;13(3):341–354. | |
Ebrecht M, Hextall J, Kirtley LG, Taylor A, Dyson M, Weinman J. Perceived stress and cortisol levels predict speed of wound healing in healthy male adults. Psychoneuroendocrinology. 2004;29(6):798–809. | |
McGuire L, Heffner K, Glaser R, et al. Pain and wound healing in surgical patients. Ann Behav Med. 2006;31(2):165–172. | |
Schaible HG. Peripheral and central mechanisms of pain generation. Handb Exp Pharmacol. 2007;177:3–28. | |
Hawker GA, Mian S, Kendzerska T, French M. Measures of adult pain: Visual Analog Scale for Pain (VAS Pain), Numeric Rating Scale for Pain (NRS Pain), McGill Pain Questionnaire (MPQ), Short-Form McGill Pain Questionnaire (SF-MPQ), Chronic Pain Grade Scale (CPGS), Short Form-36 Bodily Pain Scale (SF-36 BPS), and Measure of Intermittent and Constant Osteoarthritis Pain (ICOAP). Arthritis Care Res (Hoboken). 2011;63(Suppl 11):S240–252. | |
Melzack R. The short-form McGill pain questionnaire. Pain. 1987;30(2):191–197. | |
Maeda L, Ono M, Koyama T, et al. Human brain activity associated with painful mechanical stimulation to muscle and bone. J Anesth. 2011;25(4):523–530. | |
Takemura Y, Yamashita A, Horiuchi H, et al. Effects of gabapentin on brain hyperactivity related to pain and sleep disturbance under a neuropathic pain-like state using fMRI and brain wave analysis. Synapse. 2011;65(7):668–676. | |
Uematsu H, Shibata M, Miyauchi S, Mashimo T. Brain imaging of mechanically induced muscle versus cutaneous pain. Neurosci Res. 2011;70(1):78–84. | |
Jensen MP, Sherlin LH, Gertz KJ, et al. Brain EEG activity correlates of chronic pain in persons with spinal cord injury: clinical implications. Spinal Cord. 2013;51(1):55–58. | |
Staahl C, Krarup AL, Olesen AE, Brock C, Graversen C, Drewes AM. Is electrical brain activity a reliable biomarker for opioid analgesia in the gut? Basic Clin Pharmacol Toxicol. 2011;109(5):321–327. | |
Campos MJ, Raposo NR, Ferreira AP, Vitral RW. Salivary alpha- amylase activity: a possible indicator of pain-induced stress in orthodontic patients. Pain Med. 2011;12(8):1162–1166. | |
Ledowski T, Bromilow J, Wu J, Paech MJ, Storm H, Schug SA. The assessment of postoperative pain by monitoring skin conductance: results of a prospective study. Anaesthesia. 2007;62(10):989–993. | |
Storm H, Myre K, Rostrup M, Stokland O, Lien MD, Raeder JC. Skin conductance correlates with perioperative stress. Acta Anaesthesiol Scand. 2002;46(7):887–895. | |
Takai Y, Yamamoto-Mitani N, Ko A, Heilemann MV. Differences in pain measures by mini-mental state examination scores of residents in aged care facilities: examining the usability of the Abbey pain scale-Japanese version. Pain Manag Nurs. 2014;15(1):236–245. | |
Takai Y, Yamamoto-Mitani N, Chiba Y, Nishikawa Y, Hayashi K, Sugai Y. Abbey Pain Scale: development and validation of the Japanese version. Geriatr Gerontol Int. 2010;10(2):145–153. | |
Nakagami G, Sanada H, Iizaka S, et al. Predicting delayed pressure ulcer healing using thermography: a prospective cohort study. J Wound Care. 2010;19(11):465–466, 468, 470. | |
Nishide K, Nagase T, Oba M, et al. Ultrasonographic and thermographic screening for latent inflammation in diabetic foot callus. Diabetes Res Clin Pract. 2009;85(3):304–309. | |
Schultz GS, Sibbald RG, Falanga V, et al. Wound bed preparation: a systematic approach to wound management. Wound Repair Regen. 2003;11 Suppl 1:S1–S28. | |
O’Brien JF, Grace PA, Perry IJ, Burke PE. Prevalence and aetiology of leg ulcers in Ireland. Ir J Med Sci. 2000;169(2):110–112. | |
Margolis DJ, Bilker W, Santanna J, Baumgarten M. Venous leg ulcer: incidence and prevalence in the elderly. J Am Acad Dermatol. 2002;46(3):381–386. | |
Briggs M, Bennett MI, Closs SJ, Cocks K. Painful leg ulceration: a prospective, longitudinal cohort study. Wound Repair Regen. 2007;15(2):186–191. | |
Hopman WM, Buchanan M, VanDenKerkhof EG, Harrison MB. Pain and health-related quality of life in people with chronic leg ulcers. Chronic Dis Inj Can. 2013;33(3):167–174. | |
Abbade LP, Lastória S. Venous ulcer: epidemiology, physiopathology, diagnosis and treatment. Int J Dermatol. 2005;44(6):449–456. | |
Sayre EK, Kelechi TJ, Neal D. Sudden increase in skin temperature predicts venous ulcers: a case study. J Vasc Nurs. 2007;25(3):46–50. | |
Naito A, Oe M, Okajima S, et al. A qualitative study of morphological characteristics and wound healing process in venous leg ulcers. J Jpn WOCM. 2011;16(3):257–267. Japanese. | |
Orchard TJ, Strandness DE. Assessment of peripheral vascular disease in diabetes. Report and recommendations of an international workshop sponsored by the American Diabetes Association and the American Heart Association September 18–20, 1992 New Orleans, Louisiana. Circulation. 1993;88(2):819–828. | |
Eklöf B, Rutherford RB, Bergan JJ, et al; American Venous Forum International Ad Hoc Committee for Revision of the CEAP Classification. Revision of the CEAP classification for chronic venous disorders: consensus statement. J Vasc Surg. 2004;40(6):1248–1252. | |
Yamaguchi M, Kumano H, Yamauchi Y, Kadota Y, Iseki M. The development of a Japanese version of the short-form McGill Pain Questionnaire. J Japan Soc Pain Clin. 2007;14(1):9–14. Japanese. | |
Closs SJ, Nelson EA, Briggs M. Can venous and arterial leg ulcers be differentiated by the characteristics of the pain they produce? J Clin Nurs. 2008;17(5):637–645. | |
McDaniel JC, Roy S, Wilgus TA. Neutrophil activity in chronic venous leg ulcers – a target for therapy? Wound Repair Regen. 2013;21(3):339–351. |
 © 2014 The Author(s). This work is published and licensed by Dove Medical Press Limited. The full terms of this license are available at https://www.dovepress.com/terms.php and incorporate the Creative Commons Attribution - Non Commercial (unported, v3.0) License.
By accessing the work you hereby accept the Terms. Non-commercial uses of the work are permitted without any further permission from Dove Medical Press Limited, provided the work is properly attributed. For permission for commercial use of this work, please see paragraphs 4.2 and 5 of our Terms.
© 2014 The Author(s). This work is published and licensed by Dove Medical Press Limited. The full terms of this license are available at https://www.dovepress.com/terms.php and incorporate the Creative Commons Attribution - Non Commercial (unported, v3.0) License.
By accessing the work you hereby accept the Terms. Non-commercial uses of the work are permitted without any further permission from Dove Medical Press Limited, provided the work is properly attributed. For permission for commercial use of this work, please see paragraphs 4.2 and 5 of our Terms.