")
Back to Journals » ClinicoEconomics and Outcomes Research » Volume 10
Obesity in Germany and Italy: prevalence, comorbidities, and associations with patient outcomes
Authors DiBonaventura M, Nicolucci A , Meincke H, Le Lay A, Fournier J
Received 27 November 2017
Accepted for publication 23 May 2018
Published 24 August 2018 Volume 2018:10 Pages 457—475
DOI https://doi.org/10.2147/CEOR.S157673
Checked for plagiarism Yes
Review by Single anonymous peer review
Peer reviewer comments 3
Editor who approved publication: Dr Xing Lin Feng
Marco DiBonaventura,1 Antonio Nicolucci,2 Henrik Meincke,3 Agathe Le Lay,3 Janine Fournier4
1Kantar Health, Health Outcomes Practice, New York, NY, USA; 2Center for Outcomes Research and Clinical Epidemiology, Pescara, Italy; 3Novo Nordisk A/S, Soeborg, Denmark; 4Novo Nordisk, Plainsboro, NJ, USA
Purpose: This study investigated the association between body mass index (BMI) and three comorbid conditions (type 2 diabetes [T2D], prediabetes, and hypertension) on humanistic and economic outcomes.
Patients and methods: This retrospective observational study collected data from German (n=14286) and Italian (n=9433) respondents to the 2013 European Union National Health and Wellness Survey, a cross-sectional, nationally representative online survey of the general adult population. Respondents were grouped, based on their self-reported BMI, and stratified into three other comorbid conditions (T2D, prediabetes, and hypertension). Generalized linear models, controlling for demographics and health characteristics, tested the relationship between BMI and health status, work productivity loss, and health care resource utilization. Indirect and direct costs were calculated based on overall work productivity loss and health care resource utilization, respectively. The same generalized linear models were also performed separately for those with T2D, prediabetes, and hypertension.
Results: The sample of German respondents was 50.16% male, with a mean age of 46.68 years (SD =16.05); 35.24% were classified as overweight and 21.29% were obese. In Italy, the sample was 48.34% male, with a mean age of 49.27 years (SD =15.75); 34.85% were classified as overweight, and 12.89% were obese. Multivariable analyses demonstrated that, in both countries, higher BMI was associated with worse humanistic outcomes and only those from Germany also reported greater direct and indirect costs. Differences in the impact of BMI on outcomes by country were additionally found when the sample was stratified into those with prediabetes, T2D, and hypertension.
Conclusion: The high percentage of patients who are overweight or obese in Germany and Italy remains problematic. Better elucidating the impact of overweight or obese BMI, as well as the incremental effects of relevant comorbid conditions, on humanistic and economic outcomes is critical to quantify the multifaceted burden on individuals and society.
Keywords: body mass index, costs, health care resource utilization, health status, work productivity loss, weight loss
Introduction
The World Health Organization defines obesity as having a body mass index (BMI) of ≥30.00 kg/m2, with the degree of obesity defined as class I (BMI 30.00–34.99 kg/m2), class II (BMI 35.00–39.99 kg/m2), and class III (BMI ≥40.00 kg/m2).1 Over the past several decades, the worldwide obesity epidemic has grown at an alarmingly high rate. The proportion of overweight or obese adults with a BMI of ≥25.00 kg/m2 has increased among men from 29.0% in 1980 to 37.0% in 2013 and from 30.0% in 1980 to 38.0% in 2013 in women.2 In 2013, according to the Global Burden of Disease Study, the proportion of obese or overweight adults (BMI ≥25 kg/m2) in the USA was 70.9% for men and 61.9% for women and the proportion of obese adults was 31.7% for men and 33.9% for women.2 In Asia, obesity has been increasing, as well. However, estimates of the prevalence of obesity are lower than for Western Europe and North America. For example, in China, the proportions of obese men and women in 2013 were 3.8% and 5.0%, respectively, and in Japan, these values amounted to 4.5% and 3.3%. In Western Europe, the numbers were not very different from the USA: 61.3% of men and 47.6% of women were considered obese or overweight (BMI ≥25.00 kg/m2) and 21.0% of the adult population was obese (similar proportions were observed in men and women). Specifically, data from the German Health Interview and Examination Survey for Adults found that >23.0% of both adult men and women were obese, while 67.1% of men and 53.0% of women were in the overweight category.3 Similarly, a study by Gallus et al,4 which accumulated survey data from 2006 to 2010, estimated that 31.8% and 8.9% of adults in Italy were overweight and obese, respectively. Furthermore, these rates appear to be increasing in Italy, as a 2015 study found that 36.2% of Italians were overweight and 10.2% were obese.5
Obesity is also a risk factor for a variety of diseases, such as cardiovascular disease, cancer, type 2 diabetes (T2D), osteoarthritis, nonalcoholic fatty liver disease, sleep apnea, and psychiatric conditions.6–11 Additionally, obesity has been linked to a shorter life expectancy,12,13 which can be largely attributed to the comorbidities associated with the condition.7 Primarily because of this large disease burden, obesity has been associated with high societal costs. Konnopka et al14 estimated that obesity resulted in €4.85 million in direct costs in Germany and €5.02 million in indirect costs from sickness, early retirement, and premature mortality. An updated analysis using data collected in 2008 found that these direct and indirect costs increased by 70.0% and 62.0%, respectively.15 Furthermore, obesity costs the social security system of Germany between €16000 and €207000 over an individual’s lifetime.16 Data from other countries show that the societal burden due to obesity is quite universal. In the USA, for example, obesity among working adults was shown to be associated with a significant increase in absenteeism, resulting in the estimated indirect costs of $8.65 billion per year. It was also shown in this study that 6.5%–12.6% of total absenteeism costs in the workplace are due to obesity.17 In the Netherlands, the annual direct cost of obesity was estimated at €528 million, while the costs attributable to overweight BMI were as high as €1.18 billion. In the Czech Republic, the same study estimated annual direct costs of €108 million due to obesity and €198 million due to overweight BMI for the population older than 20 years.18 A heavy burden on a country’s economy is evident in other parts of the world, as a study in Thailand illustrates. In that study, it was estimated that the annual total costs attributable to obesity amounted to $725.3 million (in 2009 US dollars). Direct health care costs contributed US $333.6 million, with indirect costs contributing US $391.8 million, to annual total costs.19
Reviews of the literature have consistently demonstrated that obesity is linked with decreased health-related quality of life.20,21 However, the data with respect to the relationship between obesity and health outcomes in Germany and Italy are limited. With respect to Germany, several studies have been published that document the changing epidemiology and economic consequences of obesity,3,14 but these data are several years old. Furthermore, few studies have examined the patient-reported effects of obesity, such as health status and impairment in daily activities. The data in Italy are also lacking with respect to these outcomes. The rapidly growing rate of obesity is a major public health concern in high-income countries and many middle-income countries.2 Importantly, this trend is also increasing in low-income countries, turning this into a truly global challenge. Understanding up-to-date associations between obesity and its impact on quality of life and costs is thus an essential step for informing the development of effective interventions that can better match the scope of this societal problem. Therefore, the primary objective of the current study was to address these gaps in the literature by quantifying the burden of obesity on both humanistic and economic outcomes. Specifically, this study examined differences by BMI in comorbidity profile, health status, work productivity loss, activity impairment, indirect costs, health care resource utilization, and direct costs. These associations were explored among the general adult populations of Germany and Italy, as well as separately for those with T2D, prediabetes, and hypertension within each country.
Patients and methods
Sample and procedure
This retrospective observational study used data from the National Health and Wellness Survey (NHWS), an annual, Internet-based health questionnaire administered to a nationwide sample of adults (aged 18 years or older) in 10 countries. In addition to Germany and Italy, the NHWS is separately administered in the USA, Brazil, the UK, Spain, France, Japan, China, and Russia. Specific details regarding the sampling strategy and respondent recruitment procedures for the NHWS have been published elsewhere.22,23 This study included data from adults who participated in the 2013 NHWS in Germany (N=15000) and Italy (N=10000). Respondents provided informed consent electronically prior to starting the survey and are only known by a unique identifier. The 2013 NHWS received approval from the Essex Institutional Review Board (Lebanon, NJ, USA). The NHWS is a proprietary dataset, although select data can be made available upon reasonable request for replication purposes.
All respondents with nonmissing weight data were initially included (N=14671 in Germany and N=9823 in Italy). However, given this study focused on the impact of overweight BMI and obesity on outcomes, respondents with a BMI of <18.50 kg/m2 (ie, those who were underweight) were excluded. Additionally, because bariatric surgery is often a last resort for individuals who are obesity class III and have failed to lose weight using diet and exercise and/or other treatments, those who reported having this procedure were excluded from this study to avoid biasing the results. This left final sample sizes of N=14286 and N=9433 for Germany and Italy, respectively, in the main analysis.
Measures
BMI
Respondents provided their height and weight, which were then converted into a BMI value and coded categorically as follows: underweight (BMI <18.50 kg/m2), normal weight (BMI ≥18.50–<25.00 kg/m2), overweight (BMI ≥25.00–<30.00 kg/m2), obese class I (BMI ≥30.00–<35.00 kg/m2), obese class II (BMI ≥35.00–<40.00 kg/m2), and obese class III (BMI ≥40.00 kg/m2).
Demographics and health characteristics
Demographics and health characteristics were examined as covariates. These variables included age (continuous), sex (male vs female), marital status (married/living with partner vs not married), education (university degree vs less than a university degree), household income (below country median vs above country median vs decline to answer), smoking status (currently smoke vs former smoker vs never smoker), alcohol use (currently drink vs do not currently drink), exercise behavior (number of days exercised in the past month), and Charlson Comorbidity Index (CCI) scores. The CCI measures the burden on the individual from nonpsychiatric comorbidities.24 To calculate CCI scores, the presence of various comorbidities (eg, diabetes and metastatic tumor) is weighted and then summed; higher scores signify a greater comorbidity burden.
Respondents were also stratified by a self-reported diagnosis of T2D, a self-reported diagnosis of hypertension, and a positive screen for prediabetes, based on the diabetes screening score (DSS).25 For the DSS, points are awarded, depending upon a respondent’s age, sex, family history of diabetes, presence of high blood pressure, presence of overweight or obese BMI, and physical activity. Scores can range from 0 to 9, with scores ≥4 indicating a high risk of undiagnosed prediabetes.
Health status
Health status was assessed in the NHWS using the Medical Outcomes Study 36-Item Short Form Health Survey version 2 (SF-36v2). Specifically, the physical component summary (PCS), the mental component summary (MCS), and the Short-Form 6-Dimension (SF-6D) were calculated for this study.26,27 For all three of these measures, better health status is signified by higher scores. Past research has suggested that differences in 3.00 points on the norm-based component summary scores and 0.03 points on SF-6D health utilities represent clinically meaningful differences.28,29
Work productivity loss and activity impairment
Work productivity loss was assessed in the NHWS using the Work Productivity and Activity Impairment-General Health (WPAI-GH) questionnaire. The WPAI-GH contains six items that measure the proportion of time taken off from work (absenteeism), reduced productivity while on the job (presenteeism), and impairment in nonwork daily activities (activity impairment) over the prior week due to one’s health condition(s). The measure of overall work productivity loss from the WPAI-GH, which is also expressed as a percentage, is calculated using a combination of scores from the absenteeism and presenteeism measures.30 Data on work productivity loss variables (absenteeism, presenteeism, and overall work productivity impairment) were collected from employed respondents, whereas activity impairment data were collected from all respondents, regardless of their employment status.
Health care resource utilization
Health care resource utilization was assessed by the following three self-reported items: number of health care provider visits, number of emergency room (ER) visits (How many times have you been to the ER for your own medical condition in the past 6 months?), and number of times hospitalized (How many times have you been hospitalized for your own medical condition in the past 6 months?) for any reason in the past 6 months. The phrasing “own medical condition” was used to ensure that accompanying a friend or relative for his/her medical issues were not included. The phrasing was intentionally vague to ensure that all medical conditions were included.
Costs
The costs for an average ER visit, hospitalization, and health care provider visit were obtained from the literature.31,32 These costs were converted into 2013 Euros, based on the health care-specific inflation rate reported by the European Central Bank.33 Because the question is asked about the past 6 months, the number of each type of visit was multiplied by two to project to the annual number of visits for each respondent. The projected number was then multiplied by its average cost. Next, those figures were summed to a total direct cost value for each respondent. Indirect costs were calculated for each employed respondent by using average annual salaries from the Organization for Economic Cooperation and Development.34
Statistical analyses
Analyses were conducted separately for Germany and Italy. The specific analytical plan for each country was identical unless indicated otherwise. Differences between respondents by BMI category on demographics and health characteristic variables (defined above) were assessed to determine the potential covariates to include in subsequent multivariable models. These bivariate analyses involved performing one-way analysis of variance (ANOVA) tests for continuous outcome variables and chi-square tests for categorical outcome variables. P-values <0.05, two-tailed, were considered statistically significant.
Two sets of generalized linear regression models (GLMs) were conducted, one for BMI treated as a continuous variable and one for BMI treated as a categorical variable. For each set of GLMs, the relevant BMI variable was used as the predictor of each outcome variable, adjusting for the demographics and health characteristics variables that were identified as relevant covariates in the bivariate analyses, which were described earlier. Additionally, psychiatric medication use and the use of medication for a thyroid condition were also included in the GLMs as covariates (regardless of statistical significance in the bivariate analyses) due to the effects of these medications on weight. Each set of GLMs examined the relation of BMI to health status, work productivity loss, activity impairment, annual indirect and direct costs, and health care resource utilization in the past 6 months. For the GLMs, a normal distribution was specified for the health status variables, whereas a negative binomial distribution and log-link function were specified for work productivity loss, activity impairment, health care resource utilization, and cost variables, due to their pronounced skew. Parameter estimates, 95% CIs, standard errors, and statistical significance were reported for each model.
The aforementioned analytical plan was then replicated for the following three subgroups within each country: those who self-reported a T2D diagnosis, those who self-reported a hypertension diagnosis, and those who screened positive for prediabetes on the DSS. All bivariate comparisons and GLMs for the comorbidity subgroup analyses were performed, as described earlier.
Results
Germany
Descriptive statistics
Among all German respondents (N=14286), a total of 43.46% were normal weight, 35.24% were overweight, and the remaining 21.29% were obese (13.89% were obese class I, 4.79% were obese class II, and 2.60% were obese class III). Differences in demographics and health characteristics across BMI categories are reported in Table 1. Males were more likely to be overweight or obese class I, whereas females were more likely to be normal weight, obese class II, or obese class III (P<0.001). As BMI increased, the number of days exercised per month decreased and the comorbidity burden (CCI scores) increased (for both, P<0.001).
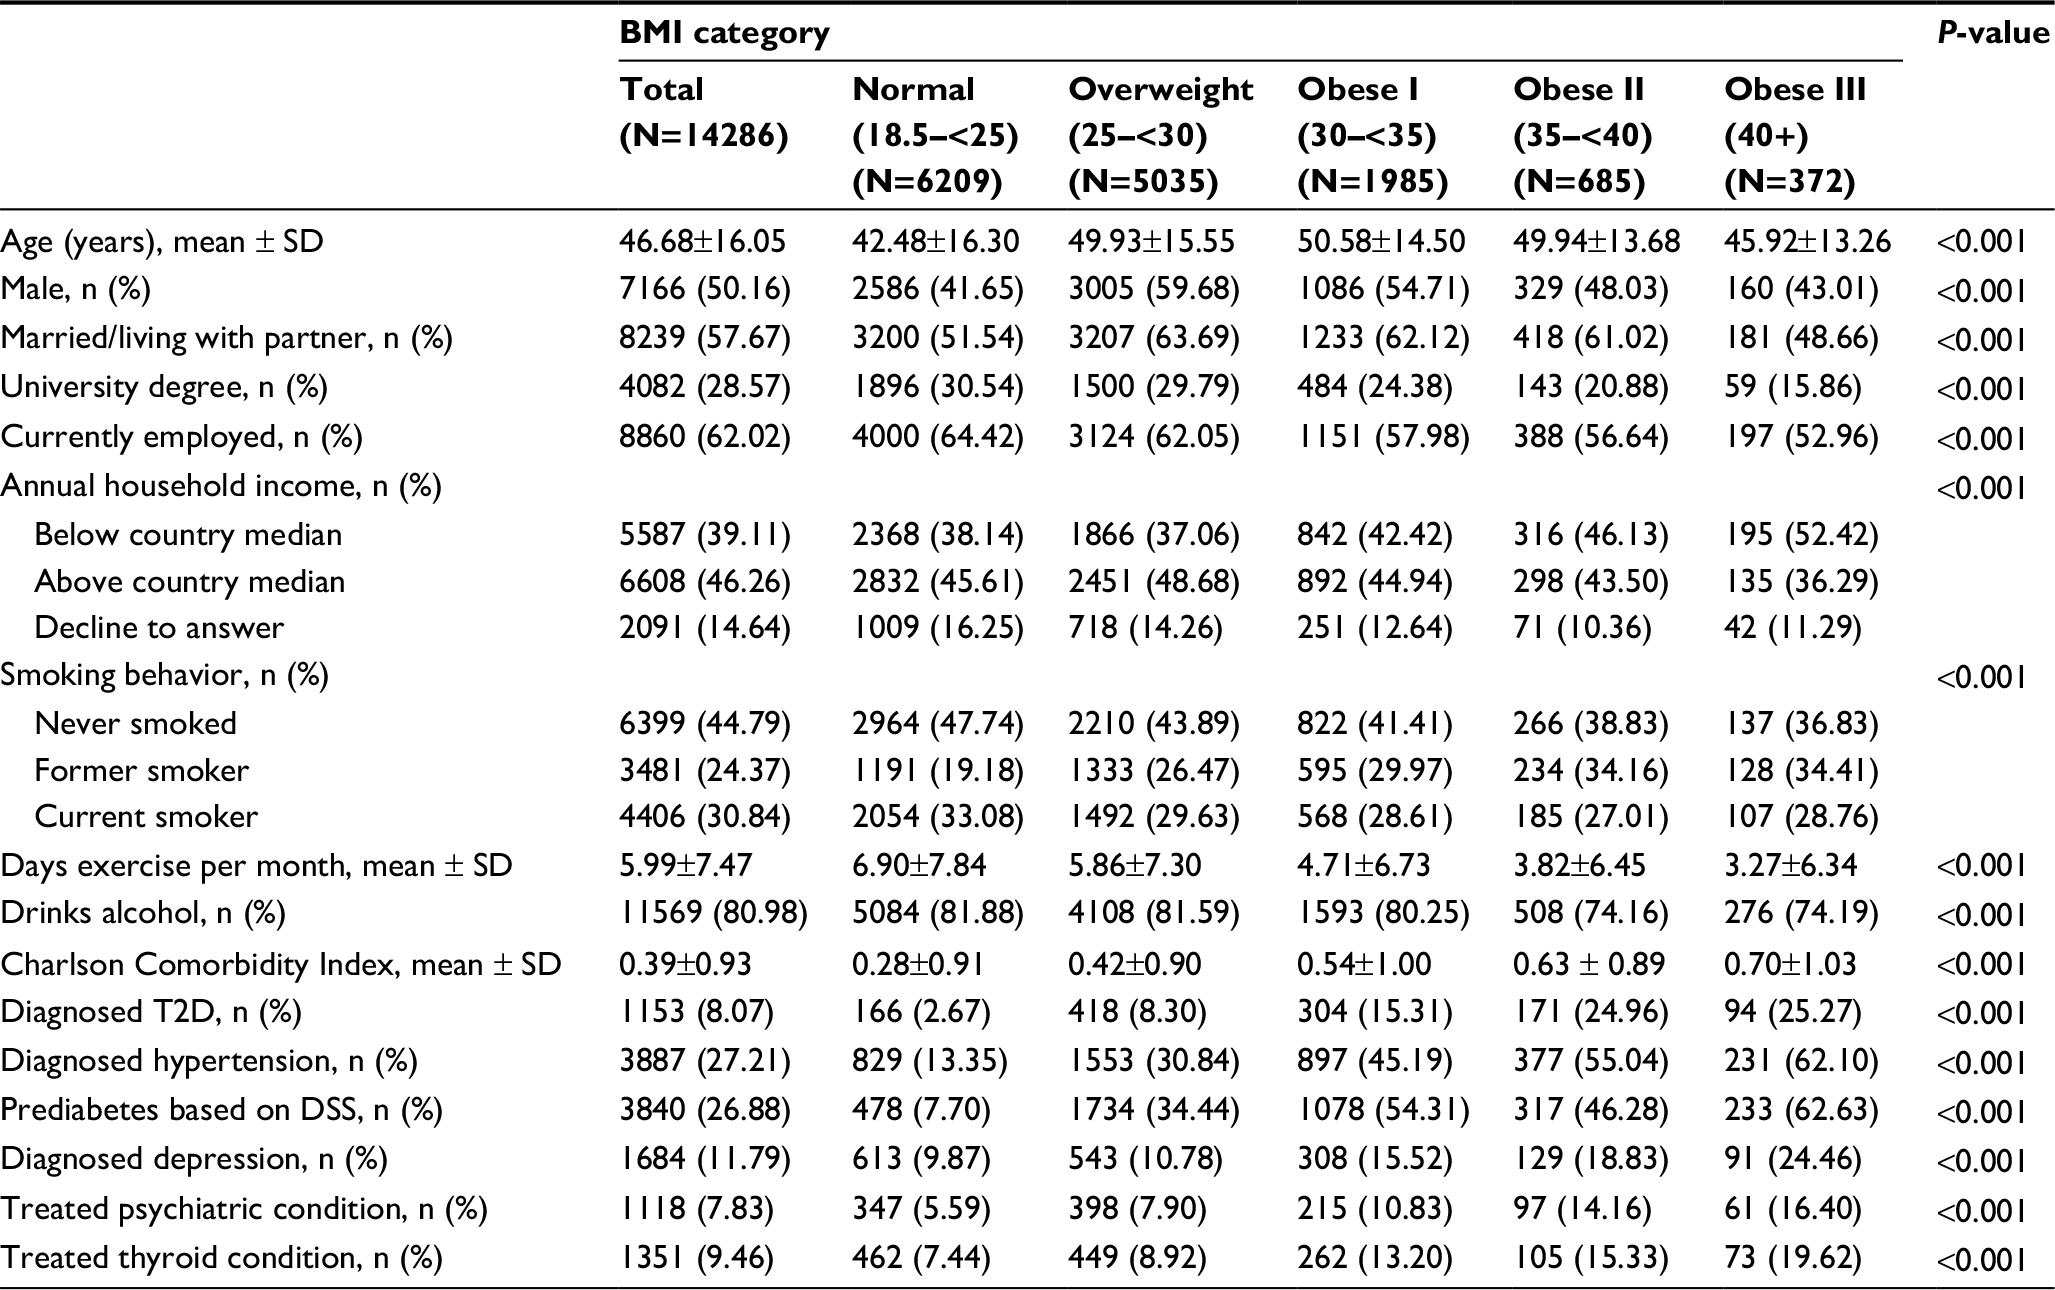 | Table 1 Differences by BMI category in demographics and health characteristics among adults in Germany Abbreviations: BMI, body mass index; DSS, diabetes screening score; T2D, type 2 diabetes. |
Health and economic burden of obesity
Adjusted differences in health status by BMI category are reported in Table 2. All BMI categories significantly differed from obese class III on the PCS (for all, P<0.001) and SF-6D health utilities (for all, P<0.01). A similar pattern was observed for MCS scores (for all, P<0.05), although there was no statistically significant difference between obese class II and obese class III respondents on this measure.
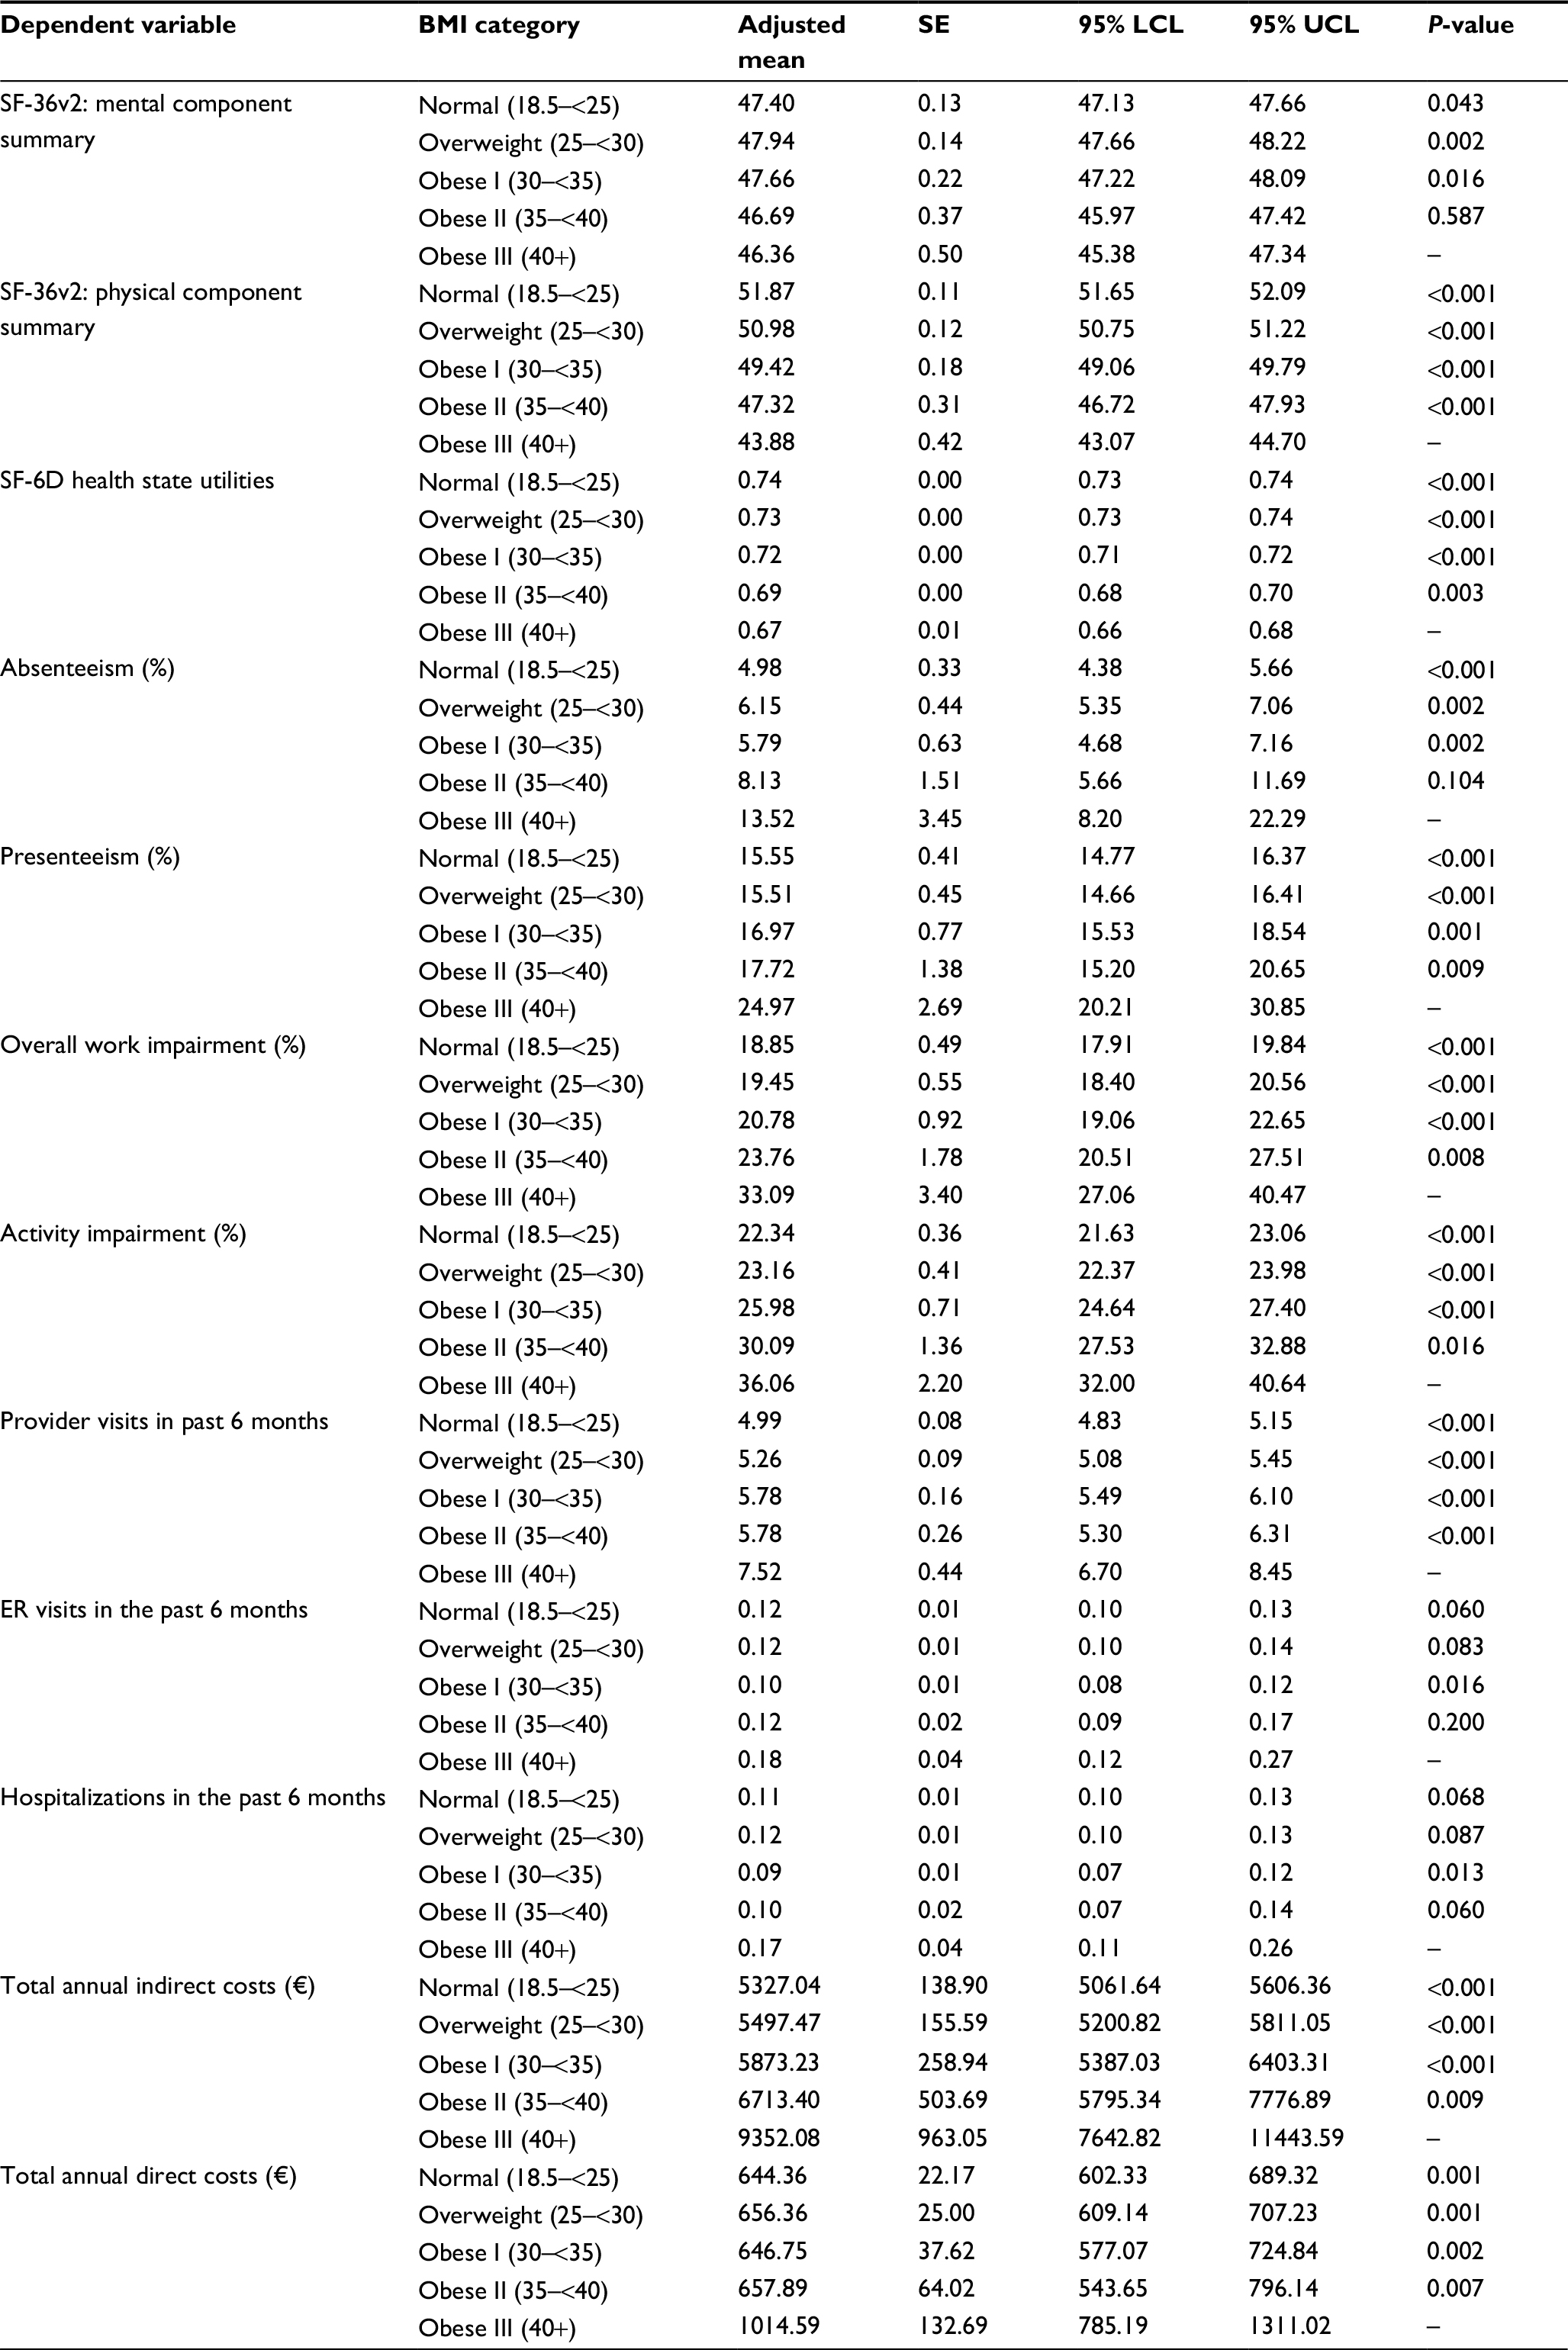 | Table 2 Differences by BMI category in health and economic outcomes, adjusted for covariates, among adults in Germany (N=14286) Note: All models controlled for age, sex, marital status, household income, smoking status, alcohol consumption, exercise behavior, Charlson Comorbidity Index scores, treated depression, and treated thyroid conditions. Abbreviations: ER, emergency room; LCL, lower confidence limit; SE, standard error; SF-6D, Short-Form 6-Dimension; SF-36v2, Medical Outcomes Study 36-Item Short Form Health Survey version 2; UCL, upper confidence limit. |
Additionally, all BMI categories were significantly different from obese class III with respect to presenteeism (for all, P<0.01), overall work productivity loss (for all, P<0.01), activity impairment (for all, P<0.05), health care provider visits (for all, P<0.001), and indirect and direct costs (for all, P<0.01) (Table 2). A similar pattern was observed with respect to absenteeism (for all, P<0.01), although there was no statistically significant difference between obese class II and obese class III in this outcome. No differences between BMI categories in hospitalizations and ER visits were observed, with the exception of the statistically significant differences between obese class I and obese class III on these variables (for both, P<0.05).
Additional analyses were conducted to examine the relationships between BMI, assessed continuously, and the outcome variables (data not shown). Higher BMI was related to significantly worse health status, as indicated via lower scores on the PCS, MCS, and SF-6D health utilities (for all, P<0.05). Similarly, statistically significant positive associations were observed between BMI and absenteeism, presenteeism, overall work productivity loss, activity impairment, health care provider visits, and costs (for all, P<0.05); specifically, increases in BMI related to increases in work productivity loss and activity impairment, a greater number of health care provider visits, and higher costs. No statistically significant associations were observed between BMI and either ER visits or hospitalizations.
Comorbidity burden of obesity
T2D
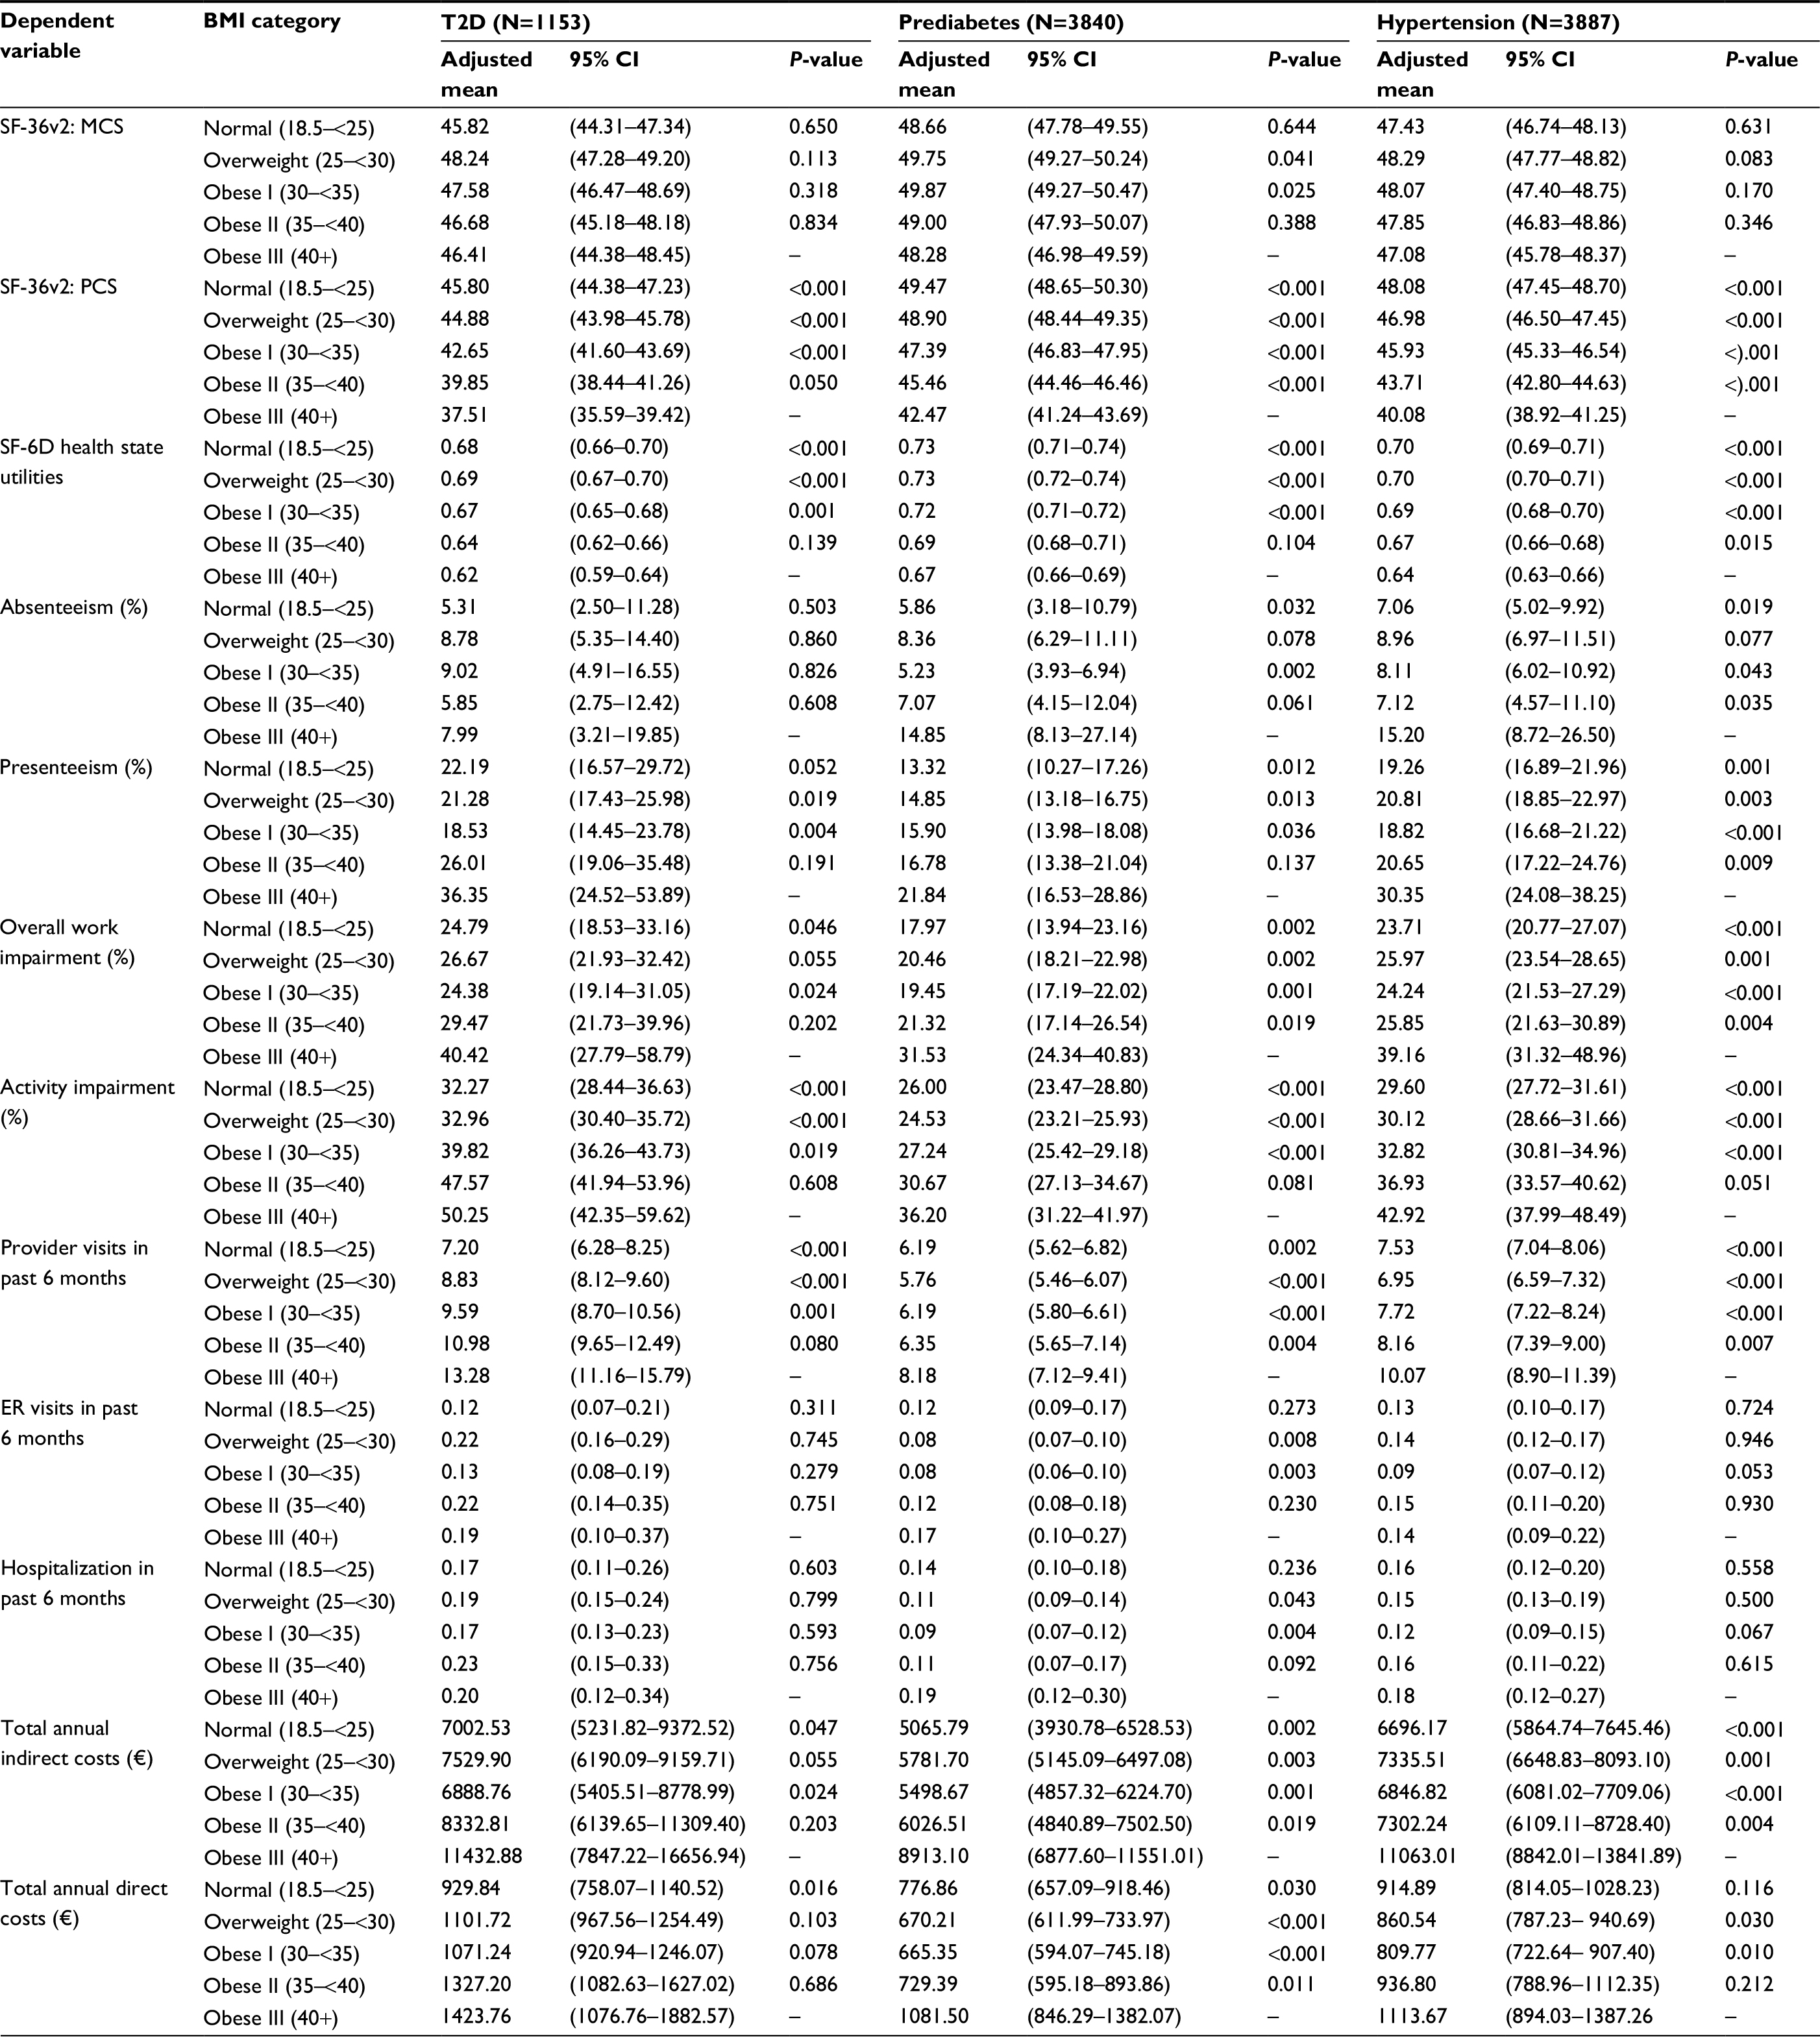
Among all respondents with T2D in Germany (N=1153), a total of 14.40% were normal weight, 36.25% were overweight, and the remaining 49.35% were obese (26.37% were obese class I, 14.83% were obese class II, and 8.15% were obese class III [Figure 1]). Although patients with T2D were predominantly male across all BMI categories, the sex distribution was more skewed among overweight and obese class I (P<0.05; data not shown). With increases in BMI, respondents were less likely to have a university degree and exercised fewer days per month (P<0.05; data not shown). Adjusted mean differences in outcomes between BMI categories are reported in Table 3. All BMI classes, except for obese class II, significantly differed from obese class III on PCS scores (for all, P<0.001). Similarly, all BMI categories, with the exception of obese class II, significantly differed from obese class III with respect to scores on the SF-6D health utilities (for all, P<0.01), health care provider visits (for all, P<0.01), and activity impairment (for all, P<0.05). Overweight and obese class I had significantly less presenteeism than obese class III (for both, P<0.05). Normal weight and obese class I had significantly less overall work productivity loss and lower indirect costs than obese class III (for all, P<0.05). Only normal weight respondents differed from obese class III on direct costs (P=0.016). No significant differences by BMI category were found for MCS scores, absenteeism, ER visits, or hospitalizations.
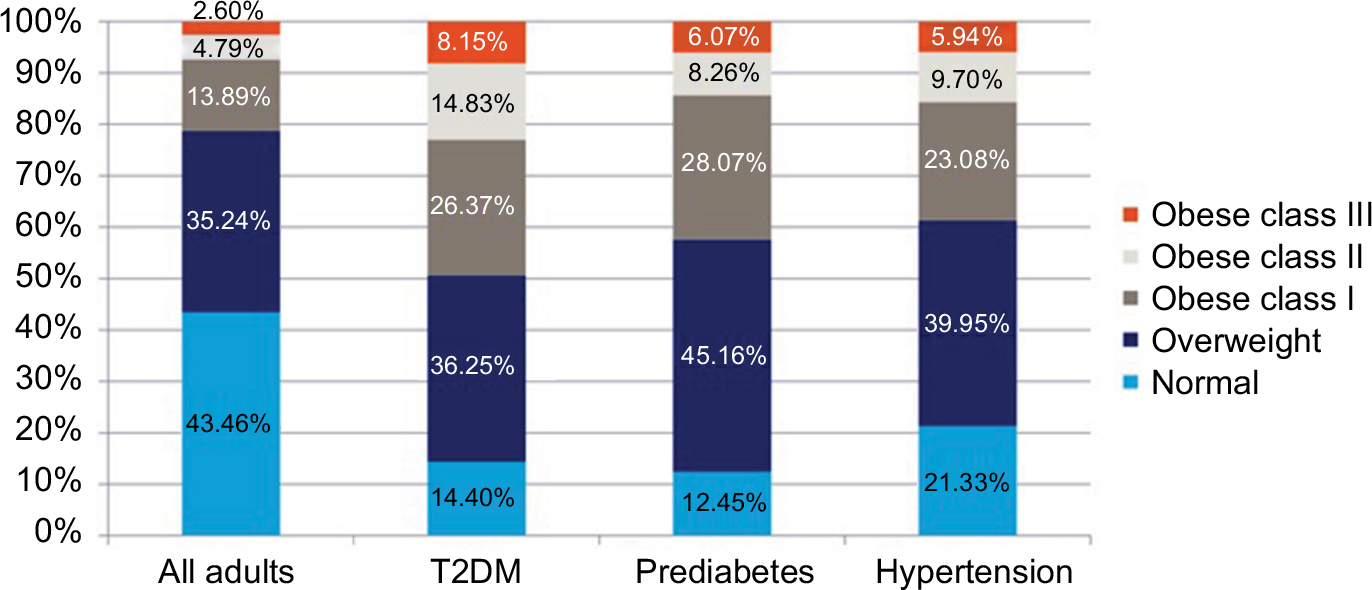 | Figure 1 Prevalence of obesity across subgroups in Germany. Abbreviation: T2D, type 2 diabetes. |
 | Table 3 Differences by BMI category in health and economic outcomes, adjusted for covariates, among adults with T2D, prediabetes, and hypertension in Germany Note: All models controlled for age, sex, marital status, household income, smoking status, alcohol consumption, exercise behavior, Charlson Comorbidity Index scores, treated depression, and treated thyroid conditions. Abbreviations: ER, emergency room; MCS, Mental Components Scale; PCS, Physical Components Scale; SF-6D, Short Form-6 Dimensions; SF-36v2, Medical Outcomes Study 36-Item Short Form Health Survey version 2; T2D, type 2 diabetes. |
Additional analyses were conducted to examine the relationships between BMI, assessed continuously, and the outcome variables among those with T2D (data not shown). Significant negative associations were observed between BMI and scores on the PCS and SF-6D health utilities (for both, P<0.05), which indicated that higher BMI related to worse health status. No significant association was observed between BMI and MCS scores. With respect to economic outcomes, BMI was associated with higher presenteeism, more health care provider visits, and greater direct costs (for all, P<0.05).
Hypertension
Among all respondents with hypertension in Germany (N=3887), a total of 21.33% were normal weight, 39.95% were overweight, and the remaining 38.72% were obese (23.08% were obese class I, 9.70% were obese class II, and 5.94% were obese class III [Figure 1]). Although patients with hypertension were predominantly male across all BMI classes, the sex distribution was more skewed among overweight and obese class I (P<0.05; data not shown). With increases in BMI category, the likelihood of having a university degree and the number of days exercised per month decreased (for both, P<0.05; data not shown). No statistically significant differences by BMI category were observed with respect to comorbidity burden, as measured by the CCI.
Adjusted mean differences in outcomes by BMI category among those with hypertension are reported in Table 3. All BMI classes significantly differed from obese class III respondents on PCS (for all, P<0.001) and SF-6D health utilities scores (for all, P<0.05), presenteeism (for all, P<0.01), overall work productivity loss (for all, P<0.01), health care provider visits (for all, P<0.01), and indirect costs (for all, P<0.01). All BMI categories, with the exception of obese class II, significantly differed from obese class III with respect to activity impairment (for all, P<0.001). All BMI categories, except for overweight, significantly differed from obese class III in absenteeism (for all, P<0.05). Overweight and obese class I incurred significantly lower annual direct costs, compared with obese class III (for both, P<0.05). No statistically significant differences by BMI category were observed for MCS scores, ER visits, or hospitalizations.
Additional analyses were conducted to examine the relationships between BMI, assessed continuously, and the outcome variables among those with hypertension (data not shown). Significant negative associations were observed between BMI and scores on the PCS and SF-6D health utilities (for both, P<0.05); specifically, higher BMI related to worse health status on these measures. No relationship was observed between BMI and MCS scores. Additionally, higher BMI was significantly associated with higher presenteeism, overall work productivity loss, activity impairment, health care provider visits, and indirect costs (for all, P<0.05). No statistically significant relationships were observed between BMI and absenteeism, ER visits, hospitalizations, or direct costs.
Prediabetes
Among all respondents who screened positive for prediabetes in Germany (N=3840), a total of 12.45% were normal weight, 45.16% were overweight, and the remaining 42.40% were obese (28.07% were obese class I, 8.26% were obese class II, and 6.07% were obese class III [Figure 1]). Although patients with prediabetes were predominantly male across all BMI categories, this skew was more pronounced among overweight and obese class I (P<0.05; data not shown). As BMI category increased, the likelihood of having a university degree and the number of days exercised per month decreased (for both, P<0.05; data not shown).
Adjusted mean differences in outcomes by BMI category among those with prediabetes are reported in Table 3. All BMI categories significantly differed from obese class III in PCS scores (for all, P<0.001), overall work productivity loss (for all, P<0.05), health care provider visits (for all, P<0.01), indirect costs (for all, P<0.05), and direct costs (for all, P<0.05). With the exception of obese class II, statistically significant differences between all BMI categories and obese class III were observed on SF-6D health utilities’ scores (for all, P<0.001), presenteeism (for all, P<0.05), activity impairment (for all, P<0.001), and hospitalizations (for all, P<0.05); specifically, obese class III was related to worse outcomes. Overweight and obese class I significantly differed from obese class III in MCS scores (for both, P<0.05) and ER visits (for both, P<0.01). Additionally, normal weight and obese class I significantly differed from obese class III in absenteeism (for both, P<0.05).
Additional analyses were conducted to examine the relationships between BMI, assessed continuously, and the outcome variables among those with prediabetes (data not shown). Significant negative associations were observed between BMI and scores on the PCS and SF-6D health utilities (for both, P<0.05), with higher BMI associated with worse health status on these measures. No statistically significant relationship was observed between BMI and MCS scores. Higher BMI was associated with greater presenteeism, overall work productivity loss, and activity impairment, more health care provider and ER visits, and higher indirect and direct costs (for all, P<0.05). However, BMI was not significantly related to absenteeism or hospitalizations.
Italy
Descriptive statistics
Among all respondents in Italy (N=9433), a total of 52.26% were normal weight, 34.85% were overweight, and the remaining 12.89% were obese (9.49% were obese class I, 2.28% were obese class II, and 1.12% were obese class III). Differences in demographics and health characteristics by BMI category are reported in Table 4. A significant difference for sex was observed. Respondents who were overweight or obese class I were significantly more likely to be male, whereas respondents who were normal weight, obese class II, or obese class III were more likely to be female (P<0.001). In general, being below the country median on household income was more likely, whereas being employed or having a university degree were less likely, with increases in BMI category (for all, P<0.001). Also, as BMI increased, the number of days exercised per month decreased and the comorbidity burden increased (for all, P<0.001).
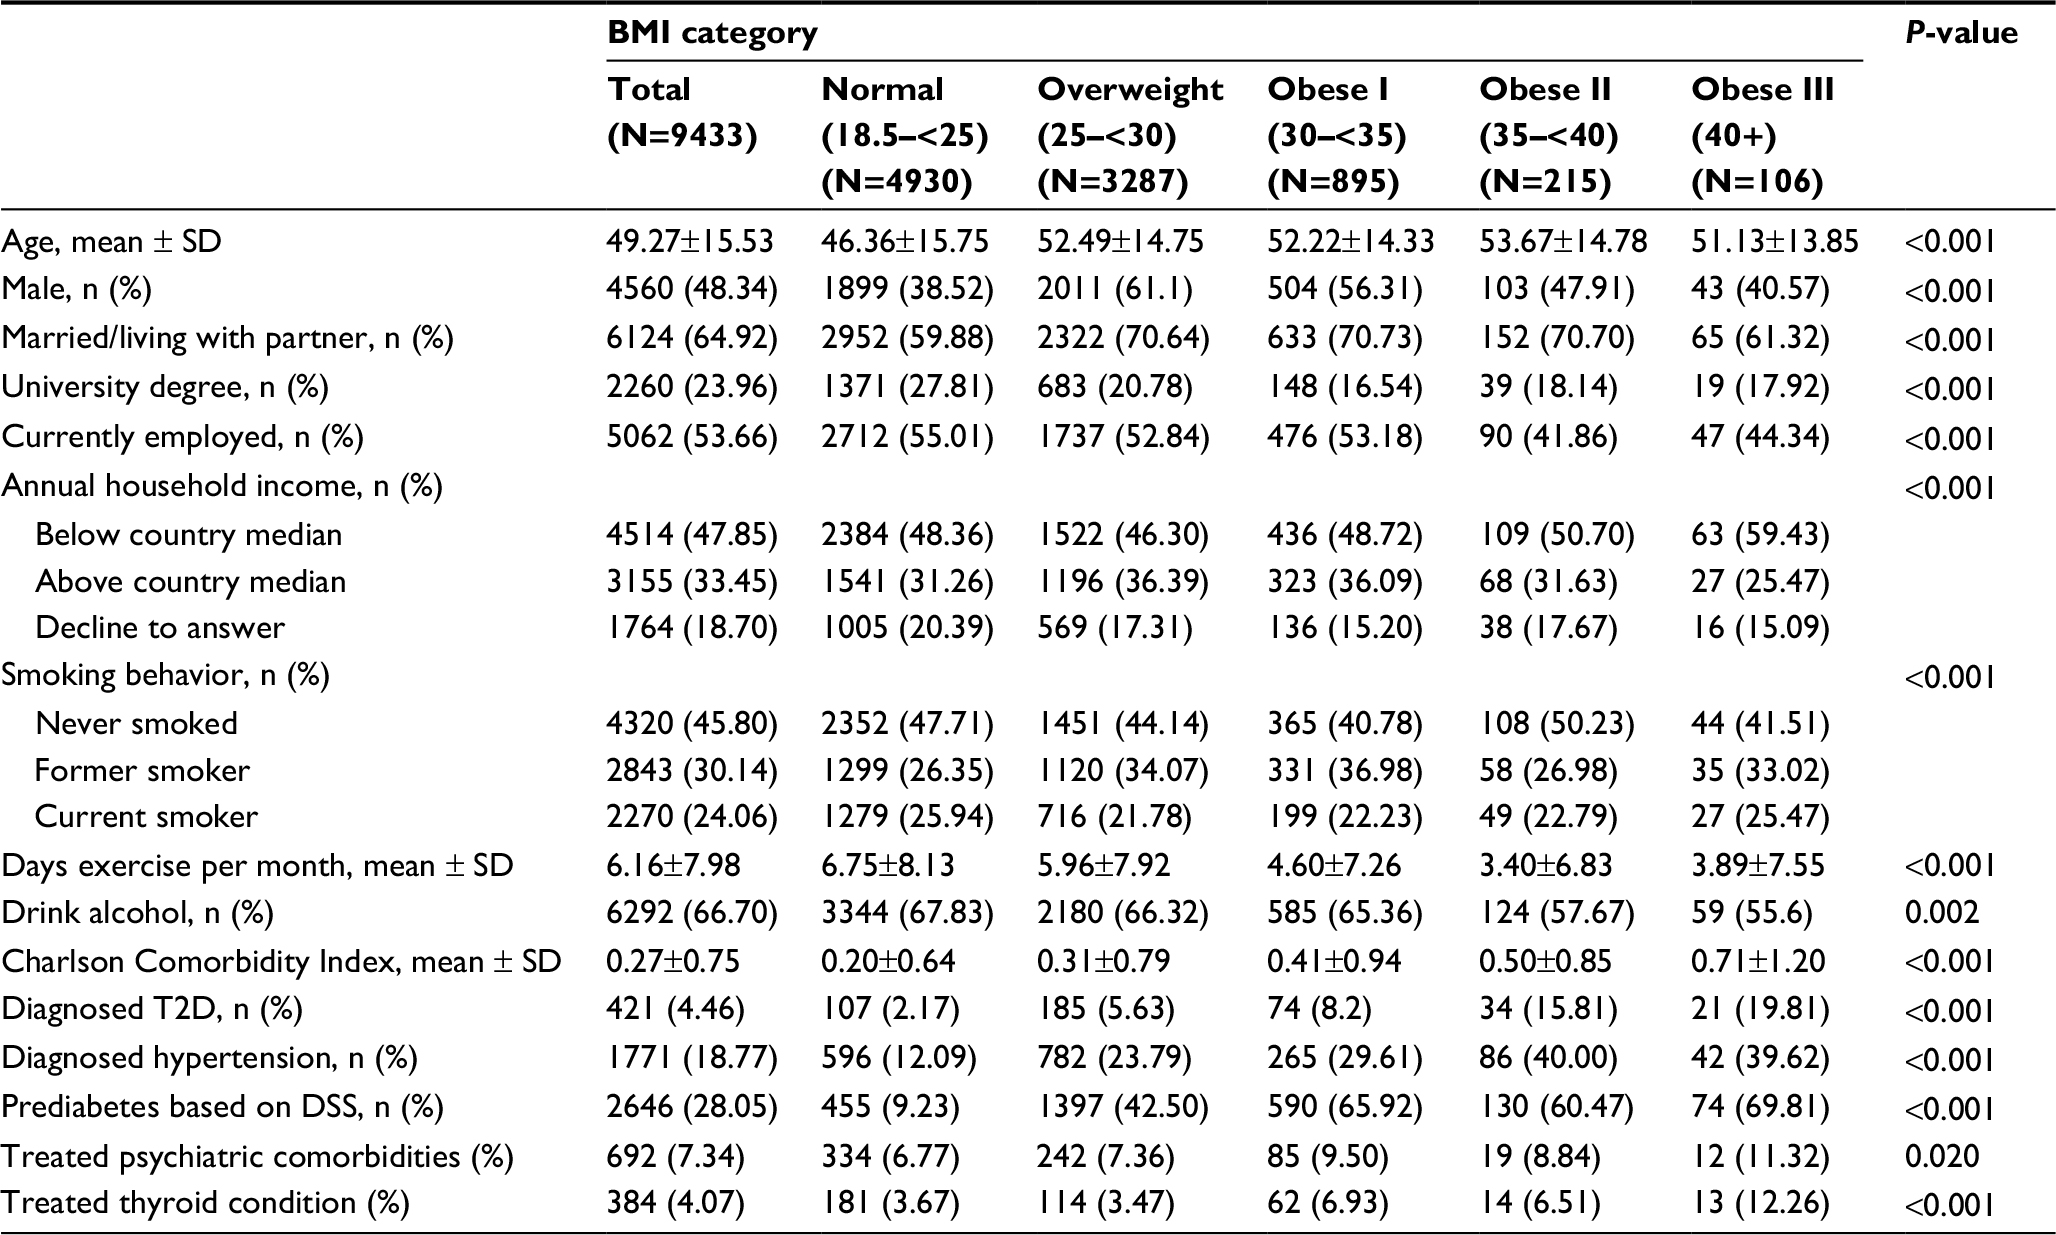 | Table 4 Differences by BMI category in demographics and health characteristics among adults in Italy Abbreviations: DSS, diabetes screening score; T2D, type 2 diabetes. |
Health and economic burden of obesity
Adjusted mean differences in outcomes by BMI category are reported in Table 5. All BMI categories significantly differed from obese class III on PCS scores (for all, P<0.01). All BMI categories, with the exception of obese class II, significantly differed from obese class III on MCS (for all, P<0.05) and SF-6D health utilities’ scores (for all, P<0.01), presenteeism (for all, P<0.05), and activity impairment (for all, P<0.05). Only normal weight respondents differed from those in obese class III with respect to overall work productivity loss and indirect costs (for both, P<0.05). No statistically significant differences by BMI category for absenteeism, any of the health care resource utilization variables, or direct costs were observed.
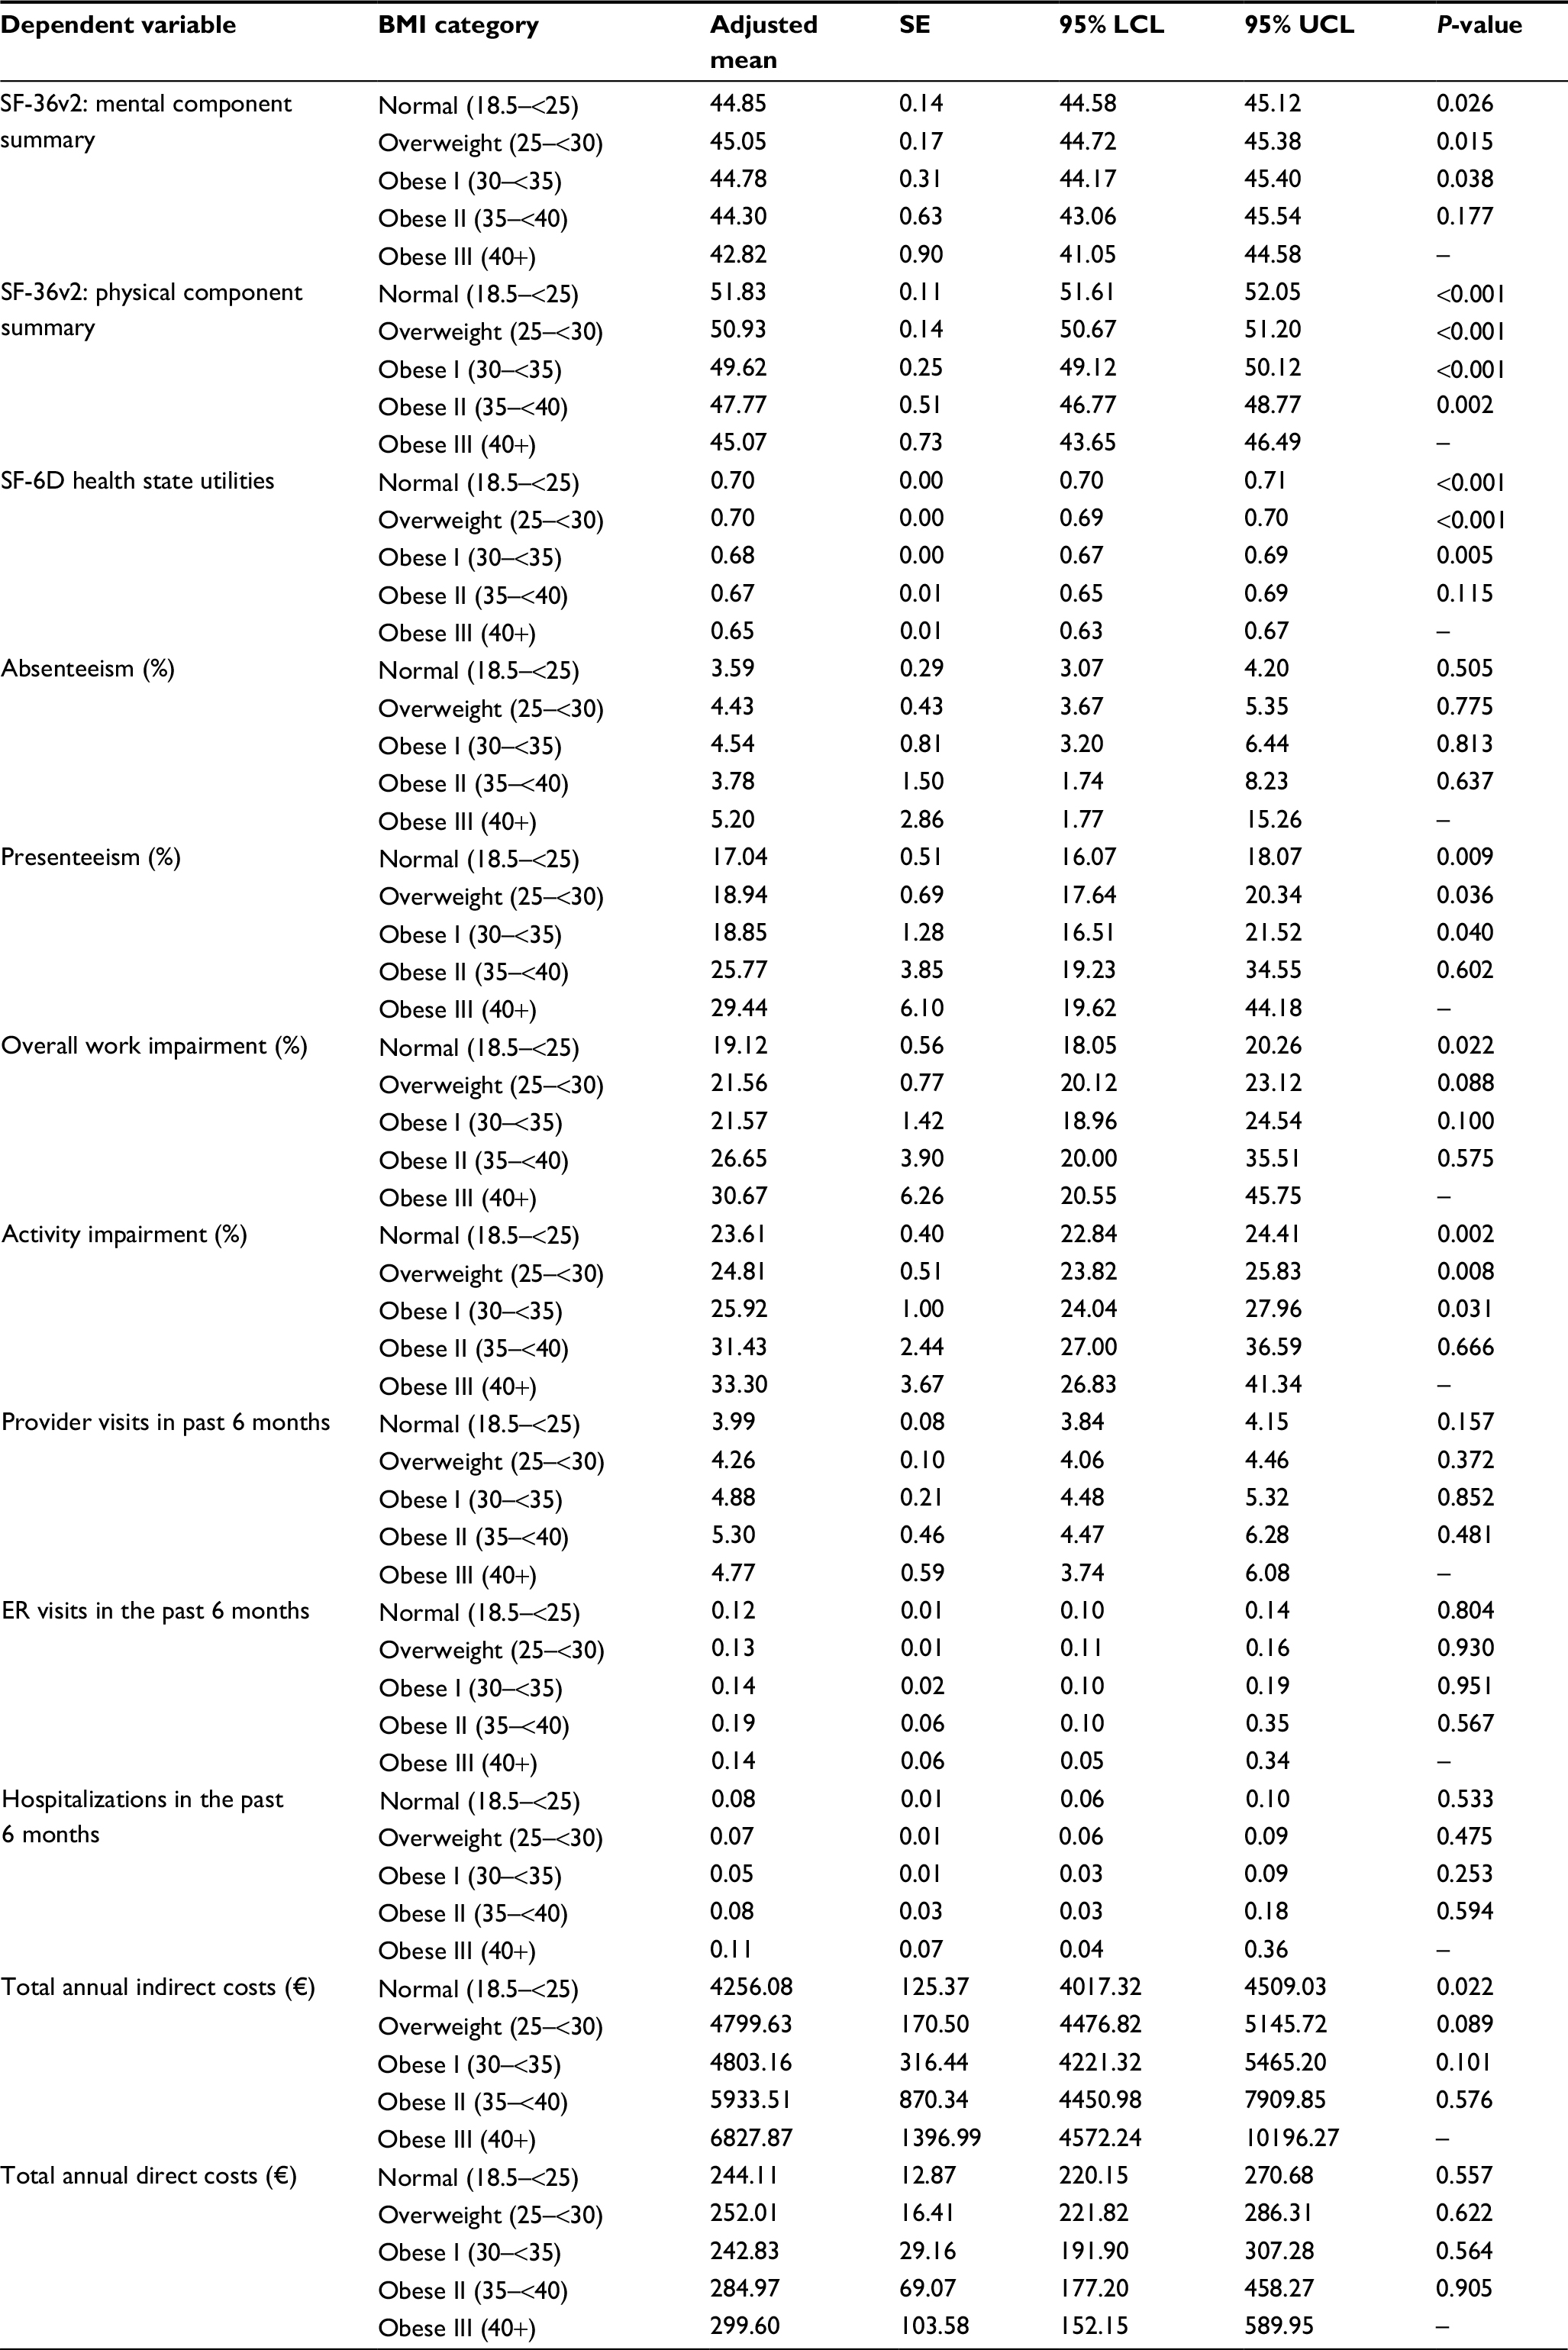 | Table 5 Differences by BMI category in health and economic outcomes, adjusted for covariates, among adults in Italy (N=9433) Notes: All models controlled for age, sex, marital status, household income, smoking status, alcohol consumption, exercise behavior, Charlson Comorbidity Index scores, treated depression, and treated thyroid conditions. Abbreviations: ER, emergency room; LCL, lower confidence limit; SE, standard error; SF-6D, Short Form-6 Dimensions; SF-36v2, Medical Outcomes Study 36-Item Short Form Health Survey; UCL, upper confidence limit. |
Additional analyses were conducted to examine the relationships between BMI, assessed continuously, and the outcome variables (data not shown). Significant negative associations were observed between BMI and scores on the PCS and SF-6D health utilities (for both, P<0.05), which suggests that higher BMI related to worse health status on these measures. Moreover, higher BMI was associated with higher presenteeism, overall work productivity loss, activity impairment, health care provider visits, and indirect costs (for all, P<0.05). No statistically significant associations were observed between BMI and ER visits, hospitalizations, or direct costs.
Comorbidity burden of obesity
T2D
A total of N=421 respondents in Italy reported a diagnosis of T2D. Among these respondents, a total of 25.42% were normal weight, 43.94% were overweight, and the remaining 30.65% were obese (17.58% were obese class I, 8.08% were obese class II, and 4.99% were obese class III [Figure 2]). Although patients with T2D were predominantly male across all BMI classes, the sex distribution was skewed to a greater degree among overweight and obese class I (P<0.05; data not shown). Household income, education, and employment status did not significantly vary by BMI category. As BMI category increased, the number of days exercised per month decreased, and the comorbidity burden increased (for both, P<0.05; data not shown).
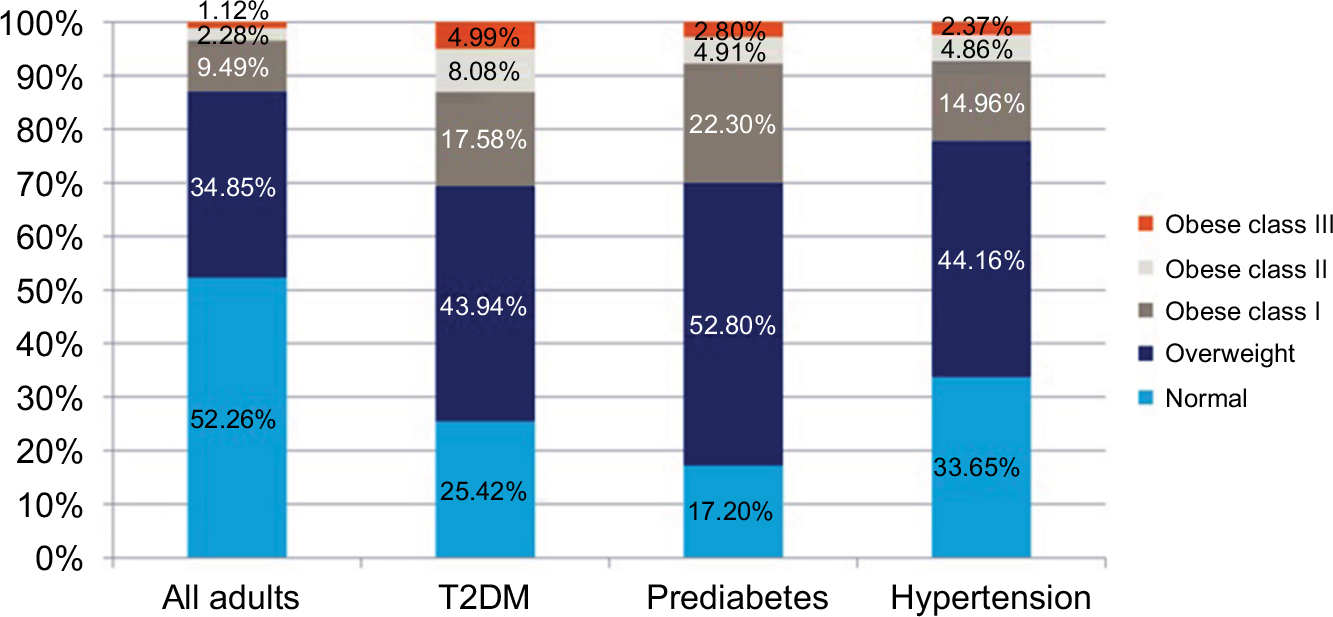 | Figure 2 Prevalence of obesity across subgroups in Italy. Abbreviation: T2D, type 2 diabetes. |
Adjusted mean differences in outcomes by BMI category among those with T2D are reported in Table 6. All BMI categories significantly differed from obese class III in PCS scores (for all, P<0.01), with BMI class III associated with poorer health status. With the exception of obese class II, all BMI categories significantly differed from obese class III in MSC scores (for all, P<0.05), SF-6D health utilities (for all, P<0.01), presenteeism (for all, P<0.05), and activity impairment (for all, P<0.05). Only normal weight had significantly less overall work productivity loss and incurred lower annual indirect costs than obese class III (for both, P<0.05). No statistically significant differences by BMI category were observed for absenteeism, any of the health care resource utilization variables, or annual direct costs.
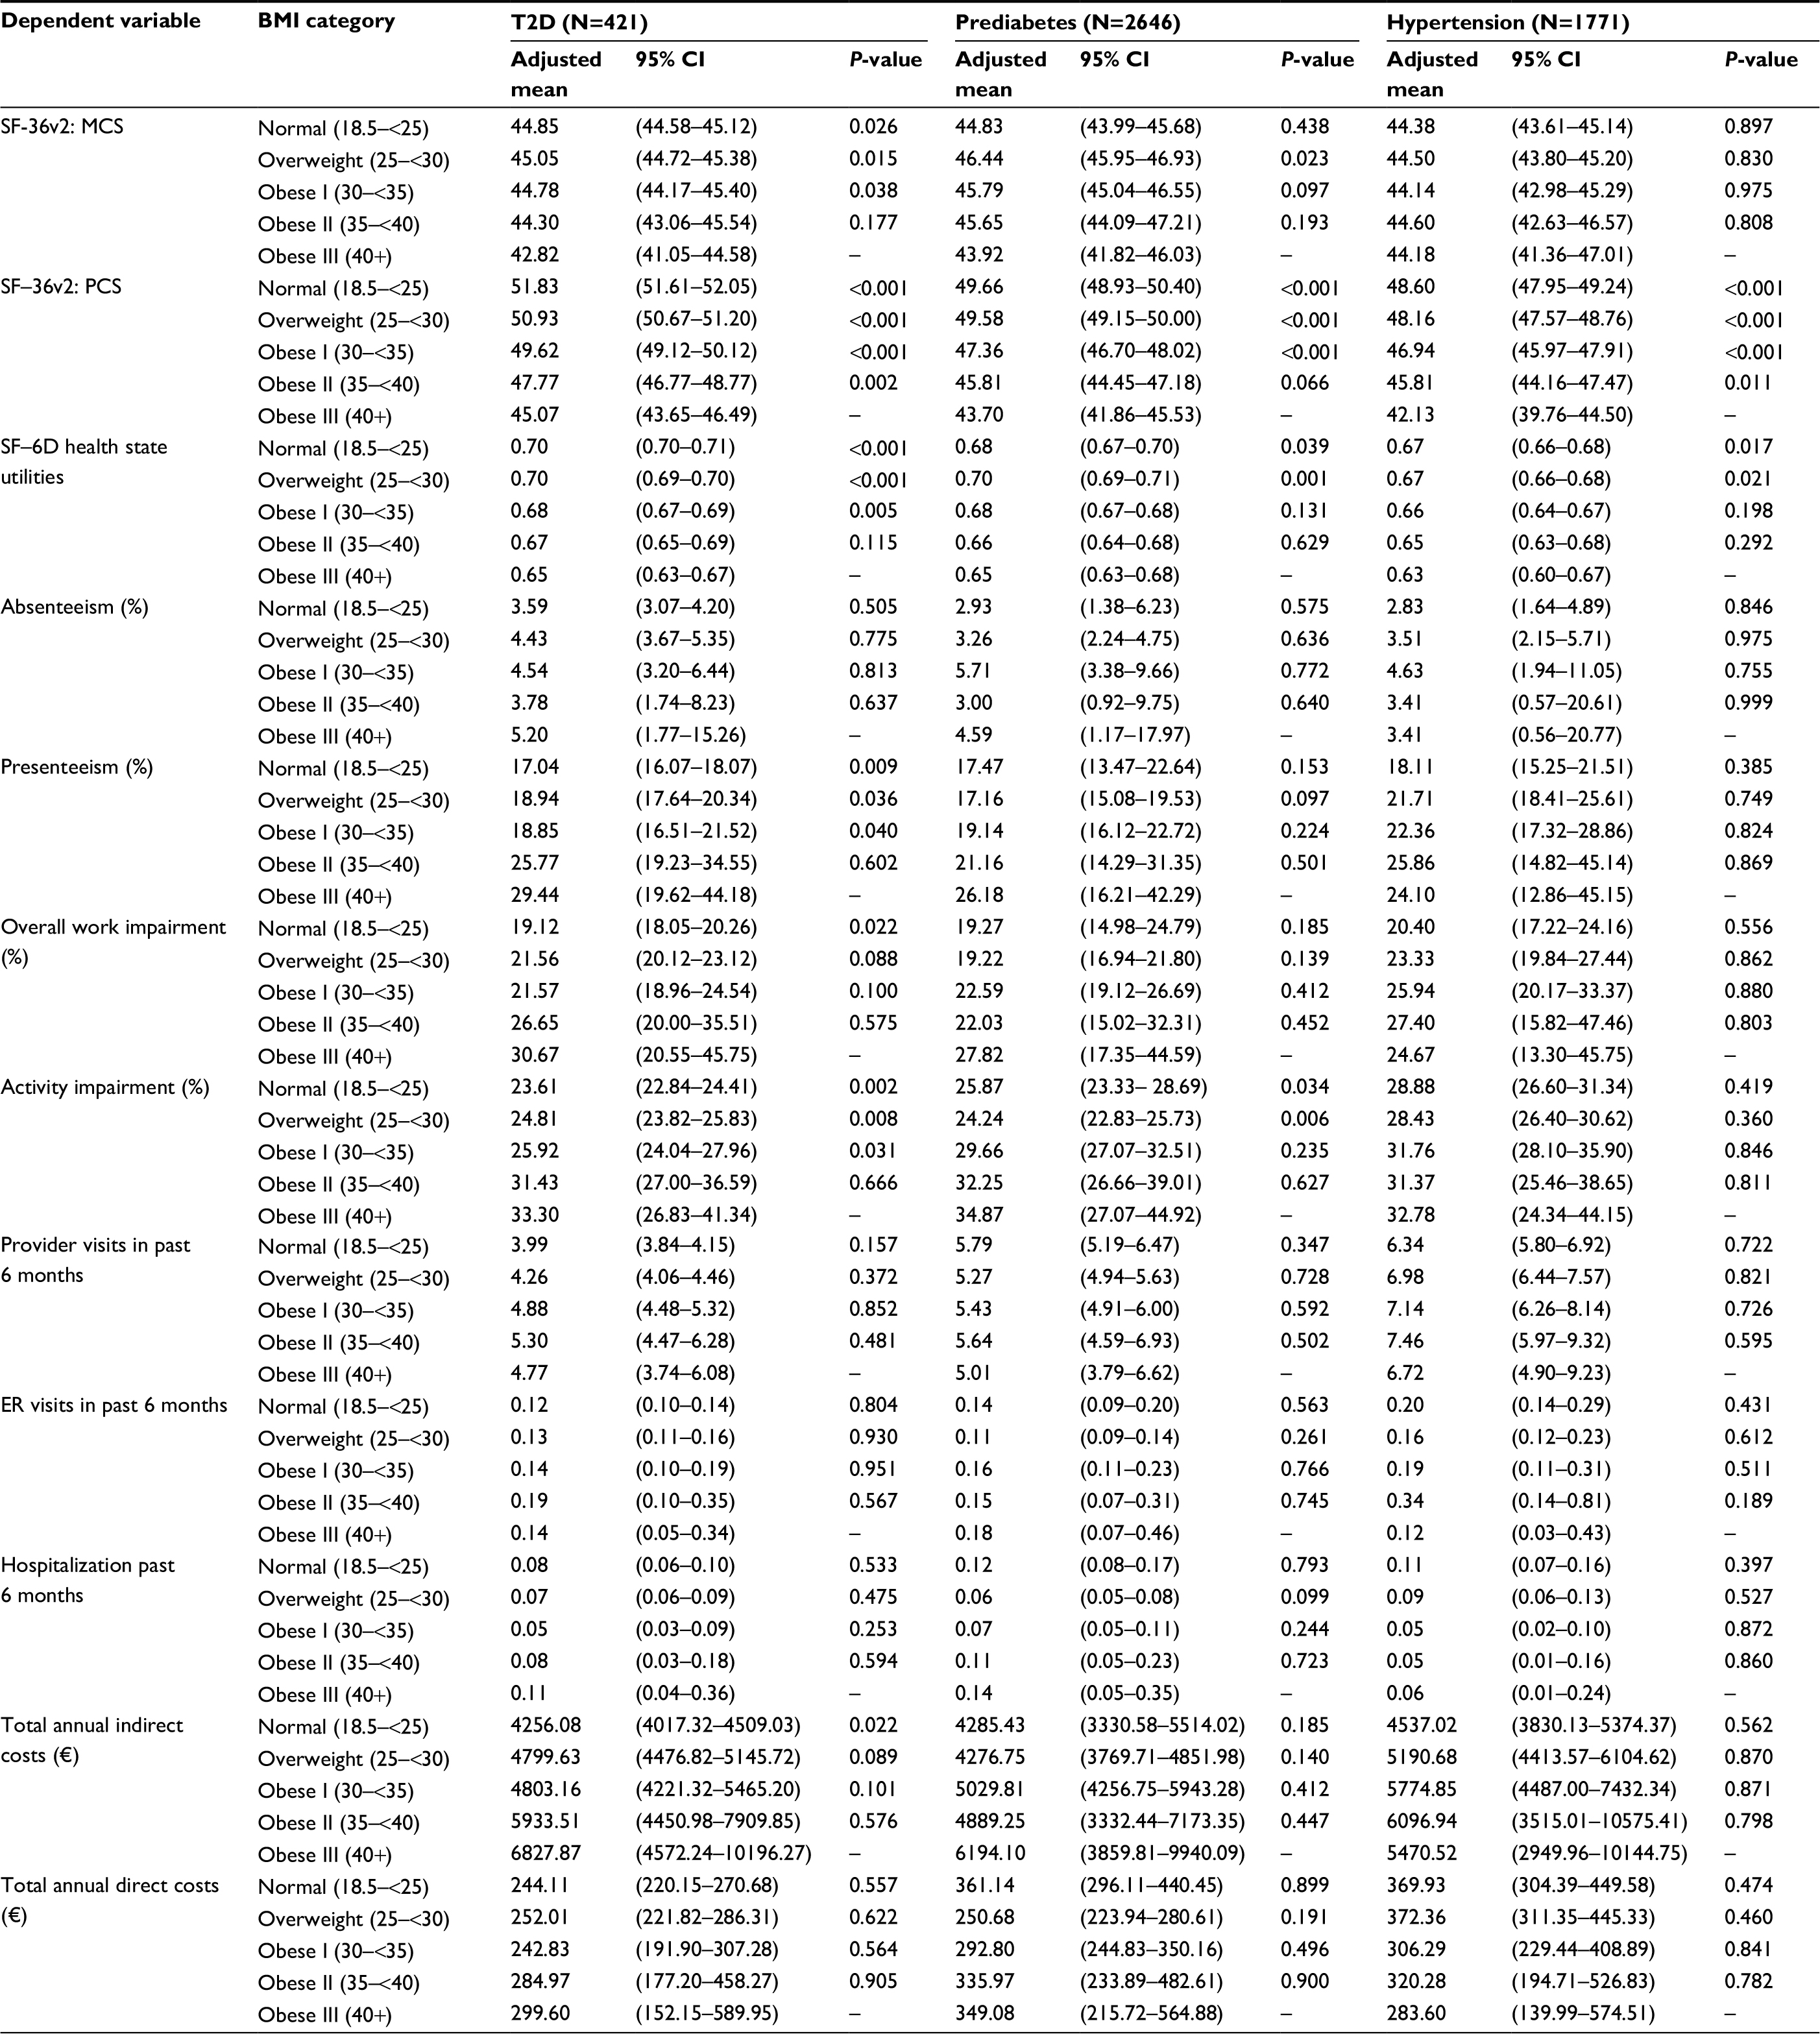 | Table 6 Differences by BMI category in health and economic outcomes, adjusted for covariates, among adults with T2D, prediabetes, and hypertension in Italy Notes: All models controlled for age, sex, marital status, household income, smoking status, alcohol consumption, exercise behavior, Charlson Comorbidity Index scores, treated depression, and treated thyroid conditions. Abbreviations: ER, emergency room; MCS, mental component summary; PCS, physical component summary; SF-6D, Short Form-6 Dimensions; SF-36v2, Medical Outcomes Study 36-Item Short Form Health Survey version 2; T2D, type 2 diabetes. |
Additional analyses were conducted to examine the relationships between BMI, assessed continuously, and the outcome variables among those with T2D (data not shown). A significant negative association was observed between BMI and PCS scores (P<0.05), as higher BMI was related to worse health status. No statistically significant relationships were observed between BMI and scores on the MCS or SF-6D health utilities. Although a significant positive association between BMI and activity impairment was observed (P<0.05), no statistically significant relationships were observed with any of the work productivity loss, health care resource utilization, or cost variables.
Hypertension
Among all respondents with hypertension in Italy (N=1771), a total of 33.65% were normal weight, 44.16% were overweight, and the remaining 22.19% were obese (14.96% were obese class I, 4.86% were obese class II, and 2.37% were obese class III [Figure 2]). Although patients with hypertension were predominantly male across all BMI classes, this skew was more pronounced among overweight and obese class I (P<0.05; data not shown). Respondents with hypertension had significantly lower household income and a lower likelihood of having a university degree (for both, P<0.05; data not shown). As BMI category increased, the number of days exercised per month decreased and the comorbidity burden increased (for both, P<0.05; data not shown).
Adjusted mean differences in outcomes by BMI category among those with hypertension are reported in Table 6. All BMI categories had significantly higher PCS scores than obese class III (for all, P<0.001). Significantly higher scores on the SF-6D health utilities were observed for normal and overweight, compared with obese class III (for both, P<0.05). No other statistically significant differences by BMI category were observed.
Additional analyses were conducted to examine the relationships between BMI, assessed continuously, and the outcome variables among those with hypertension (data not shown). Significant negative associations were observed between BMI and scores on the PCS and SF-6D health utilities (for both, P<0.05), with higher BMI being associated with worse health status on these measures. No other statistically significant relationships were observed.
Prediabetes
Among all respondents with prediabetes in Italy (N=2646), a total of 17.20% were normal weight, 52.80% were overweight, and the remaining 30.01% were obese (22.30% were obese class I, 4.91% were obese class II, and 2.80% were obese class III [Figure 2]). Although patients with prediabetes were predominantly male across all BMI categories, this distribution was skewed to a greater extent among the normal and overweight categories (P<0.05; data not shown).
Adjusted mean differences in outcomes by BMI category among those with prediabetes are reported in Table 6. All BMI categories, with the exception of obese class II, had significantly higher PCS scores than obese class III (for all, P<0.001). Both normal weight and overweight had significantly higher scores on the SF-6D health utilities and less activity impairment than obese class III (for all, P<0.05). Only overweight had significantly higher MCS scores than obese class III (P=0.023). There were no statistically significant differences by BMI category observed on any of the work productivity loss, health care resource utilization, or cost variables.
Additional analyses were conducted to examine the relationships between BMI, assessed continuously, and the outcome variables among those with prediabetes (data not shown). Significant negative associations were observed between BMI and scores on the PCS and SF-6D health utilities (for both, P<0.05), suggesting that higher BMI was associated with worse health status on these measures. Furthermore, higher BMI was significantly associated with greater activity impairment (P<0.05). No other statistically significant associations were observed.
Discussion
The prevalence of obesity in the current study was estimated to be ~21.0% in Germany, which is comparable to estimates provided in a recent study from that country and similar to the prevalence estimated in the 2008–2011 German Health Interview and Examination Survey for Adults.3 While the rates of obesity in Germany seem to be stabilizing, the same does not hold true for Italy. Italy seems to follow the general global trend of a rise in obesity prevalence. Data collected between 2006 and 2010 indicated an estimated prevalence of obesity of 8.9% among adults, which increased to 10.2% in 2015, according to the Italian National Institute of Statistics.5 Results of our study suggest the prevalence of obesity in Italy has further increased to 13.0%.4 Combining these figures with the percentage of people who are overweight, our results suggest that nearly half of the adults in Italy and the majority of adults in Germany are either overweight or obese. Taken together, these results underscore the scope of the obesity epidemic in Western Europe. Similar to studies conducted in the USA, the prevalence of obesity was higher among those with prediabetes and T2D.35 However, obesity may differentially impact metabolic and cardiac functioning. Accordingly, our findings suggest that the humanistic and societal impact of obesity varies depending on the comorbid condition (obesity, prediabetes, T2D, and hypertension) and the domain of functioning under consideration.
Our results suggest a significant negative association between BMI and health status in the general adult population in both Germany and Italy. Specifically, across all respondents, higher BMI was related to significantly lower physical health status. This is consistent with prior studies that demonstrated that obesity most strongly affects physical domains of functioning.20,21,35 The magnitude of these effects exceeded established cutoffs for clinically meaningful differences in PCS scores in comparisons of obese class II and obese class III, relative to normal weight (ie, differences that exceeded 3.00 points).28 Clinically meaningful differences in SF-6D health utilities were also observed between obese class II and obese class III respondents, compared with normal weight respondents (ie, differences that exceeded 0.03 points).29
Comorbidity subgroup analyses revealed a similar pattern of results for the total sample within each country, although comparisons were underpowered in some cases, particularly in Italy. Regardless, in both countries, clinically meaningful differences in PCS and SF-6D health utilities were also observed in obese class III, relative to normal weight, respondents among those in each comorbidity subgroup (T2D, prediabetes, and hypertension).
We also found a significant association between BMI category and activity impairment. Approximately 50.0% more impairment in daily activities was observed among obese class III respondents, relative to normal weight respondents, in both Germany and Italy. The same pattern was observed in each comorbidity subgroup within each country, although these effects were weaker among those with hypertension. In addition, presenteeism was significantly higher in the obese class III groups of both countries, when compared with respondents in most other BMI classes in both countries.
Prior studies have found a significant relationship between obesity and indirect economic outcomes in Germany.14–16,36 Although our study focused solely on work productivity loss when defining indirect costs (rather than also considering indirect costs attributed to early retirement or other factors), we found that indirect costs increased concomitantly with BMI category among German adults. Indeed, indirect costs were ~76.0% higher among obese class III respondents, relative to normal weight respondents. Notably, higher BMI was related to significantly higher absenteeism and of overall work productivity impairment in Germany. In contrast, in Italy, overall work impairment did not significantly differ between obese class III and the remaining BMI groups (except for normal weight respondents) and there were no significant differences in absenteeism between obese class III respondents, relative to respondents from other BMI classes. These effects were smaller and largely nonsignificant, potentially due to insufficient statistical power. A significant difference between obese class III and normal weight respondents, but not other BMI classes, was uncovered in which indirect costs were ~60.0% higher for the former, relative to the latter, group. When examined by comorbidity subgroup, indirect costs were ~15.0% (prediabetes) to 50.0% (T2D) higher in obese class III, relative to normal weight, respondents.
Finally, significant positive associations were observed between BMI, health care resource utilization, and direct costs, as consistent with prior studies, in Germany.14 Although, in both countries, there were nearly no significant differences between BMI classes with respect to the number of ER visits or hospitalizations in the previous 6 months, the same did not hold true for the number of health care provider visits in Germany. In this country, direct costs were ~28.0% (hypertension) to 58.0% (all adults) higher among obese class III respondents, compared with normal weight respondents, which was mostly attributed to a higher number of health care provider visits. In Italy, no differences were observed with respect to health care resource utilization or direct costs for any of the comorbidity subgroups. This was potentially due to a combination of reduced statistical power (because of lower sample sizes) and smaller differences between groups.
Given the fast-growing rate of obesity observed worldwide and the burden it carries, it is quite important to understand the most up-to-date magnitude of the impact on the national economy and on the quality of life of patients. The recent data from Italy and Germany presented in the current study contribute to this body of knowledge.
Future research, particularly with longitudinal designs better equipped to detect the downstream economic consequences of obesity, should be undertaken to more precisely quantify the health care resource utilization burden attributed to obesity in these countries.
Limitations
The current study had some limitations to consider when interpreting the results. First, all data were self-reported, and no objective confirmation of BMI, T2D diagnosis, hypertension diagnosis, health characteristics, or health care resource utilization was available. Reporting errors may have occurred, causing some people to inadvertently be included in the inaccurate BMI category. Moreover, the study was cross-sectional, so it was not possible to establish a clear causal pathway between BMI and the outcomes of interest. Related to this point, our modeling focused on the independent effect of BMI, while statistically controlling for demographic and health characteristics. However, with BMI reduction, other aspects of the person’s health (eg, presence and severity of comorbidities) may also improve, which may amplify the benefits to health. This was not taken into account in the current study and may be an important area for future research. Additionally, costs were estimated based on wage rates, inflation rates, and prior literature on cost multipliers. Hence, estimated costs may be different than true costs obtained through other means. Disability-related costs and other non-wage related variables were not accounted for in the indirect cost calculation; as such, this study may provide somewhat more conservative estimates of indirect costs. Finally, although the NHWS is demographically representative with respect to age and sex, it is unclear to what extent this analytical sample generalizes to the various comorbidity subgroups in the general adult population (eg, those with prediabetes, T2D, or hypertension).
Conclusion
The findings demonstrated the substantial burden of obesity in both Germany and Italy across multiple domains, including health status, impairment in daily activities, and economic outcomes. This burden is more pronounced in Germany than in Italy, particularly with regard to economic outcomes. Consistent with past research, indirect costs were notably higher than direct costs, emphasizing the importance of factoring in work productivity loss when estimating the societal burden of obesity. Generally, the burden of obesity among those with T2D, prediabetes, or hypertension was similar to that of the general adult population.
Acknowledgments
The study was funded by Novo Nordisk. The authors wish to acknowledge Shaloo Gupta, MS, and Martine C Maculaitis, PhD, for assistance with editing and manuscript preparation on behalf of Kantar Health, which received fees from Novo Nordisk.
Disclosure
MD was an employee of Kantar Health, who was a paid consultant to Novo Nordisk in connection with the study design, analysis and interpretation of data, writing of the article, and the publication submission decision. ALL was an employee of Novo Nordisk at the time of study implementation, and HM and JF are the employees of Novo Nordisk, who funded the study and provided direction into the study design, analysis and interpretation of data, writing of the article, and the publication submission decision. AN holds a consultancy role with Novo Nordisk, who helped with the interpretation of results, reviewed the writing of the article, and provided insights on the publication submission decision. The authors report no other conflicts of interest in this work.
References
World Health Organization. Obesity: Preventing and Managing the Global Epidemic. Report of a WHO Consultation. WHO Technical Report Series 894. Geneva: World Health Organization; 2000. | ||
Ng M, Fleming T, Robinson M, et al. Global, regional, and national prevalence of overweight and obesity in children and adults during 1980– 2013: a systematic analysis for the Global Burden of Disease study 2013. Lancet. 2014;384(9945):766–781. | ||
Mensink GB, Schienkiewitz A, Haftenberger M, Lampert T, Ziese T, Scheidt-Nave C. [Overweight and obesity in Germany: results of the German Health Interview and Examination Survey for Adults (DEGS1)]. Bundesgesundheitsblatt Gesundheitsforschung Gesundheitsschutz. 2013;56(5–6):786–794. | ||
Gallus S, Odone A, Lugo A, et al. Overweight and obesity prevalence and determinants in Italy: an update to 2010. Eur J Nutr. 2013;52(2):677–685. | ||
Istat.it [homepage on the Internet]. Italian National Institute of Statistics. Italy in Figures. 2015. Available from: http://www.istat.it/en/files/2015/09/ItalyinFigures2015.pdf. Accessed July 7, 2011. | ||
US Preventative Services Task Force. Guide to Clinical Preventive Services. 2nd ed. Washington, DC: Office of Disease Prevention and Health Promotion; 1996. | ||
Dixon JB. The effect of obesity on health outcomes. Mol Cell Endocrinol. 2010;316(2):104–108. | ||
Scott KM, Bruffaerts R, Simon GE, et al. Obesity and mental disorders in the general population: results from the world mental health surveys. Int J Obes (Lond). 2007;32(1):192–200. | ||
Guh DP, Zhang W, Bansback N, Amarsi Z, Birmingham CL, Anis AH. The incidence of co-morbidities related to obesity and overweight: a systematic review and meta-analysis. BMC Public Health. 2009;9:88. | ||
Marchesini G, Bugianesi E, Forlani G, et al. Nonalcoholic fatty liver, steatohepatitis, and the metabolic syndrome. Hepatology. 2003;37(4):917–923. | ||
Arnardottir ES, Mackiewicz M, Gislason T, Teff KL, Pack AI. Molecular signatures in obstructive sleep apnea in adults: a review and perspective. Sleep. 2009;32(4):447–470. | ||
Fontaine K, Redden D, Wang C, Westfall A, Allison D. Years of life lost due to obesity. JAMA. 2003;289(2):187–193. | ||
Peeters A, Barendregt JJ, Willekens F, et al; NEDCOM, the Netherlands Epidemiology and Demography Compression of Morbidity Research Group. Obesity in adulthood and its consequences for life expectancy: a life-table analysis. Ann Intern Med. 2003;138(1):24–32. | ||
Konnopka A, Bödemann M, König HH. Health burden and costs of obesity and overweight in Germany. Eur J Health Econ. 2011;12(4):345–352. | ||
Lehnert T, Streltchenia P, Konnopka A, Riedel-Heller SG, König H. Health burden and costs of obesity and overweight in Germany: an update. Eur J Health Econ. 2015;16(9):957–967. | ||
Effertz T, Engel S, Verheyen F, Linder R. The costs and consequences of obesity in Germany: a new approach from a prevalence and life-cycle perspective. Eur J Health Econ. 2016;17(9):1141–1158. | ||
Andreyeva T, Luedicke J, Wang YC. State-level estimates of obesity-attributable costs of absenteeism. J Occup Environ Med. 2014;56(11):1120–1127. | ||
Lette M, Bemelmans WJ, Breda J, Slobbe LC, Dias J, Boshuizen HC. Health care costs attributable to overweight calculated in a standardized way for three European countries. Eur J Health Econ. 2016;17(1):61–69. | ||
Pitayatienanan P, Butchon R, Yothasamut J, et al. Economic costs of obesity in Thailand: a retrospective cost-of-illness study. BMC Health Serv Res. 2014;14:146. | ||
Kushner RF, Foster GD. Obesity and quality of life. Nutrition. 2000;16(10):947–952. | ||
Kolotkin RL, Meter K, Williams GR. Quality of life and obesity. Obes Rev. 2001;2(4):219–229. | ||
Goren A, Mould-Quevedo J, DiBonaventura MD. Prevalence of pain reporting and associated health outcomes across emerging markets and developed countries. Pain Med. 2014;15(11):1880–1891. | ||
daCosta DiBonaventura M, Yuan Y, Wagner JS, L’Italien GJ, Lescrauwaet B, Langley P. The burden of viral hepatitis C in Europe: a propensity analysis of patient outcomes. Eur J Gastroenterol Hepatol. 2012;24(8):869–877. | ||
Charlson ME, Pompei P, Ales KL, MacKenzie CR. A new method of classifying prognostic comorbidity in longitudinal studies: development and validation. J Chronic Dis. 1987;40(5):373–383. | ||
Bang H, Edwards AM, Bomback AS, et al. Development and validation of a patient self-assessment score for diabetes risk. Ann Intern Med. 2009;151(11):775–783. | ||
Ware JE, Kosinski M, Dewey JE, Gandek B. SF-36 Health Survey: Manual and Interpretation Guide. Lincoln: Quality Metric Inc; 2000. | ||
Brazier J, Roberts J, Deverill M. The estimation of a preference-based measure of health from the SF-36. J Health Econ. 2002;21(2):271–292. | ||
Ware JE, Kosinski M, Turner-Bowker DM, Gandek B. How to Score Version 2 of the SF-12® Health Survey (With a Supplement Documenting Version 1). Lincoln: Quality Metric Inc; 2002. | ||
Walters SJ, Brazier JE. What is the relationship between the minimally important difference and health state utility values? The case of the SF-6D. Health Qual Life Outcomes. 2003;1:4. | ||
Reilly MC, Zbrozek AS, Dukes EM. The validity and reproducibility of a work productivity and activity impairment instrument. Pharmacoeconomics. 1993;4(5):353–365. | ||
Jönsson B; CODE-2 Advisory Board. Revealing the cost of type II diabetes in Europe. Diabetologia. 2002;45(7):S5–S12. | ||
Williams A, Lloyd A, Watson L, Rabe K. Cost of scheduled and unscheduled asthma management in seven European Union countries. Eur Respir Rev. 2006;15:4–9. | ||
ECB.europa.eu [webpage on the Internet]. European Central Bank. Inflation and the euro. Available from: https://www.ecb.europa.eu/stats/prices/hicp/html/inflation.en.html. Accessed May 24, 2015. | ||
OECD.org [webpage on the Internet]. Organization for Economic Cooperation and Development. Italy: OECD Data; Available from: https://data.oecd.org/italy.htm#profile-economy. Accessed May 24, 2015. | ||
DiBonaventura MD, Le Lay A, Kumar M, Hammer M, Wolden ML. The association between body mass index and health and economic outcomes in the United States. J Occ Environ Med. 2015;57(10):1047–1054. | ||
Wolfenstetter SB. Future direct and indirect costs of obesity and the influence of gaining weight: results from the MONICA/KORA cohort studies, 1995–2005. Econ Hum Biol. 2012;10(2):127–138. |
 © 2018 The Author(s). This work is published and licensed by Dove Medical Press Limited. The full terms of this license are available at https://www.dovepress.com/terms.php and incorporate the Creative Commons Attribution - Non Commercial (unported, v3.0) License.
By accessing the work you hereby accept the Terms. Non-commercial uses of the work are permitted without any further permission from Dove Medical Press Limited, provided the work is properly attributed. For permission for commercial use of this work, please see paragraphs 4.2 and 5 of our Terms.
© 2018 The Author(s). This work is published and licensed by Dove Medical Press Limited. The full terms of this license are available at https://www.dovepress.com/terms.php and incorporate the Creative Commons Attribution - Non Commercial (unported, v3.0) License.
By accessing the work you hereby accept the Terms. Non-commercial uses of the work are permitted without any further permission from Dove Medical Press Limited, provided the work is properly attributed. For permission for commercial use of this work, please see paragraphs 4.2 and 5 of our Terms.