")
Back to Journals » Clinical Interventions in Aging » Volume 16
Obesity, Even in the Metabolically Healthy, Increases the Risk of Poor Physical Performance: A Cross-Sectional Study of Older People in a Chinese Community
Authors Ma W, Liu Y, Wu N, Zhang H, Han P, Wang F, Wang J, Xie F, Niu S, Hu H, Zhang C, Chen N, Zhang Y, Guo Q , Yu Y
Received 16 January 2021
Accepted for publication 17 March 2021
Published 27 April 2021 Volume 2021:16 Pages 697—706
DOI https://doi.org/10.2147/CIA.S302167
Checked for plagiarism Yes
Review by Single anonymous peer review
Peer reviewer comments 2
Editor who approved publication: Dr Zhi-Ying Wu
Weibo Ma,1,* Yuewen Liu,1,* Ning Wu,1 Hui Zhang,1 Peipei Han,1 Feng Wang,1 Jingru Wang,1 Fandi Xie,2 Shumeng Niu,2 Hao Hu,2 Chenyu Zhang,1 Nuo Chen,1 Yichen Zhang,1 Qi Guo,1 Ying Yu1
1Department of Rehabilitation Medicine, Shanghai University of Medicine and Health Sciences, Shanghai, People’s Republic of China; 2Department of Clinical Laboratory Center, Shanghai Jiangwan Hospital, Shanghai, People’s Republic of China
*These authors contributed equally to this work
Correspondence: Qi Guo
Department of Rehabilitation Medicine, Shanghai University of Medicine and Health Sciences, No. 279 Zhouzhu Road, Pudong New Area, Shanghai, 201318, People’s Republic of China
Tel +86-21-8333-6977
Fax +86-21-8333-6977
Email [email protected]
Ying Yu Email [email protected]
Objective: We examined the association between obesity and physical performance under different metabolic status.
Methods: The sample included 1395 Chinese community-dwelling participants (mean age, 71.88 ± 5.87 years; 40.9% men). Being metabolically healthy was defined as having the presence of < 3 of 5 components of metabolic syndrome (MetS); obesity was defined as having a BMI > 28 kg/m2. Participants were divided into four groups based on BMI (non-obese/obese) and metabolic health (healthy/unhealthy). Physical performance was measured by grip strength, 4-m walking speed, and the timed up and go test (TUGT).
Results: After multiple adjustments, compared with metabolically healthy non-obese group, the metabolically unhealthy obese group showed lower relative grip strength, lower 4-m walking speed, and higher TUGT (P all < 0.05), and only relative grip strength of the metabolically healthy obese group was significantly lower than that of metabolically healthy non-obese (P < 0.01). Relative grip strength was negatively associated with impaired fasting glucose (β = − 0.071), elevated triglycerides (β = − 0.062), abdominal obesity (β = − 0.230) and general obesity (β = − 0.225) (P all < 0.01). Walking speed and TUGT were only associated with general obesity, rather than other metabolic components. The associations of MetS with physical performance were mainly driven by abdominal obesity.
Conclusion: Even in those who are metabolically healthy, obesity (especially general obesity) increases the risk of poor physical performance. Elderly people with general obesity and MetS, whether in combination or alone, have an increased risk of muscle dysfunction, and that combination produces a higher risk of impaired mobility.
Keywords: metabolic health, obesity, physical performance, grip strength, 4-m walking speed, TUGT
Introduction
Obesity is a major public health problem in the world, but some recent studies have reported that obese people have a better prognosis and a lower mortality rate than people with normal weight and body mass index (BMI).1,2 This may be because obesity, when defined solely by BMI, is a very heterogeneous disease with different metabolic manifestations between participants.3 For example, some obese adults without metabolic dysfunction in the form of metabolic risk factor clustering are considered “healthy”.4 Previous studies have shown that metabolically healthy people with obesity tend to have a lower risk of all-cause or cardiovascular death than metabolically unhealthy people with obesity.5,6 However, there are also opposing research results,7 and the clinical significance of the metabolically healthy obese (MHO) group has not been extensively studied. Therefore, a more detailed cross-classification of obesity according to metabolic status is needed, which should help to explain the heterogeneity of obesity and contribute to the health management and guidance of the elderly.
For the elderly, maintaining physical performance is essential for independent living.8 Obesity is closely related to musculoskeletal impairments,9 which often manifest clinically as osteoarthritis of the hip or knee;10 this is one of the reasons for poor physical performance (such as lower walking speed and muscle strength) in the elderly. Whether metabolic risk factors exacerbate these adverse reactions is a matter of contention.11,12 The association between obesity and physical performance under different metabolic status has been discussed in a few studies. One study suggested that obesity, even in those who are metabolically healthy, accelerates age-related declines in functional ability,9 while another study showed that MHO women present a greater functional capacity due to lower prevalence of arthritis and fewer comorbidities, low abdominal fat level, and higher physical activity level.13 Another study found that the risk of developing limited mobility was greater in obese participants with metabolic syndrome (MetS) relative to the non-obese without MetS,14 but whether and how specific components of MetS drive this relationship is unknown.
Therefore, this study examined the physical performance (measured by grip strength, 4-m walking speed, and the timed up and go test [TUGT]) of elderly people with differing metabolic levels and obesity. We further examined whether and which components of MetS drive this relationship. In China, as of 2012, more than 70% of elderly participants live in suburban areas. Therefore, this study selected elderly people living in Hangu District, Tianjin, and Chongming District, Shanghai, where the level of medical care is relatively low, and the physical condition of the elderly is easily overlooked and deserves more attention.
Methods
Study Design and Participants
The present study is a cross-sectional analysis using data from the Adult Physical Fitness and Health Cohort Study (APFHCS) [ChiCTR1900024880]. APFHCS is a large prospective dynamic cohort study, mainly investigating the relationship between physical fitness and health status of general adults living in Tianjin and Shanghai, China. We recruited 1614 participants from August 2018 to July 2019. The exclusion criteria were as follows: (1) age < 60 years, (2) severe arthritis or joint deformity causing impaired mobility or localized loss of strength, (3) malignancy, (4) current use of androgens or antiandrogens, and (5) refusal to participate in this study.15 In addition, 299 participants were excluded from the analysis because performance-based assessment was not performed or metabolic health and obesity indicators were missing. In the end, 1395 older participants (men 571, women 824) were available for analysis. The examination included a questionnaire and physical performance tests, conducted by graduate students in the field of health who have received special training in testing, improving and calibrating interviews. Written informed consent was obtained from all the participants.
Anthropometry Measurements
Participants were required to remove shoes and heavy clothing during anthropometric measurements. Height was measured to the nearest 0.1 cm using a portable stadiometer. Weight was measured to the nearest 0.1 kg using a digital scale, while keeping the participant in an upright position. Body mass index (BMI) was calculated as weight (kilograms)/height2 (meters2). Waist circumference was measured at the midpoint between the low ribs and iliac crest.
Assessment of Metabolic Parameters
We used standard operating protocols to measure the Adult Treatment Panel III (ATP-III) components that are used to define metabolic status.16 Blood pressure was measured twice after 5 min resting in a sitting position and expressed as the average of two consecutive measurements. Blood samples were taken from the participants’ peripheral veins in the morning after fasting for 10 to 12 hours. The tests included triglyceride (TG), fasting blood glucose (FBG), and high-density lipoprotein cholesterol (HDL) levels, using an automated analyzer.15
Definitions of Metabolic Status and Obesity
Metabolic syndrome (MetS) was diagnosed in participants meeting more than two of the following criteria:16 (1) increased TGs (≥ 1.7 mmol/L) or lipid-lowering drug use; (2) elevated blood pressure defined as systolic blood pressure ≥ 130 mmHg, diastolic blood pressure ≥ 85 mmHg, or anti-hypertensive drug use; (3) high FBG (≥ 5.6 mmol/L) or medications for diabetes; (4) low HDL (< 1.04 mmol/L for men and < 1.29 mmol/L for women); and (5) abdominal obesity (waist circumference ≥ 90 cm for men and ≥ 80 cm for women). Participants were defined as metabolically healthy if they met < 3 of the criteria and metabolically unhealthy if they met ≥ 3 of the criteria.
General obesity was defined as BMI ≥ 28.0 kg/m2 based on the criteria established by the Working Group on Obesity in China.17 According to these criteria, study participants were categorized into four groups: (1) metabolically healthy non-obese (MHNO) participants: < 3 MetS traits and BMI < 28.0 kg/m2; (2) metabolically healthy obese (MHO): < 3 MetS traits and BMI ≥ 28.0 kg/m2; (3) metabolically unhealthy non-obese (MUHNO) participants: ≥ 3 MetS traits and BMI < 28.0 kg/m2; or (4) metabolically unhealthy obese (MUHO): ≥ 3 MetS traits and BMI ≥ 28.0 kg/m2.
Physical Performance Assessment: Grip Strength, 4-Meter Walking Speed, TUGT
Grip strength was used as a measure of muscle strength and was quantified using a handheld dynamometer (GRIP-D; Takei Ltd, Niigata, Japan).15 Participants were asked to use their dominant hand to exert their maximum force twice. In this study, relative grip strength was adjusted with respect to the participant’s body weight (relative grip strength = grip strength (kg)/body weight (kg)) in order to ensure we were evaluating muscle strength independent of body size.18
Gait speed was measured by placing two photocells connected to a recording chronometer at the start and end of the 4-meter course. Instruct participants to stand with their feet touching the starting line and start walking at a normal speed after a verbal command. To prevent participants from slowing down before reaching the 4-meter line, the actual walking distance was greater than the required 4 meters. The time between activation of the first and second photocells was recorded. The procedure was repeated twice, and the mean walking speed time (m/s) calculated. The participants were allowed to use a gait-assistance device.19
The TUGT has been used to assess basic balance and the risk of falls in older adults. The participants could wear their usual shoes and use a gait-assistance device if necessary. Participants were instructed to walk at a habitual pace, then sit in a standardized chair and keep their arms and torso supported. When the verbal order was issued, the evaluator started the chronometer, and the participants stood up, walked 3 meters in a straight line, turned 180°, walked back to the chair, and sat down again. When the participants were sitting in the chair with the arms and back supported, the chronometer stopped. The time required to complete the test was recorded in seconds.15,19
Covariates
Face-to-face epidemiological questionnaire interviews were performed by trained interviewers to collect information on sociodemographic, behavioral characteristics, and medical conditions as our previous study.20,21 Sociodemographic variables included sex, age, marital status, living situation, education level, and occupation. Behavioral characteristics included smoking (never, former, or current smoker), and drinking habits (never, former, occasional, or daily drinker), and physical activity situation. Former smokers were defined as those who used to smoke frequently but did not smoke for at least half a year. Current smoker smokers were defined as those who smoke at least one cigarette every day for at least one year. Former drinkers were defined as those who were abstinent for over half a year. Physical activity was assessed using the short form of the International Physical Activity Questionnaire (IPAQ).22 Responses were converted to metabolic equivalent task minutes per week (MET-min/week) by multiplying total minutes over the previous 7 days spent on vigorous activity, moderate-intensity activity, and walking by 8.0, 4.0, and 3.3, respectively, and then summing to indicate overall physical activity. Medical history, including diabetes, hypertension, hyperuricemia, stroke, arthritis, cancer, and coronary heart disease, was evaluated on the basis of participants’ responses (yes or no) to questions about their history, past diagnoses made by physicians, and current or historical medication regimens.20
Statistical Analyses
Data were expressed as mean ± SD, median (interquartile range 25–75%), or percentage across the four groups. Differences among the groups were tested using analysis of variance (ANOVA) for continuous variables, and subsequent comparisons were followed by Bonferroni corrections. Categorical variables were analyzed with Pearson’s Chi-square test or Fisher’s exact test. The analysis of covariance (ANCOVA) was used for comparing the physical performance (ie, relative grip strength, 4-m walking speed, and TUGT) between four groups. The adjusted model included covariates for age, sex, smoking, alcohol, occupation, educational level, IPAQ, and the number of chronic medical conditions (diabetes, hypertension, hyperuricemia, stroke, coronary heart disease, arthritis, and cancer). If the comparison of the four groups indicated statistical significance, we executed multiple pairwise comparisons with Bonferroni correction.
Univariate and enter multiple linear regression models were used to evaluate the association between each metabolic component (independent variable) and physical performance (dependent variable) separately, and the covariates in the model were completely adjusted as mentioned above. By comparing adjusted R2 statistics, we determined the relative importance of each metabolic component to physical function, because covariate adjustment remained unchanged in each model. Next, each component of MetS was introduced as a covariate to the stepwise multiple linear regression model between MetS and the physical performance to test if the metabolic components could explain the association between MetS and the physical performance.
Finally, we evaluated the impact of MetS categories on physical performance based on the number of metabolic components possessed (0, 1–2, or 3–5). The analysis of covariance and Bonferroni corrections were repeated. All statistical results were based on two-sided tests. Data were analyzed using SPSS 22.0 software. P-values < 0.05 were considered to indicate statistical significance.
Ethics
The research was approved by the ethics committees of Tianjin Medical University and Shanghai University of Medicine and Health Sciences. The methods were implemented in accordance with the principles of the Declaration of Helsinki.
Results
Characteristics of Study Participants According to Metabolic Health and Obesity Status
Among the 1395 participants, 694 (49.75%) were in the MHNO group, with 50 (3.58%) in the MHO group, 525 (37.63%) in the MUHNO group, and 126 (9.03%) in the MUHO group. The metabolically unhealthy group (MUHNO+MUO) had significantly more chronic medical conditions (having 3 or more) and showed higher systolic blood pressure (SBP), TG, and FPG, and lower HDL than the metabolically healthy group (MHNO+MHO). In particular, compared to MHO group, participants in MUHO group had a lower rate of widowhood and solitary living, but higher SBP, FPG, and TG (Table 1).
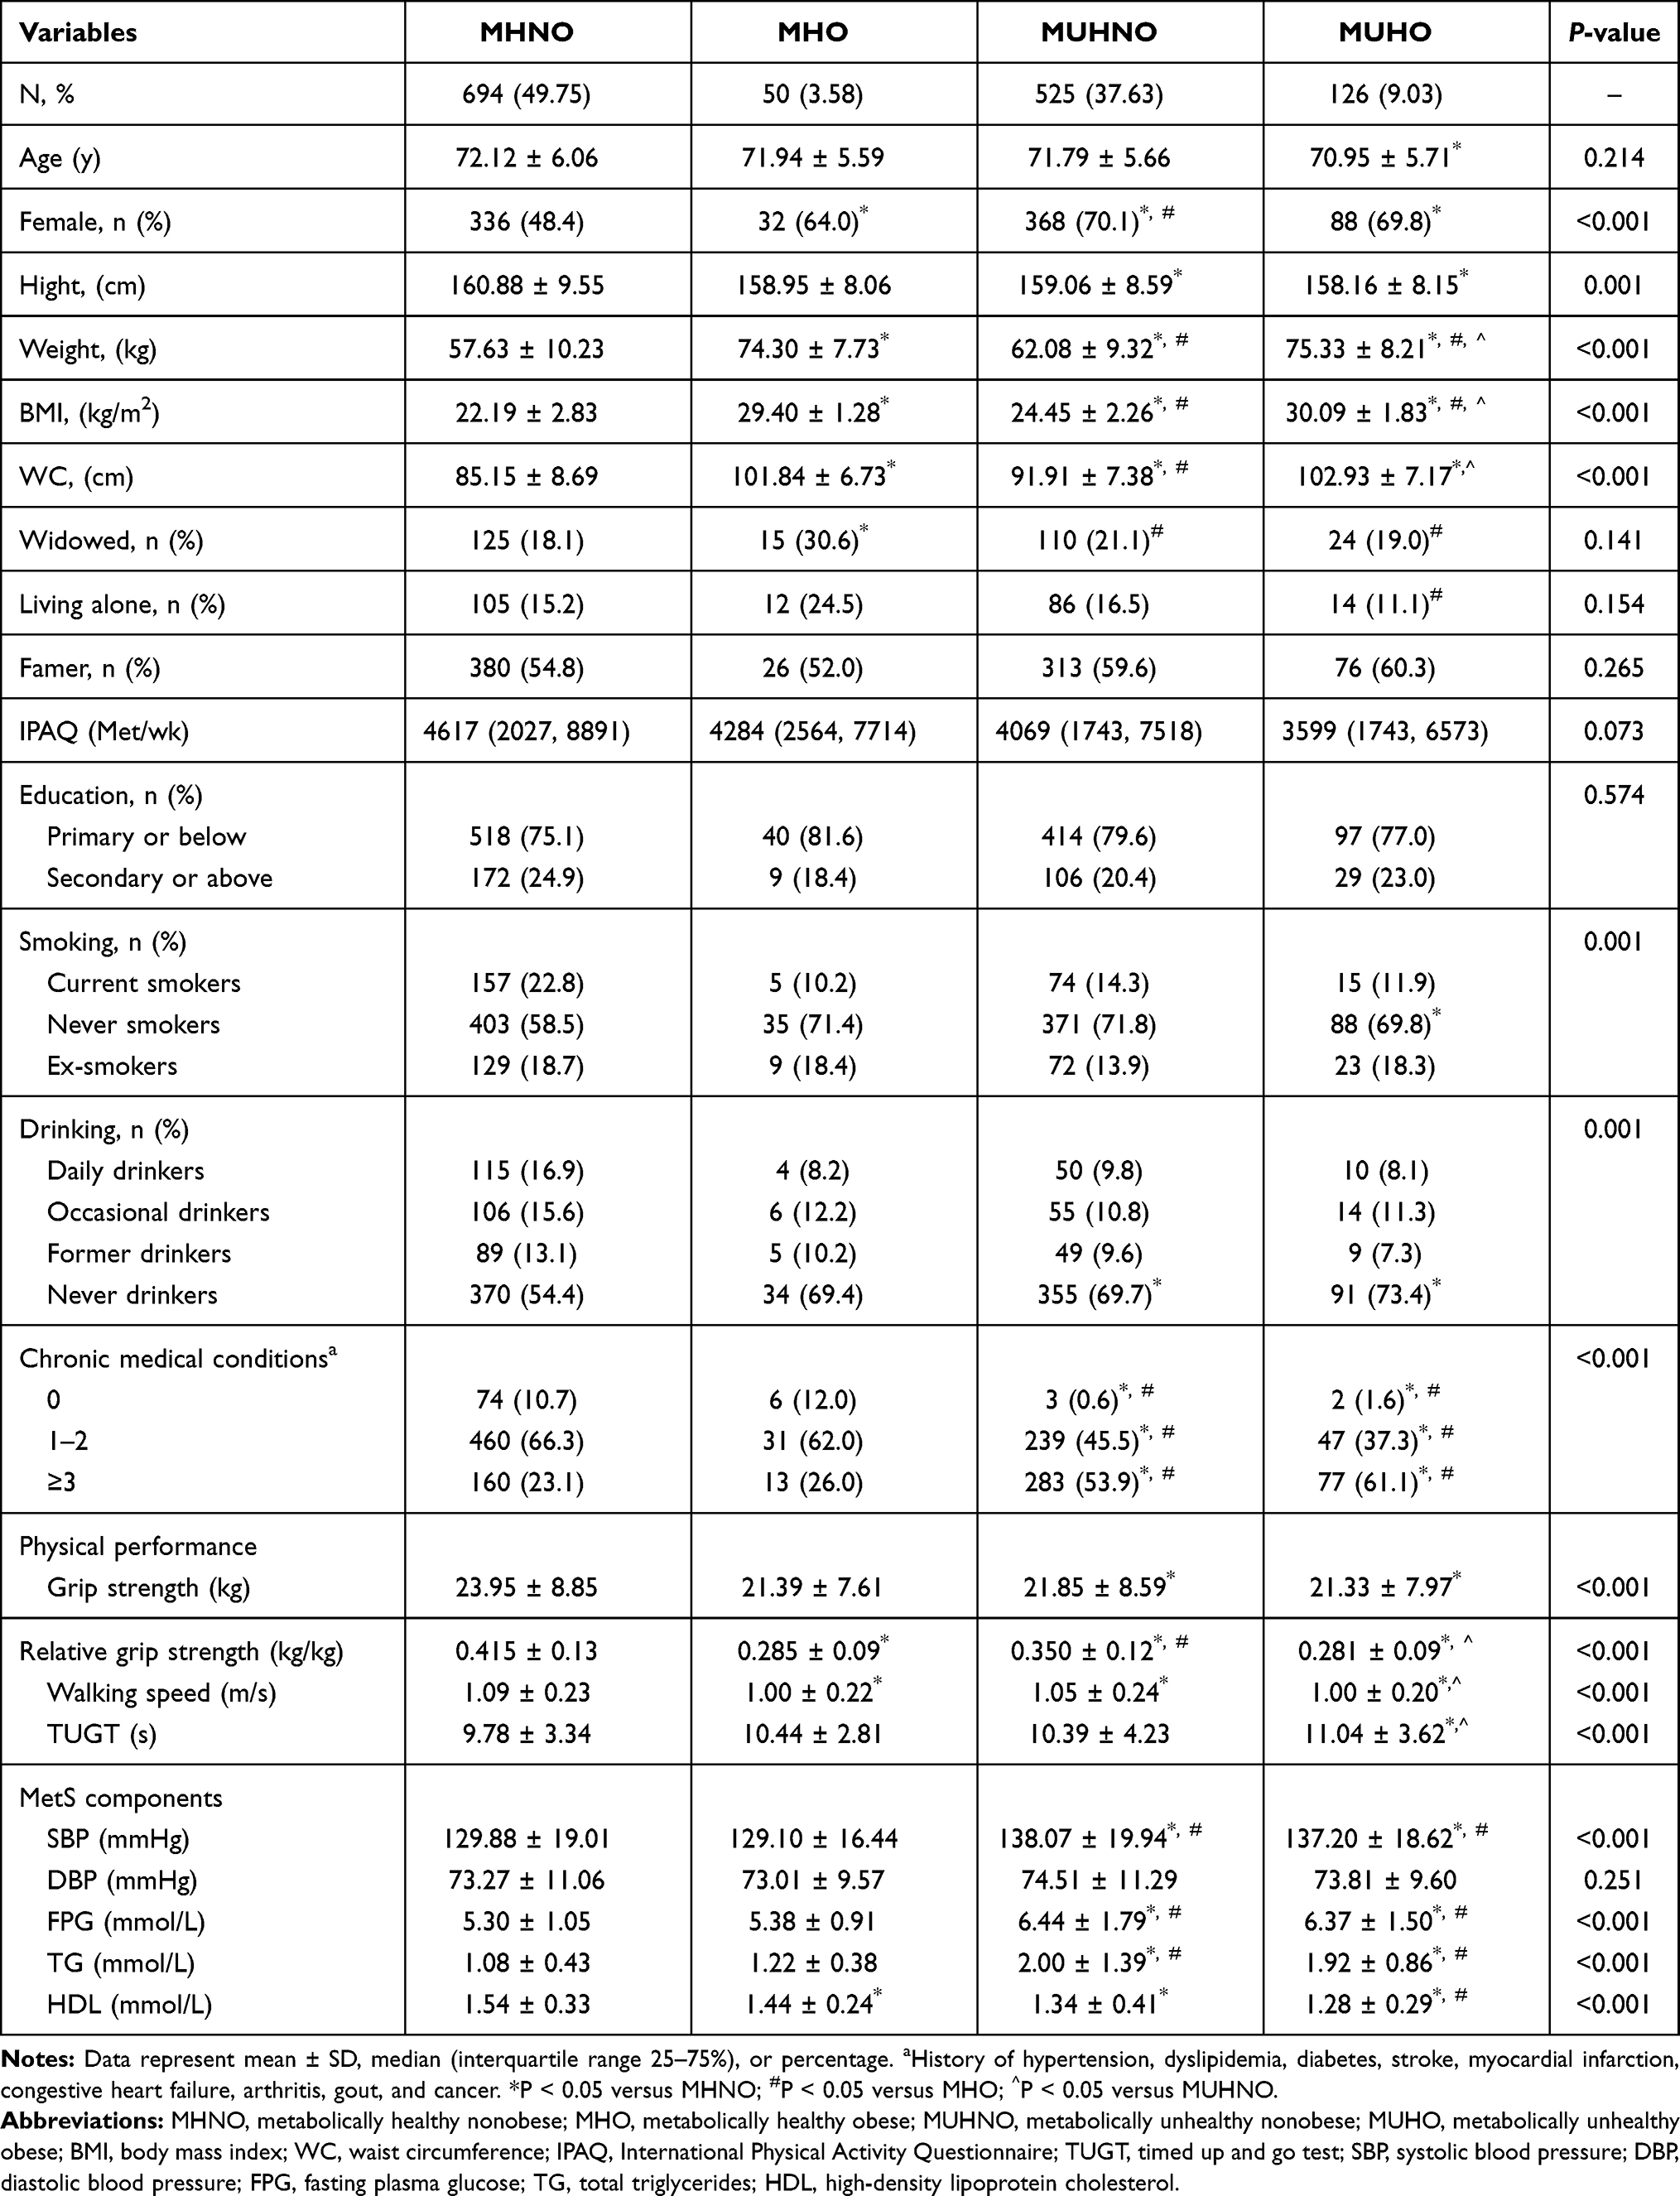 |
Table 1 Characteristics of Study Group, Stratified by Metabolically Healthy and Obesity Status |
Comparison of Physical Performance According to Metabolic Health and Obesity Status
Univariate regression models showed that MetS and general obesity were associated with all physical performance measures (Supplementary Table S1). Table 1 showed that participants in the MHO, MHNO, and MUHNO groups had significantly lower relative grip strength and lower 4-m walking speed than those in the MHNO. Similarly, the TUGT value of the MHNO group was lower than the other groups. In addition, the relative grip strength of MHO participants was significantly lower than that of MHNO or MUHNO participants. There were statistically significant differences between the MUHNO and MUHO groups in relative grip strength, 4-m walking speed, and TUGT.
Even after adjusting for age, sex, educational level, occupation, IPAQ, and the number of chronic diseases, the relative grip strength of the MHO group was significantly lower than those of the MHNO and MUHNO groups. The relative grip strength and 4-m walking speed of the MUHO group was lower than that of the MHNO and MUHNO groups, but the TUGT of the MUHO group was only higher than that of the MHNO group (Figure 1).
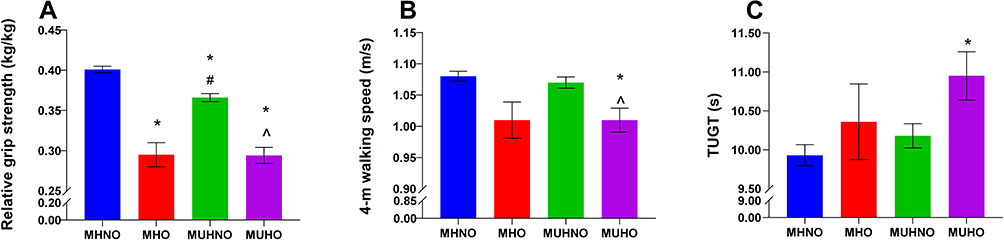 |
Figure 1 (A) Mean relative grip strength (kg/kg), (B) Mean 4-m walking speed (m/s), (C) Mean TUGT (s). Statistical analysis was performed using ANCOVA. P-values represent the result of Bonferroni corrections after adjusting for age, sex, educational level, marital status, living situation, drinking, smoking, occupation, International Physical Activity Questionnaire (IPAQ), the number of chronic medical conditions. *P < 0.05 versus MHNO; #P < 0.05 versus MHO; ^P < 0.05 versus MUHNO. Abbreviations: TUGT, timed up and go test; ANCOVA, analysis of covariance; MHNO, metabolically healthy nonobese; MHO, metabolically healthy obese; MUHNO, metabolically unhealthy nonobese; MUHO, metabolically unhealthy obese. |
Association Between Metabolic Components and Physical Performance
In order to explore the metabolic components that affect physical performance, linear regression analysis was used. Univariate regression models showed that all metabolic components were associated with relative grip strength, while elevated triglycerides and low HDL were not associated with 4-m walking speed or TUGT (Table 2). After adjusting for all the factors, relative grip strength still exhibited a significant association with impaired fasting glucose (β = −0.071), elevated triglycerides (β = −0.062), and abdominal obesity (β = −0.230) (P all < 0.01; see Table 3). However, none of the metabolic components was related to 4-m walking speed or TUGT. To determine the relative importance of each metabolic component to physical performance, we compared the R2 statistics. Notably, general obesity had the highest adjusted R2 value (R2 = 0.359) across relative grip strength, followed by abdominal obesity (R2 = 0.354), even more so than the composite MetS variable (R2 = 0.328) (Table 3, Supplementary Table S2). When metabolic components but excluding abdominal obesity were all added as covariates to the stepwise multivariate linear regression model between MetS and relative grip strength, the MetS-relative grip strength association was significant (β = −0.163, P < 0.001) (Table 4). However, once abdominal obesity was added as a covariate to the model, the MetS-relative grip strength association became statistically non-significant, suggesting that the MetS-relative grip strength association was mainly mediated by abdominal obesity (Supplementary Table S3).
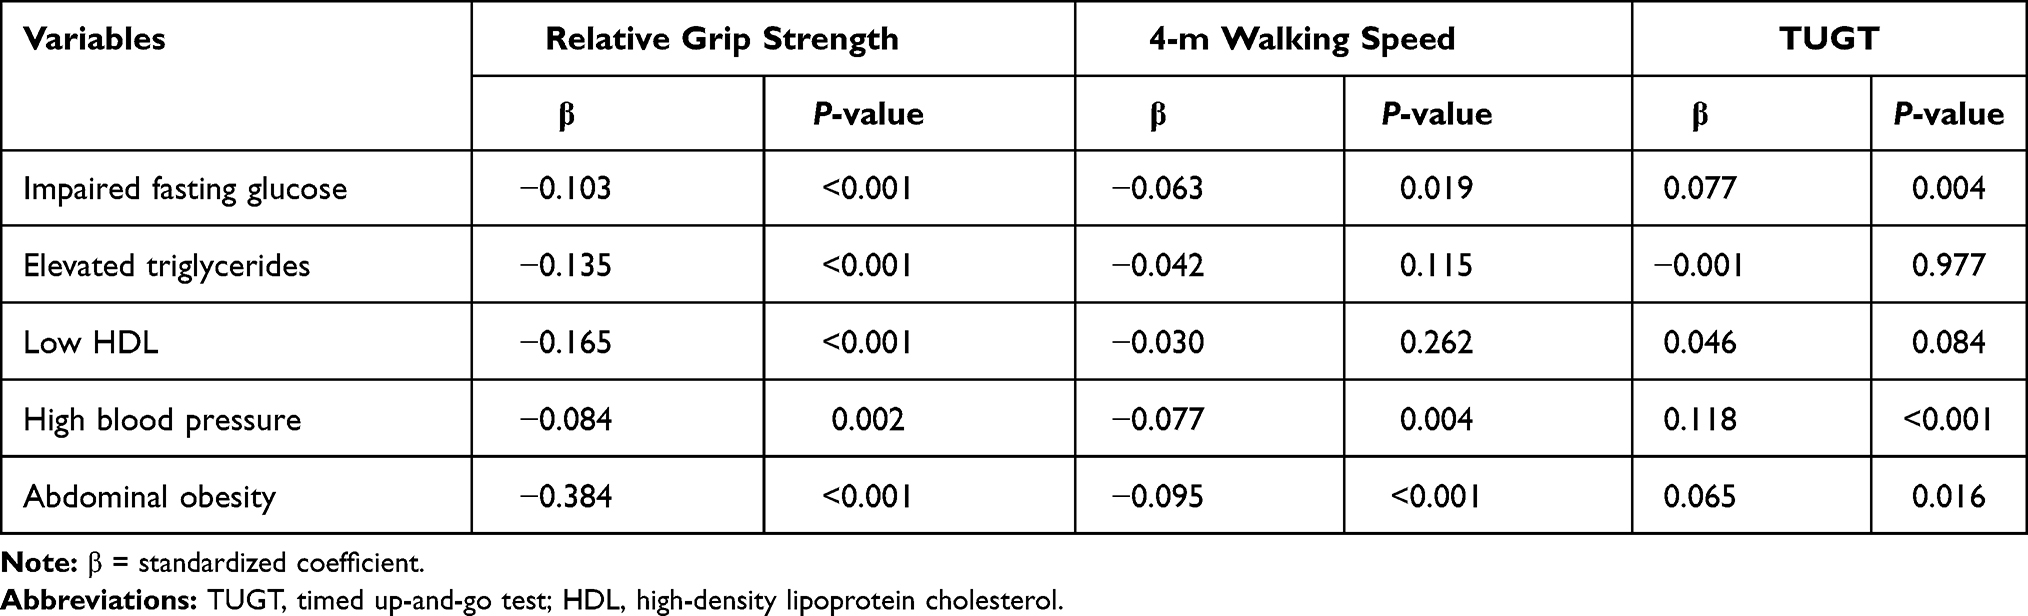 |
Table 2 Univariate Regression Analysis of the Association Between Metabolic Components, Obesity with Physical Performance Measures |
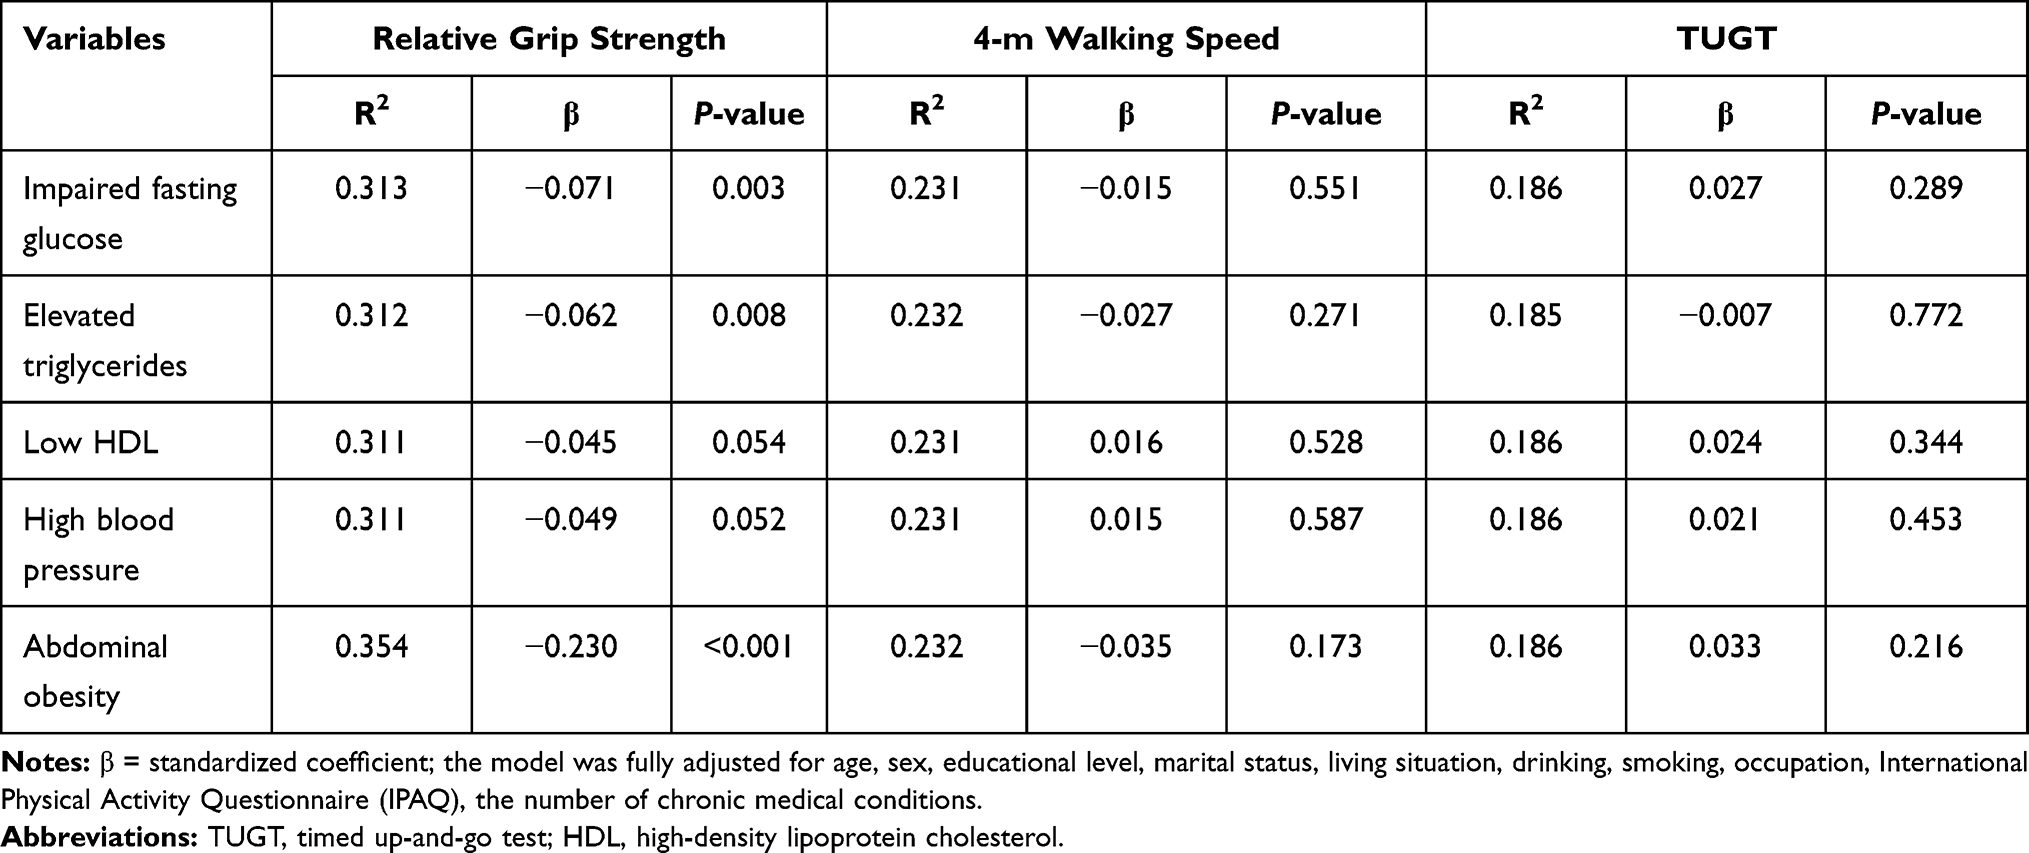 |
Table 3 Multivariate Linear Regression Analysis of the Association Between Metabolic Components with Physical Performance Measures |
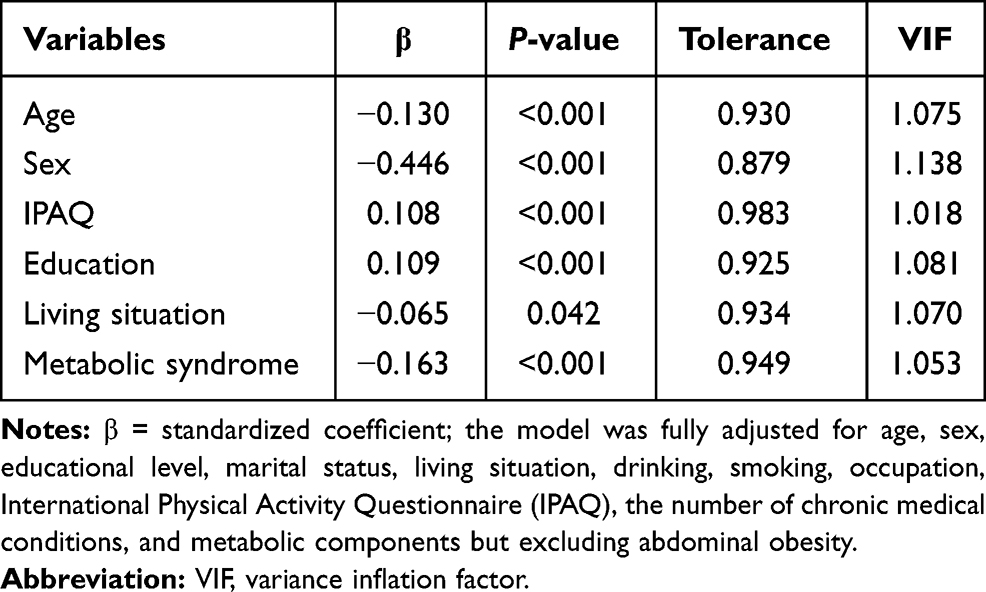 |
Table 4 Stepwise Multivariate Linear Regression Analysis of the Association Between Metabolic Syndrome with Relative Grip Strength |
In particular, the relative grip strength decreased significantly in conjunction with an increase in the number of metabolic components, even after adjusting for all confounding factors. Means (95% CI) for the groups of 0 metabolic component, 1–2 metabolic components, and 3–5 metabolic components were 0.439 (0.415–0.463), 0.389 (0.380–0.397), and 0.352 (0.343–0.361), respectively (Figure 2).
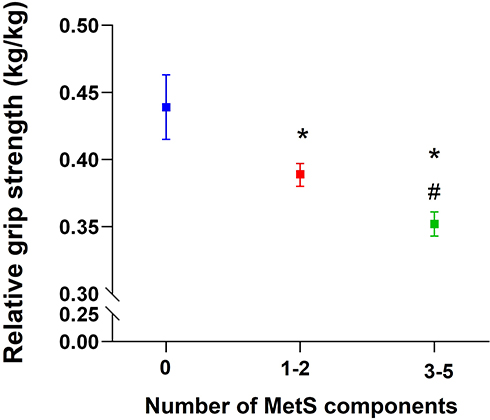 |
Figure 2 The circled points and error bars represent adjusted mean values and 95% Cl of relative grip strength, respectively. Statistical analysis was performed using ANCOVA. P-values represent the result of Bonferroni corrections after adjusting for age, sex, educational level, occupation, International Physical Activity Questionnaire (IPAQ), the number of chronic medical conditions. Means (95% CI) for the groups of 0 metabolic component, 1–2 metabolic components, and 3–5 metabolic components were 0.439 (0.415–0.463), 0.389 (0.380–0.397) and 0.352 (0.343–0.361), respectively. *P < 0.05 versus 0 metabolic component; #P < 0.05 versus 1–2 metabolic components. |
Discussion
The purpose of this study was to determine the cross-sectional associations between obesity and physical performance under different metabolic status. The main finding was that obesity, even in metabolically healthy participants, increases the risk of poor physical performance. This was especially true for general obesity. Whether combined or isolated, older adults with obesity and MetS (especially high waist circumference, impaired fasting glucose, and elevated triglycerides) were at increased risk of poor muscle strength. Older adults with combined, but not isolated, general obesity and MetS showed an increased risk of impaired mobility.
The Prevalence of MHNO, MHO, MUHNO, and MUHO
Although there is no universally accepted definition for metabolic health status, using ATP-III criteria is reasonable because the threshold for metabolic risk has been validated.23,24 The prevalence rates of MHNO, MHO, MUHNO, and MUHO in our study were 49.75%, 3.58%, 37.63%, and 9.03%, respectively, similar to a relatively large sample size study in China.23
Relationship Between Metabolic Health, Obesity, and Relative Grip Strength
Grip strength is a measure of overall muscular strength. Our results showed that the relative grip strength of MHO was lower than that of MHNO and MUHNO. Additionally, relative grip strength was different between the MUHNO and MUHO groups. This means that obese people are more likely to experience a decline in muscle strength than non-obese participants, regardless of their metabolic status. This result supports previous evidence in the elderly that has shown the negative effect of obesity on grip strength.15,25 Some biological pathways (eg, inflammation, sex-specific hormones, anabolic resistance, and muscle denervation) likely contribute to obesity-induced muscle weakness.26,27 Moreover, the identification of genetic variants for body fat metabolism may also provide an understanding of the development of physical limitations.28 In contrast, a previous study by Sui et al suggested there was no association between grip strength and BMI.29 Unlike our study population, the population of that study was women in Australia aged 28–95. Differences in age, sex, and sociodemographic factors may have contributed to the differences in the results.
Our study demonstrated negative associations of MetS and metabolic components (abdominal obesity, elevated triglycerides and impaired fasting glucose) with muscle strength. The mechanisms for the negative relationship may be due to high metabolic load, malnutrition, inflammation, and changes in hormones, immunity and neural mechanisms can all lead to a decline in muscle strength.30,31 Similar to our study, the Korean Longitudinal Study observed significant associations between MetS and muscle strength.32 Other studies have also shown a negative correlation between excess abdominal adiposity, higher levels of glucose and triglycerides, and grip strength.25,33 Furthermore, our study found that abdominal obesity explained (35.4%) changes in relative grip strength more than the other four metabolic components. In addition, our research result was consistent with other studies31,34 showing that the MetS-relative grip strength association was mainly mediated by abdominal obesity. In the future, we will explore whether other factors contribute to the relationship between metabolic components and physical performance, such as age, sex, and inflammatory factors.
Relationship Between Metabolic Health, Obesity, and 4-m Walking Speed
In this study, we found that the 4-m walking speed of the MUHO group was lower than that of the MHNO and MUHNO groups. Similarly, the Whitehall II cohort study used walking speed to evaluate imitation of mobility and found that the greatest decline was seen among unhealthy obese adults compared with healthy normal-weight adults, and this was not significantly greater than for healthy obese adults.9 An 11-year-long longitudinal study showed that the decline in walking speed was more pronounced in obese participants.35 The opposite result was reported by Bouchard et al in eighty-six obese women aged from 28 to 74 years old.13
It should be noted that only general obesity and not any of the metabolic components in our study were related to 4-m walking speed (Supplementary Table S2). A similar report found that high waist circumference, as a marker of abdominal adiposity, was not associated with a decline in maximal walking speed.36 This may be because excess body weight rather than abdominal adipose tissue can be related to mechanical stress, pain, reduction of daily living activity, and consequently, the degree of physical mobility. Some studies have confirmed that metabolic risk factors such as hyperglycemia and hyperlipidemia are unsupportive factors of physical performance;33,37 however, considering that our population is mainly engaged in agriculture and animal husbandry, a high activity level may weaken the adverse effect of metabolic factors on mobility.
Relationship Between Metabolic Health, Obesity, and TUGT
Additionally, our research showed that only WUHO participants were more likely to exhibit impaired mobility due to higher TUGT. Our results supported the findings of Gottlieb et al that there was no significant difference in TUGT between elderly patients with MetS and participants without MetS (Supplementary Table S2). 12 But our research added the relevant finding that comprehensive MetS and general obesity seem to increase the risk of impaired mobility in older adults. A biomechanical study showed that obese people take shorter/wider strides, spend more time in the stance rather than the swing phase of the walking cycle, and have lower knee and hip flexion as well as higher ankle plantar flexion than non-obese people, and therefore walk slower.38 However, part of the observed effect was also likely to be due to a reverse causation process whereby lower mobility induces obesity or MetS.
Strengths and Limitations of the Study
This is the first study in China to identify the relationship between obesity and physical performance in the elderly under different metabolic status and examine whether and which components of MetS drive this relationship. However, this study has some limitations that must be mentioned. First, using BMI as an indicator of obesity is a limitation. Although we have established a relatively consistent link between obesity and physical performance, BMI cannot distinguish between fat mass and muscle mass, nor can it distinguish between fat infiltration of muscle or sarcopenia. Second, the IPAQ was developed to assess physical activity levels across populations aged 18–65, so it may not be sensitive enough to accurately represent the physical activity of older adults. Third, due to the limitations of a cross-sectional study, it was not possible to assess a causal relationship between obesity and physical performance under different metabolic status. Finally, this was a single-center study, which limited the generalizability of our findings to the entire Chinese population.
Conclusions
Our findings suggest that obesity (especially general obesity) increases the risk of poor physical performance, even if the participant is metabolically healthy. Older adults with obesity and MetS, whether singly or combined, are at increased risk of muscle dysfunction. Older adults with combined general obesity and MetS but neither alone show an increased risk of impaired mobility. Given that physical performance represents a critically important and modifiable predictor of independent living in older adults, future research should test whether reductions in weight and regional body fat mass in older adults with MetS results in improved physical performance.
Acknowledgments
Thank you for the venue and organization provided by Xiaofang Ren of Hangu Welfare House and Yanping Zhang of Chongming Public Health Center. Weibo Ma and Yuewen Liu should be considered co-first authors.
Funding
This work was supported by Wu Jieping medical foundation (320.6750.17073), Shanghai Sailing Program (20YF1418200) and the funding of Youth Fund Project of Research Planning Foundation on Humanities and Social Sciences of the Ministry of Education (20YJCZH001).
Disclosure
The authors declare no conflicts of interest.
References
1. Puzianowska-Kuznicka M, Kurylowicz A, Walkiewicz D, et al. Obesity paradox in caucasian seniors: results of the PolSenior Study. J Nutr Health Aging. 2019;23(9):796–804. doi:10.1007/s12603-019-1257-z
2. Whelton SP, McAuley PA, Dardari Z, et al. Association of BMI, fitness, and mortality in patients with diabetes: evaluating the obesity paradox in the Henry Ford exercise testing project (FIT Project) cohort. Diabetes Care. 2020;43(3):677–682. doi:10.2337/dc19-1673
3. Neeland IJ, Poirier P, Despres JP. Cardiovascular and metabolic heterogeneity of obesity: clinical challenges and implications for management. Circulation. 2018;137(13):1391–1406. doi:10.1161/CIRCULATIONAHA.117.029617
4. Smith GI, Mittendorfer B, Klein S. Metabolically healthy obesity: facts and fantasies. J Clin Invest. 2019;129(10):3978–3989. doi:10.1172/JCI129186
5. Bluher M. Metabolically healthy obesity. Endocr Rev. 2020;41(3):405–420. doi:10.1210/endrev/bnaa004
6. Stefan N, Haring HU, Schulze MB. Metabolically healthy obesity: the low-hanging fruit in obesity treatment? Lancet Diabetes Endocrinol. 2018;6(3):249–258. doi:10.1016/S2213-8587(17)30292-9
7. Jyvakorpi SK, Urtamo A, Strandberg AY, et al. Associations of overweight and metabolic health with successful aging: 32-year follow-up of the Helsinki businessmen Study. Clin Nutr. 2020;39(5):1491–1496. doi:10.1016/j.clnu.2019.06.011
8. Yang M, Hu X, Wang H, Zhang L, Hao Q, Dong B. Sarcopenia predicts readmission and mortality in elderly patients in acute care wards: a prospective study. J Cachexia Sarcopenia Muscle. 2017;8(2):251–258. doi:10.1002/jcsm.12163
9. Bell JA, Sabia S, Singh-Manoux A, Hamer M, Kivimaki M. Healthy obesity and risk of accelerated functional decline and disability. Int J Obes (Lond). 2017;41(6):866–872. doi:10.1038/ijo.2017.51
10. Jiang L, Tian W, Wang Y, et al. Body mass index and susceptibility to knee osteoarthritis: a systematic review and meta-analysis. Joint Bone Spine. 2012;79(3):291–297. doi:10.1016/j.jbspin.2011.05.015
11. Tay J, Goss AM, Locher JL, Ard JD, Gower BA. Physical function and strength in relation to inflammation in older adults with obesity and increased cardiometabolic risk. J Nutr Health Aging. 2019;23(10):949–957. doi:10.1007/s12603-019-1260-4
12. Gottlieb MG, Closs VE, Rosemberg LS, et al. Lack of association of body composition and functionality variables with metabolic syndrome in the elderly. Metab Syndr Relat Disord. 2014;12(7):397–401. doi:10.1089/met.2014.0012
13. Bouchard DR, Langlois MF, Brochu M, Dionne IJ, Baillargeon JP. Metabolically healthy obese women and functional capacity. Metab Syndr Relat Disord. 2011;9(3):225–229. doi:10.1089/met.2010.0101
14. Stenholm S, Koster A, Alley DE, et al. Joint association of obesity and metabolic syndrome with incident mobility limitation in older men and women–results from the health, aging, and body composition Study. J Gerontol a Biol Sci Med Sci. 2010;65(1):84–92. doi:10.1093/gerona/glp150
15. Shen S, Li J, Guo Q, et al. Body mass index is associated with physical performance in suburb-dwelling older chinese: a cross-sectional study. PLoS One. 2015;10(3):e119914. doi:10.1371/journal.pone.0119914
16. Grundy SM, Brewer HJ, Cleeman JI, Smith SJ, Lenfant C. Definition of metabolic syndrome: report of the National Heart, Lung, and Blood Institute/American Heart Association conference on scientific issues related to definition. Arterioscler Thromb Vasc Biol. 2004;24(2):e13–e18. doi:10.1161/01.ATV.0000111245.75752.C6
17. Chen C, Lu FC. The guidelines for prevention and control of overweight and obesity in Chinese adults. Biomed Environ Sci. 2004;17 Suppl:1–36.
18. Huang C, Niu K, Momma H, et al. Breakfast consumption frequency is associated with grip strength in a population of healthy Japanese adults. Nutr Metab Cardiovasc Dis. 2014;24(6):648–655. doi:10.1016/j.numecd.2013.12.013
19. Wang X, Ma Y, Wang J, et al. Mobility and muscle strength together are more strongly correlated with falls in suburb-dwelling older Chinese. Sci Rep. 2016;6(1):25420. doi:10.1038/srep25420
20. Chen X, Guo J, Han P, et al. Twelve-month incidence of depressive symptoms in suburb-dwelling chinese older adults: role of sarcopenia. J Am Med Dir Assoc. 2019;20(1):64–69. doi:10.1016/j.jamda.2018.07.017
21. Liu Y, Ma W, Li M, et al. Relationship between physical performance and mild cognitive impairment in chinese community-dwelling older adults. Clin Interv Aging. 2021;16:119–127. doi:10.2147/CIA.S288164
22. Craig CL, Marshall AL, Sjostrom M, et al. International physical activity questionnaire: 12-country reliability and validity. Med Sci Sports Exerc. 2003;35(8):1381–1395. doi:10.1249/01.MSS.0000078924.61453.FB
23. Wei Y, Wang J, Han X, et al. Metabolically healthy obesity increased diabetes incidence in a middle-aged and elderly Chinese population. Diabetes Metab Res Rev. 2020;36(1):e3202. doi:10.1002/dmrr.3202
24. Hinnouho GM, Czernichow S, Dugravot A, Batty GD, Kivimaki M, Singh-Manoux A. Metabolically healthy obesity and risk of mortality: does the definition of metabolic health matter? Diabetes Care. 2013;36(8):2294–2300. doi:10.2337/dc12-1654
25. Perez-Sousa MA, Del PJ, Cano-Gutierrez CA, et al. Glucose levels as a mediator of the detrimental effect of abdominal obesity on relative handgrip strength in older adults. J Clin Med. 2020;9(8):2323. doi:10.3390/jcm9082323
26. Tomlinson DJ, Erskine RM, Morse CI, Winwood K, Onambele-Pearson G. The impact of obesity on skeletal muscle strength and structure through adolescence to old age. Biogerontology. 2016;17(3):467–483. doi:10.1007/s10522-015-9626-4
27. Batsis JA, Villareal DT. Sarcopenic obesity in older adults: aetiology, epidemiology and treatment strategies. Nat Rev Endocrinol. 2018;14(9):513–537. doi:10.1038/s41574-018-0062-9
28. Gonzalez-Mariscal I, Montoro RA, O’Connell JF, et al. Muscle cannabinoid 1 receptor regulates Il-6 and myostatin expression, governing physical performance and whole-body metabolism. FASEB J. 2019;33(5):5850–5863. doi:10.1096/fj.201801145R
29. Sui SX, Holloway-Kew KL, Hyde NK, et al. Handgrip strength and muscle quality in Australian women: cross-sectional data from the Geelong Osteoporosis Study. J Cachexia Sarcopenia Muscle. 2020;11(3):690–697. doi:10.1002/jcsm.12544
30. Everson-Rose SA, Paudel M, Taylor BC, et al. Metabolic syndrome and physical performance in elderly men: the osteoporotic fractures in men study. J Am Geriatr Soc. 2011;59(8):1376–1384. doi:10.1111/j.1532-5415.2011.03518.x
31. Ishii S, Tanaka T, Akishita M, Ouchi Y, Tuji T, Iijima K. Metabolic syndrome, sarcopenia and role of sex and age: cross-sectional analysis of Kashiwa cohort study. PLoS One. 2014;9(11):e112718. doi:10.1371/journal.pone.0112718
32. Yang EJ, Lim S, Lim JY, Kim KW, Jang HC, Paik NJ. Association between muscle strength and metabolic syndrome in older Korean men and women: the Korean longitudinal study on health and aging. Metabolism. 2012;61(3):317–324. doi:10.1016/j.metabol.2011.07.005
33. Gubelmann C, Vollenweider P, Marques-Vidal P. Association of grip strength with cardiovascular risk markers. Eur J Prev Cardiol. 2017;24(5):514–521. doi:10.1177/2047487316680695
34. Beavers KM, Hsu FC, Houston DK, et al. The role of metabolic syndrome, adiposity, and inflammation in physical performance in the Health ABC Study. J Gerontol a Biol Sci Med Sci. 2013;68(5):617–623. doi:10.1093/gerona/gls213
35. Artaud F, Singh-Manoux A, Dugravot A, Tavernier B, Tzourio C, Elbaz A. Body mass index trajectories and functional decline in older adults: three-City Dijon cohort study. Eur J Epidemiol. 2016;31(1):73–83. doi:10.1007/s10654-015-0027-4
36. Wennman H, Jerome GJ, Simonsick EM, et al. Adiposity markers as predictors of 11-year decline in maximal walking speed in late midlife. J Appl Gerontol. 2020:370871734. doi:10.1177/0733464820911542.
37. Stringhini S, Carmeli C, Jokela M, et al. Socioeconomic status, non-communicable disease risk factors, and walking speed in older adults: multi-cohort population based study. BMJ. 2018;360:k1046. doi:10.1136/bmj.k1046
38. Fernandez MA, Saubade M, Hans D, Millet GP, Malatesta D. The determinants of the preferred walking speed in individuals with obesity. Obes Facts. 2019;12(5):543–553. doi:10.1159/000501968
 © 2021 The Author(s). This work is published and licensed by Dove Medical Press Limited. The full terms of this license are available at https://www.dovepress.com/terms.php and incorporate the Creative Commons Attribution - Non Commercial (unported, v3.0) License.
By accessing the work you hereby accept the Terms. Non-commercial uses of the work are permitted without any further permission from Dove Medical Press Limited, provided the work is properly attributed. For permission for commercial use of this work, please see paragraphs 4.2 and 5 of our Terms.
© 2021 The Author(s). This work is published and licensed by Dove Medical Press Limited. The full terms of this license are available at https://www.dovepress.com/terms.php and incorporate the Creative Commons Attribution - Non Commercial (unported, v3.0) License.
By accessing the work you hereby accept the Terms. Non-commercial uses of the work are permitted without any further permission from Dove Medical Press Limited, provided the work is properly attributed. For permission for commercial use of this work, please see paragraphs 4.2 and 5 of our Terms.