")
Back to Journals » ClinicoEconomics and Outcomes Research » Volume 13
Obesity, Disability and Self-Perceived Health Outcomes in Australian Adults: A Longitudinal Analysis Using 14 Annual Waves of the HILDA Cohort
Authors Keramat SA , Alam K , Ahinkorah BO, Islam MS, Islam MI, Hossain MZ, Ahmed S, Gow J, Biddle SJ
Received 29 April 2021
Accepted for publication 7 August 2021
Published 7 September 2021 Volume 2021:13 Pages 777—788
DOI https://doi.org/10.2147/CEOR.S318094
Checked for plagiarism Yes
Review by Single anonymous peer review
Peer reviewer comments 2
Editor who approved publication: Prof. Dr. Dean Smith
Syed Afroz Keramat,1– 3 Khorshed Alam,1,3 Bright Opoku Ahinkorah,4 Md Sariful Islam,2 Md Irteja Islam,1,3 Md Zobayer Hossain,5 Sazia Ahmed,2 Jeff Gow,1,6 Stuart JH Biddle3
1School of Business, University of Southern Queensland, Toowoomba, QLD, 4350, Australia; 2Economics Discipline, Social Science School, Khulna University, Khulna, 9208, Bangladesh; 3Centre for Health Research, University of Southern Queensland, Toowoomba, QLD, 4350, Australia; 4School of Public Health, University of Technology Sydney, Sydney, Australia; 5Development Studies Discipline, Social Science School, Khulna University, Khulna, 9208, Bangladesh; 6School of Accounting, Economics, and Finance, University of KwaZulu-Natal, Durban, 4000, South Africa
Correspondence: Syed Afroz Keramat Email [email protected]
Background: Both obesity and disability have been widely recognised as major public health challenges because they play significant roles in determining self-perceived general and mental health. Longitudinal studies of the relationship between obesity and disability with self-reported health outcomes are scarce. Therefore, the objective of the present study is to examine the relationship between obesity and disability with self-perceived general and mental health among Australian adults aged 15 years and above.
Methods: Data were extracted from the most recent 14 waves (waves 6 through 19) of the annual individual person dataset of the Household, Income and Labour Dynamics in Australia (HILDA) survey. The longitudinal random-effects logistic regression model was adopted to investigate the relationships between obesity and disability with self-reported health outcomes.
Results: The results revealed that obese individuals and adults with some form of disability are more likely to report poor or fair general and mental health. The odds of self-reporting poor or fair general health were 2.40 and 6.07 times higher among obese (aOR: 2.40, 95% CI: 2.22– 2.58) and adults with some form of disability (aOR: 6.07, 95% CI: 5.77– 6.39), respectively, relative to adults with healthy weight and those without disability . The results also showed that self-rated poor or fair mental health were 1.22 and 2.40 times higher among obese adults (aOR: 1.22, 95% CI: 1.15– 1.30) and adults with disability (aOR: 2.40, 95% CI: 2.30– 2.51), respectively, compared to their healthy weight peers and peers without disability.
Conclusion: As governmental and non-governmental organisations seek to improve the community’s physical and mental well-being, these organisations need to pay particular attention to routine health care prevention, specific interventions, and treatment practices, especially for obese and/or people with disabilities.
Keywords: Australia, disability, mental health, obesity, self-perceived general health
Introduction
Globally, the total number of obese women and men increased from 5 million in 1975 to 50 million in 2016, and from 6 million in 1975 to 74 million in 2016, respectively.1 This sharp rise in obesity is considered alarming as overweight and obesity were attributable to 4.7 million global deaths in 2017.2 The Global Burden of Disease Study estimated that 147.7 million disability-adjusted life years (DALYs) of non-communicable diseases (NCDs) were accounted for by individuals with a high body mass index (BMI) in 2017. The study also projected that the DALYs of NCDs related to high BMI would be increased to 176.9 million by 2025.2 Another recent global burden of disease study found that the burden of global deaths and DALYs related to high BMI has been doubled for both genders in the years between 1990 and 2017.3
The World Health Organization (WHO) estimated that up to 190 million people worldwide aged above 15-years experience some form of disability.4 Likewise, the number of people affected by different NCDs has increased substantially. In 2016, it was estimated that about 72% of global deaths were due to NCDs, compared with 57% in 1990.5 According to the latest National Health Surveys, 67% of Australian adults (aged more than 18 years) were either overweight or obese, and around 18% have some form of disability.6,7 A recent study also found that the overall prevalence of overweight and obesity among Australian adults (aged 15 years and over) climbed significantly from 55% to 60% between 2006 and 2019.8 Besides, the prevalence of disability in Australian adults has risen from 26% (2006) to 29% (2019).9 Furthermore, 47% of Australian adults have at least one of ten identified chronic diseases such as arthritis, asthma, cancer, cardiovascular disease, diabetes mellitus or mental health disorders, contributing to nearly 9 out of 10 national deaths in 2018.7 In the Global Action Plan for the Prevention and Control of NCDs 2013–2020, the WHO has targeted reducing NCD induced premature mortality by 25% by 2025.10 To achieve this goal, reducing individual and community level exposure to NCDs’ modifiable risk factors, such as overweight/obesity and disability, is essential.2
Obesity has several adverse health consequences, including poorer mental health outcomes, impairment of quality of life, reduced life expectancy, and poorer sexual health.11–14 One study found that higher BMI is associated with lower expected survival and is responsible for approximately 95 million years‐of‐life‐lost.12 Other studies have shown that obesity is a significant risk factor for increased morbidity and mortality linked to chronic diseases, including cardiovascular diseases (CVDs), diabetes, cancer, osteoarthritis, liver and kidney disease, sleep apnea, and depression.15,16 There is also evidence that obesity is associated with mental distress.17 Like obesity, people with disabilities experience health‐related problems such as compromised functional ability, pain or fatigue, and inactivity. Moreover, persons with disability often have restrictions in participating in work and intimate relationships and may perceive poor health-related quality of life.18
Obesity is associated with higher likelihood of disability in Australian adults.9 Due to the extent of obesity and disability among Australians, it is warranted to understand the role of obesity and disability in determining the self-perceived general and mental health status of adults in the country. Previous studies have not incorporated both self-perceived general health and mental health status while determining its relationships with obesity and disability. Further, earlier studies have been mainly cross-sectional, and focused primarily on identifying the direct and indirect burden of obesity. This situation constitutes a significant literature gap. Therefore, this study investigates the relationship between obesity and disability with self-perceived general health and mental health status following a retrospective longitudinal study design.
Methods
Data Source
The data for the present analyses were extracted from the individual person datasets of the Household, Income and Labour Dynamics in Australia (HILDA) survey. The HILDA survey is a nationally representative large-scale panel study that collects detailed information on individual characteristics, social, economic and personal well-being, labour market activities, family life, and health status. The survey was commenced in 2001, and since then, has collected data every year from household members aged 15 years and over through face-to-face interviews, telephone interviews by trained interviewers and self-completed questionnaires (SCQ), following the University of Melbourne’s ethical guidelines. The sampling unit in the HILDA survey is the household, wherein adult household members are tracked each year. The study samples were generated following the multi-stage sampling design. The methodology utilised in the HILDA survey to select the sample and collect data has been outlined elsewhere.19
Analytic Sample and Missing Data
This present study followed a retrospective longitudinal research design and analysed data utilising the most recent 14 waves (waves 6 through 19) of the HILDA survey spanning from 2006 to 2019. The principal reason for selecting these waves is that data on the key variable of interest (body mass index) is available only in these waves. Figure 1 displays the process of obtaining the analytic sample. The final analytic sample is restricted to those respondents with no missing information on the key outcome (self-assessed health and mental health) and primary exposure (BMI and disability) variables. Within the eligible participants, it is noted that 1.91% of persons had missing information on mental health, BMI or disability and were therefore excluded (Figure 1). The final sample comprises of 186,723 yearly observations from 26,104 unique participants.
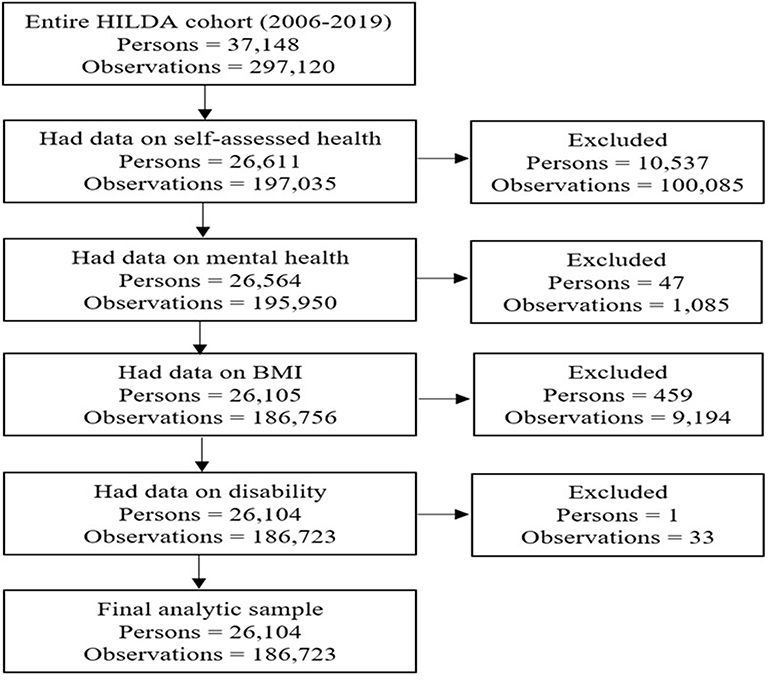 |
Figure 1 Flow chart of sample selection and missing data. |
Outcome Variables
This study’s primary outcome variable is health outcome, operationally defined as self-assessed general and mental health. These variables were derived from the HILDA survey, which accumulates a wide range of individual-level health-related data, including self-reported health status and mental condition. The HILDA survey captures the respondents’ self-reported health status by asking, “In general, would you say your health is?” The responses were coded on 1 to 5 scale: excellent (1), very good (2), good (3), fair (4), and poor (5). This study further dichotomised this measure into good or better health (excellent, very good and good) and poor or fair health (poor and fair) following a previous study.20
Mental health in the HILDA survey was assessed in every wave through the five-item mental health inventory (MHI-5) scale, one of the eight dimensions of the short form 36 (SF-36) health survey. The MHI-5 scale includes five items asking the respondents how often they have been nervous, felt downhearted, felt calm and peaceful, felt so down in the dumps that nothing could cheer them up, and been happy, in the past four weeks.21 The responses to each item were on a 1 to 6 scale, wherein 1, 2, 3, 4, 5 and 6 represent “all of the time”, “most of the time”, “a good bit of the time”, “some of the time”, “a little of the time”, and “none of the time”, respectively. The sum of all responses across each item lies between scores of 5 to 30. This score was further rescaled into a 0 to 100 mental health score by subtracting five and multiplying by four. The lowest score 0 represents “worst possible mental health”, and 100 represents “best possible mental health”. To define a person mental health state, this study collapsed the MHI-5 score into two levels: good or better mental health (equal or above 60 MHI-5 scores) and poor or fair mental health (below 60 MHI-5 scores) following an established cut-off point.22
Exposure Variables
The key explanatory variables of interest in this study were obesity (measured through BMI) and disability. The HILDA survey calculates the respondent’s BMI by utilising their self-reported weight and height following the formula weight (in kilograms) divided by height (in metres) square. This study collapsed BMI into four levels following the World Health Organization (WHO) guidelines: underweight (BMI <18.50), healthy weight (BMI 18.50 to 24.99), overweight (BMI 25 to <30), and obese (BMI ≥ 30.00).1
The HILDA survey collects information on the disability status of the participants in every wave through personal interviews following the International Classification of Functioning, Disability and Health (ICF) under the WHO framework guidelines.9,23–26 Disability status was assessed using the question,
Do you have any long-term health conditions, impairment or disability that restricts your everyday activities, and has lasted or are likely to last for six months or more?
To define a person’s disability status, the survey provided 17 categories of disabilities, such as hearing problems, speech problems, difficulty in learning or understanding things, limited use of arms or fingers, and limited use of feet or legs to check if they have any of these conditions. The responses were coded as yes or no. Participants who replied “yes” to the question mentioned above were defined as individuals with long-term health problems or disability.
Covariates
This study included a range of covariates based on previous literature and information available in the HILDA dataset to account for potential confounders in the multivariable regression models.20,27,28 The covariates included age, gender, civil status, education, equivalized household income, labour force status, indigenous status, location, smoking status, alcohol consumption, and physical activity.
The variable age was initially collected as a continuous variable, but was re-categorised in this study into four groups: <30, 30 to 44, 45 to 59, and 60 and over years. Gender is a dichotomous variable (male and female). Respondents’ civil status was reported in six categories; however, this was collapsed into two categories: cohabitating (married, and never married but living with someone in a relationship) and non-cohabitating (separated but not divorced, divorced, widowed, and never married and not living with someone in a relationship). The respondents’ education status comprises seven categories: postgraduate- masters or doctorate, graduate diploma or certificate, bachelor or honours, advance diploma or diploma, certificate III or IV, year 12, and Year 11 and below. For the present statistical analysis, this was collapsed into three categories: year 12 and below (year 12, and Year 11 and below), professional qualifications (advance diploma or diploma, and certificate III or IV) and university qualifications (postgraduate—masters or doctorate, graduate diploma or certificate, bachelor or honours). The construction of the studied variables is straightforward except for household yearly disposable income. The income variable was converted into equivalised household disposable income through the “modified OECD” equivalence scale. The formula for measuring equivalised household income is as follows.

This study further categorised equivalised household income into quintiles (quintiles 1 and 5, indicating the lowest and highest family income quintiles, respectively).
Respondents current labour force status was categorised into three levels (employed, unemployed and not in the labour force). Indigenous status was classified as non-indigenous, and Aboriginal/Torres Strait Islander (ATSI) or both. The location included in the HILDA survey was categorised into five groups, but this study coded it into three levels: major city, regional (inner and outer regional) and remote (remote and very remote). For the present study, a summary measure with smoking status (never smoke, a former smoker and current smoker), alcohol consumption (non-drinker, ex-drinker, only rarely to 3 days/week and 3+ days/week), physical activity (not at all to <1/week, 1–3 times/week and ≥ 4 times/week) were coded.
Analytic Strategy
The characteristics of the study sample were outlined using descriptive statistics of frequency (n) and percentages (%) with 95% confidence intervals (CIs). A two-step modelling approach (bivariate and multivariable regression) was employed to identify the relationships between obesity and disability with health outcomes. A confounder was included in the fully adjusted model only when it was found significant at 5% or less risk level in the bivariate analyses. Four separate regression models were fitted to test the relationships between obesity and disability with self-perceived health outcomes. Models 1 and 3 display the results obtained from bivariate regression. In Models 2 and 4, self-reported health (Model 2) and mental health status (Model 4) were regressed by obesity and disability adjusting for confounders.
This study fitted the random-effects longitudinal regression model to check the association between self-perceived health outcomes (self-assessed health and mental health condition) and obesity and disability. The random-effects regression model is often applied to longitudinal data to measure the effects of variables that change over time (eg, obesity and disability) and the fixed characteristics of an individual (eg, gender). This model provides an estimate of between-person effects. The key assumption of the random-effects model is that the variation between individuals is supposed to be random and not associated with the covariates included in the model.
The current analyses reported the multivariable regression results through adjusted odds ratios (aORs) with 95% CIs. This study evaluated all multivariable models at a 95% significance level (P < 0.05). All statistical analyses were carried out using Stata v16.
Results
Table 1 displays the pooled characteristics of the study participants, as well as their first and last, contributed waves. It reports self-assessed general health, self-rated mental health, obesity, and disability status of Australian adults, along with socio-economic and lifestyle characteristics of the 186,723 person-year observations. The proportion of reporting poor or fair general health (ranged from nearly 17% to 18%) and mental health (ranged from approximately 22% to 25%) was similar at baseline, final, and pooled in all waves. Table 1 also demonstrates that almost 21% to 27% of participants were obese and about 26% to 29% have some form of disability at baseline, final, and pooled in all waves. Of the total, there was an equal distribution in all age groups, more than half were female (53%), almost 40% were non-cohabitating, approximately one-fourth had university qualifications (25%), nearly two-thirds were employed (64%), most were not of indigenous origin (97%), lived in major cities (66%), 18% were current smokers, 27% drunk alcohol over three days a week, and 27% did not perform physical activity (pooled in all waves).
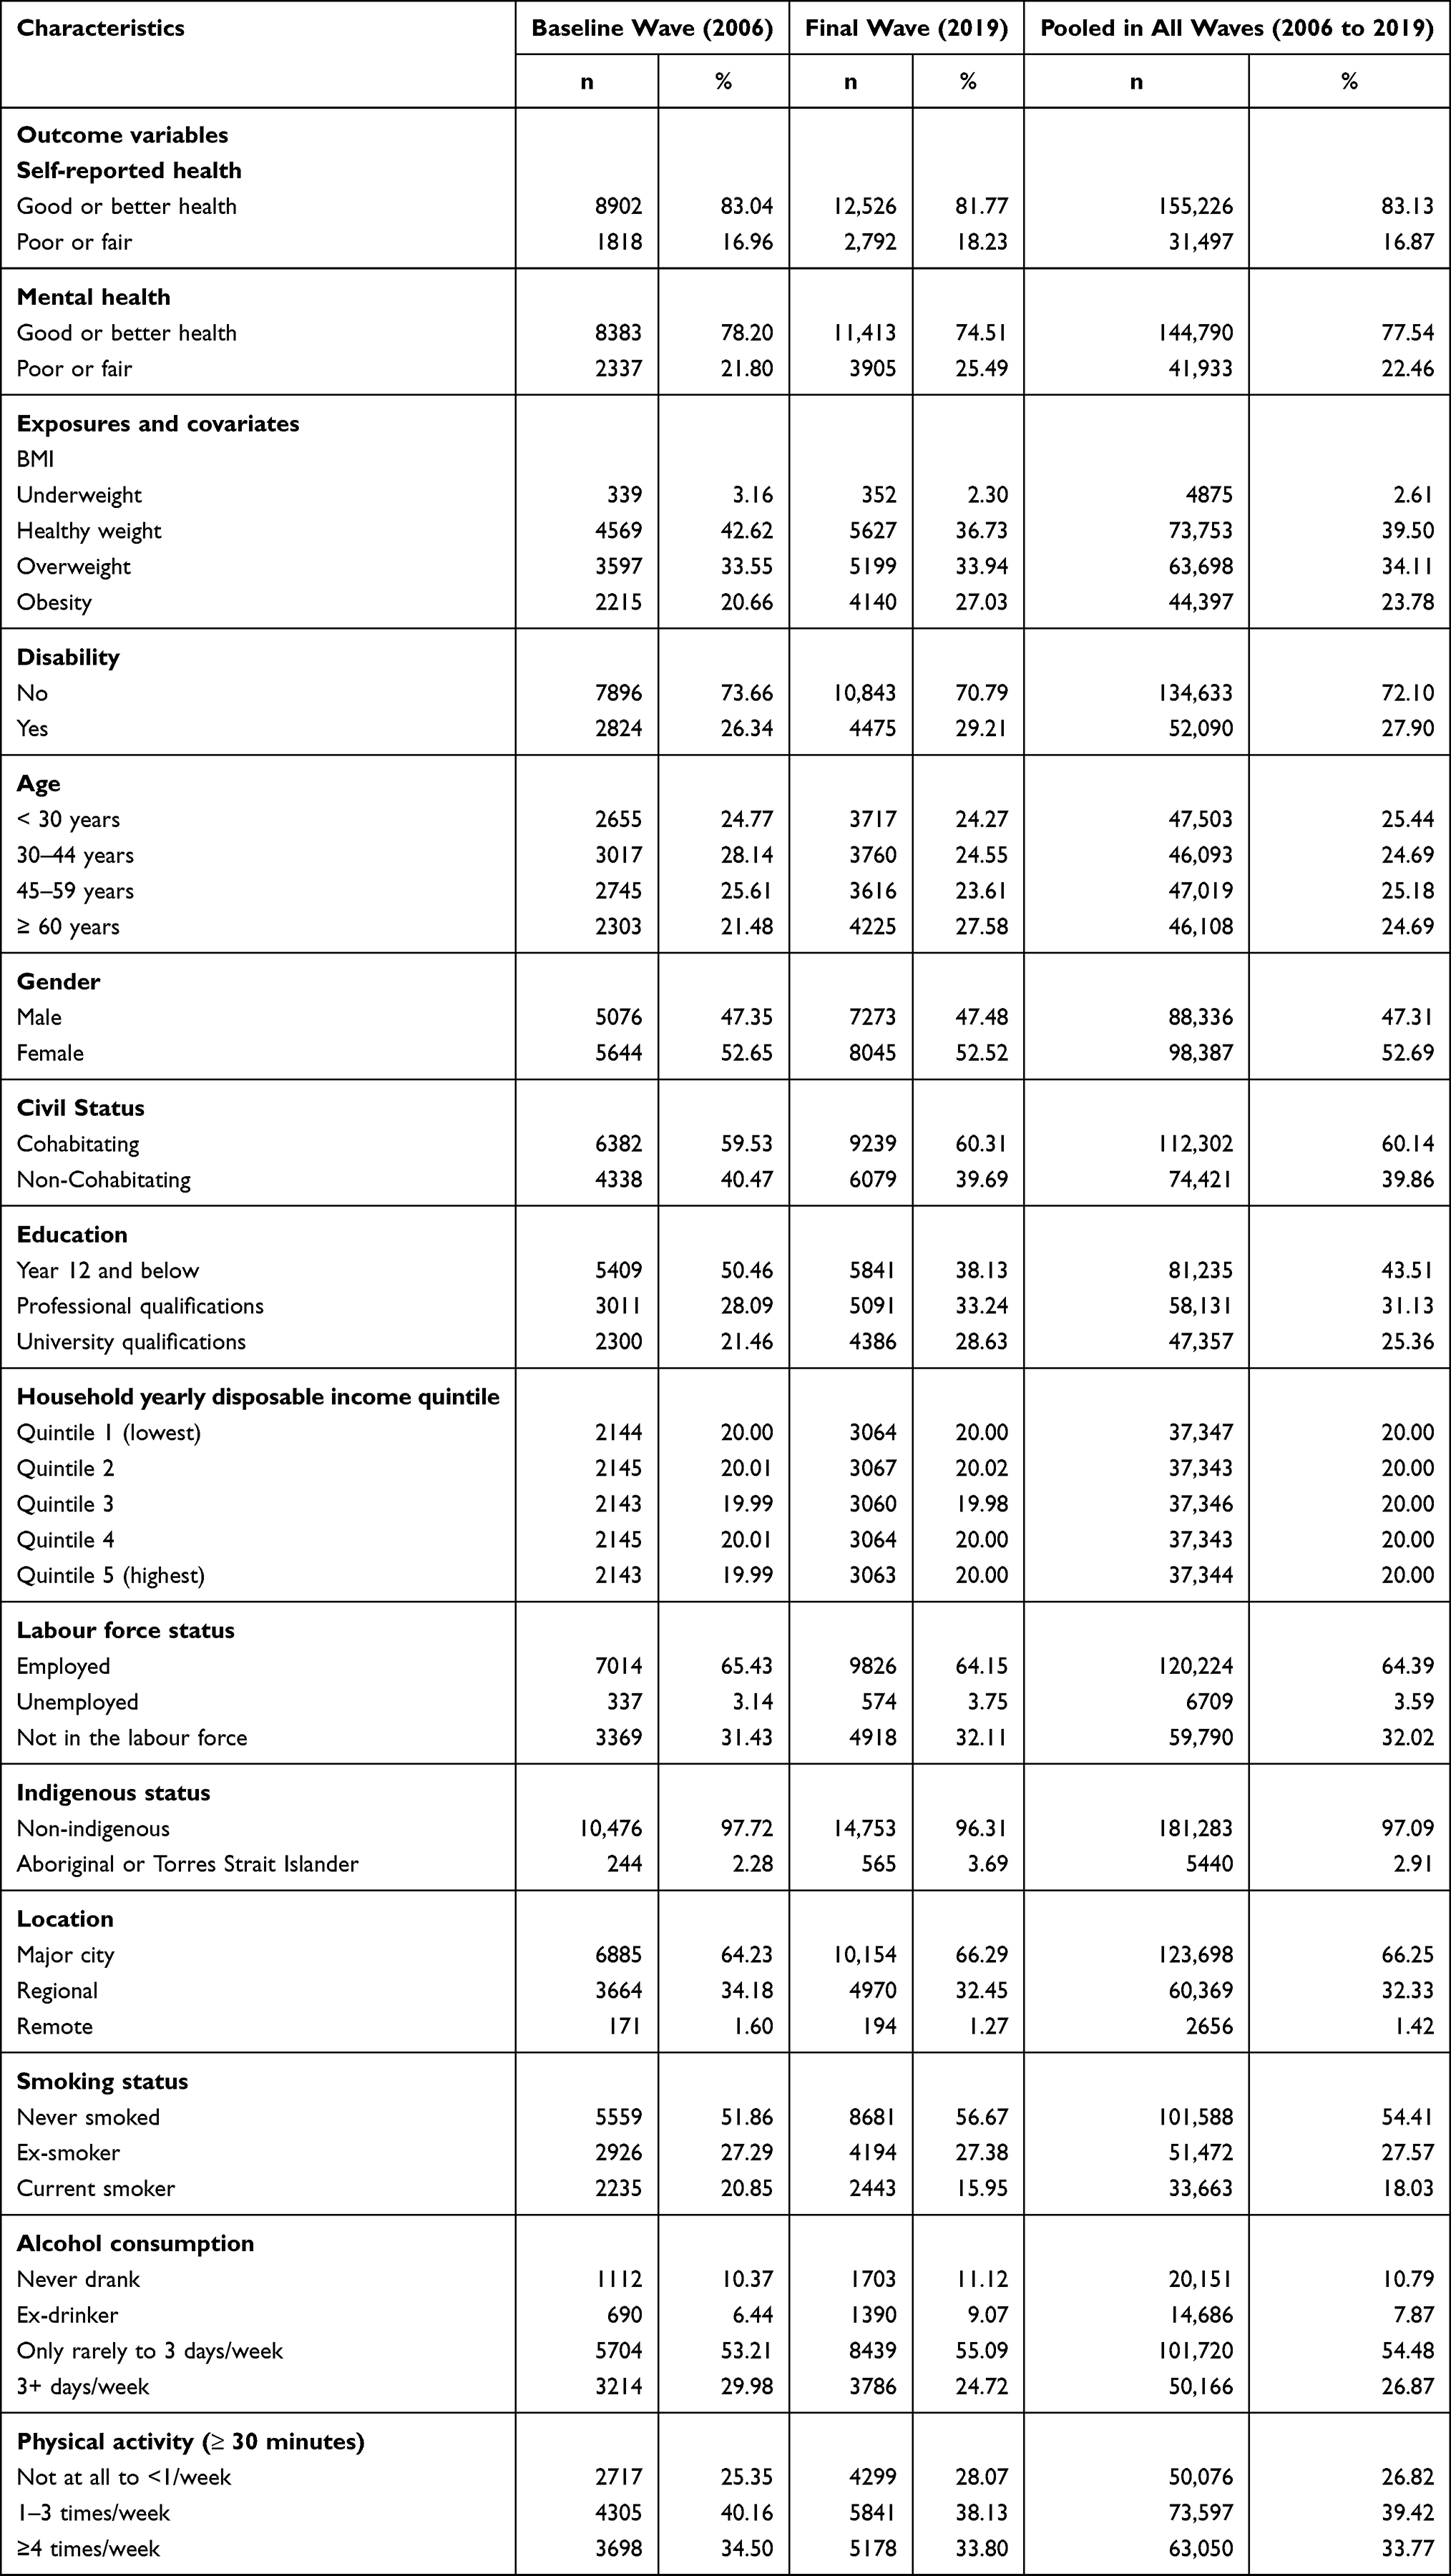 |
Table 1 Distribution of the Analytic Sample: Baseline, Final, and Pooled Across All Waves (Persons = 26,104, Observations = 186,723) |
Table 2 shows the prevalence of self-reported poor or fair health and mental health status by age and gender at four different time points (2006, 2011, 2015 and 2019). The results show that self-reported poor or fair health prevalence increased with ageing and was higher among females. For example, in 2019, the prevalence of poor or fair health among females aged < 30 and over 60 years were nearly 11% and 31%, respectively. However, poor or fair mental health prevalence was found highest amongst young females than their older counterparts. For example, in 2019, the highest and lowest prevalence of poor or fair mental health among females aged < 30 and over 60 years were 37% and 22%, respectively.
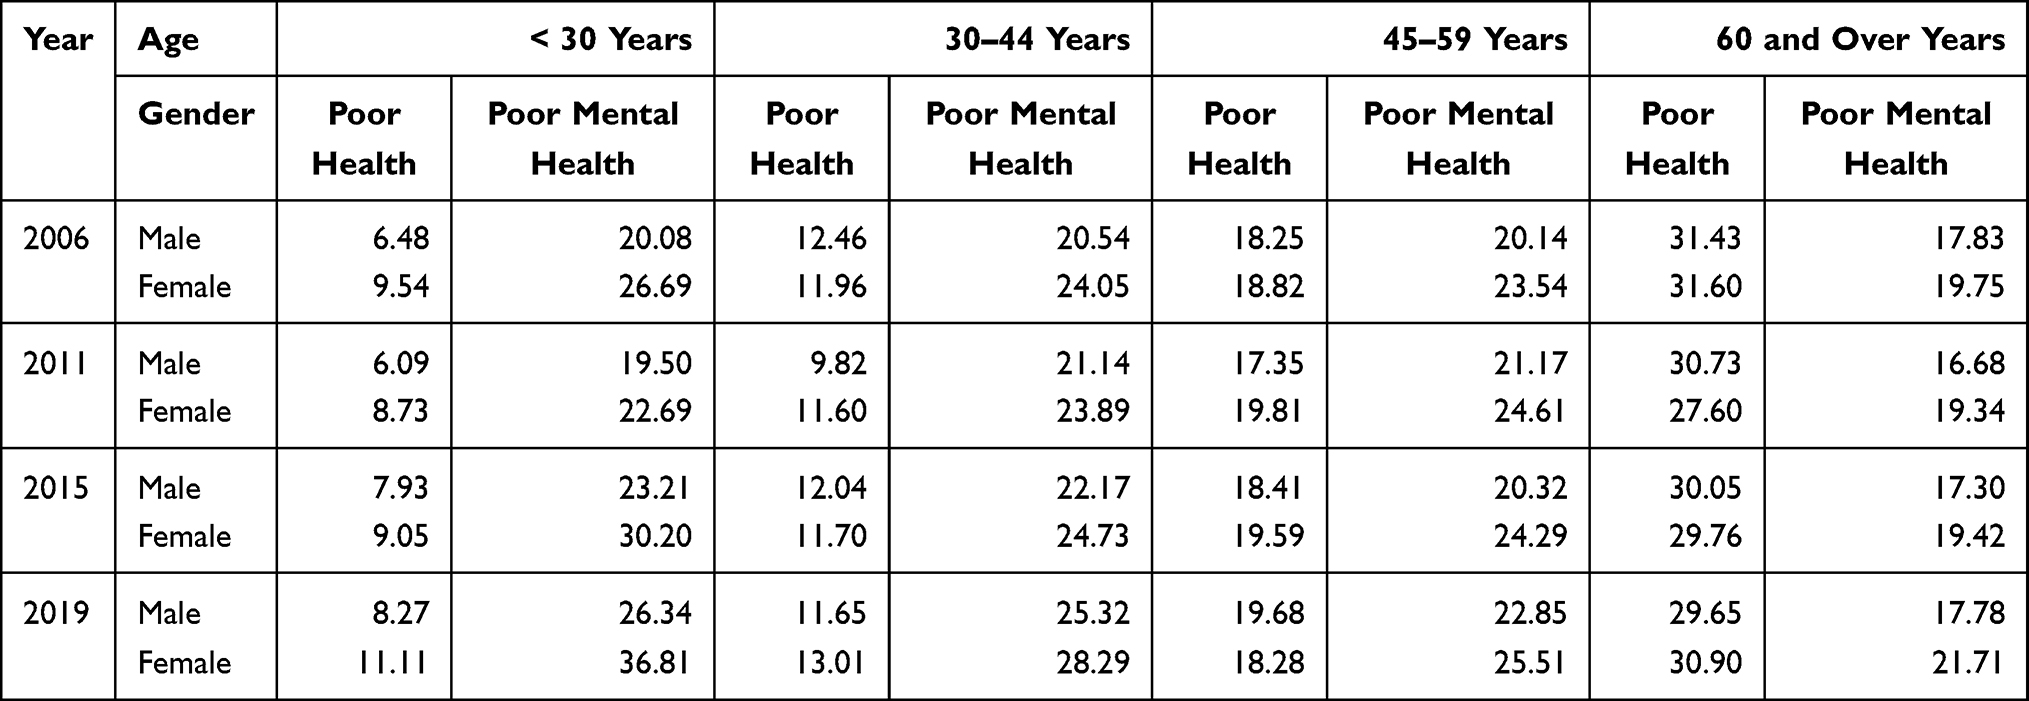 |
Table 2 Self-Perceived Poor or Fair Health Outcomes by Age and Gender at Four Different Periods |
The study participants’ distribution of self-reported fair or poor health and mental health by weight status is displayed in Figure 2. The highest prevalence of self-reported poor or fair health was recorded in obese individuals (27.71%). The figure also shows that over one-fourth of the obese adults (27.18%) had poor or fair mental health.
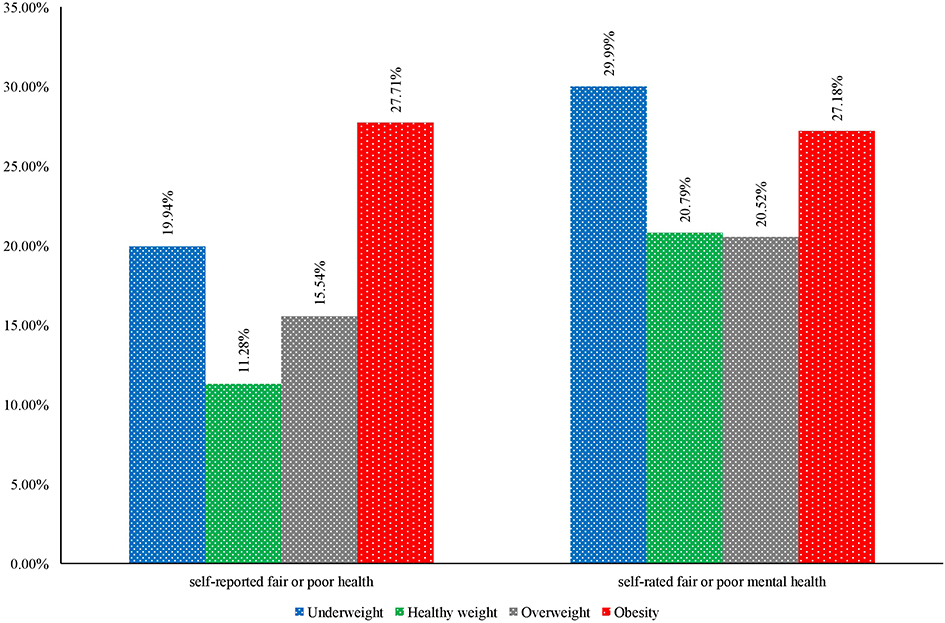 |
Figure 2 Distribution of the self-assessed fair or poor health outcomes by weight status, 26,104 persons, 186,723 observations, 2006 to 2019. |
Figure 3 presents the distribution of self-assessed poor or fair health and mental health status among the study participants according to their disability status. The prevalence of both self-reported poor or fair health and mental health were found highest among participants with some forms of disability. Over one-third of the adults with a disability (43%) reported poor or fair health (Figure 3). The figure also depicts that self-reported poor or fair mental health among adults with a disability was 36%.
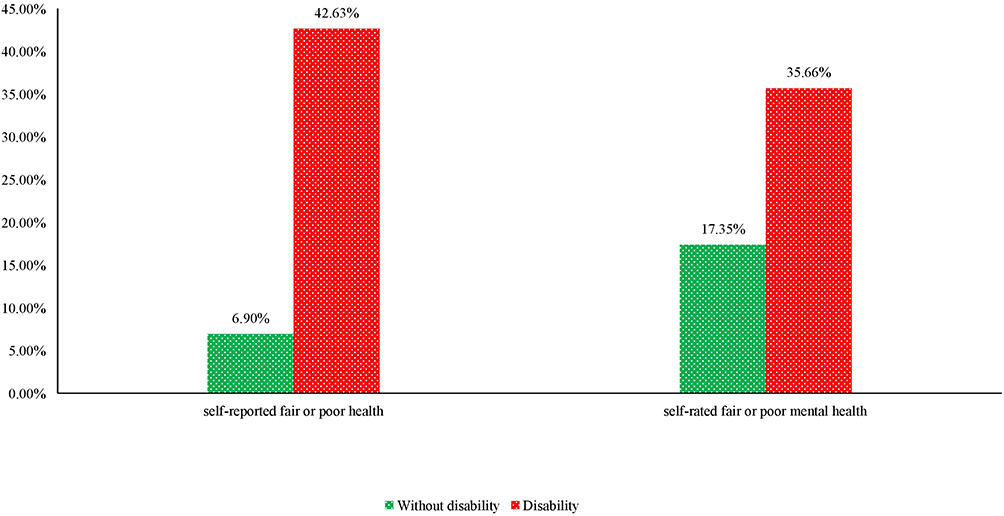 |
Figure 3 Distribution of the self-assessed fair or poor health outcomes by disability status, 26,104 persons, 186,723 observations, 2006 to 2019. |
Table 3 reports the statistical association between obesity and disability with health outcomes derived from bivariate and multivariable random-effects regression models. The bivariate regression results showed that being obese (OR: 3.36, 95% CI: 3.11–3.63) and having a disability (OR: 8.79, 95% CI: 8.35–9.25) were associated with higher odds of reporting poor or fair health (Model 1). The bivariate association also indicates that the odds of self-reported fair or poor mental health were 1.32 and 2.47 times higher among obese adults (OR: 1.32, 95% CI: 1.24–1.41) and adults with disability (OR: 2.47, 95% CI: 2.36–2.58) (Model 3).
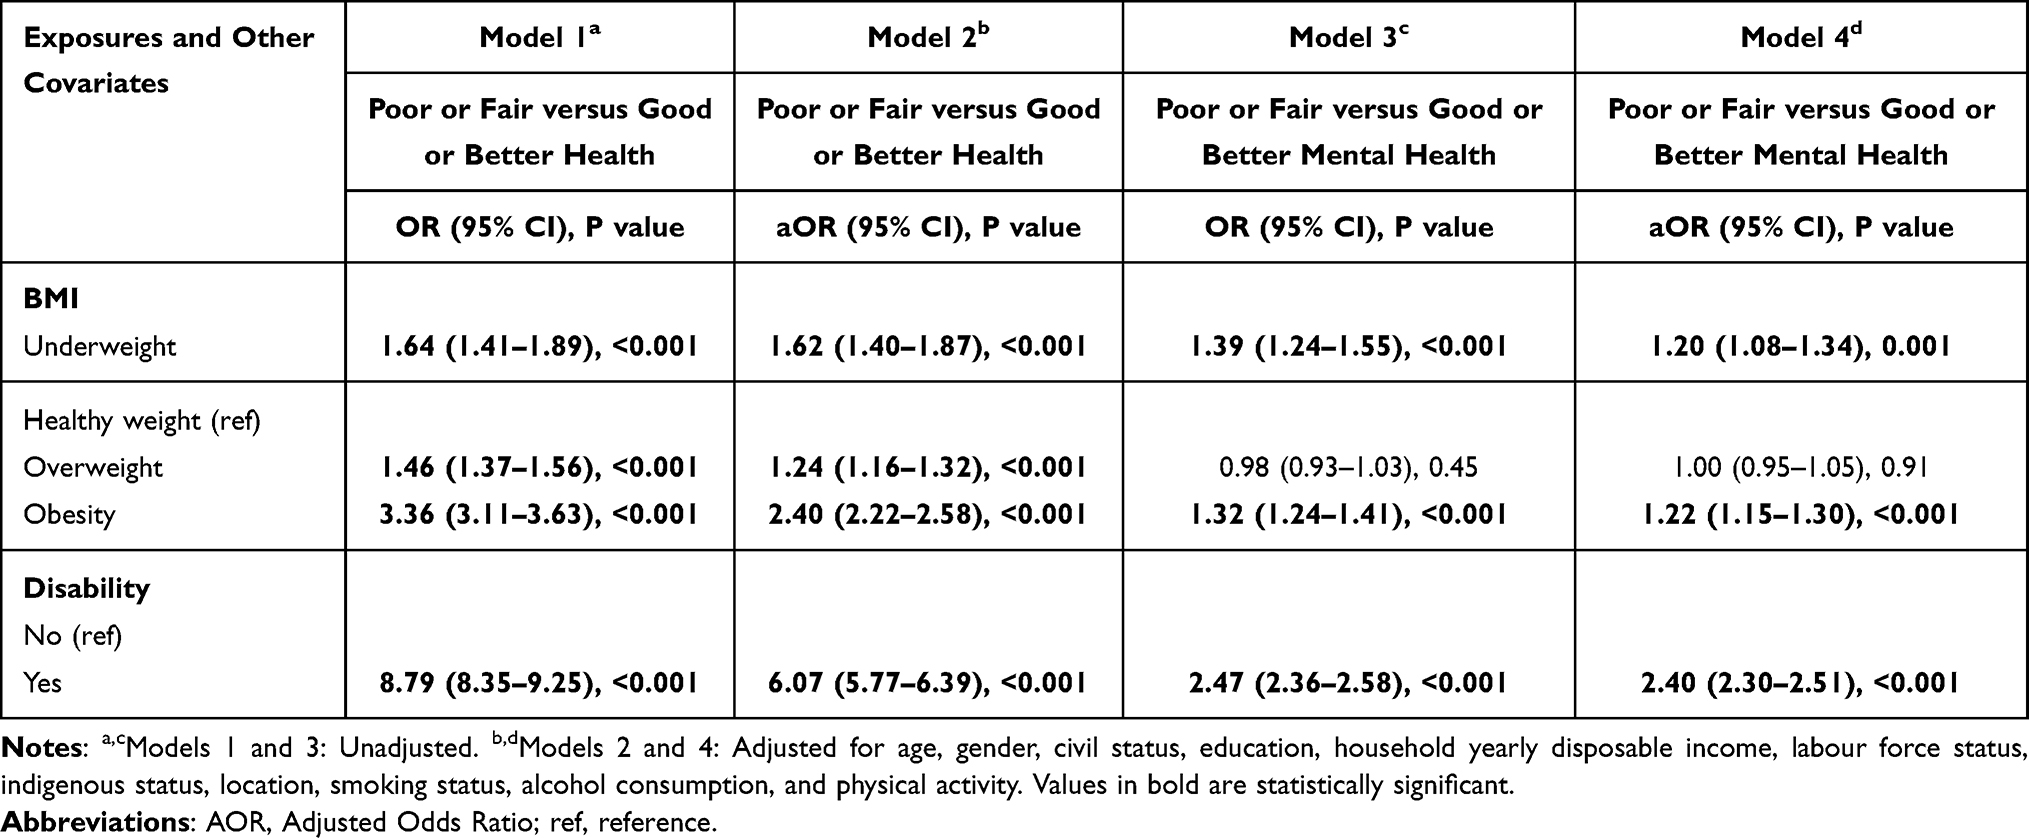 |
Table 3 Unadjusted and Adjusted Random-Effect Regression Results for the Between-Person Difference in Self-Perceived Health Outcomes Due to Obesity and Disability, 26,104 Persons, 186,723 Observations, 2006 to 2019 |
The multivariable models explored the association between health outcomes with obesity and disability after adjusting for confounders (Models 2 and 4). The odds of self-reporting poor or fair health were 2.40 and 6.07 times higher among obese (aOR: 2.40, 95% CI: 2.22–2.58) and adults with disability (aOR: 6.07, 95% CI: 5.77–6.39) relative to those with healthy weight and those without disability, respectively (Model 2). Similar results were also observed for self-rated poor mental health status revealed from the multivariable Model 4. The probability of self-reporting poor or fair mental health were 1.22 and 2.40 times higher among obese adults (aOR: 1.22, 95% CI: 1.15–1.30) and adults with a disability (aOR: 2.40, 95% CI: 2.30–2.51) compared to those with healthy weight and those without disability, respectively.
Discussion
This study investigated the association between obesity and disability with self-reported health outcomes among Australian adults from 2006 to 2019. Among Australian adults, around 24% were obese, and almost 28% suffered from some form of disability. The study also found that 17% of Australian adults reported poor or fair general health and 23% had poor or fair mental health. This study revealed two significant findings. Firstly, the present analysis showed that obesity is significantly associated with self-rated poor general and mental health status. This finding is supported by evidence that a statistically significant association exists between obesity and poor health outcomes.27–32 However, few studies revealed a weak association between obesity and self-reported poor health.33,34 The possible reason might be that obese adults were more susceptible to comorbid chronic diseases that made themselves rate their health less positively. Besides, obese adults may have higher exposure to the healthcare system that rationally enables them to assess their health.35 Additionally, the growing stigma associated with obesity worldwide may cause ill-feeling towards obese respondents resulting in self-reported poor mental health.36
Secondly, the present study found that adults with a disability were more likely to report elevated poor self-rated general and mental health than adults without a disability. This finding is consistent with previous studies that show disability is consistently associated with increased poorer general and mental health status.20,37,38 There were several dimensions found in the literature that compelled disabled adults to report poor health status. For example, the social function dimension of disabilities was found to be a significant determinant of poor self-rated health conditions among heart failure patients.39 Besides, evidence shows that the physical ability dimension is associated with elevated poor physical health among people with spinal cord injury.40 Further, depression and embarrassment were the crucial dimensions of disabilities that caused self-reporting of elevated poor mental health.41 Furthermore, the mobility dimension contributed to the lower self-rated general and mental health conditions.42,43 Moreover, family burden and stigma dimensions have been significantly associated with poor self-rated health status.38
This study’s findings provide several policy insights for improving Australian adults’ perceptions toward achieving better health status. For instance, employment in old age and promoting healthy behaviours might be suitable interventions to reduce self-reported poor health among obese people.44 Interventions for reducing the dimension-specific burden might be helpful to improve health status. For example, there is evidence that physical exercise-related therapeutic interventions in breast cancer survivors increased their physical mobility and resulted in better self-rated health.45 Moreover, therapeutic interventions for combating disability induced stigma and family burden dimensions were found to be effective for improving self-reported physical and mental health.38,41
This study features several important innovations. First, to the best of the authors’ knowledge, this is the first study that examined the longitudinal association between obesity and disability with self-perceived general and mental health in the Australian context by pooling a nationally representative 14-year long data set of adults. Second, the study included many confounding variables, such as health risk behaviour (ie, smoking status, alcohol consumption, and physical activity) to avoid spurious association. Third, this study used longitudinal random-effects regression model to capture the differences in self-perceived health outcomes between individuals associated with obesity and disability.
Despite having these strengths, this study also has some limitations. First, this study used self-reported data, which might result in self-reported bias and consequentially over/underestimate the study’s findings. Further, the study used existing measures from the HILDA study and could not include variables that might be more relevant to estimate self-reported general and mental health in adults. Lastly, the unbalanced longitudinal study design restricts interpreting direct causal associations between outcomes and the main variables of interest.
Conclusion
The present study revealed that almost 17% of Australian adults reported poor or fair general health, and nearly 23% reported poor or fair mental health. The study also revealed that both obesity and disability were strongly associated with self-reported poor health outcomes. Unsurprisingly, the current study indicated that obese adults with a disability were more likely to report poor general and mental health outcomes compared to adults with healthy weight and those without disability, respectively. Exploring the longitudinal association between obesity and disability with health outcomes might help policymakers improve the community’s physical and mental well-being. This study suggests that routine health care prevention, specific intervention and treatment practices need to pay particular attention to obese adults and adults with some form of disability.
Abbreviations
AOR, Adjusted Odds Ratio; BMI, Body Mass Index; HILDA, Household, Income and Labour Dynamics in Australia Survey; MHI-5, Mental Health Inventory-5; SF-36, 36-Item Short-Form Health Survey; WHO, World Health Organization.
Data Sharing Statement
The data used for the study was collected from the Melbourne Institute of Applied Economic and Social Research. There are some restrictions on this data, and it is not available to the public. Those interested in accessing this data should contact the Melbourne Institute of Applied Economic and Social Research, The University of Melbourne, VIC 3010, Australia.
Ethics Approval
This paper uses unit record data from the Household, Income and Labour Dynamics in Australia Survey (HILDA) conducted by the Australian Government Department of Social Services (DSS). However, the findings and views reported in this paper are those of the authors and should not be attributed to the Australian Government, DSS, or any of DSS contractors or partners. DOI: 10.26193/OFRKRH, ADA Dataverse, V2. This study did not require ethical approval as the analysis used only de-identified existing unit record data from the HILDA survey. However, the authors completed and signed the Confidentiality Deed Poll and sent it to NCLD ([email protected]) and ADA ([email protected]) before the data applications’ approval. Therefore, the datasets analysed and/or generated during the current study are subject to the signed confidentiality deed.
Author Contributions
All authors made a significant contribution to the work reported, whether that is in the conception, study design, execution, acquisition of data, analysis and interpretation, or in all these areas; took part in drafting, revising or critically reviewing the article; gave final approval of the version to be published; have agreed on the journal to which the article has been submitted; and agree to be accountable for all aspects of the work.
Funding
This research did not receive any specific grant from funding agencies in the public, commercial or not-for-profit sectors.
Disclosure
The authors declare that they have no conflicts of interest in this work.
References
1. World Health Organization. Obesity and overweight; 2020. Available from: https://www.who.int/news-room/fact-sheets/detail/obesity-and-overweight.
2. Lin X, Xu Y, Xu J, et al. Global burden of noncommunicable disease attributable to high body mass index in 195 countries and territories, 1990–2017. Endocrine. 2020;69(2):310–320. doi:10.1007/s12020-020-02352-y
3. Dai H, Alsalhe TA, Chalghaf N, Riccò M, Bragazzi NL, Wu J. The global burden of disease attributable to high body mass index in 195 countries and territories, 1990–2017: an analysis of the Global Burden of Disease Study. Wareham NJ, ed. PLOS Med. 2020;17(7):e1003198. doi:10.1371/journal.pmed.1003198
4. World Health Organization. Disability and health; 2018. Available from: https://www.who.int/news-room/fact-sheets/detail/disability-and-health.
5. Naghavi M, Abajobir AA, Abbafati C, et al. Global, regional, and national age-sex specific mortality for 264 causes of death, 1980–2016: a systematic analysis for the Global Burden of Disease Study 2016. Lancet. 2017;390(10100):1151–1210. doi:10.1016/S0140-6736(17)32152-9
6. Australian Institute of Health and Welfare. People with disability in Australia 2019: in brief; 2019. Available from: https://www.aihw.gov.au/reports/disability/people-with-disability-in-australia/summary.
7. Australian Institute of Health and Welfare. Australia’s Health 2018; 2018. Available from: www.aihw.gov.au.
8. Keramat SA, Alam K, Al-Hanawi MK, Gow J, Biddle SJH, Hashmi R. Trends in the prevalence of adult overweight and obesity in Australia, and its association with geographic remoteness. Sci Rep. 2021;11(1):11320. doi:10.1038/s41598-021-90750-1
9. Keramat SA, Alam K, Sathi NJ, Gow J, Biddle SJH, Al-Hanawi MK. Self-reported disability and its association with obesity and physical activity in Australian adults: results from a longitudinal study. SSM Popul Health. 2021;14:100765. doi:10.1016/j.ssmph.2021.100765
10. World Health Organization. Global Action Plan for the Prevention and Control of Noncommunicable Diseases 2013–2020; 2013.
11. Vidra N, Trias-Llimós S, Janssen F. Impact of obesity on life expectancy among different European countries: secondary analysis of population-level data over the 1975–2012 period. BMJ Open. 2019;9(7):e028086. doi:10.1136/bmjopen-2018-028086
12. Finkelstein EA, Brown DS, Wrage LA, Allaire BT, Hoerger TJ. Individual and aggregate years-of-life-lost associated with overweight and obesity. Obesity. 2010;18(2):333–339. doi:10.1038/oby.2009.253
13. Kaneshiro B, Jensen JT, Carlson NE, Harvey SM, Nichols MD, Edelman AB. Body mass index and sexual behavior. Obstet Gynecol. 2008;112(3):586–592. doi:10.1097/AOG.0b013e31818425ec
14. Centers for Disease Control and Prevention. Adult obesity causes & consequences; 2017. Available from: https://www.cdc.gov/obesity/adult/causes.html.
15. Pi-Sunyer X. The medical risks of obesity. Postgrad Med. 2009;121(6):21–33. doi:10.3810/pgm.2009.11.2074
16. Hruby A, Hu FB. The epidemiology of obesity: a big picture. Pharmacoeconomics. 2015;33(7):673–689. doi:10.1007/s40273-014-0243-x
17. Wimmelmann CL, Lund R, Christensen U, Osler M, Mortensen EL. Associations between obesity and mental distress in late midlife: results from a large Danish community sample. BMC Obes. 2016;3(1):54. doi:10.1186/s40608-016-0137-x
18. Roebroeck ME, Jahnsen R, Carona C, Kent RM, Chamberlain MA. Adult outcomes and lifespan issues for people with childhood-onset physical disability. Dev Med Child Neurol. 2009;51(8):670–678. doi:10.1111/j.1469-8749.2009.03322.x
19. Freidin S, Watson N, Wooden M. Household, Income and Labour Dynamics in Australia (HILDA) Survey: Wave 1. 2002.
20. Brucker DL. The association of food insecurity with health outcomes for adults with disabilities. Disabil Health J. 2017;10(2):286–293. doi:10.1016/j.dhjo.2016.12.006
21. Hashmi R, Alam K, Gow J. Socioeconomic inequalities in mental health in Australia: explaining life shock exposure. Health Policy. 2020;124(1):97–105. doi:10.1016/j.healthpol.2019.10.011
22. Kelly MJ, Dunstan FD, Lloyd K, Fone DL. Evaluating cutpoints for the MHI-5 and MCS using the GHQ-12: a comparison of five different methods. BMC Psychiatry. 2008;8(1):10. doi:10.1186/1471-244X-8-10
23. LaMontagne AD, Krnjacki L, Milner A, Butterworth P, Kavanagh A. Psychosocial job quality in a national sample of working Australians: a comparison of persons working with versus without disability. SSM Popul Health. 2016;2:175–181. doi:10.1016/j.ssmph.2016.03.001
24. Keramat SA, Alam K, Gow J, Biddle SJH. Gender differences in the longitudinal association between obesity, and disability with workplace absenteeism in the Australian working population. PLoS One. 2020;15(5):e0233512. doi:10.1371/journal.pone.0233512
25. Keramat SA, Alam K, Gow J, Biddle SJH. Obesity, long-term health problems, and workplace satisfaction: a Longitudinal Study of Australian Workers. J Community Health. 2020;45(2):288–300. doi:10.1007/s10900-019-00735-5
26. Keramat SA, Alam K, Gow J, Biddle SJH, Böckerman P. A longitudinal exploration of the relationship between obesity, and long term health condition with presenteeism in Australian workplaces, 2006–2018. PLoS One. 2020;15(8):e0238260. doi:10.1371/journal.pone.0238260
27. Lee H-W, Song M, Yang JJ, Kang D. Determinants of poor self-rated health in Korean adults with diabetes. J Prev Med Public Health. 2015;48(6):287–300. doi:10.3961/jpmph.15.048
28. Imai K, Gregg EW, Chen YJ, Zhang P, de Rekeneire N, Williamson DF. The association of BMI with functional status and self-rated health in US adults. Obesity. 2008;16(2):402–408. doi:10.1038/oby.2007.70
29. Lim W-Y, Ma S, Heng D, Bhalla V, Chew SK. Gender, ethnicity, health behaviour & self-rated health in Singapore. BMC Public Health. 2007;7(1):184. doi:10.1186/1471-2458-7-184
30. Herman KM, Hopman WM, Rosenberg MW. Self-rated health and life satisfaction among Canadian adults: associations of perceived weight status versus BMI. Qual Life Res. 2013;22(10):2693–2705. doi:10.1007/s11136-013-0394-9
31. Micciolo R, Canal L, Minniti A, et al. The association between excess weight and comorbidity and self-rated health in the Italian population. Ann Epidemiol. 2013;23(4):172–178. doi:10.1016/j.annepidem.2013.02.003
32. Hellgren MI, Kitsche E, Groot-Zevert M, Lindblad U, Daka B. Association between body mass index and self-rated health: a Swedish population-based longitudinal study. Scand J Public Health. 2021;49(4):369–376. doi:10.1177/1403494819875012
33. Kepka D, Ayala GX, Cherrington A. Do latino immigrants link self-rated health with BMI and health behaviors? Am J Health Behav. 2007;31(5):535–544. doi:10.5555/ajhb.2007.31.5.535
34. Macmillan R, Duke N, Oakes JM, Liao W. Trends in the association of obesity and self-reported overall health in 30 years of the integrated health interview series. Obesity. 2011;19(5):1103–1105. doi:10.1038/oby.2010.286
35. Cullinan J, Gillespie P. Does overweight and obesity impact on self-rated health? Evidence using instrumental variables ordered probit models. Health Econ. 2016;25(10):1341–1348. doi:10.1002/hec.3215
36. Noh J-W, Kim J, Yang Y, Park J, Cheon J, Kwon YD. Body mass index and self-rated health in East Asian countries: comparison among South Korea, China, Japan, and Taiwan. Fürnsinn C, ed. PLoS One. 2017;12(8):e0183881. doi:10.1371/journal.pone.0183881
37. Hoeymans N, Feskens EJM, Kromhout D, van den Bos GAM. The contribution of chronic conditions and disabilities to poor self-rated health in Elderly Men. J Gerontol Ser a Biol Sci Med Sci. 1999;54(10):M501–M506. doi:10.1093/gerona/54.10.M501
38. Alonso J, Vilagut G, Adroher ND, et al. Disability mediates the impact of common conditions on perceived health. Lam WWT, ed. PLoS One. 2013;8(6):e65858. doi:10.1371/journal.pone.0065858
39. Carlson B, Pozehl B, Hertzog M, Zimmerman L, Riegel B. Predictors of overall perceived health in patients with heart failure. J Cardiovasc Nurs. 2013;28(3):206–215. doi:10.1097/JCN.0b013e31824987a8
40. Machacova K, Lysack C, Neufeld S. Self-rated health among persons with spinal cord injury: what is the role of physical ability? J Spinal Cord Med. 2011;34(3):265–272. doi:10.1179/107902610X12883422813660
41. Buist-Bouwman MA, Ormel J, de Graaf R, et al. Mediators of the association between depression and role functioning. Acta Psychiatr Scand. 2008;118(6):451–458. doi:10.1111/j.1600-0447.2008.01285.x
42. Alonso J, Vilagut G, Chatterji S, et al. Including information about co-morbidity in estimates of disease burden: results from the World Health Organization World Mental Health surveys. Psychol Med. 2011;41(4):873–886. doi:10.1017/S0033291710001212
43. Garin O, Ayuso-Mateos J, Almansa J, et al. Validation of the “World Health Organization Disability Assessment Schedule, WHODAS-2” in patients with chronic diseases. Health Qual Life Outcomes. 2010;8(1):51. doi:10.1186/1477-7525-8-51
44. Khalaila RNR. Socioeconomic status, health behaviors, obesity and self-rated health among older Arabs in Israel. J Cross Cult Gerontol. 2017;32(1):115–130. doi:10.1007/s10823-016-9301-5
45. Schootman M, Deshpande AD, Pruitt S, Aft R, Jeffe DB. Estimated effects of potential interventions to prevent decreases in self-rated health among breast cancer survivors. Ann Epidemiol. 2012;22(2):79–86. doi:10.1016/j.annepidem.2011.10.011
 © 2021 The Author(s). This work is published and licensed by Dove Medical Press Limited. The full terms of this license are available at https://www.dovepress.com/terms.php and incorporate the Creative Commons Attribution - Non Commercial (unported, v3.0) License.
By accessing the work you hereby accept the Terms. Non-commercial uses of the work are permitted without any further permission from Dove Medical Press Limited, provided the work is properly attributed. For permission for commercial use of this work, please see paragraphs 4.2 and 5 of our Terms.
© 2021 The Author(s). This work is published and licensed by Dove Medical Press Limited. The full terms of this license are available at https://www.dovepress.com/terms.php and incorporate the Creative Commons Attribution - Non Commercial (unported, v3.0) License.
By accessing the work you hereby accept the Terms. Non-commercial uses of the work are permitted without any further permission from Dove Medical Press Limited, provided the work is properly attributed. For permission for commercial use of this work, please see paragraphs 4.2 and 5 of our Terms.