")
Back to Journals » Diabetes, Metabolic Syndrome and Obesity » Volume 14
Obesity and Heath-Carter Somatotyping of 3438 Adults in the Xinjiang Uygur Autonomous Region of China by Multivariate Analysis
Authors Liu X , Li W, Wen Y, Xu G, Zhou G, Qu Q, Hu Y, Saitierding Y, Mohetaer M, Buerlan Y, Zhong X, Xi H
Received 23 October 2020
Accepted for publication 13 January 2021
Published 15 February 2021 Volume 2021:14 Pages 659—670
DOI https://doi.org/10.2147/DMSO.S287954
Checked for plagiarism Yes
Review by Single anonymous peer review
Peer reviewer comments 3
Editor who approved publication: Prof. Dr. Juei-Tang Cheng
Xiaoyuan Liu,1,2 Wenhui Li,1 Youfeng Wen,1 Guochang Xu,3,* Guojian Zhou,1,* Quanying Qu,1,* Ying Hu,1,* Yueriguli Saitierding,1,* Maierdanjang Mohetaer,1,* Yeerkenbieke Buerlan,1,* Xuejun Zhong,1,* Huanjiu Xi1,*
1Biological Anthropology Institute, Jinzhou Medical University, Jinzhou, People’s Republic of China; 2Department of Prosthodontics, The First Affiliated Hospital of Xinjiang Medical University, Urumqi, People’s Republic of China; 3Institute of Anthropology, Nanyang Institute of Technology, Nanyang, People’s Republic of China
*These authors contributed equally to this work
Correspondence: Youfeng Wen
Biological Anthropology Institute, Jinzhou Medical University, Jinzhou, 121001, People’s Republic of China
Tel +86 18641602627
Email [email protected]
Introduction: This study aimed to investigate the somatotype and obesity of adults in the Xinjiang Uygur Autonomous Region of China and to explore multivariate path analysis for the feasibility and scientificity of using somatotypes to evaluate obesity.
Subjects and Methods: According to anthropometric methods, a cross-sectional study was performed on 10 indexes of 3438 adults (1690 men and 1748 women, aged > 20 years) living in the Xinjiang Uygur Autonomous Region of China (including Kazakh, Kyrgyz, Xibe, Uzbek, Tatar and Tajik). The Heath-Carter anthropometric method and body mass index (BMI) were used to evaluate somatotype and obesity, respectively. The feasibility and scientificity of using somatotypes to evaluate obesity were analysed by correspondence analysis.
Results: Among the six populations, the somatotypes were mainly distributed as endomorphic mesomorph, mesomorph-endomorph and mesomorphic endomorph populations, accounting for 66.5% of males and 78.8% of females. The obesity rate (27.4% in males, 27.8% in females) of the six populations in the Xinjiang Uygur Autonomous Region of China was much higher than the average Chinese adult obesity rate (12.1%) and the global adult obesity rate (male: 11%, female: 15%). The distribution of BMI was significantly different (male: P= 0.000, female: P= 0.033) in different populations, and the incidence of overweight and obesity in the Xinjiang Uygur Autonomous Region of China increased gradually. This study found that there were significant differences in somatotype distribution among different obesity groups in the Xinjiang Uygur Autonomous Region of China (P=0.000). There was a strong correlation between overweight or obesity and endomorph-mesomorph, endomorphic mesomorph and mesomorphic endomorph. Furthermore, this study indicated that using somatotypes to evaluate obesity was reliable and scientific.
Conclusion: This study concluded that the somatotype of overweight or obese people was mainly related to endomorphic mesomorph, mesomorph-endomorph, and mesomorphic endomorph.
Keywords: China, obesity, somatotype, Heath-Carter anthropometric method, body mass index, path analysis, Xinjiang
Introduction
Obesity, which affects human health worldwide, is a chronic disease with a complex aetiology and is a major global public health problem.1–4 As people’s lifestyles change, an oversupply of nutrition (leading to body fat accumulation) is the main reason for the occurrence of overweight/obesity.5 At present, there are many methods for nutrition assessment in academia, including subjective global assessment,6,7 nutritional risk screening 2002,8 mini-nutritional assessment,9 short-form mini-nutritional assessment,10,11 bioelectrical impedance analysis,12 dual energy X-ray absorptiometry,13,14 computed tomography,15 and MRI.16,17 Although these methods are more accurate and quantitative, they cannot evaluate the overall obesity of the human body accurately.18 Studies19,20 have shown that the Heath-Carter anthropometric somatotype can comprehensively consider various factors affecting the human body (such as height, weight, skeletal muscle, body fat, etc.) and can compensate for the deficiencies of other methods in obesity evaluation. Endomorph is used to indicate the relative content of body fat, mesomorph is used to reflect the level of musculoskeletal development, and ectomorph is used to show the relative linearity of the body.21 Susanne C et al22 found that endomorphy and the fat factor, mesomorphy and the skeletal muscle factor, and ectomorphy and the linearity of the body were positively correlated by factor analysis. The Heath-Carter anthropometric method23 has overcome the subjective and cumbersome shortcomings of other nutritional evaluation methods and can accurately reflect fatness and obesity. Furthermore, it is objective and universally applicable, and it is a more reliable method for evaluating obesity. Therefore, it is widely recommended by the “International Biological Development Plan”. Some studies24,25 have found that the Heath-Carter anthropometric method can evaluate obesity. It has been reported that26,27 somatotype and obesity are closely related, and different somatotypes have been indicated to have different BMIs (endomorphy and cholesterol are positively correlated and negatively related to carbohydrate and inorganic element intake; mesomorphy is positively correlated with the intake of fat and inorganic elements; ectomorphy is related to high-intensity exercise and somatic cell quality). Koleva et al28 demonstrated that some people who are overweight or obese are closely related to endomorph-mesomorph, endomorphic mesomorph, and mesomorphic endomorph.
With the improvement in the economic level, the dietary habits of Chinese people have changed rapidly. Indeed, the number of overweight or obese people suffering from chronic diseases (hypertension, heart disease, periodontal disease, etc.) is gradually increasing.29–31 The Xinjiang Uygur Autonomous Region of China, inhabited by 47 ethnic minorities (such as Kazakh, Kyrgyz and Uzbek), is located deep inland and surrounded by mountains in northwest China, which makes it difficult to reach by ocean currents. Therefore, a typical temperate continental climate has been formed in the Xinjiang Uygur Autonomous Region of China and is characterized by sparse precipitation, low relative humidity, long winters, long hours of sunshine, and large temperature differences. Residents have formed dietary habits of high protein, high calories, high sugar and a lack of inorganic nutrients, for example, beef, mutton, and fruit with high sugar content, along with a lifestyle lacking in exercise, which leads to obesity and a corresponding poor influence on their health.32 Studies33 have shown that the obesity rate (26.5%) in the Xinjiang Uygur Autonomous Region of China is much higher than that among average Chinese adults34 (12.1%) and the global adult35 obesity rate (male: 11%, female: 15%). However, given the high obesity rate at present, it is urgent to explore a feasible and scientific method for evaluating obesity and preventing and controlling the incidence of obesity.
The aim of this study is therefore to investigate the somatotype with the Heath-Carter anthropometric method and the obesity rate with body mass index (BMI) and to explore multivariate path analysis for the feasibility and scientificity of using somatotype to evaluate obesity by selecting a large sample of six adult populations (Kazakhs, etc.) in the Xinjiang Uygur Autonomous Region of China for several generations. This work provides a new means for preventing and controlling the incidence of overweight or obesity in different populations.
Subjects and Methods
Ethics Statement
The study protocol was approved by the Research Ethics Committee of Jinzhou Medical University (ethics committee approval code: JZLL2015007) and was consistent with the Declaration of Helsinki. Before participation, verbal and written informed consent was approved by the Research Ethics Committee of Jinzhou Medical University, all study participants were fully informed of the aim and experimental procedures of the study, and verbal and written informed consent was obtained.
Data Sources and Participants
From May 2018 to May 2019, we went to Hefeng, Aketao, Mulei, and Qitai Counties and ILi city of Xinjiang Province, China, to conduct the cross-sectional survey by random sampling. This study contacted the local governments in advance. With the help of the local governments, Kazak, Kyrgyz, Xibe, Uzbek, Tatar and Tajik residents who submitted their household registrations and had lived in the above native locations for at least three generations, were randomly coded according to their ID numbers, and the random number method was used to randomly select research subjects for data collection. A total of 3438 adults (1690 males and 1748 females, age >20 years old) in good health according to clinical medical evaluations who had the same living environment and eating habits were selected as participants. The average age was 43.21 years for men and 42.53 years for women. The average age among different populations was not significantly different (P>0.5), as shown in Table 1.
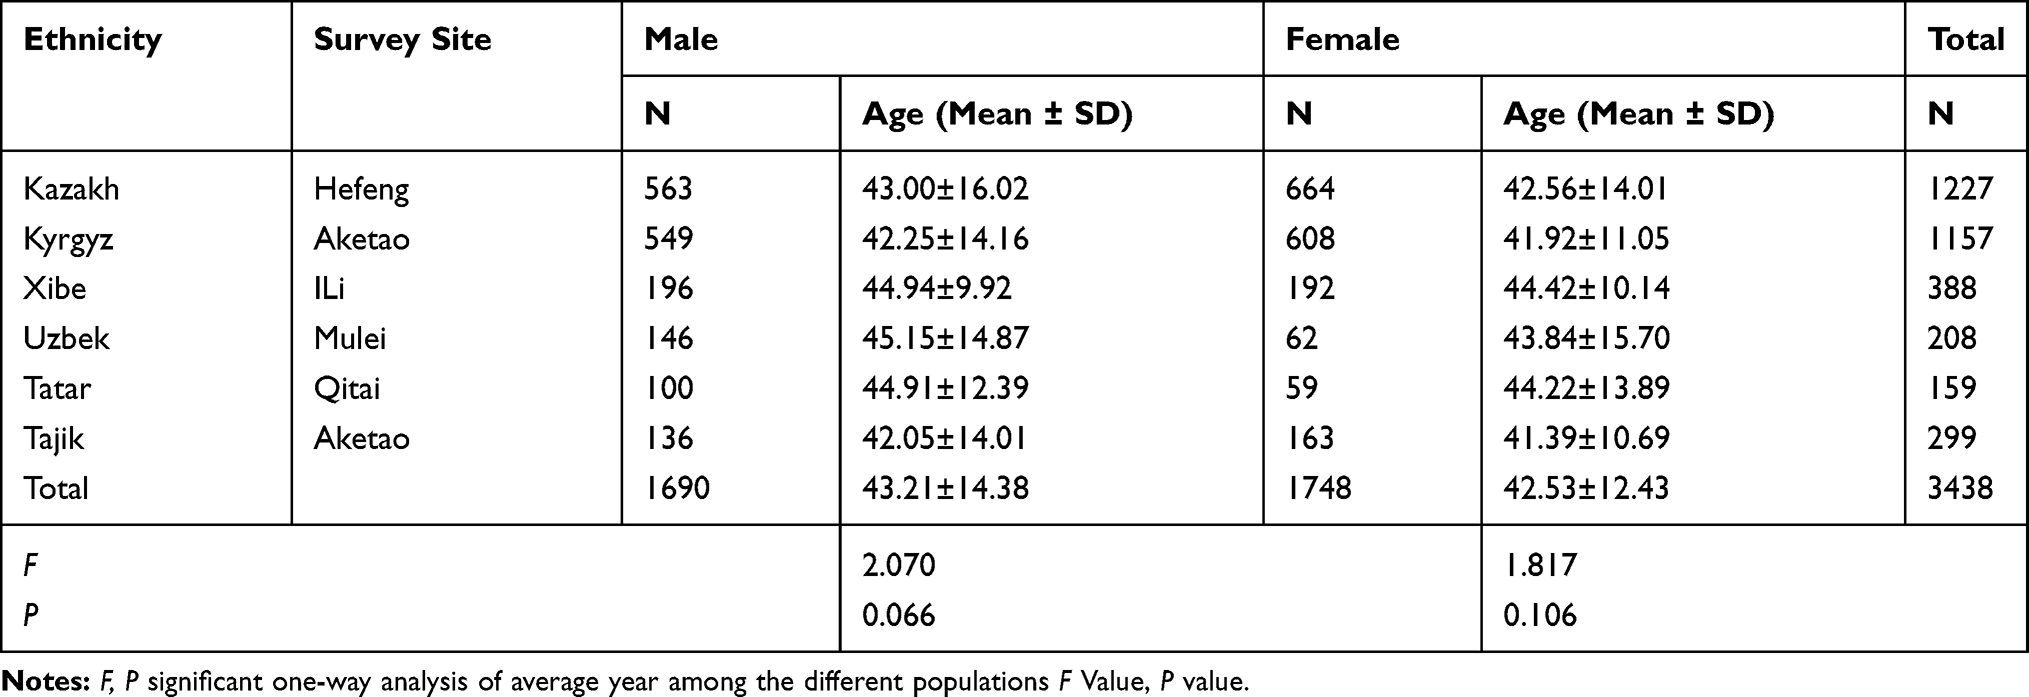 |
Table 1 Valid Survey Samples of Six Populations in the Xinjiang Uygur Autonomous Region of China |
Measurement of Anthropometry
According to Anthropometric Methods,36 each subject’s body weight was measured with a body weight measurement device (Omron HBF-358, Powerlogics Co., Ltd., Korea). Height was measured with a Martin altimeter (Nanchang Measuring Instrument Factory, China). The triceps skinfold, subscapular skinfold, supraspinal skinfold, and medial calf skinfold were assessed by a skinfold thickness meter (Nantong Hyatt Fitness Measuring Equipment Co., Ltd., China), flexed upper arm and calf girth with a tape measure and skeletal breadths with a small sliding caliper (Chengdu Jingbo Diameter Precision Measurement Research Institute, China). Except for height and weight, other indicators were measured on the right side of the corresponding body parts. Height and girth were accurate to 1 mm, interosseous diameter was accurate to 0.05 mm, and skinfold thickness was accurate to 0.01 mm.
Judgement of Somatotype
Using the Heath-Carter Anthropometric Somatotype method,37 the three somatotype components were computed according to the Heath-Carter Anthropometric Somatotype Instruction Manual. The original data were input into Somatotype1.2.5 Software (M E R Goulding Software Development) to analyse 13 somatotype categories and draw a somatochart. Ponder index36= height, cm/(body weight, kg)0.33 (cm/kg0.33). If the Ponder index was ≤38.25 cm/kg,0.33 ectomorphy=0.1. If the Ponder index was ≥40.70 cm/kg,0.33 ectomorphy= Ponder index×0.732–28.58. Finally, if 38.25 cm/kg0.33<Ponder index<40.70 cm/kg,0.33 ectomorphy= Ponder index×0.463–17.63.
Evaluation of Obesity
Studies38,39 in the Chinese population showed that low body weight was defined as a BMI <18.5 kg/m2 and normal body weight as 18.5 kg/m2 ≤ BMI < 24 kg/m2, 24 kg/m2 ≤ BMI < 28 kg/m2 indicated overweight, and BMI ≥28 kg/m2 suggested obesity. Thus, overweight and obesity were defined by the Chinese standards in this study; obesity was defined as BMI ≥28 kg/m2, and overweight was defined as a BMI of 24–28 kg/m2.
Statistical Analysis
Quantitative data are expressed as the mean ± standard deviation (Mean ± SD), and categorical data are expressed as percentages (%). Differences in categorical data among Kazakh, Kyrgyz, Xibe, Uzbek, Tatar and Tajik were examined by the chi-square test, and differences in quantitative data were examined by ANOVA, followed by the post hoc test (Tukey) after the homogeneity of variance test. The correlation between somatotypes and obesity was assessed by correspondence analysis. All analysis procedures were performed by using SPSS 25.0 (IBM SPSS, Chicago, IL). All tests were two tailed, and the significance level was set at α=0.05.
Results
This study (Table 2) showed that there were significant differences in ten Heath-Carter body variables among the six populations (P=0.000). Among the six populations, the skinfold thickness and biepicondylar breadth of the humerus were the largest among individuals of Xibe ethnicity, and the skinfold thickness and biepicondylar breadth of the femur were the smallest among the Kazakh. Flexed upper arm girth was the largest among the Tatar and the smallest among the Xibe, and the calf girth among the Tatar (male) and Kazakh (female) was the smallest. However, flexed upper arm girth, biepicondylar breadth of humerus, height and weight were the smallest among the Tajik, and the biepicondylar breadth of femur among the Kyrgyz was the largest among the six populations. BMI among the Tajik (male) was up to 24 kg/m2, and BMI among the other populations was over 24.0 kg/m2. Therefore, with the exception of the Kazakh and Kyrgyz (male), whose skeletal muscles were more developed, other groups (Kyrgyz women, Uzbek, Xibe, Tatar and Tajik) had higher skinfold thickness and lower body linearity.
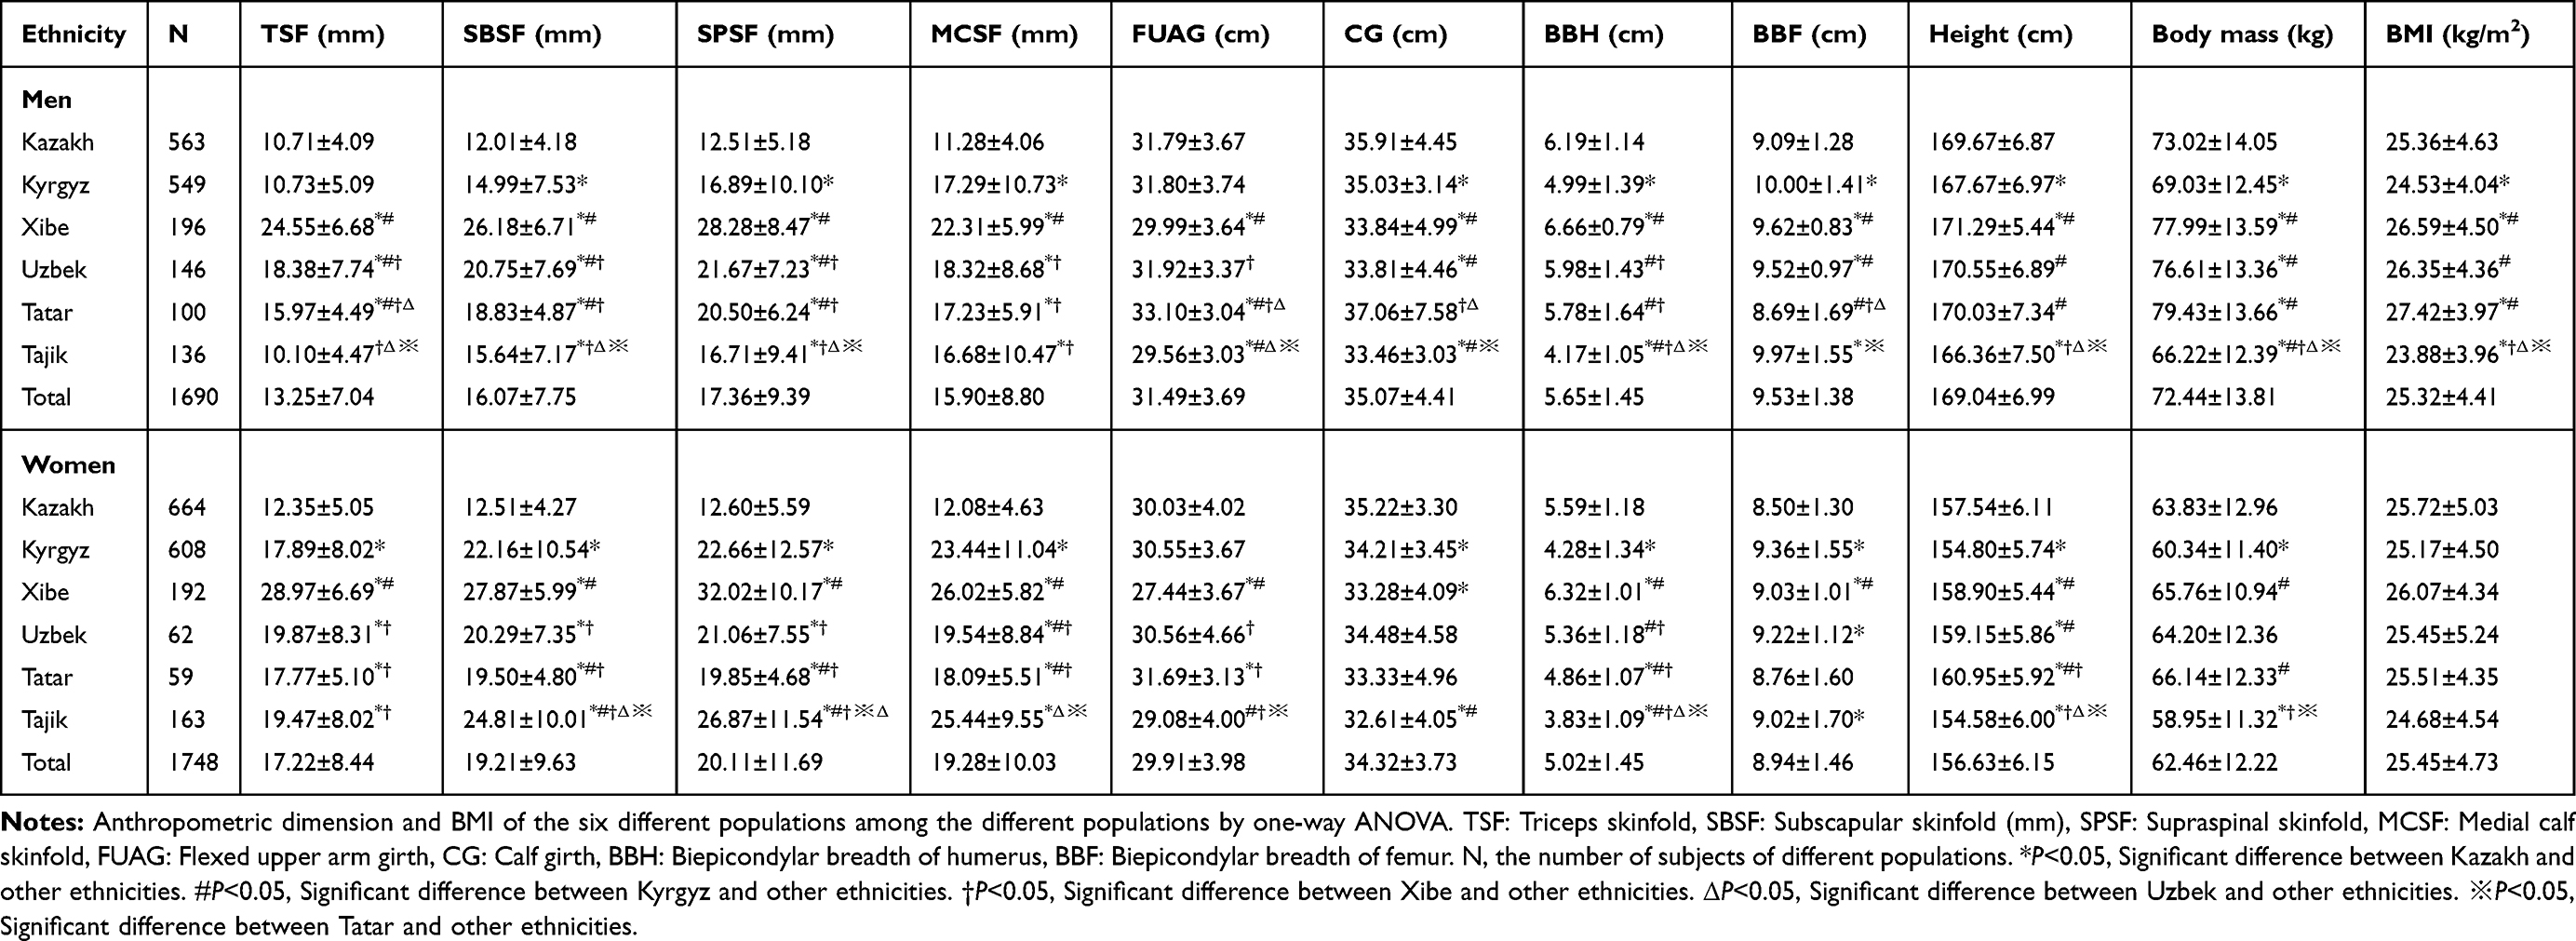 |
Table 2 Anthropometric Dimensions and BMI of the Six Different Populations in the Xinjiang Uygur Autonomous Region of China. (Mean ± SD) |
The analysis results of the mean somatotype components and Ponder index of different populations in the Xinjiang Uygur Autonomous Region of China are shown in Table 3. The somatotype of different populations was represented by endomorphy-mesomorphy-ectomorphy. The ponderal index ranged from 39.76 to 41.39 in males and from 39.59 to 40.08 in females. There were some differences among them (P=0.000). The results indicated that Kazakhs (3.6–4.4-1.7 for men, 4.1–4.7-1.2 for women) had less body fat and more developed musculoskeletal systems; however Xibe (7.0–3.8-1.4 for men, 8.0–4.1-1.0 for women) had more body fat and a higher body linearity in women; Uzbeks (5.7–3.8-1.4 for men, 6.1–4.4-1.4 for women) had a lower body linearity; at the same time, the skeletal muscles of Tajiks (4.2–2.8-1.9 for men, 6.9–3.0-1.2 for women) were underdeveloped; Tatars (5.4–4.0-1.0 for men, 5.8–3.6-1.2 for women) had the highest body linearity, and Kyrgyz (4.2–4.0-1.8 for men, 6.2–4.1-1.1 for women) were among the six Xinjiang Uygur populations in body characteristics.
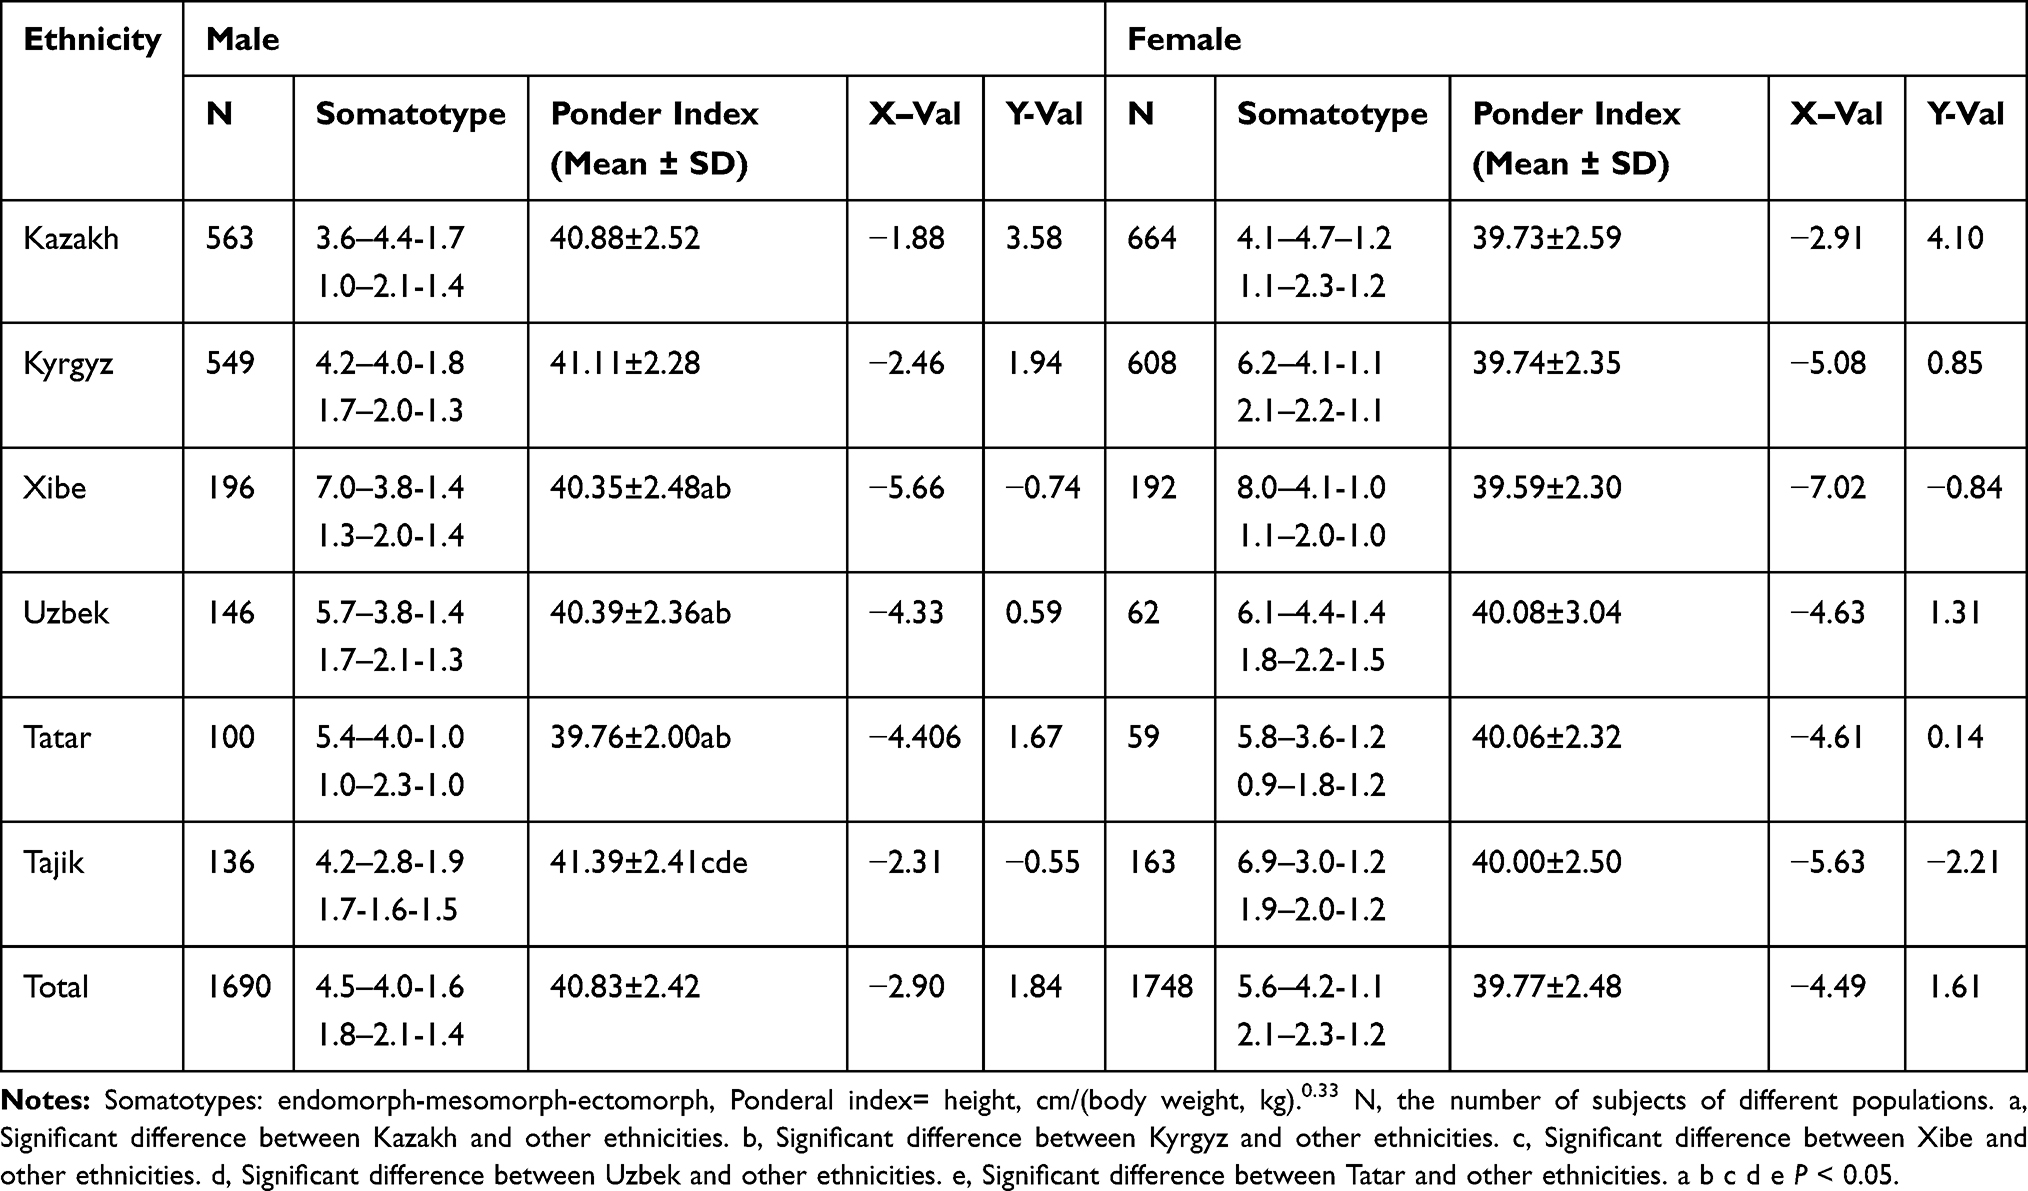 |
Table 3 Somatotype Characteristics of Six Different Populations |
The distribution of somatotype categories in different populations is shown in Table 4. The cumulative 66.5% of males and 78.8% of females were mainly distributed as endomorphic mesomorph, mesomorph-endomorph, and mesomorphic endomorph. Figure 1 shows that the mean somatotypes of different populations were mainly endomorph and mesomorph. Simultaneously, the six populations involved in this study other than Kazakh and Kyrgyz (males) were mainly distributed into mesomorph endomorphs, and the other populations were primarily distributed into mesomorphic endomorphs. Therefore, the results showed a dominance of the endomorph and mesomorph components among the six populations in the Xinjiang Uygur Autonomous Region of China.
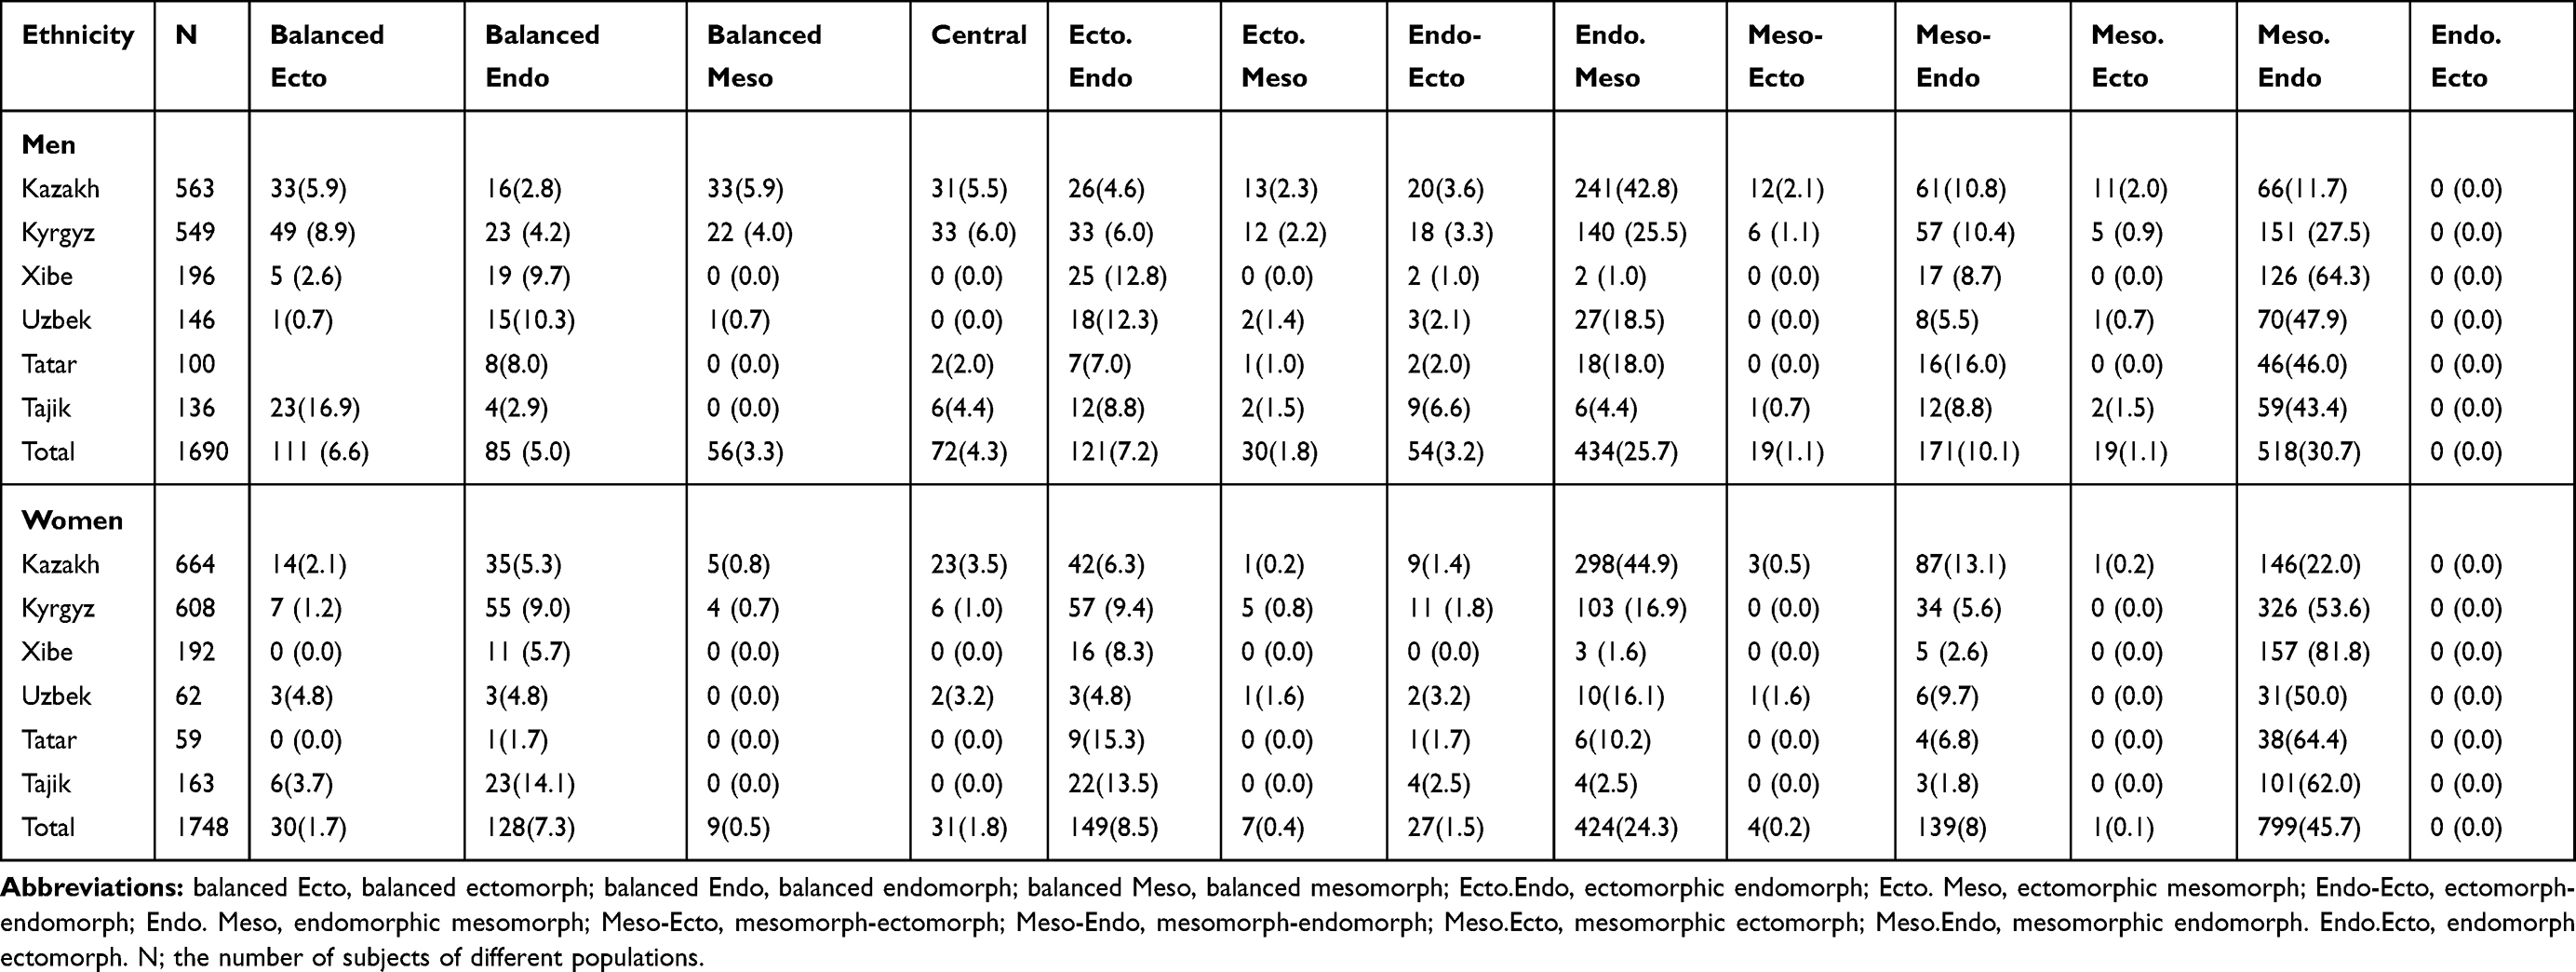 |
Table 4 Somatotype Characteristic Distribution of Six Populations in the Xinjiang Uygur Autonomous Region of China, n (%) |
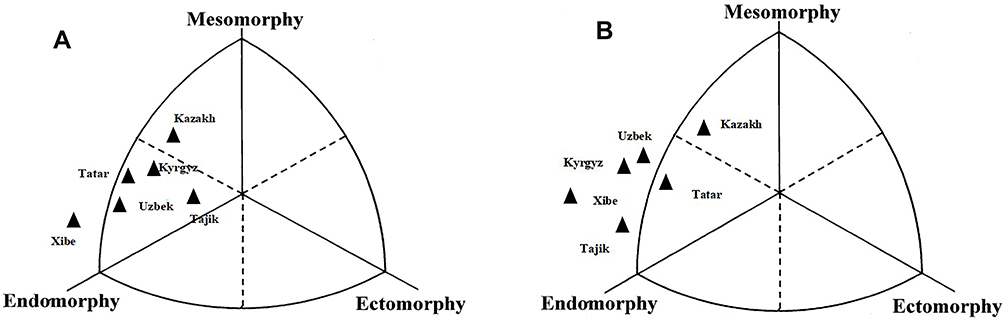 |
Figure 1 Distribution of the somatotypes of six different populations in the Xinjiang Uygur Autonomous Region of China (A-male, B-female). |
Table 5 shows these results: the distribution of BMI was significantly different (male: P=0.000, female: P=0.033) in different populations. Among males, low body weight accounted for 2.2% of the population, normal body weight accounted for 40.4%, overweight accounted for 30.0%, and obesity accounted for 27.4%. Among females, low body weight accounted for 3.3% of the population, normal body weight accounted for 39.4%, overweight accounted for 29.5%, and obesity accounted for 27.8%. The total incidence of overweight and obesity in Kazakhs (54.8% of men, 58.5% of women), Kyrgyz (48.7% of men, 55.3% of women), Xibe (72.5% of men, 64.3% of women), Uzbek (72.6% of men, 54.8% of women), Tatar (79.08% of men, 57.6% of women) and Tajik (50% of men, 48.5% of women) was higher than that (47.9%) reported by Yao XG et al41 in 2010. Thus, the incidence of overweight and obesity in the Xinjiang Uygur Autonomous Region of China has increased gradually.
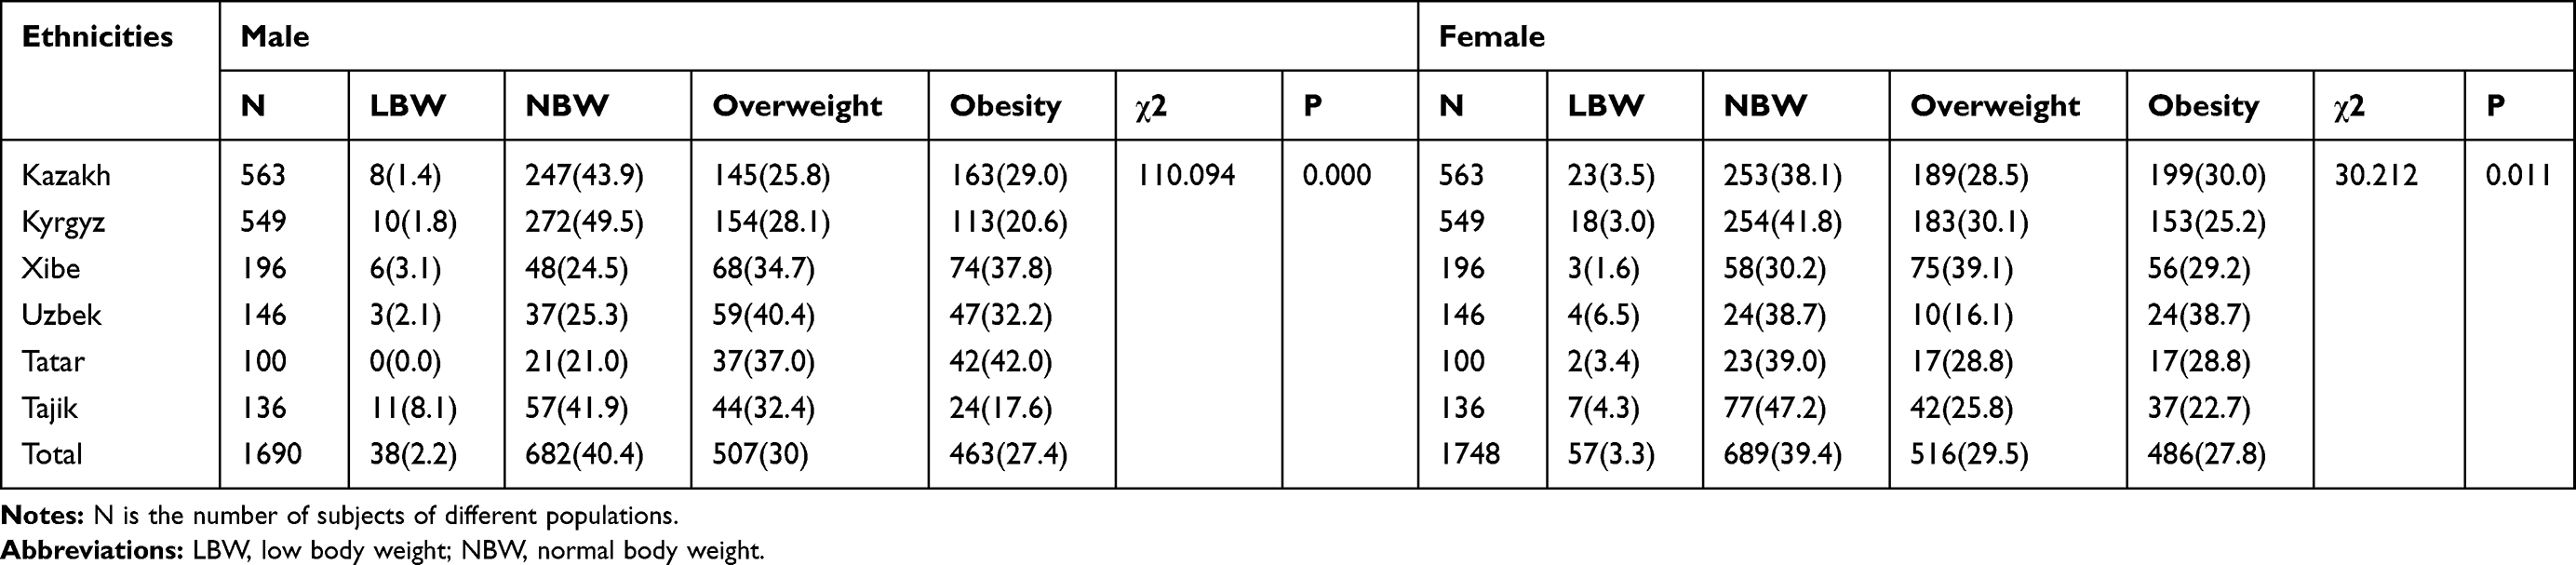 |
Table 5 Distribution of Obesity in Six Populations in the Xinjiang Uygur Autonomous Region of China, n (%) |
This study found (Table 6) that there were significant differences in body type distribution among different obesity groups in the Xinjiang Uygur Autonomous Region of China (P=0.000). Low body weights were mainly distributed into ectomorphic categories, while normal weights were relatively scattered among the different somatotype categories. Overweight and obesity were mainly distributed into endomorphic mesomorph (29.4%, 42.8% of men; 24.8%, 46.5% of women), mesomorph-endomorph (15.4%, 10.8% of men; 8.4%, 6.17% of women), and mesomorphic endomorph (46.4%, 45.6% of men; 63.2%, 47.1% of women). It could be concluded that the somatotype of overweight or obese people was mainly related to endomorphic mesomorph, mesomorph-endomorph, and mesomorphic endomorph.
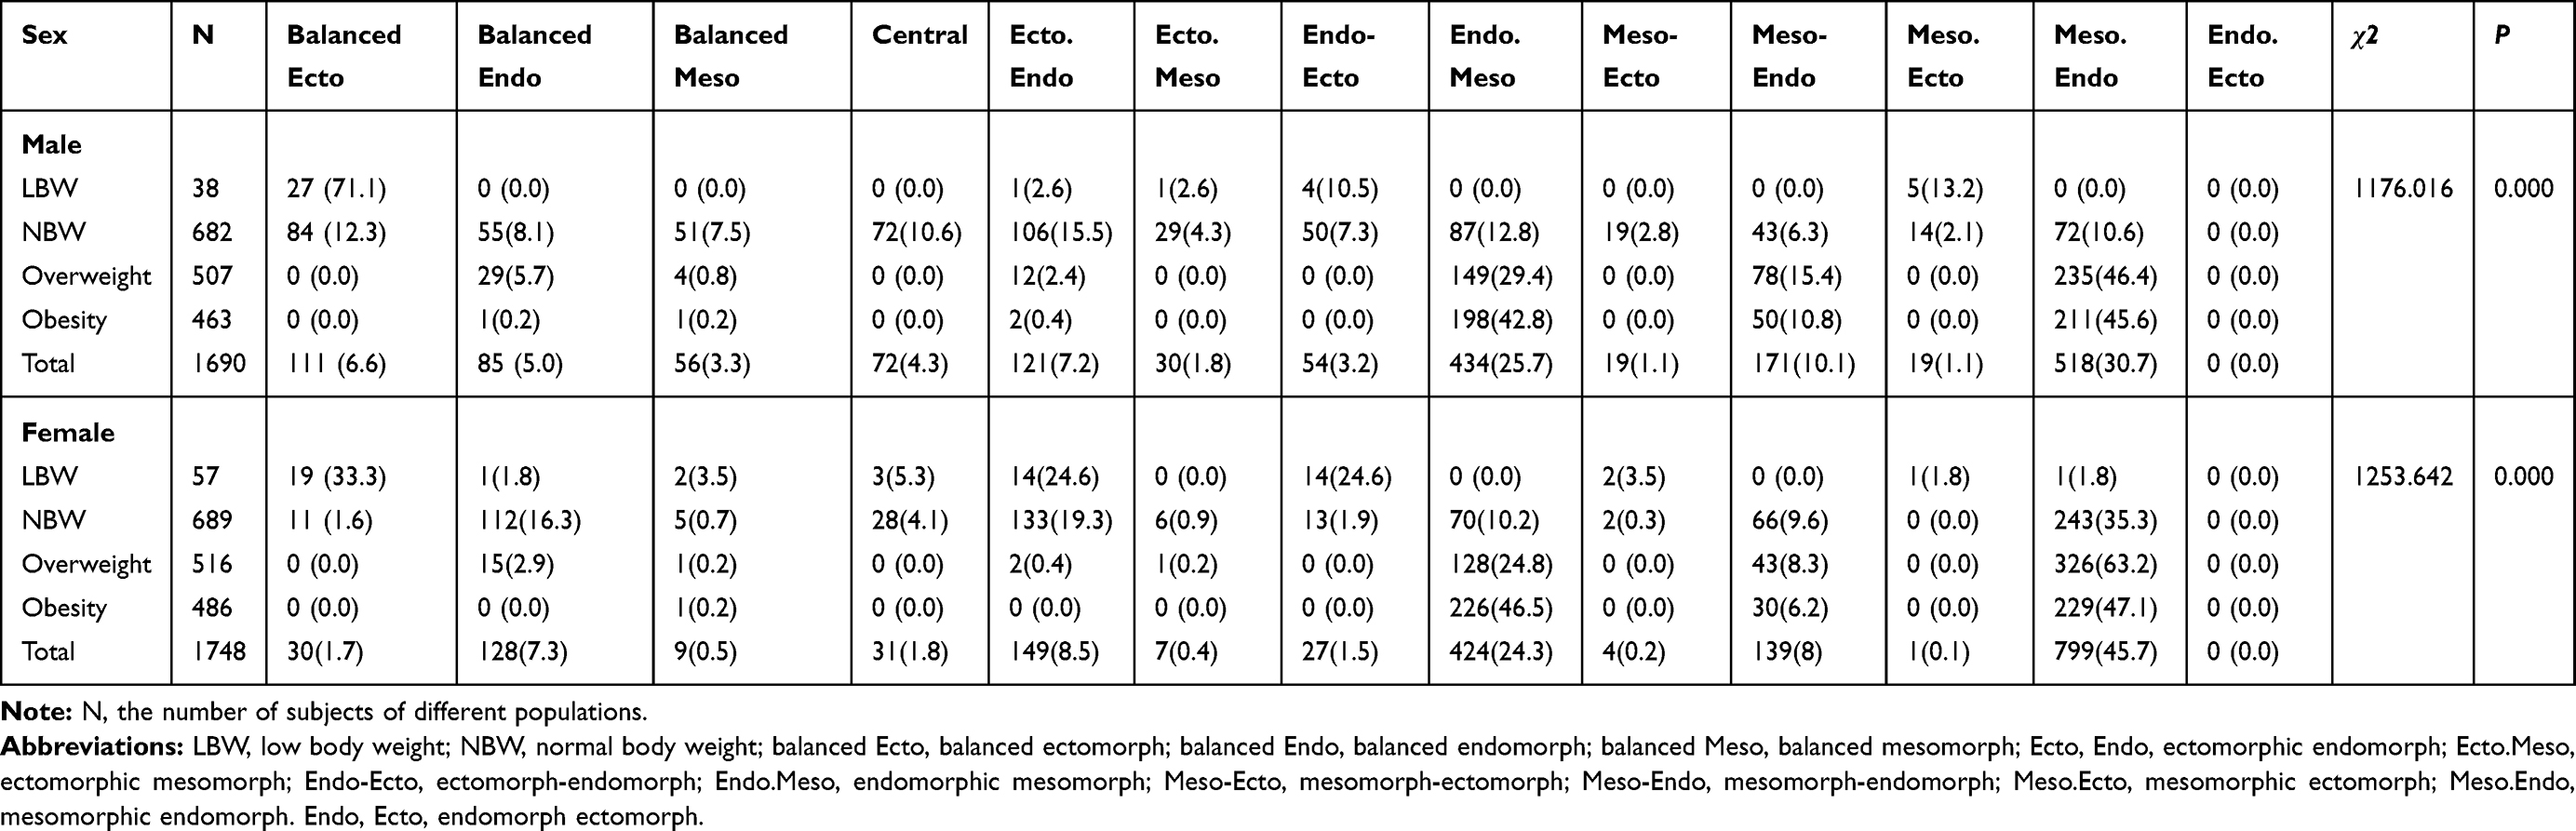 |
Table 6 Distribution of Different BMIs and Somatotypes of Adults in the Xinjiang Uygur Autonomous Region of China, n (%) |
According to Table 7, the corresponding analysis of populations with different BMIs and somatotypes in the Xinjiang Uygur Autonomous Region of China (Table 7), the cumulative interpretation rates of the first dimension and second dimension of the male and female populations explained 97.241% and 95.757% of the total information volume, respectively.
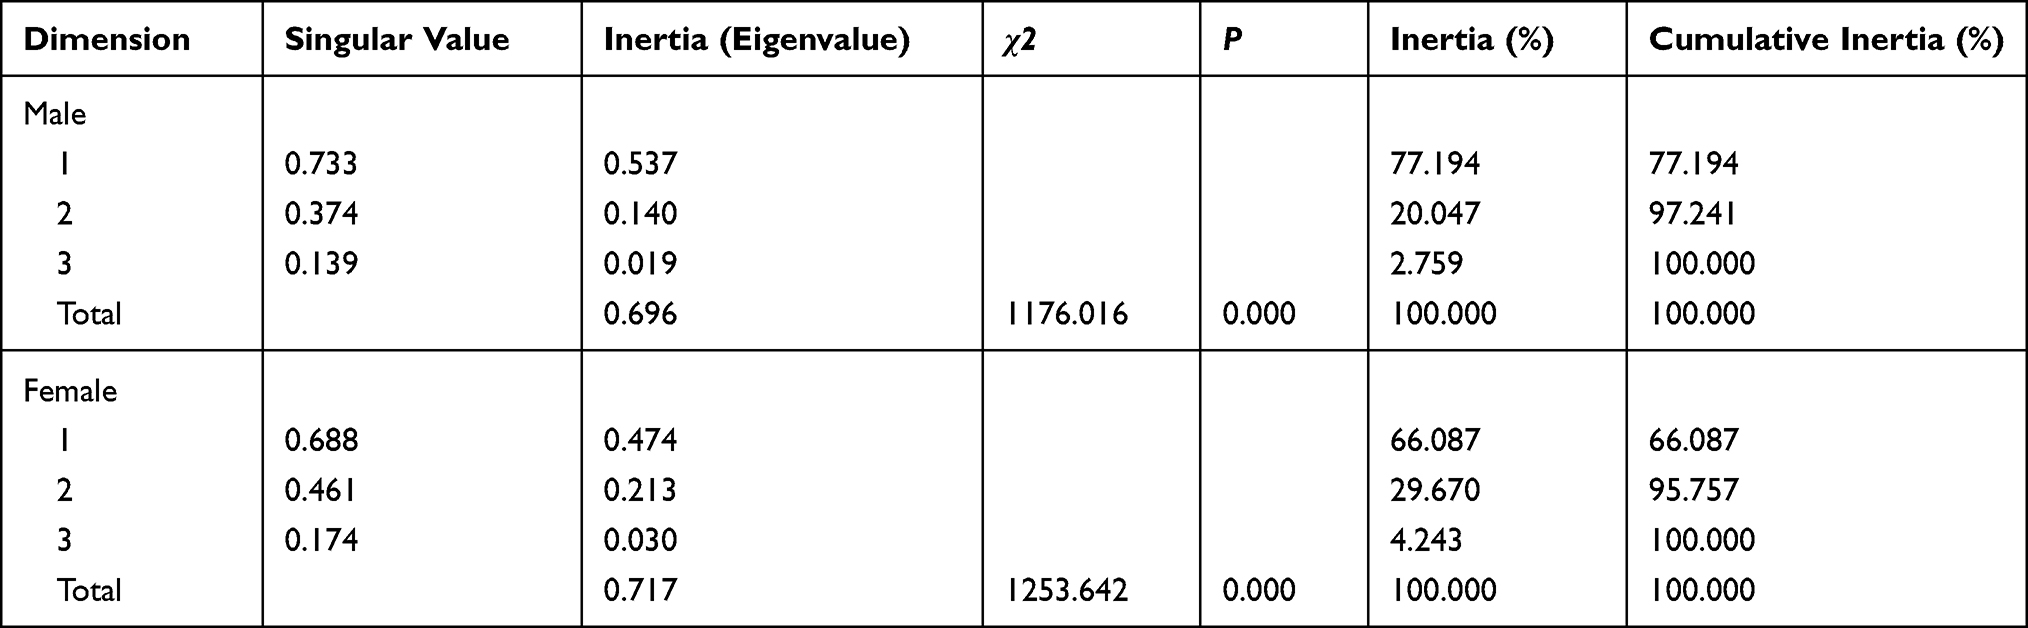 |
Table 7 Comparison of Different BMIs with Somatotypes of Adults in the Xinjiang Uygur Autonomous Region of China |
From the horizontal axis perspective, Figure 2 shows that there was a strong corresponding relationship between somatotype and BMI. In the inertia of the first and second dimensions, cumulative contributions were able to depict the information of all original data. Normal weight (BMI: 18.5–24 kg/m2) was strongly correlated with the somatotype of balanced ectomorph, balanced ectomorph, and five other somatotype categories in men; moreover, it was mainly associated with the somatotype of balanced ectomorph, balanced ectomorph, and three other somatotype categories in women. There was a strong correlation between overweight (BMI: 24~28 kg/m2) or obesity (BMI ≥28 kg/m2) and endomorphic mesomorph, mesomorph-endomorph, and mesomorphic endomorph somatotypes.
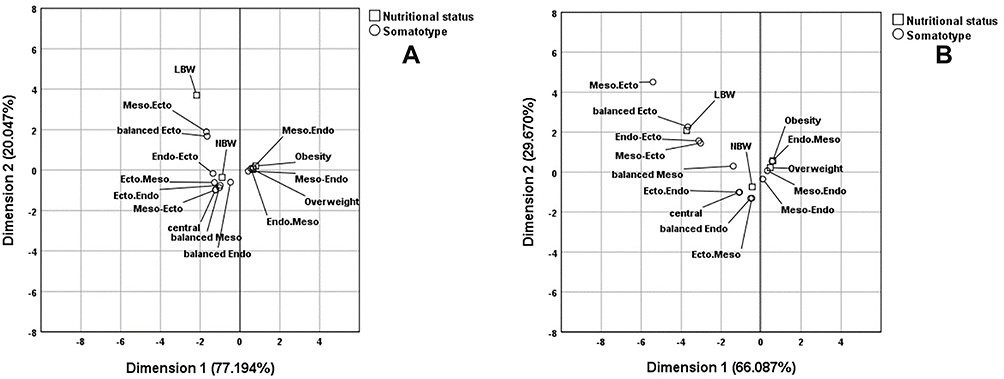 |
Figure 2 Corresponding analysis of BMI and somatotypes of the Xinjiang Uygur Autonomous Region of Chinese adults (A-male, B-female). |
Discussion
Previous studies33 have shown that the obesity incidence of adults in the Xinjiang Uygur Autonomous Region of China is higher than that of adults in Chinese inland areas and that of the global adult population. The incidence of obesity among adults in the Xinjiang Uygur Autonomous Region of China has become increasingly serious. Somatotype categories were evaluated according to the Heath-Carter Anthropometric Somatotype Instruction Manual.37 Bolonchuk WW et al27 pointed out that the endomorph, mesomorph and ectomorph could accurately reflect obesity in the human body. These results (Table 2) show that there are obvious differences in height, weight, BMI and other indicators among the different populations. Therefore, this study indicates that adults from the Xinjiang Uygur Autonomous Region of China generally show a tendency to be overweight or obese in terms of anthropometric indicators and somatotype. Such a trend can lead to a high incidence of diabetes, cardiovascular disease, periodontal disease and so on.29–31 Because Tajiks live on the Pamirs Plateau (4500 metres above sea level) and living conditions are very difficult, the incidence of overweight or obesity is lower than that of others. These results (Tables 3 and 4 and Figure 1) showed that the somatotypes of Kazakhs and Kyrgyz (men) were basically similar to those of Caucasians; however, the other populations had different somatotype factors and distributions.
Obesity is mainly caused by an oversupply of nutritional intake32 and is able to give rise to a large number of chronic diseases.1–3 Assessment of obesity among adults in the Xinjiang Uygur Autonomous Region of China was conducted according to BMI. According to the WHO strategy,40 BMI was calculated as weight (kg) divided by height squared (m2). BMI ≥30 kg/m2 was defined as obesity, and 25 kg/m2≤BMI <30 kg/m2 was defined as overweight. However, studies38,39 showed that low body weight was defined as a BMI <18.5 kg/m2 and normal body weight as 18.5 kg/m2 ≤ BMI < 24 kg/m2, 24 kg/m2 ≤ BMI < 28 kg/m2 indicated overweight and BMI ≥28 kg/m2 suggested obesity for Chinese people. Therefore, this study used this measurement criteria for Chinese people. The incidences of obesity in Kazakh, Kyrgyz, Xibe, Uzbek, Tatar, and Tajik are shown in Table 5 and were higher than those of adults in Chinese inland areas (12.1%),42 those of adults worldwide,24 and the predicted global obesity rate in 2025 (18% in men, 21% in women) by NCD-RisC.2 Therefore, immediate importance should be attached to the control of the occurrence of obesity among adults in the Xinjiang Uygur Autonomous Region of China. Meanwhile, some effective measures should be taken. The long-term dietary habits of high protein, high calorie, high sugar, and lack of inorganic nutrients as well as the inactive lifestyle in this population may be the major reason for their obesity32 in the present study. However, obesity is usually related to genes, geographic location, lifestyle, etc.17,25,43,44 Thus, it should be considered comprehensively that different measures should be taken to control and prevent obesity according to different populations in the Xinjiang Uygur Autonomous Region of China.45,46 A study47 showed that mesoderm-type people had genetic traits of low metabolism and were usually prone to obesity. Some studies28,48 have shown that obesity in different populations is closely related to changes in somatotypes. This study (Table 6) indicated that overweight and obesity in people in the Xinjiang Uygur Autonomous Region of China were mainly distributed in the endomorphic mesomorph, mesomorph-endomorph, and mesomorphic endomorph. This result was consistent with previous research conclusions. Olds T et al46 found that males (94%) were decidedly ectomorphic (high linearity), endomorphic (high fatness), and endomesomorphic (a mixture of muscularity and fatness). The females (85%) were clearly endomorphic, ectomorphic, and ectomesomorphic (a mixture of muscularity and linearity) and were overweight or obese. Susanne C et al22 conducted principal component analysis and found a high correspondence between endomorphy and fatness factors in both sexes, that mesomorphy correlated positively with the muscular factor in males and negatively with the skeletal factor in both sexes, and that ectomorphy had a strong positive correlation with the skeletal factor and a negative correlation with the other two factors in both sexes. Therefore, most people had a markedly higher skinfold thickness and muscle mass and higher skinfold thickness was a more significant body measurement in this study. Some studies indicate that if the cumulative inertia ratio of the first n dimensions reached more than 70%, it could display most of the original information.47 In this study (Table 7), the first dimension of the male and female populations was 77.194% and 66.087%, the second dimension was 20.047% and 29.670%, and the total amount of information was 97.241% and 95.757%, respectively. Therefore, the cumulative contribution ratio of inertia of the first two dimensions could display the information of the original data. There was a significant difference between body type and different BMIs in this study. From the horizontal axis, Figure 2 shows that the BMI of overweight and obese individuals was highly related to the predominance of the endomorphic mesomorph, mesomorph-endomorph, and mesomorphic endomorph in both sexes. A few studies28 showed that overweight and obese people with mesomorphic endomorphism had the characteristics of a high-energy diet habit. Biljana et al24 suggested that the somatotype of obese people usually corresponded with mesomorphs and endomorphs and was caused by specific metabolic abnormalities, which was also consistent with the results of this study. Therefore, the Heath-Carter somatotype method could closely link different BMIs with somatotypes to carry out scientific obesity evaluations. It could comprehensively consider various factors affecting the human body,19,20 overcome the shortcomings, such as subjectivity, of other nutrition evaluation methods, distinguish between overweight or obesity caused by body fat and free fatness, and compensate for the deficiencies of height and body weight in nutrition evaluation.
One of the limitations of this study was that a cross-sectional survey was conducted to analyse the obesity and somatotype categories of six different populations in the Xinjiang Uygur Autonomous Region of China. As in cross-sectional studies, data on exposure and outcome are gathered simultaneously at a specific time point. Thus, prospective studies are necessary to confirm our findings. Previous studies have shown that the somatotype changes with age.48 Endomorphy and mesomorphy were dominant in elderly subjects. In fact, while height decreased with age (by approximately 1 cm per decade starting from 40 years old),49 weight increased with a corresponding increment in the body mass index. Height is a very important indicator, and height changes cause somatotype changes in the Heath-Carter somatotype method.36 In this study, there was no longitudinal study on body type by age group. Therefore, the age-related body type of each population (unclear) should be studied further. Furthermore, some studies have shown that overweight or obesity is caused by many factors (such as diet and metabolic abnormalities).26,42,44 This study should use the Heath-Carter somatotype method and BMI correspondence analysis conclusion to further study the causes of overweight or obesity and to provide better solutions for preventing and controlling overweight or obesity in different populations.
Author Contributions
All authors made a significant contribution to the work reported, whether that is in the conception, study design, execution, acquisition of data, analysis and interpretation, or in all these areas; took part in drafting, revising or critically reviewing the article; gave final approval of the version to be published; have agreed on the journal to which the article has been submitted; and agree to be accountable for all aspects of the work.
Funding
This study was funded by the National Natural Science Foundation of China (NSFC, No. 2015FY111700).
Disclosure
The authors report no conflicts of interest for this work.
References
1. De Luca M, Angrisani L, Himpens J, et al. Indications for surgery for obesity and weight-related diseases: position statements from the international federation for the surgery of obesity and metabolic disorders (IFSO). Obes Surg. 2016;26(8):1659–1696.
2. Collaboration NCDRF. Trends in adult body-mass index in 200 countries from 1975 to 2014: a pooled analysis of 1698 population-based measurement studies with 19.2 million participants. Lancet. 2016;387(10026):1377–1396.
3. Flegal KM, Kit BK, Orpana H, Graubard BI. Association of all-cause mortality with overweight and obesity using standard body mass index categories: a systematic review and meta-analysis. JAMA. 2013;309(1):71–82.
4. Marvelle AF, Lange LA, Qin L, Adair LS, Mohlke KL. Association of FTO with obesity-related traits in the Cebu Longitudinal Health and Nutrition Survey (CLHNS) Cohort. Diabetes. 2008;57(7):1987–1991.
5. Lao XQ, Ma WJ, Sobko T, et al. Dramatic escalation in metabolic syndrome and cardiovascular risk in a Chinese population experiencing rapid economic development. BMC Public Health. 2014;20(14):983.
6. Oliveira TC, Albuquerque IZ, Stringhini MLF, Mortoza AS, Morais BA. The nutritional status of hospitalized children and adolescents: a comparison between two nutritional assessment tools with anthropometric parameters. Rev Paul Pediatr. 2017;35(3):273–280.
7. Sanchez-Rodriguez D, Marco E, Ronquillo-Moreno N, et al. ASPEN-AND-ESPEN: a postacute-care comparison of the basic definition of malnutrition from the American Society of Parenteral and Enteral Nutrition and Academy of Nutrition and Dietetics with the European Society for Clinical Nutrition and Metabolism definition. Clin Nutr. 2019;38(1):297–302.
8. Alhaug J, Gay CL, Henriksen C, Lerdal A. Pressure ulcer is associated with malnutrition as assessed by Nutritional Risk Screening (NRS 2002) in a mixed hospital population. Food Nutr Res. 2017;61(1):1324230.
9. Bolado Jimenez C, Fernadez Ovalle H, Munoz Moreno MF, et al. Undernutrition Measured by the Mini Nutritional Assessment (MNA) Test and Related Risk Factors in Older Adults Under Hospital Emergency Care. Nutrition. 2019;66:142–146.
10. Joaquin C, Puig R, Gastelurrutia P, et al. Mini nutritional assessment is a better predictor of mortality than subjective global assessment in heart failure out-patients. Clin Nutr. 2019;38(6):2740–2746.
11. Molina Luque R, Munoz Diaz B. Martinez-de la Iglesia J, Romero-Saldana M, Molina Recio G. Is the Spanish Short Version of Mini Nutritional Assessment (MNA-SF) Valid for Nutritional Screening of the Elderly? Nutr Hosp. 2019;36(2):290–295.
12. Ramirez-Velez R, Correa-Bautista JE, Gonzalez-Ruiz K, et al. The role of body adiposity index in determining body fat percentage in colombian adults with overweight or obesity. Int J Environ Res Public Health. 2017;14:10.
13. Frankl J, Sherwood A, Clegg DJ, Scherer PE, Oz OK. Imaging metabolically active fat: a literature review and mechanistic insights. Int J Mol Sci. 2019;20:21.
14. van Rassel CR, Bewski NA, O’Loughlin EK, et al. Validity of electrical impedance myography to estimate percent body fat: comparison to bio-electrical impedance and dual-energy X-ray absorptiometry. J Sports Med Phys Fitness. 2019;59(4):632–639.
15. Barbalho E, Rocha I, Cunha de Medeiros GO, et al. Agreement between software programmes of body composition analyses on abdominal computed tomography scans of obese adults. Arch Endocrinol Metabol. 2019;09/30:64.
16. Linder N, Solty K, Hartmann A, et al. Half-body MRI volumetry of abdominal adipose tissue in patients with obesity. BMC Med Imaging. 2019;19(1):80.
17. Mechelli F, Arendt-Nielsen L, Stokes M, Agyapong-Badu S. Validity of ultrasound imaging versus magnetic resonance imaging for measuring anterior thigh muscle, subcutaneous fat, and fascia thickness. Methods Protoc. 2019;2(3):58.
18. Nelson ME, Fiatarone MA, Layne JE, et al. Analysis of body-composition techniques and models for detecting change in soft tissue with strength training. Am J Clin Nutr. 1996;63(5):678–686. doi:10.1093/ajcn/63.5.678
19. Heath BH, Carter JE. A comparison of somatotype methods. Am J Phys Anthropol. 1966;24(1):87–99.
20. The Heath-Carter Anthropometric Somatotype: Instruction Manual [database on the Internet].
21. Weiner JS. Practical Human Biology. Academic Press.; 1981.
22. Susanne C, Bodzsar EB, Castro S. Factor analysis and somatotyping, are these two physique classification methods comparable? Ann Hum Biol. 1998;25(5):405–414.
23. Carter JEL, Heath BH, Jablonski NG, et al. Somatotyping: development and applications. Quart Rev Biol. 1991.
24. Galic BS, Pavlica T, Udicki M, et al. Somatotype characteristics of normal-weight and obese women among different metabolic subtypes. Arch Endocrinol Metab. 2016;60(1):60–65.
25. Asensi GD, Gallego CG, Berruezo GFR, Alonso FJG, Jordana MC. Critical overview of current anthropometric methods in comparison with a new index to make early detection of overweight in Spanish university students: the normalized weight-adjusted index. Nutrición Hospitalaria. 2018;359–367.
26. Bolonchuk WW, Siders WA, Lykken GI, Lukaski HC. Association of dominant somatotype of men with body structure, function during exercise, and nutritional assessment. Am J Hum Biol. 2000;12(2):167–180.
27. Yang LT, Wang N, Li ZX, et al. Study on the adult physique with the Heath-Carter anthropometric somatotype in the Han of Xi’an, China. Anat Sci Int. 2016;91(2):180–187.
28. Koleva M, Nacheva A, Boev M. Somatotype, nutrition, and obesity. Rev Environ Health. 2000;15(4):389–398.
29. Ferretti F, Mariani M. Simple vs. complex carbohydrate dietary patterns and the global overweight and obesity pandemic. Int J Environ Res Public Health. 2017;14:10.
30. Morita I, Okamoto Y, Yoshii S, et al. Five-year incidence of periodontal disease is related to body mass index. J Dent Res. 2011;90(2):199–202.
31. Lee DH, Keum N, Hu FB, et al. Comparison of the association of predicted fat mass, body mass index, and other obesity indicators with type 2 diabetes risk: two large prospective studies in US men and women. Eur J Epidemiol. 2018;33(11):1113–1123.
32. Wang H, Wang J, Liu MM, et al. Epidemiology of general obesity, abdominal obesity and related risk factors in urban adults from 33 communities of Northeast China: the CHPSNE study. BMC Public Health. 2012;12:967. doi:10.1186/1471-2458-12-967
33. Song N, Liu F, Han M, et al. Prevalence of overweight and obesity and associated risk factors among adult residents of northwest China: a cross-sectional study. BMJ Open. 2019;9(9):e028131.
34. Wang R, Zhang P, Gao C, et al. Prevalence of overweight and obesity and some associated factors among adult residents of northeast China: a cross-sectional study. BMJ Open. 2016;6(7):e010828.
35. Jaacks LM, Vandevijvere S, Pan A, et al. The obesity transition: stages of the global epidemic. Lancet Diabetes Endocrinol. 2019;7(3):231–240.
36. Zh XHC. Anthropometric Method.
37. Carter JEL HB. Somatotyping Development and Application. 1990. p. 73–387.
38. Popkin B, Monteiro C, Swinburn B. Overview: bellagio conference on program and policy options for preventing obesity in the low- and middle-income countries. Obes Rev. 2013;14(Suppl 2):1–8.
39. Yao XG, Frommlet F, Zhou L, et al. The prevalence of hypertension, obesity and dyslipidemia in individuals of over 30 years of age belonging to minorities from the pasture area of Xinjiang. BMC Public Health. 2010;10:91.
40. Zhou BF. Cooperative Meta-Analysis Group of the Working Group on Obesity in C. Predictive Values of Body Mass Index and Waist Circumference for Risk Factors of Certain Related Diseases in Chinese Adults–Study on Optimal Cut-Off Points of Body Mass Index and Waist Circumference in Chinese Adults. Biomed Environ Sci. 2002;15(1):83–96.
41. Heath BH, Carter JE. A modified somatotype method. Am J Phys Anthropol. 1967;27(1):57–74.
42. Peeters MW, Thomis MA, Loos RJF, et al. Heritability of somatotype components: a multivariate analysis. Int J Obes. 2007;31(8):1295–1301.
43. Liu G, Ma C, Wang P, et al. Pilose antler peptide potentiates osteoblast differentiation and inhibits osteoclastogenesis via manipulating the NF-kappaB pathway. Biochem Biophys Res Commun. 2017;491(2):388–395.
44. Bailey DA, Carter JE, Mirwald RL. Somatotypes of Canadian men and women. Hum Biol. 1982;54(4):813–828.
45. Zh XHC. Anthropometric Method. Beijing: Science Press (in Chinese); 2010.
46. Olds T, Daniell N, Petkov J, David Stewart A. Somatotyping using 3D anthropometry: a cluster analysis. J Sports. 2013;31(9):936–944.
47. Bendixen M. A practical guide to the use of correspondence analysis in marketing research. Marketing Research On-Line. 1996;1–15.
48. Buffa R, Succa V, Garau D, Marini E, Floris G. Variations of somatotype in elderly Sardinians. Am J Human Biol. 2010;17(4):403–411.
49. A R. Biology of aging. J Phys Anthropol. 1998;55:81–88.
 © 2021 The Author(s). This work is published and licensed by Dove Medical Press Limited. The full terms of this license are available at https://www.dovepress.com/terms.php and incorporate the Creative Commons Attribution - Non Commercial (unported, v3.0) License.
By accessing the work you hereby accept the Terms. Non-commercial uses of the work are permitted without any further permission from Dove Medical Press Limited, provided the work is properly attributed. For permission for commercial use of this work, please see paragraphs 4.2 and 5 of our Terms.
© 2021 The Author(s). This work is published and licensed by Dove Medical Press Limited. The full terms of this license are available at https://www.dovepress.com/terms.php and incorporate the Creative Commons Attribution - Non Commercial (unported, v3.0) License.
By accessing the work you hereby accept the Terms. Non-commercial uses of the work are permitted without any further permission from Dove Medical Press Limited, provided the work is properly attributed. For permission for commercial use of this work, please see paragraphs 4.2 and 5 of our Terms.