")
Back to Journals » Clinical Epidemiology » Volume 10
Number of radiotherapy treatment machines in the population and cancer mortality: an ecological study
Authors Medenwald D , Vordermark D , Dietzel CT
Received 11 November 2017
Accepted for publication 7 June 2018
Published 21 September 2018 Volume 2018:10 Pages 1249—1273
DOI https://doi.org/10.2147/CLEP.S156764
Checked for plagiarism Yes
Review by Single anonymous peer review
Peer reviewer comments 4
Editor who approved publication: Professor Vera Ehrenstein
Daniel Medenwald,1,2 Dirk Vordermark,1 Christian T Dietzel1
1Department of Radiation Oncology, University Hospital Halle (Saale), Halle (Saale), Germany; 2Institute of Medical Epidemiology, Biostatistics and Informatics, Martin Luther University of Halle-Wittenberg, Halle (Saale), Germany
Objectives: The aim of this study was to assess the association between the number of radiotherapy treatment machines (RTMs) in the population and incidence-adjusted cancer mortality.
Methods: Data on cancer incidence and mortality were obtained from the GLOBOCAN project (only high-quality data, C3, or higher according to GLOBOCAN quality label), information on the number of RTMs from the Directory of Radiotherapy Centers database, and remaining data from the World Bank and World Health Organization database. We used linear regression models to assess the associations between RTM per 10,000,000 inhabitants (logarithmized) and the log-transformed mortality/incidence ratio. Models were adjusted for public health variables. To assess the bias due to unobserved confounders, mortality from leukemia was considered as a negative control. Here radiotherapy treatment is less frequently applied, but a common set of confounders is shared with cancer types where radiotherapy plays a stronger role, enabling us to estimate the bias due to confounding of unmeasured parameters. To assess an exposure–effect size relationship, estimated cancer type-specific estimates were related to the proportion of subjects receiving radiotherapy.
Results: We found an inverse linear relationship between RTM in the population and the cancer mortality to incidence ratio for prostate cancer (14.1% per doubling of RTM; 95% CI: 0.1%–26.1%), female breast cancer (12.3%; 95% CI: 2.7%–20.9%), and lung cancer in women (11.2%; 95% CI: 4.3%–17.6%). There was no evidence for bias due to unobserved confounders after covariate adjustment. For women, an exposure-effect size relationship was found (P=0.02).
Conclusion: In this ecological study, we found evidence that the population density of RTM is related to cancer mortality independently of other public health parameters.
Keywords: radiotherapy machines, population, cancer mortality, negative controls
Introduction
There is ample evidence that cancer survival is more favorable in countries with high income and investments in cancer care.1–5 Next to surgery and chemotherapy, radiotherapy is an important pillar of modern oncology with a general utilization proportion of ~50%.6 It has been estimated that radiotherapy alone provides a 5-year survival benefit in 2.4% of all cancer patients (95% CI: 2.1%–2.7%) and in an additional 0.3% (95% CI: 0.2%–0.4%) when combined with chemotherapy. Radiotherapy has a particularly strong benefit in head-and-neck cancer and cervix cancer (overall survival 16% and 18%, respectively).7 Besides its effectiveness, costs for radiation treatments have been calculated to only account for around 5% of the total cost of oncology care in a developed country such as Sweden.8 Still, cost-intense investments have to be made (ie, in radiotherapy treatment machines [RTMs]) in order to satisfy the need for the state-of-the-art cancer care.
The worldwide demand for radiotherapy has been addressed by several studies.9–11 Those studies used the number of cases reported in cancer registries to answer the question of the demand for radiotherapy facilities. Eventually, this leads to the question of how the supply with RTMs in the population affects cancer survival.
In this article, we aimed at estimating the impact of the health care provision of RTMs on cancer mortality by focusing on the problem of confounding. This, as the greatest challenge in such analyses, lies in the proper adjustment for bias that might be induced due to observed and unobserved confounding. Accounting for this problem, we applied several epidemiological methods to investigate the association between RTMs and cancer survival.
Methods
Data sources
For analyses, we included data from several sources that are listed and described in the following sections. The data reflect the situation in 2012 when the GLOBOCAN project (GLOBOCAN section) released the most recent estimates on global cancer incidence and mortality.
Directory of Radiotherapy Centers (DIRAC)
The DIRAC database is provided by the International Atomic Energy Agency and serves as a global register of radiotherapy hospitals and treatment centers. The data set is available for public use and can be accessed on the DIRAC web page (https://dirac.iaea.org/). In addition to information on the number of radiotherapy treatment (RT) units, data are included on the number of linear accelerators, brachytherapy, and related personnel. For the purpose of our study, we used data from January 2012, which took 188 countries into account. A more comprehensive description of DIRAC can be found on the project’s web page.12 For the number of RTMs, LINACs and Co60 were summed.
GLOBOCAN
The GLOBOCAN project (promoted by the World Health Organization [WHO]) releases estimates of cancer incidence, prevalence, and mortality in 184 countries. Data are available for public use and can be downloaded from the web site (http://globocan.iarc.fr/Default.aspx). The estimates are based on national and/or regional cancer registries, where available. Alternatively, the incidence and prevalence were modeled by considering mortality estimates. Again, a more comprehensive account for the methodology can be found on the project’s web page or in Ferlay et al.13 The most recent data available refer to 2012. We excluded countries with low-quality cancer incidence data or incomplete mortality coverage (Figure 1, orange and red; see Figure 1A for data quality and Figure 1B for RTMs). Therefore, a GLOBOCAN label of “C” (high-quality regional, coverage <10%) or higher for incidence and “3” (low-quality complete vital registration) or higher for mortality were required.
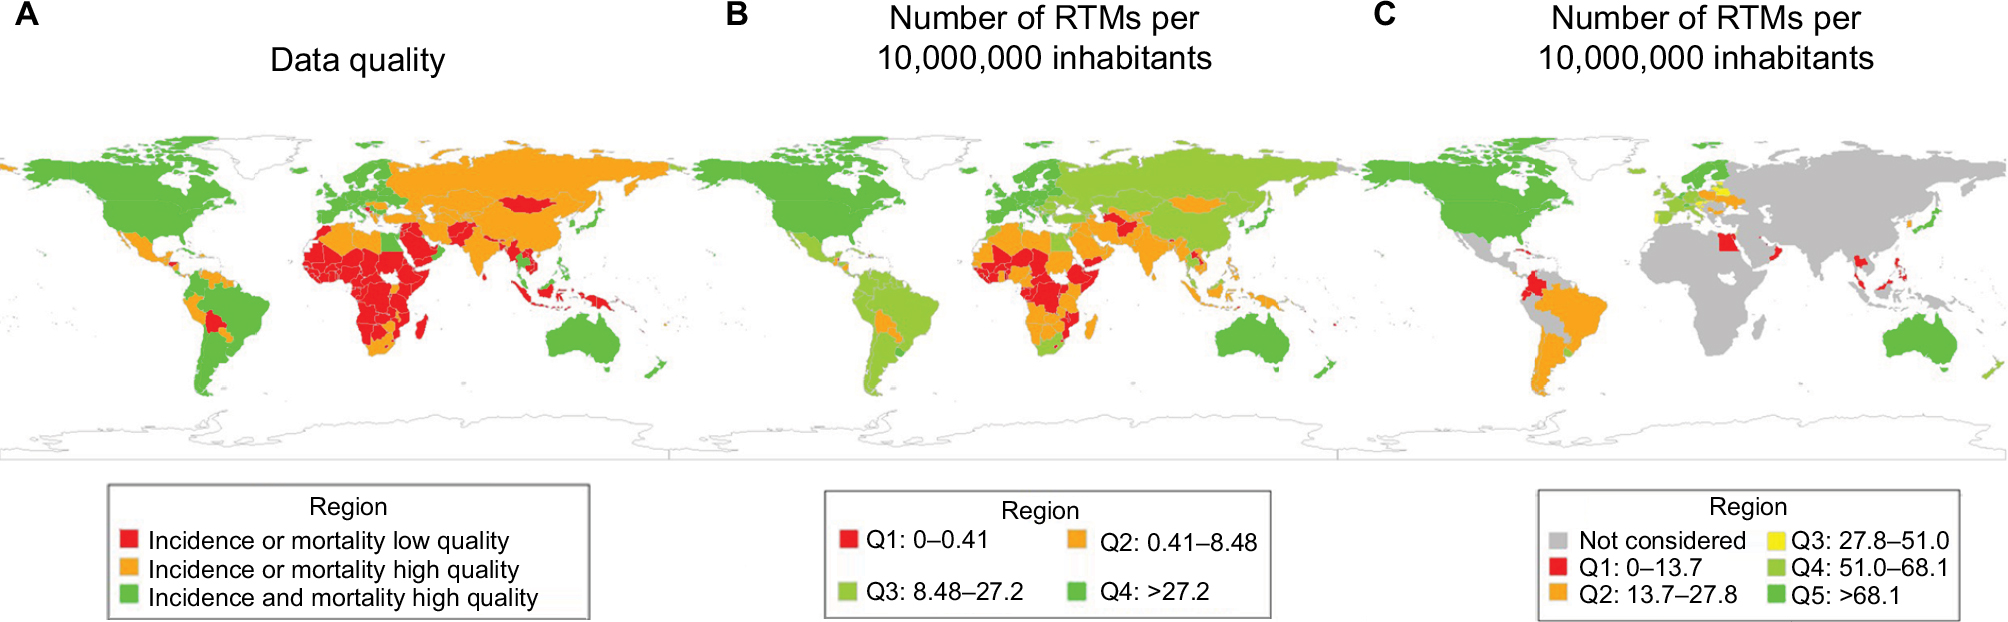 | Figure 1 Data quality and supply of RTMs. (A) Data quality by country. (B) Number of RTMs per 10,000,000 inhabitants. (C) Number of RTMs per 10,000,000 inhabitants (high-quality data only). Abbreviation: Q, Quantile; RTMs, radiotherapy treatment machines. |
World Bank data
We obtained data on the gross domestic product (GDP) per capita from the statistics provided for public use by the World Bank (http://data.worldbank.org). In addition to GDP (most relevant for our objectives), information on the number of surgical procedures (The Lancet Commission on Global Surgery), neonatal mortality rate (UN Inter-agency Group for Child Mortality Estimation), health expenditure per capita (World Health Organization Global Health Expenditure database), and infrastructure (https://lpi.worldbank.org/international) is provided.
WHO data
Data on mortality from noncommunicable diseases, screening programs for cervical cancer and disability-adjusted life years (DALYs) were derived from the WHO (http://www.who.int/gho/en/), and information on the median population age (2010) was obtained from the United Nations (World Population Prospects: The 2017 Revision)14
RT demand
Furthermore, we used the approach described by Barton et al11 to estimate the country-specific demand of RTMs in relation to population size. The following formula was applied.
|
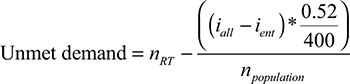
where nRT refers to the number of RTMs in the population (per 10,000,000 inhabitants), npopulation (per 10,000,000 in habitants) refers to the population size, iall refers to the number of incident cases of all cancer types, while ient refers to incident cases of the respective cancer type. Considering all cancer patients, the estimated proportion of cases that are expected to receive radiotherapy is 0.52. The term iall–ient stands for the total case number of all entities minus the case number of the respective entity to be analyzed. This was computed in order to avoid a possible bias as the case numbers also affect the outcome variable.
In total, 56 countries fulfilled these requirements (Figure 1). Finally, 53 countries had a complete data set and were considered for further analyses (one country, Bahrain, was excluded because no RTM was recorded; no information on infrastructure was available for Israel and Puerto Rico).
Statistical analyses
We considered the logarithmized ratio of the age-adjusted mortality and incidence as the outcome variables, which can be interpreted as the proportion of fatalities of all newly diagnosed cases. The number of RTMs per 10,000,000 inhabitants was the explanatory variable, which was again logarithmized due to a skewed distribution (thus excluding countries with no RTM).
For illustrative purposes, we estimated crude, nonlinear relations by means of the locally weighted scatterplot smoothing procedure,15 which uses local data to perform a polynomial regression and is, thus, a very flexible approach. In adjusted models, we performed a sensitivity analysis where restricted cubic splines (RCSs) with three knots were considered. Models including RCSs were compared with the linear model by computing the difference in the log likelihood between both models (chi-squared distribution with 2 df). Furthermore, we performed an analysis where RTM density was not log-transformed.
Methods to deal with a potential bias due to confounding are described in the following sections.
Covariate adjustment regression models
To begin with, we used the commonly applied approach of covariate adjustment to compute a bias-reduced estimate of the effect of RTMs on cancer survival. The selection of variables was based on directed acyclic graphs16 (Figure S1). Here, it was found that most importantly the following variables might be confounders: health care quality, demand of radiotherapy centers, population age, cultural barriers, health care expenditures, accessibility, machine quality, and surgical procedures. We cannot claim the list to be complete, but can claim to capture the most important confounders among others. Still, not all confounders are recorded in the available statistics, but can be, in part, approached by considering surrogates; eg, in the case of accessibility, we used the infrastructure score (https://lpi.worldbank.org/international) as a surrogate. Finally, models were adjusted for GDP, health care expenditure, the number of surgical procedures, infrastructure score, the negative control (see below), unmet demand for RTMs, DALYs, median population age, and population mortality. In addition, we adjusted for the mortality to incidence ratio for leukemia where Wong et al9 estimated the proportion of cases receiving radiotherapy to be 4%. The idea beyond adjusting for this type is closely linked to the negative control approach illustrated below. In short, the majority of public health parameters that might confound the association between RTM and cancer survival are captured by the leukemia-related mortality, while RTMs in turn are unlikely to affect the mortality due to leukemia itself (serving as a negative control).
Here, we display the results for the three most common cancer types in men and women including cervix cancer (lung, colorectal, breast, and prostate cancers; http://www.wcrf.org/int/cancer-facts-figures/worldwide-data).
Still, we consider covariate adjustment by means of confounders, the weakest approach to assess the potential confounder-related bias, as we cannot exclude residual confounding after the mentioned covariates were taken into account. Thus, we applied the concept of negative controls to estimate the potential bias within the presumed causal effect.
In addition, we performed the aforementioned regression analysis in countries with a low income (≤$4,035) according to Zubizarreta et al17 and additionally in countries with a poor data quality requiring A, B, or C or 1–3 for incidence and mortality, respectively.
Negative controls
The key idea of the negative controls approach is to select an alternative outcome that is not causally affected by the exposure of interest, which in our case is the number of RTMs, but has the same sources of bias18 as the actual outcome of interest. In the present analysis, we chose leukemia cancer mortality as the negative control. This condition has some favorable characteristics that make it a promising negative control outcome such as the little relevance of radiotherapy in its treatment. The optimal proportion of patients to receive RT for leukemia was only 4%.9 Thus, the survival of leukemia is assumed not to be affected by the RTM density, but it should share the same set of confounders, eg, availability and quality of health care, as the actual outcomes of survival in cancer types where radiotherapy is of higher relevance for the treatment. In contrast to liver cancer, where the estimated proportion was only 0%,9 leukemia does not suffer from biases that might result from infectious agents causing liver cancer.
Figure 2 illustrates the presumed associations. It is key to understand that unobserved confounders affect both leukemia and the number of RTMs, but the number of RTMs is unlikely to be the cause of leukemia mortality. In contrast, observed confounders, as mentioned above, affect the number of RTMs- and leukemia-related mortality. Conditional on both assumptions, leukemia might serve as a reliable negative control for the research question addressed.
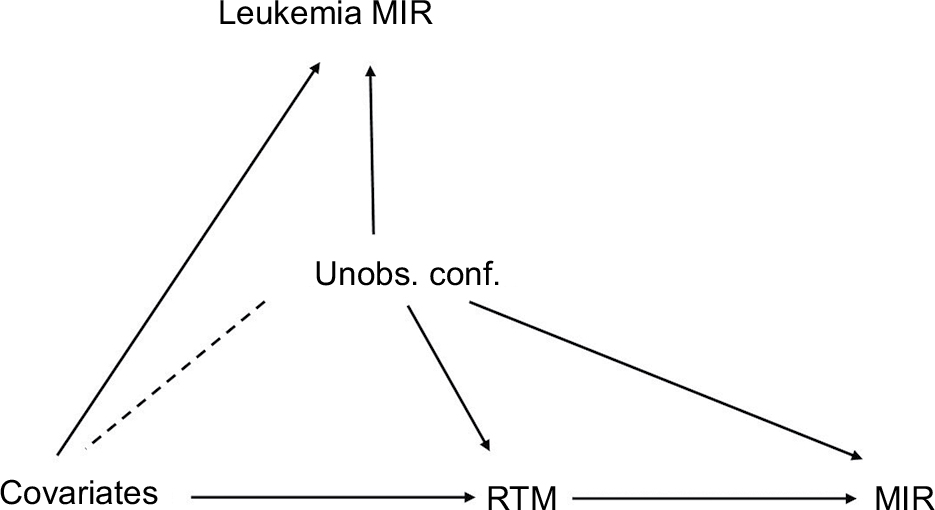 | Figure 2 Causal graph. Notes: The dashed line indicates the possibility of causal effect in both directions. This figure illustrates the relations that are discussed in Lispitch et al.13 Abbreviations: MIR, mortality/incidence ratio; RTM, radiotherapy treatment machine; Unobs. conf., unobserved confounders. |
To estimate the possible residual bias due to unaccounted confounders, we analyzed a regression model with the negative control as the outcome19 after adjusting for the actual outcome of interest (in our case, cancer mortality/incidence) plus covariates. If there was unmeasured confounding, we would expect an association between RTM density and the negative control outcome as mortality due to leukemia is expected to share the same set of confounders as, again, in those cancer types where radiotherapy is of greater relevance. Effect estimates of this bias analysis can be interpreted analogous to the primary analyses. A CI excluding the null effect value of 0 can be regarded as indicating a statistical significant bias. As a sensitivity analysis, we also considered ovarian cancer in women and kidney cancer in men as alternative negative controls.
Analysis of effect sizes in relation to the proportion of cases treated with radiotherapy
Following the argumentation by Hill20 for causal relations, we would expect an increasing effect size for the association between RTMs and cancer survival as the estimated proportion of cases receiving radiotherapy increases. We studied this relation by means of a linear model for the 10 most common sex-specific cancer types considering the effect size of previous analyses as the outcome and the proportion of RT cases based on the CCORE-EBEST tool9 as the independent variable. Entities were inversely weighted for the width of the respective CIs. Outliers with an overtly high influence on the effect estimation in the linear regression models (defined by a Cook’s distance ≥1) were excluded from the analysis. To account for a high impact of palliative cases in some cancers where radiotherapy is not expected to have a relevant effect on survival, we performed a sensitivity analysis adjusting the model for the median of cancer survival (mortality to incidence ratio) as a surrogate for the amount of palliative cases.
All computations were performed using R Version 3.3.1.21
Results
Table 1 provides the basic characteristics of the countries taken into account for further analysis. The central association of RTM density with GDP is displayed in Figure S2 where we found a linear relation until a GDP per capita of $60,000.
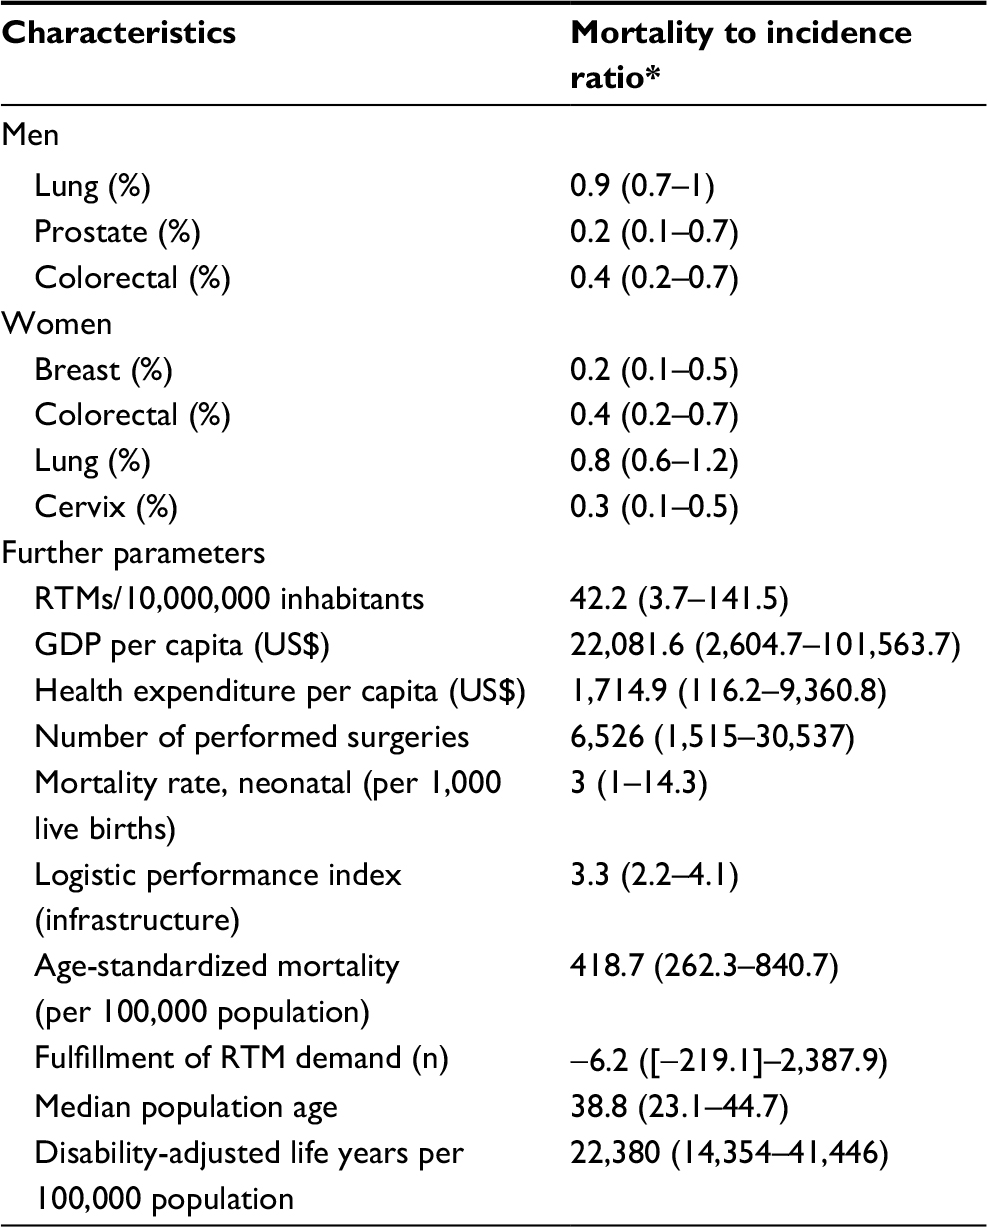 | Table 1 Country characteristics Note: *Mortality to incidence ratio with 95% CI. Abbreviations: GDP, gross domestic product; RTMs, radiotherapy treatment machines. |
Covariate adjustment regression models
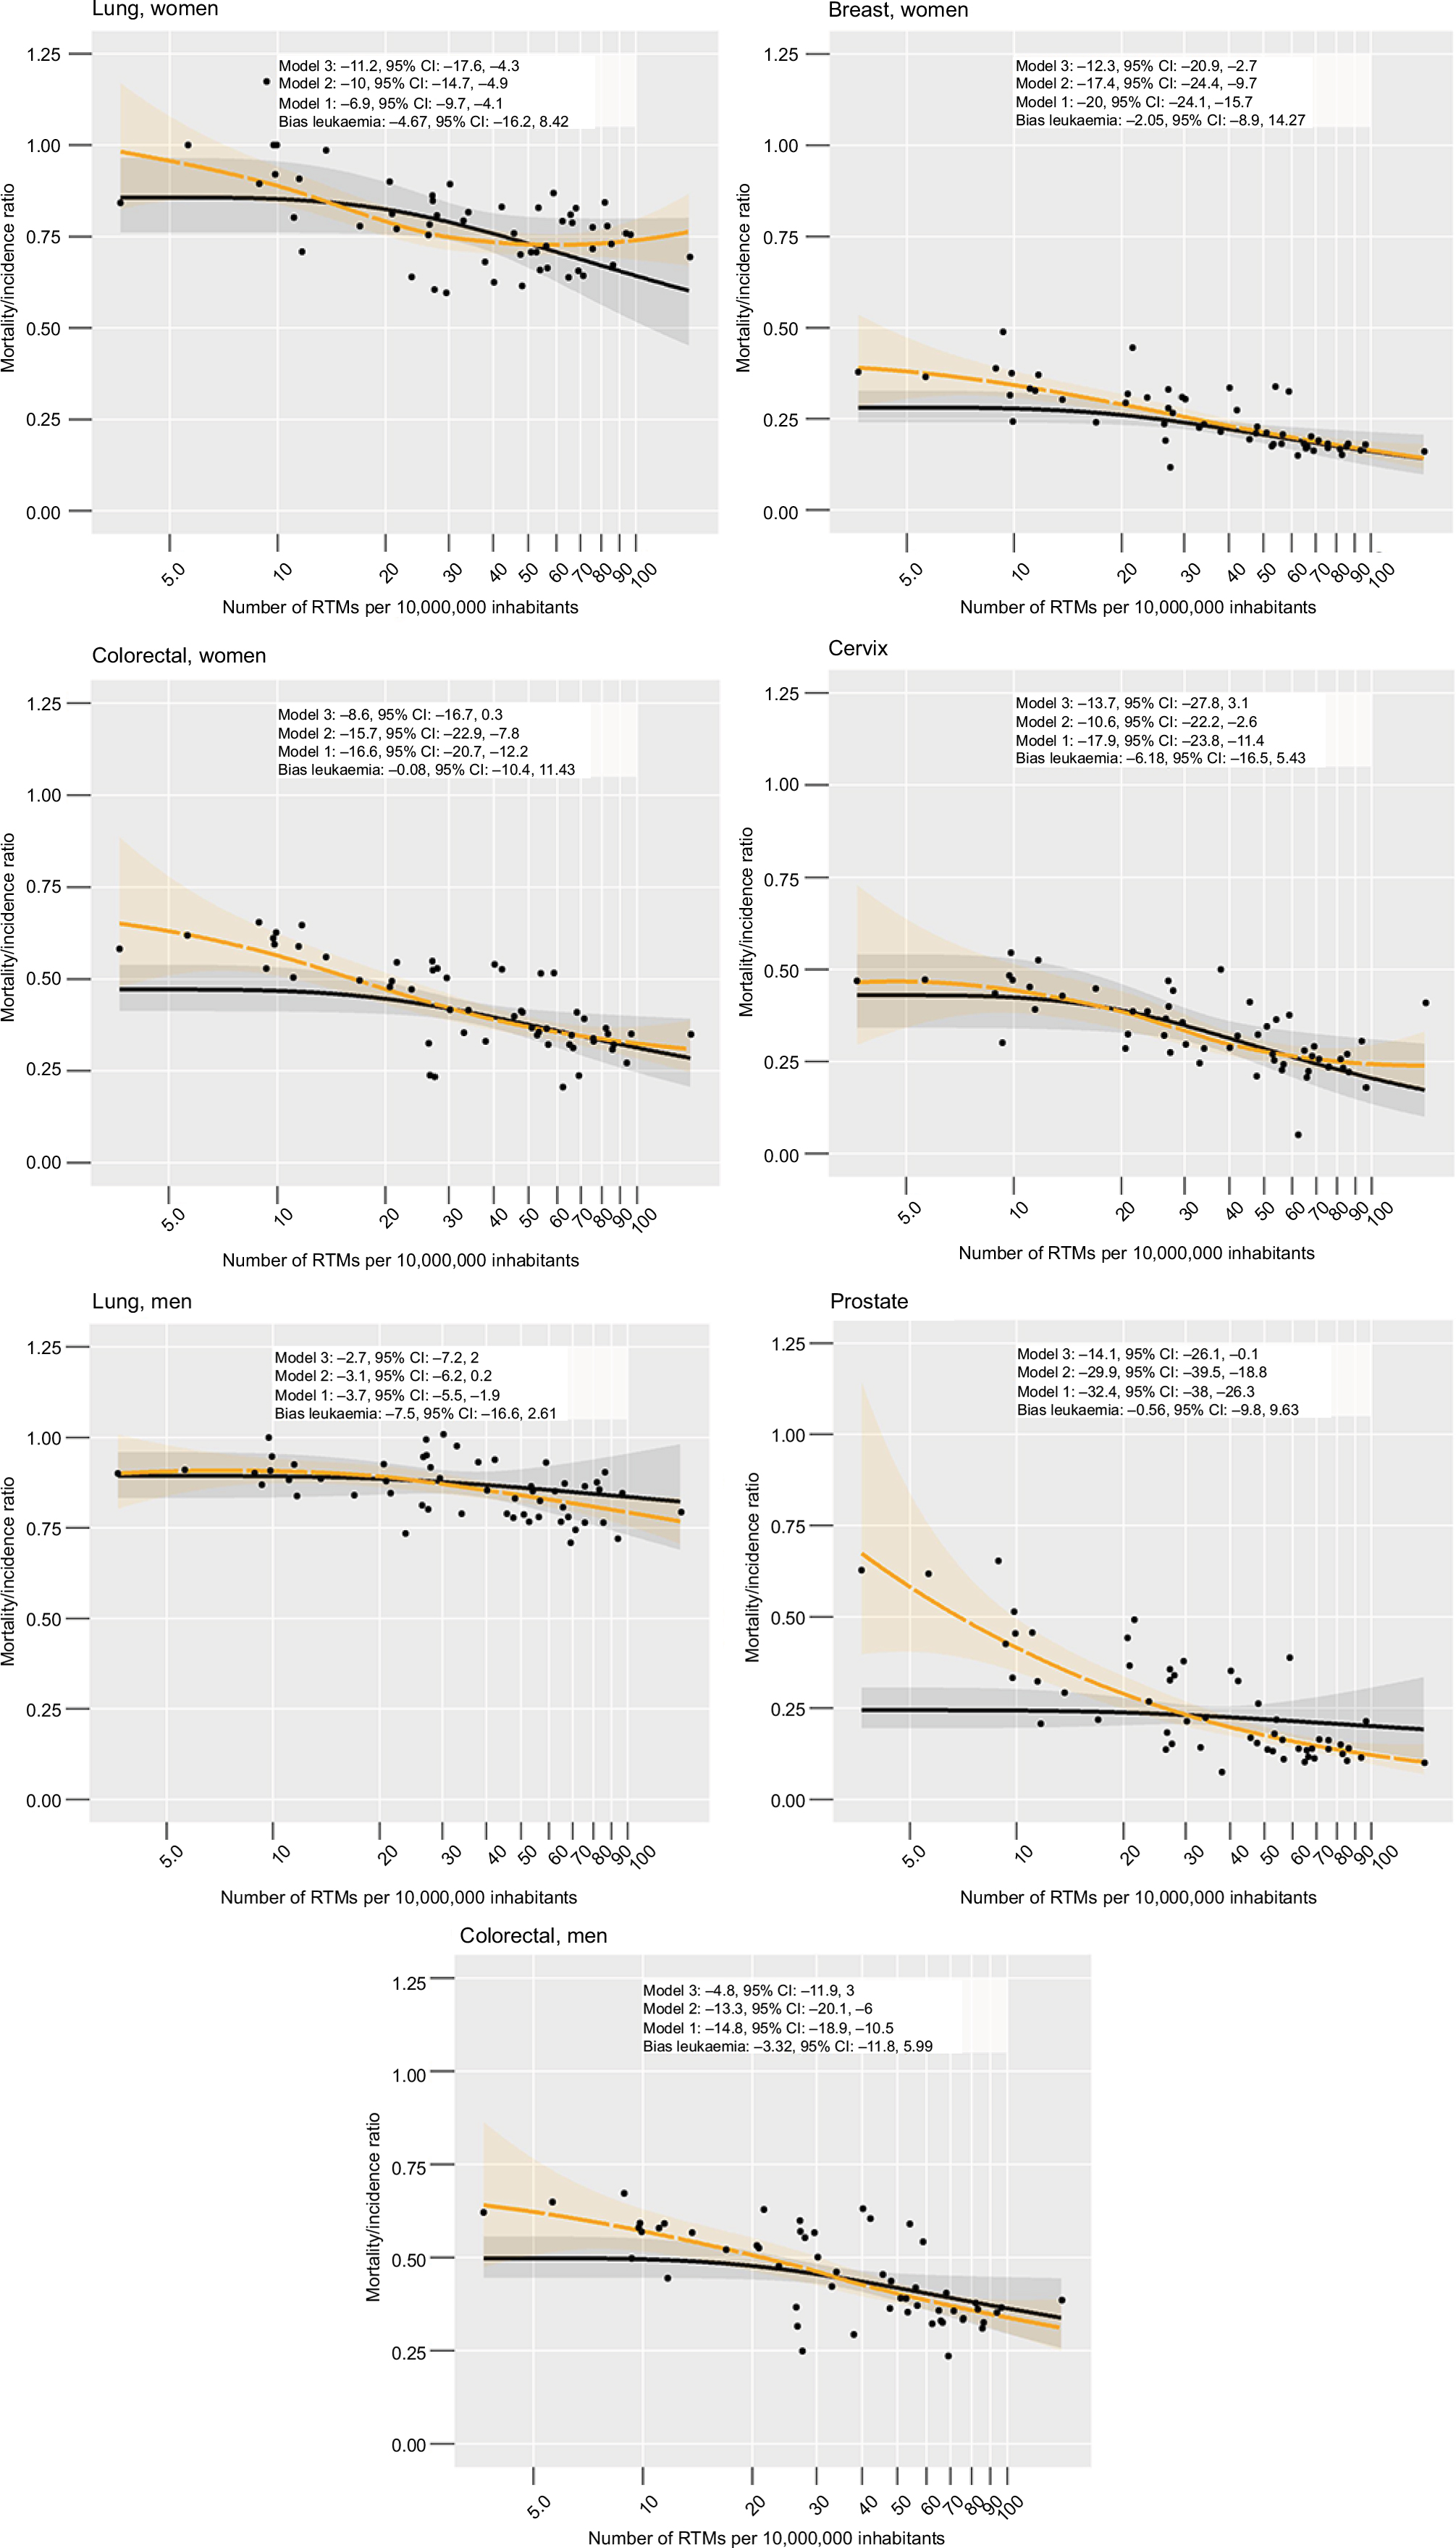
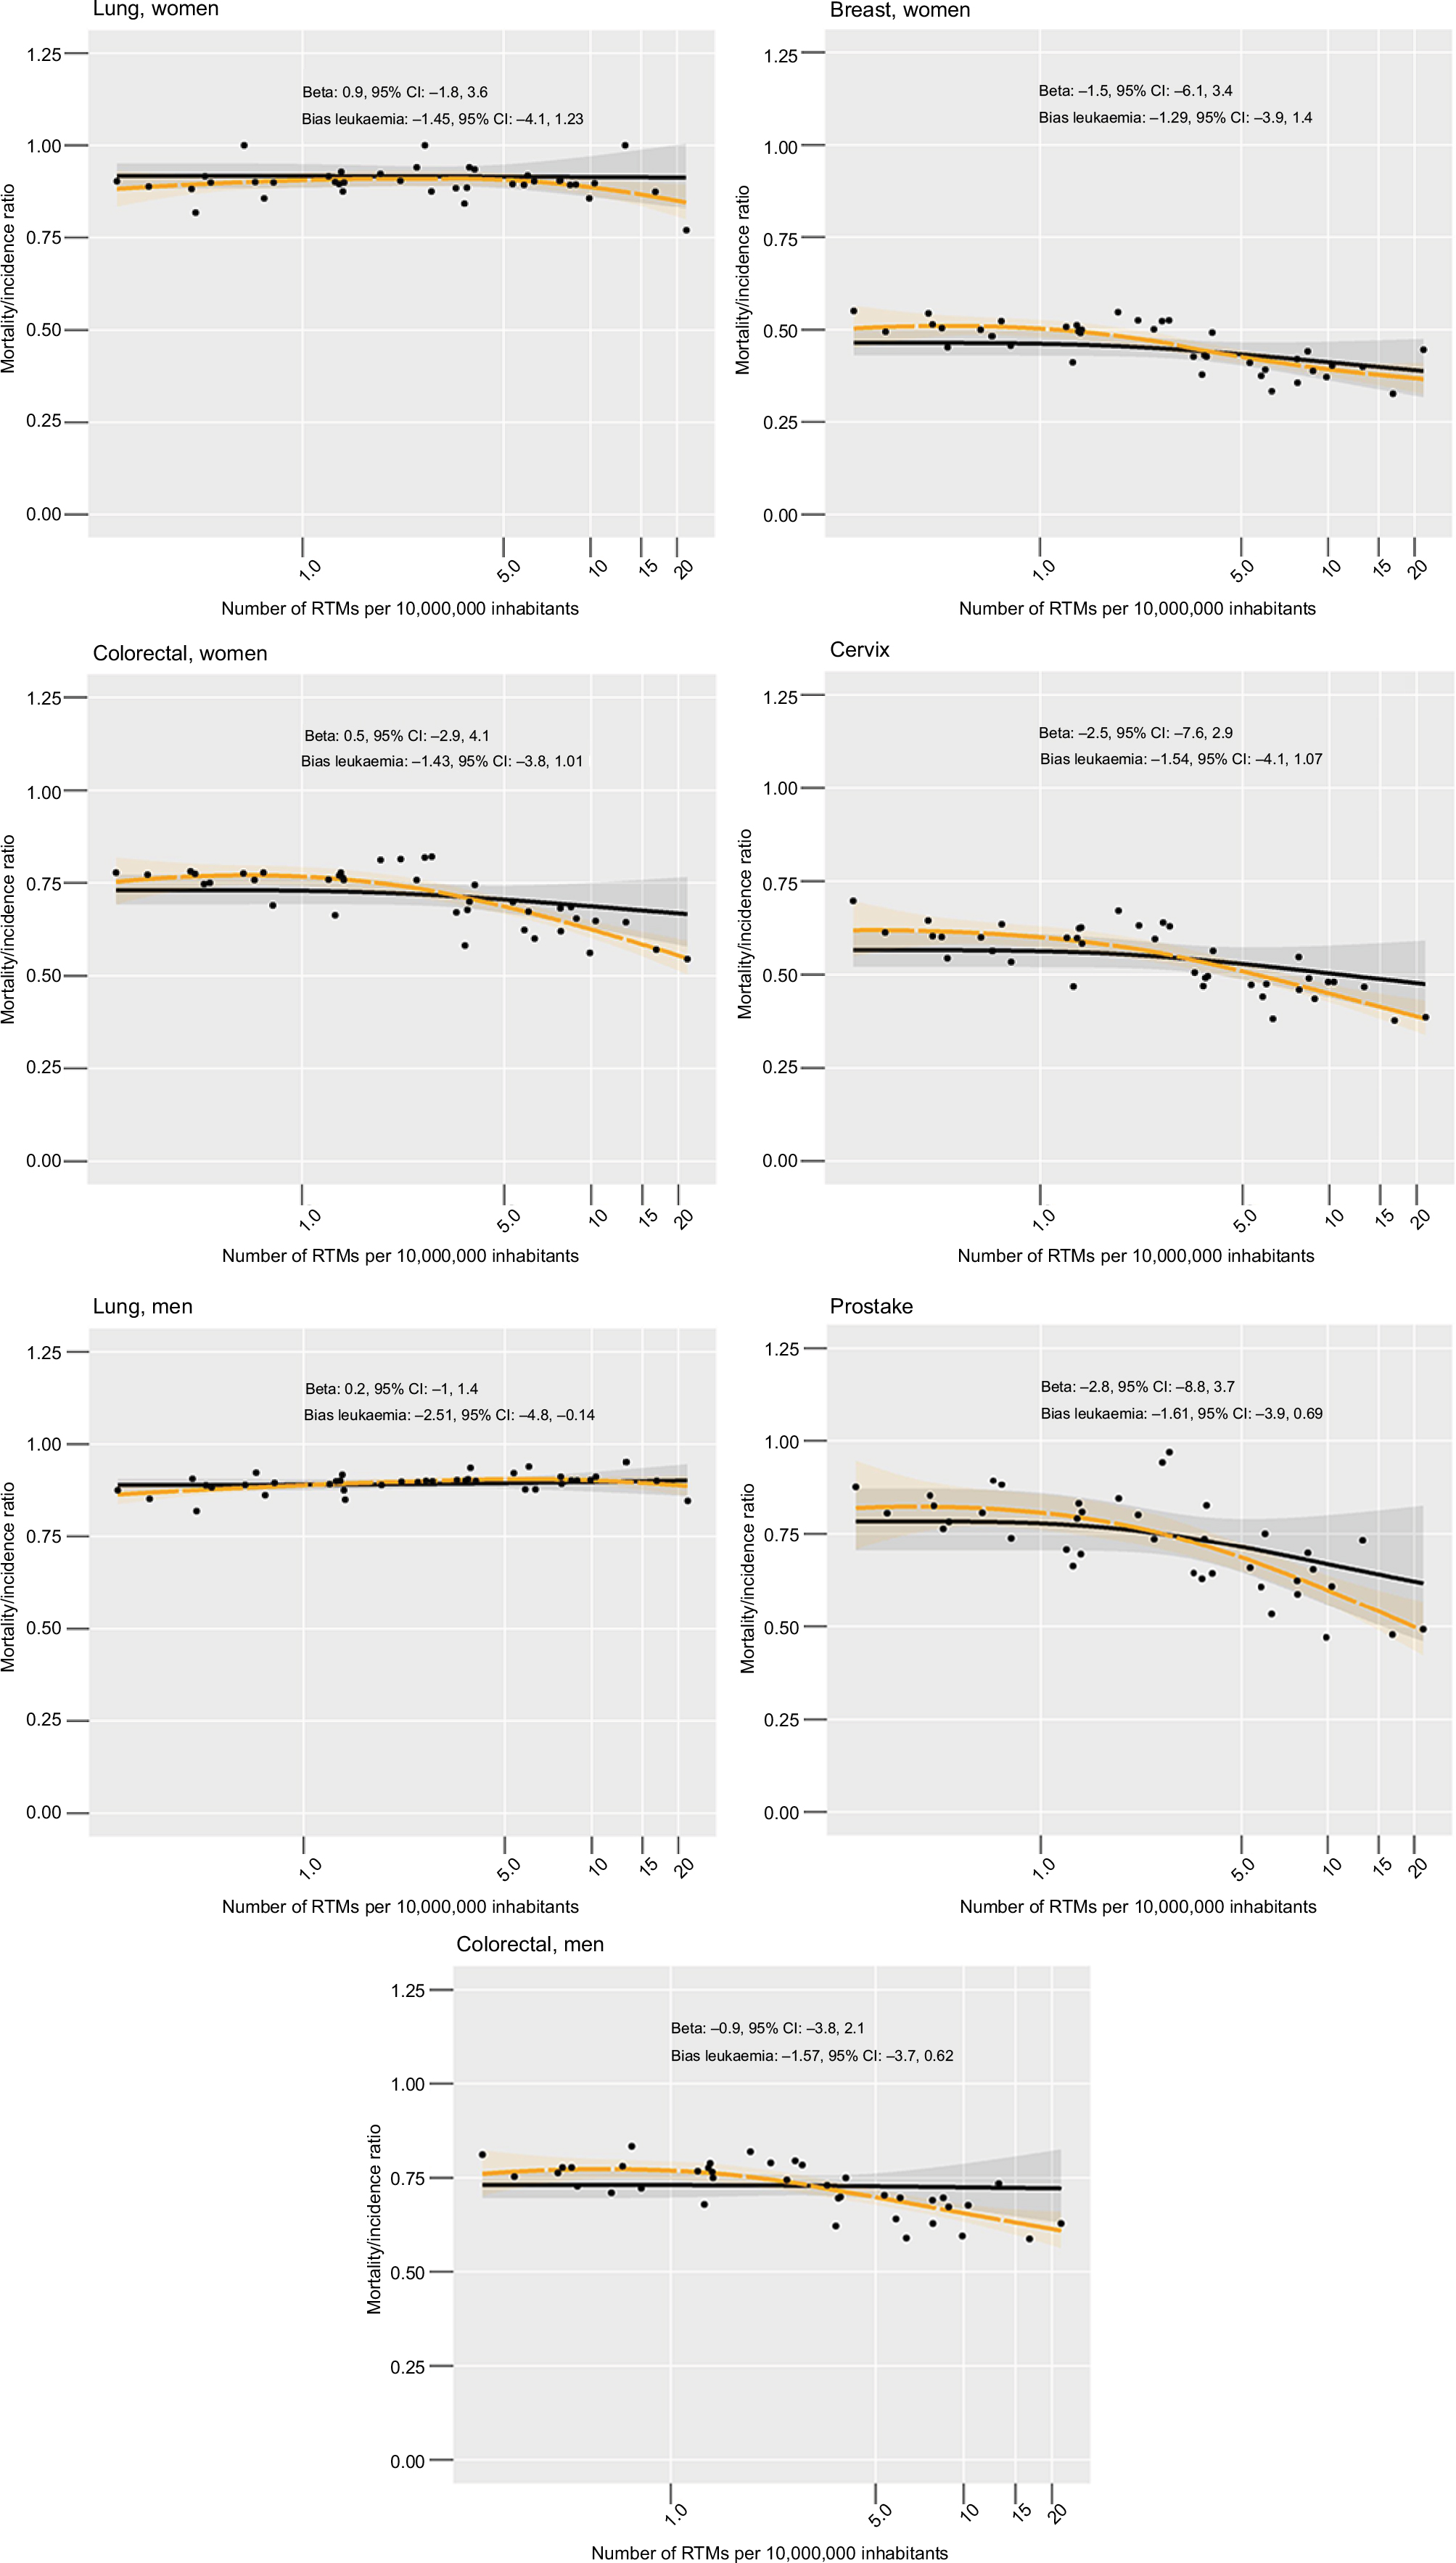
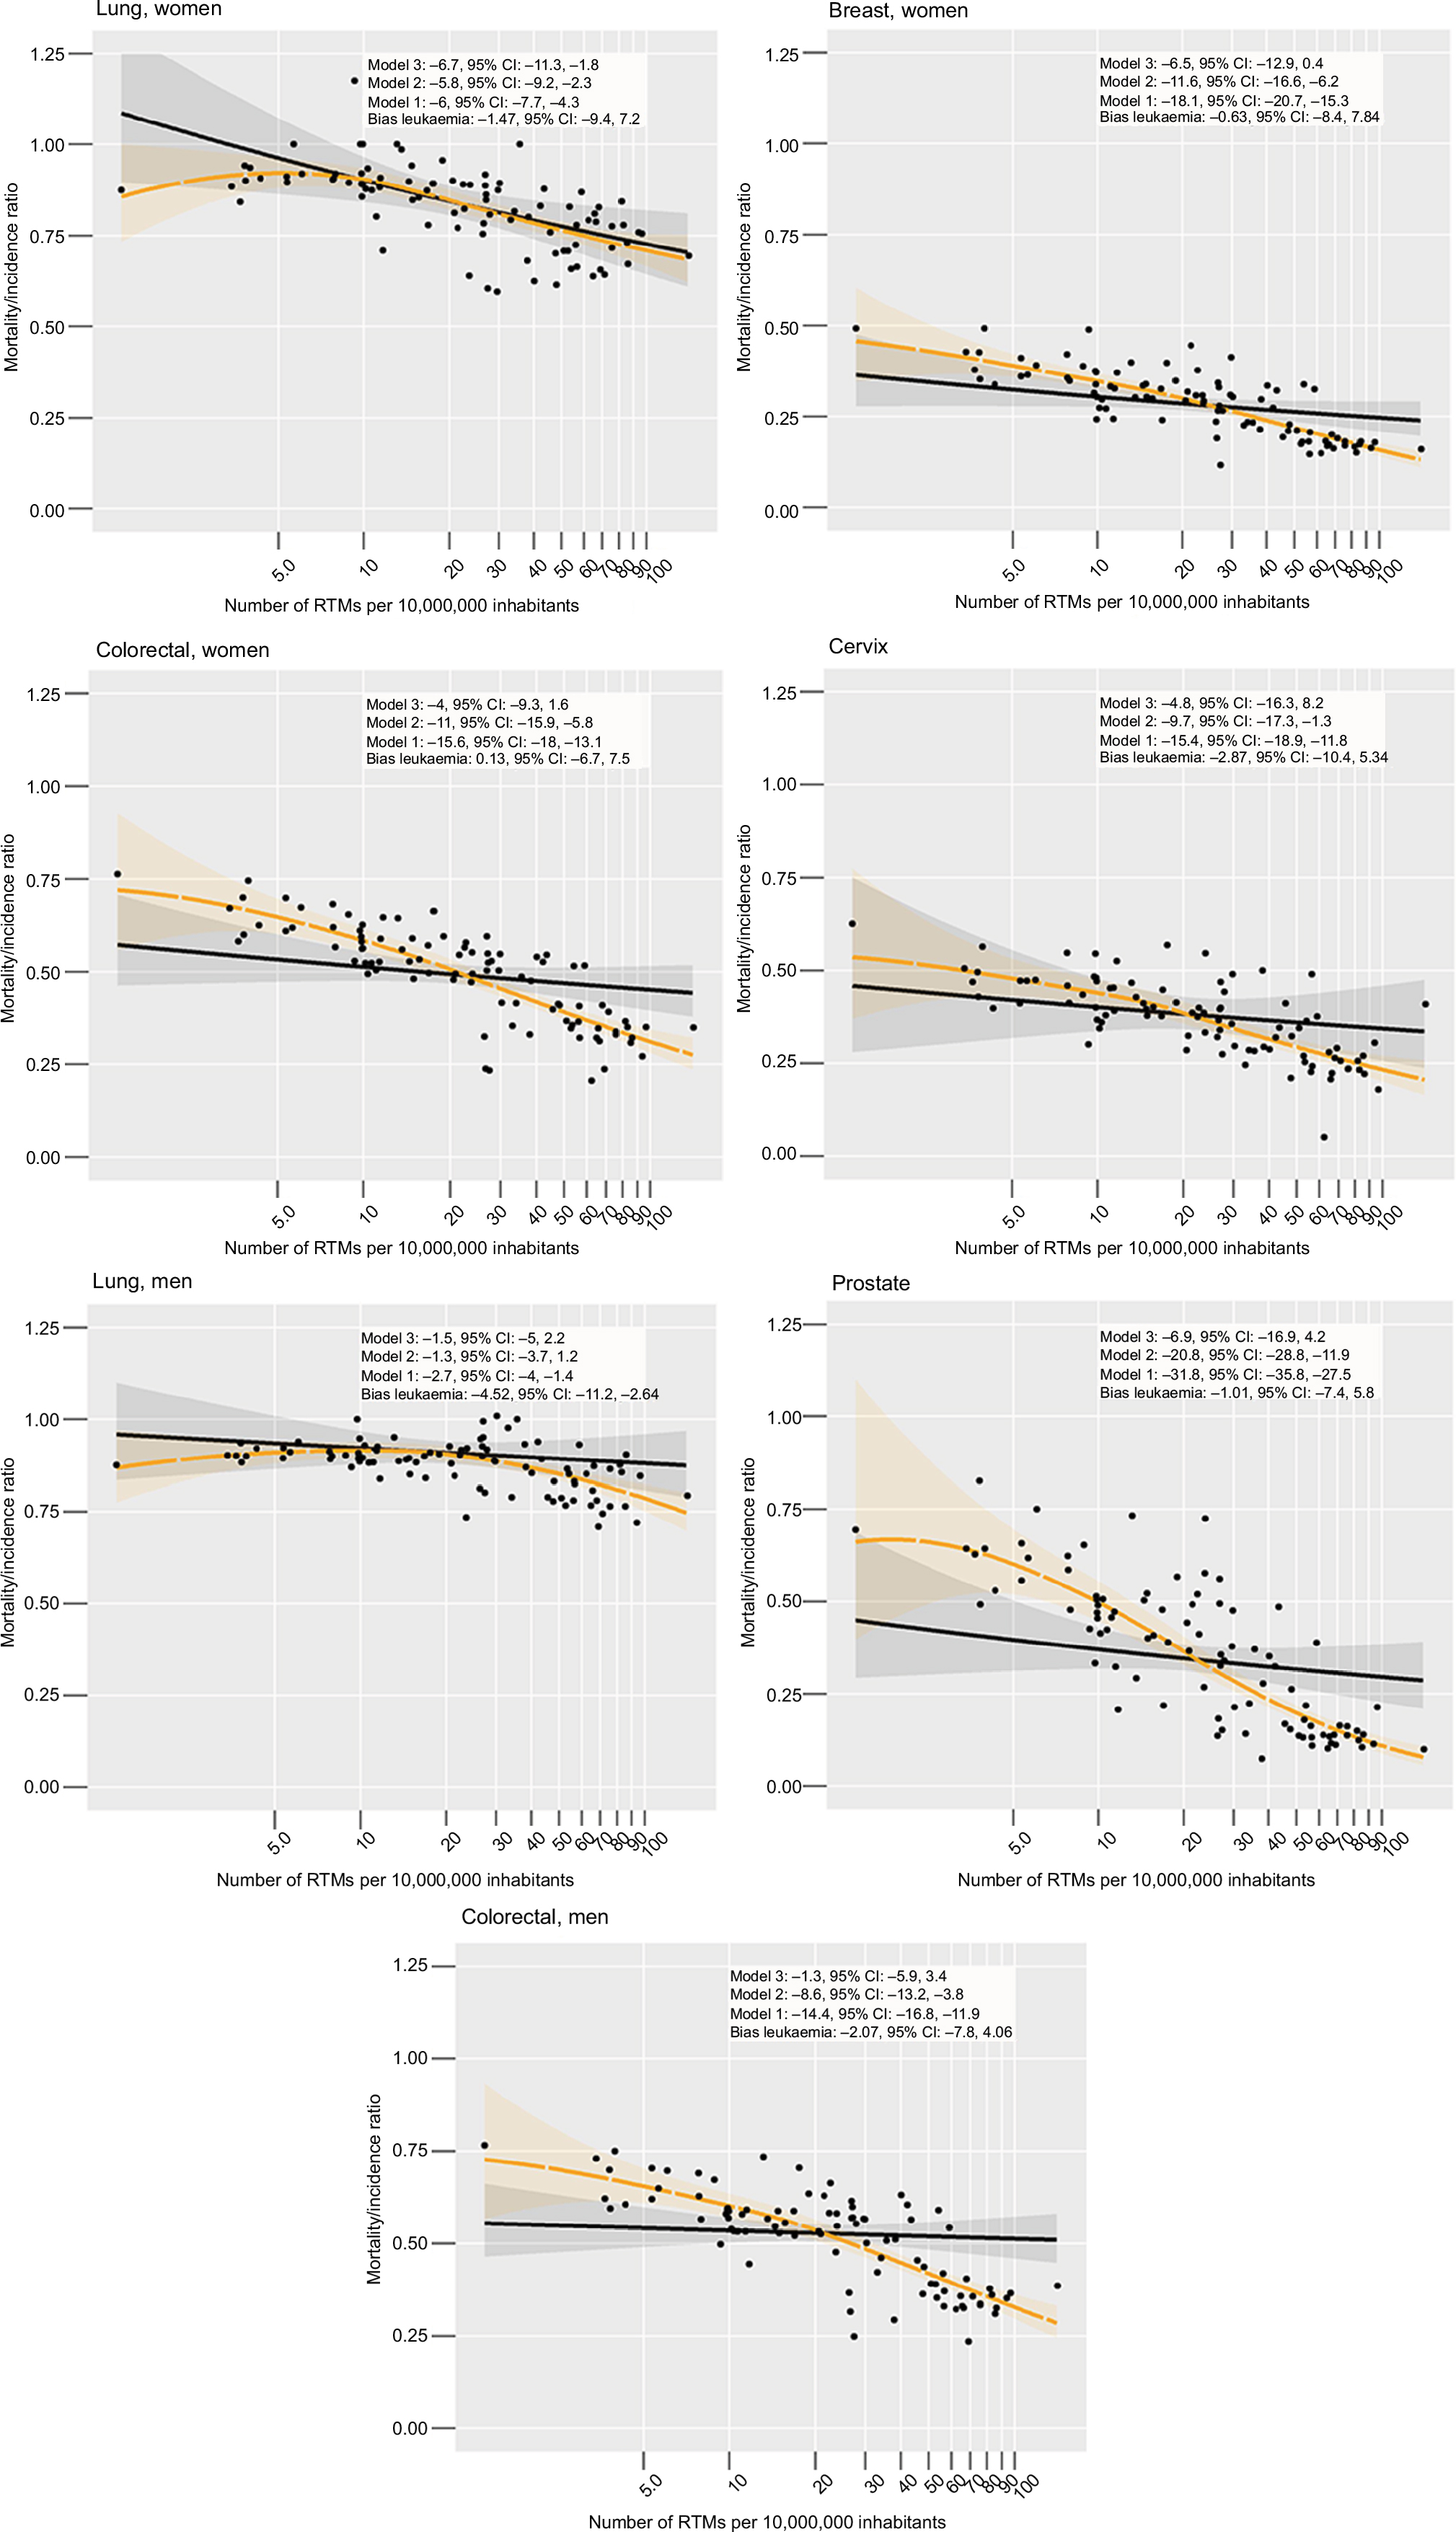
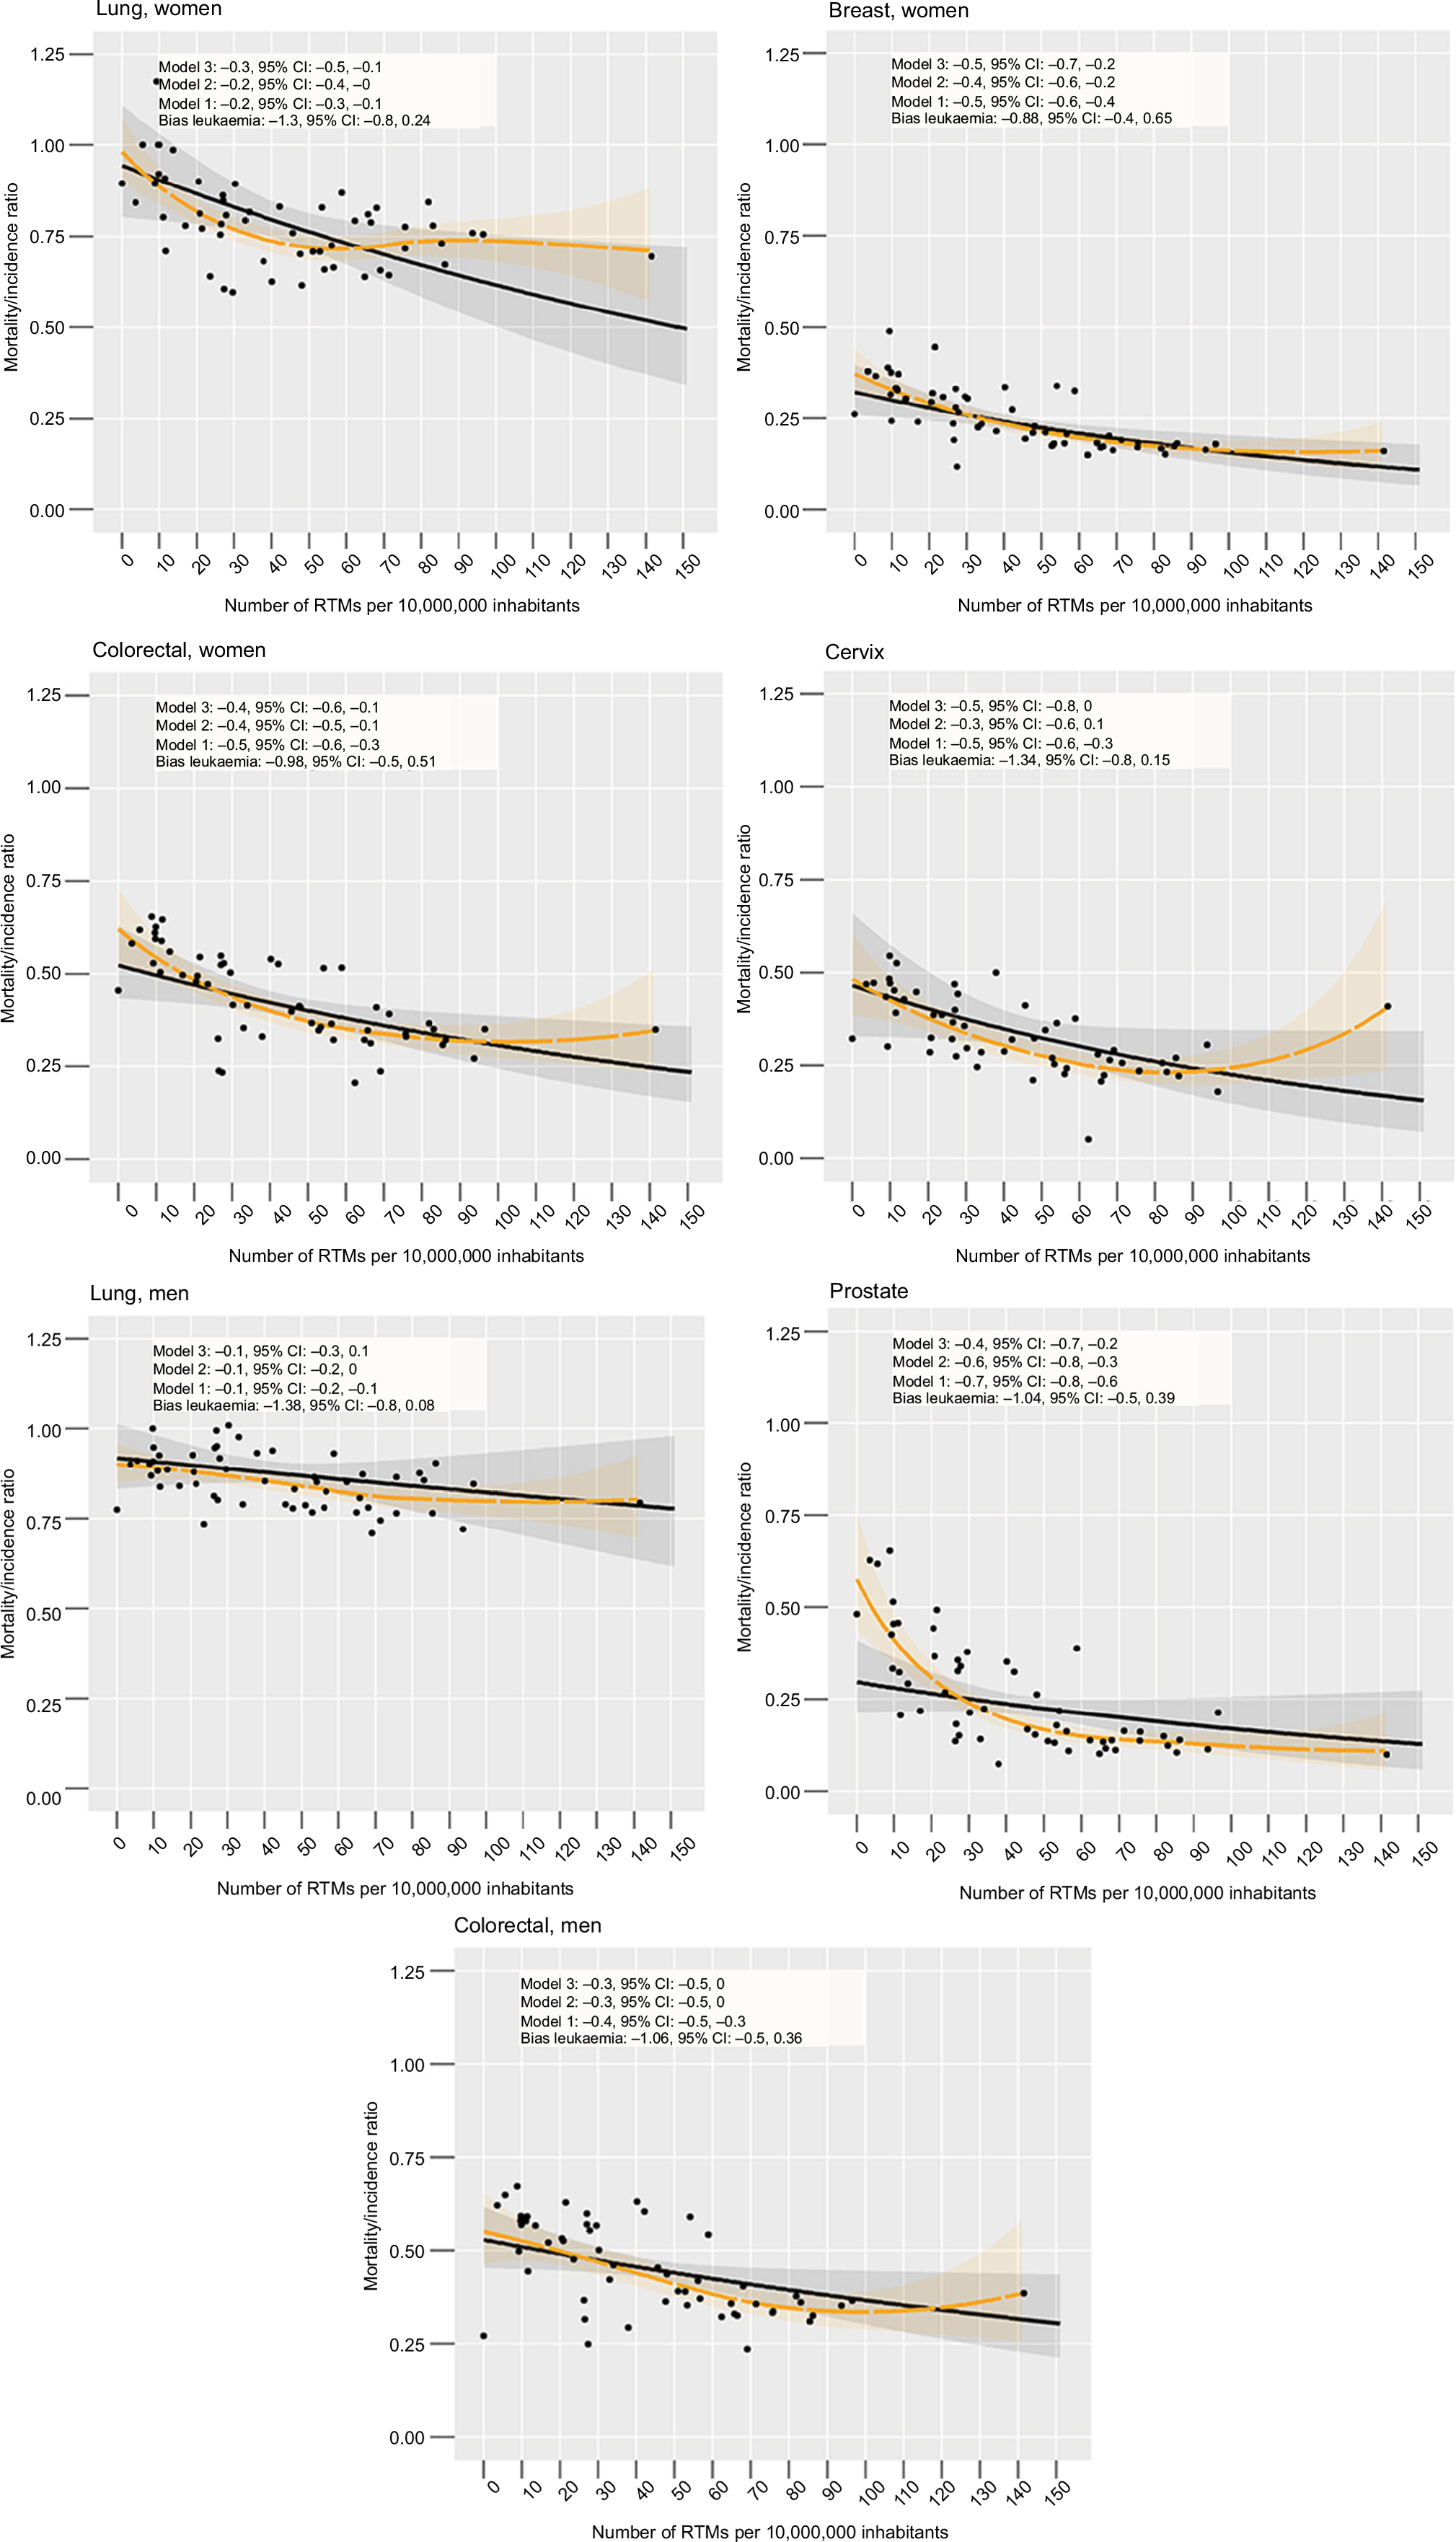
In regression analyses (Figure 3), we found an inverse association between the number of RTMs in the population and the mortality/incidence ratio for women in lung cancer (−11.2% per twofold increase in RTMs; 95% CI: −17.6, −4.3) and breast cancer (−12.3; 95% CI: −20.9, −2.7) and for men in prostate cancer (−14.1; 95% CI: −26.1, −0.1). That is, in the case of female lung cancer, we found that the mortality/incidence ratio decreased by roughly 11.2% as the number of machines per 10,000,000 inhabitants doubled.
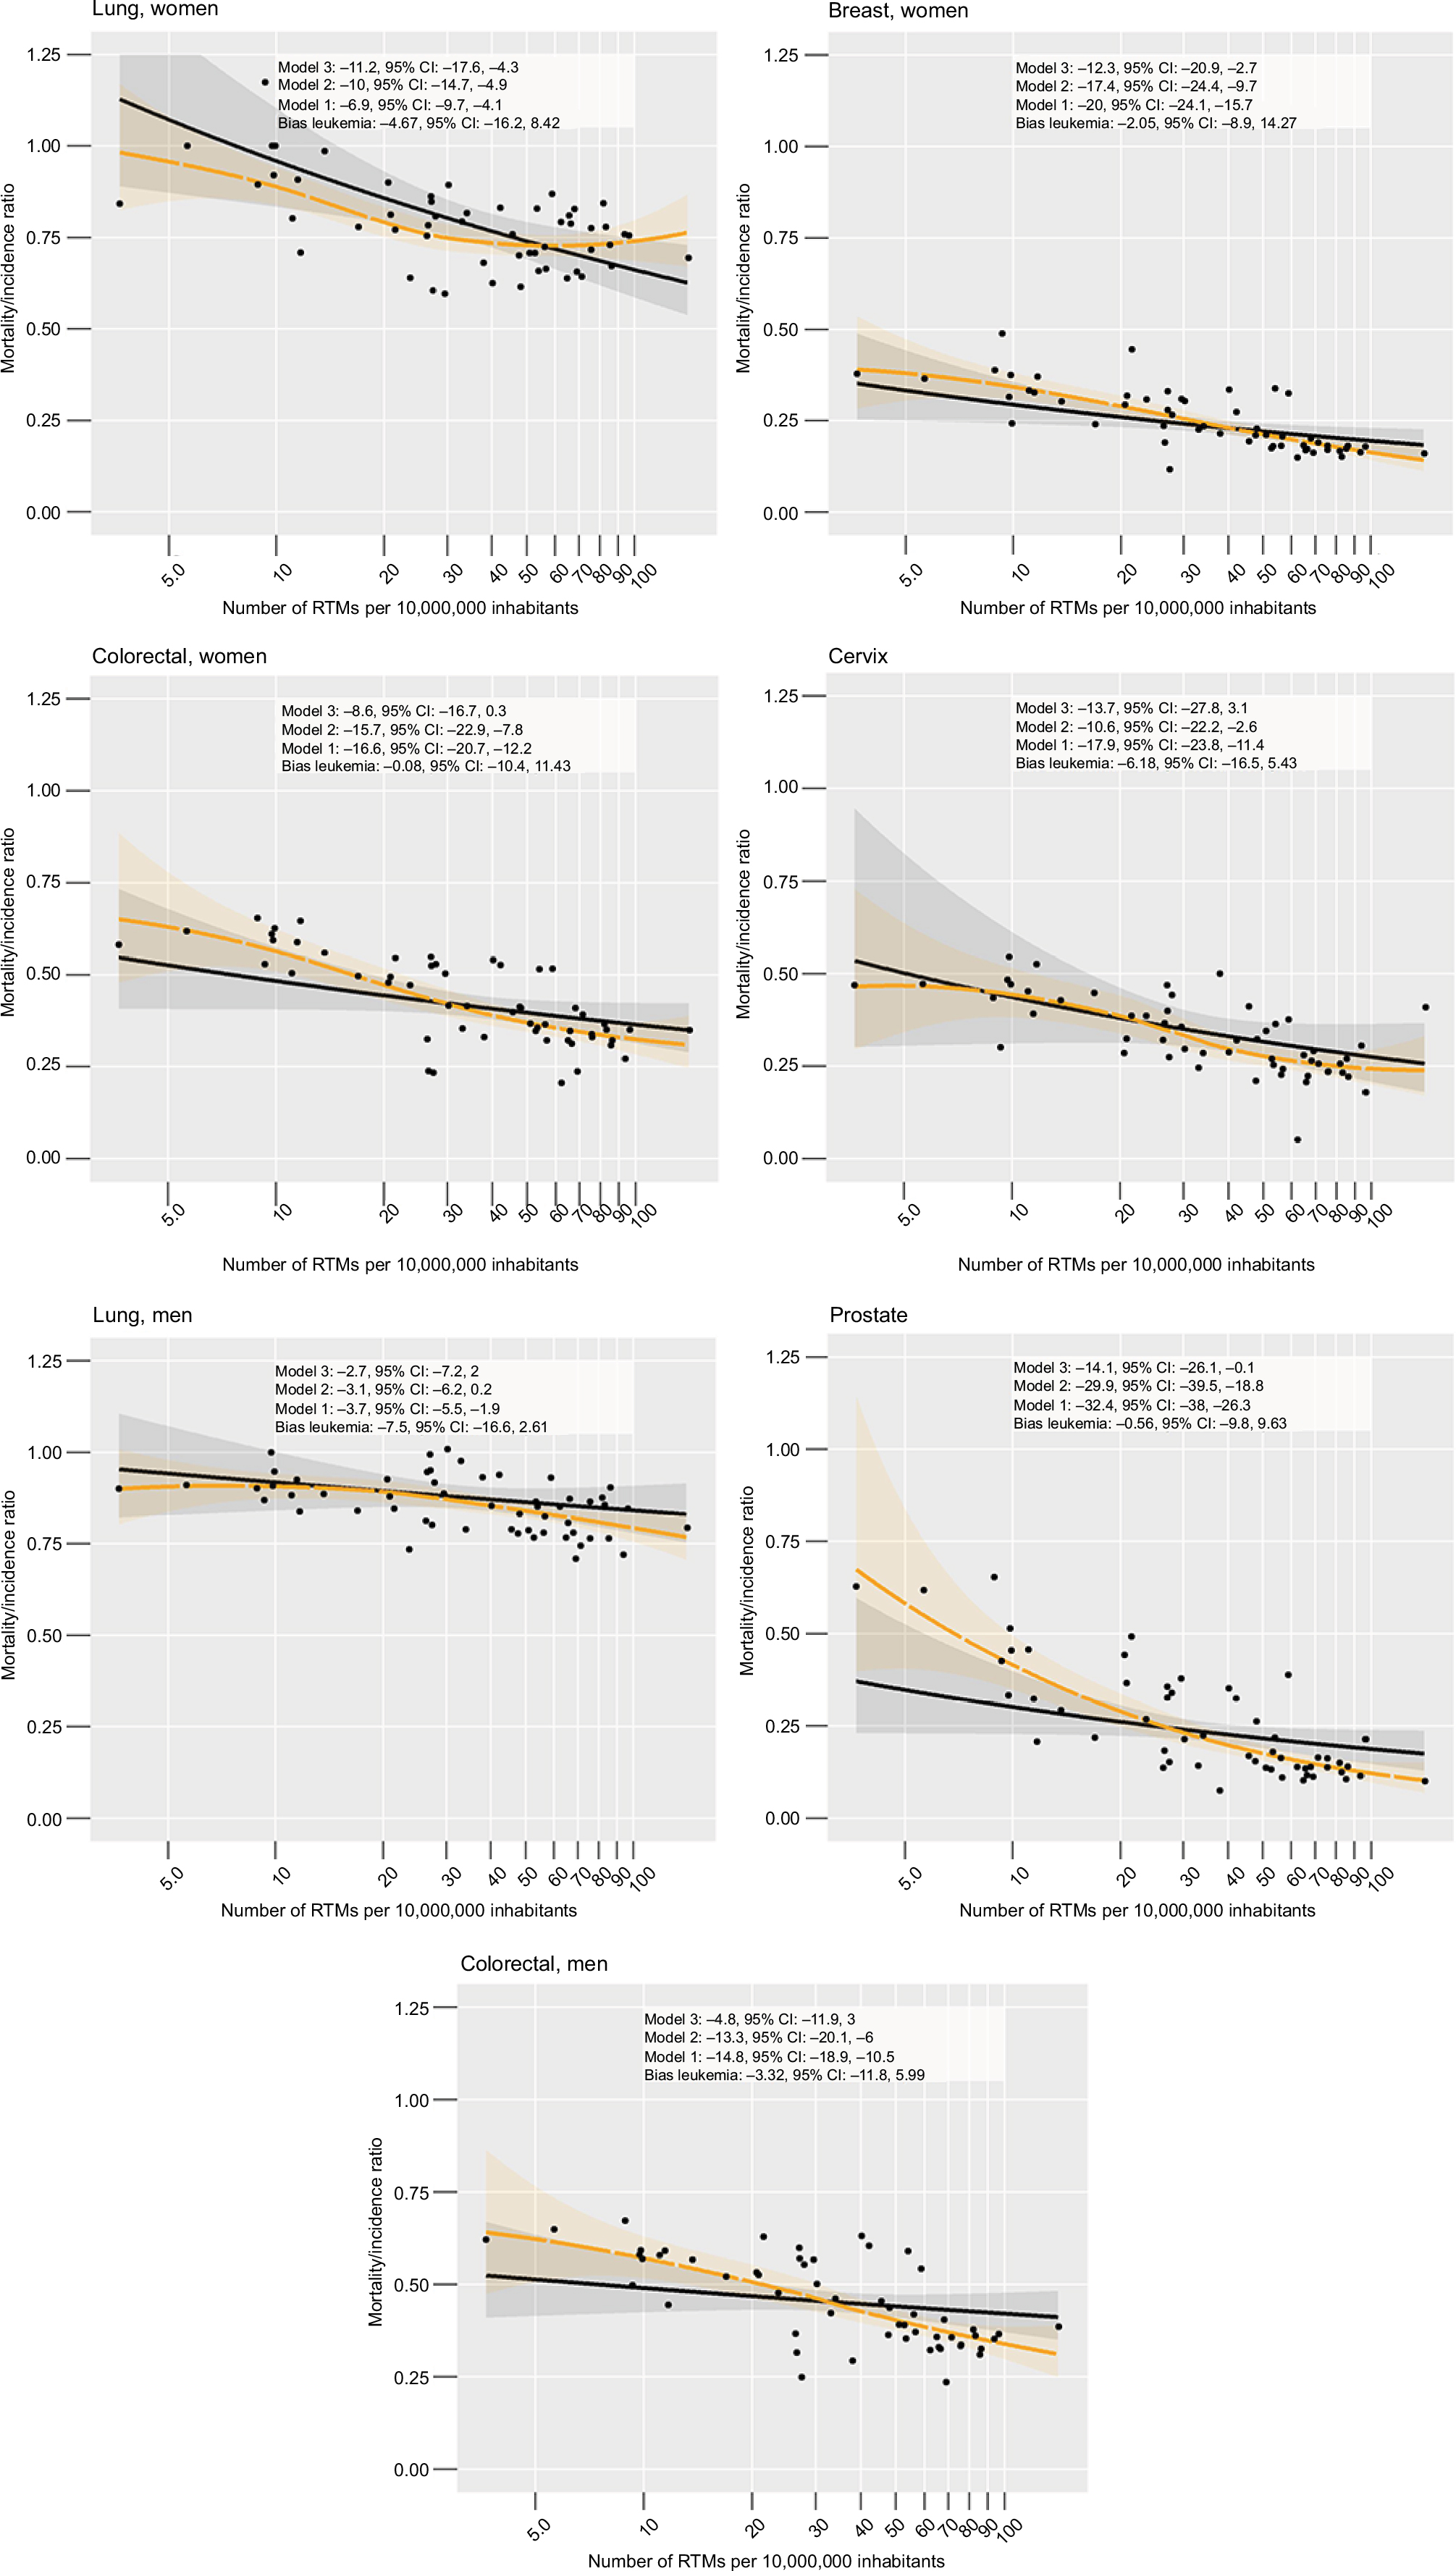 | Figure 3 Observed estimated associations between the MIR and RTMs per 10,000,000 inhabitants. Notes: Gray band: 95% CI. Black line: predicted effects as estimated from the adjusted model. Yellow lines and band: estimates of the LOESS procedure15 with respective 95% CI. Model 1: full model adjusted for GDP, health care expenditure, the number of surgical procedures, infrastructure score, the negative control, unmet demand for RTMs, median population age, population mortality, and the presence of a cervix screening program in the analysis of cervix cancer. Model 2: reduced model adjusted for GDP, health care expenditure, the number of surgical procedures, median population age, and the presence of a cervix screening program in the analysis cervix cancer. Model 3: crude model. Abbreviations: GDP, gross domestic product; LOESS, locally weighted scatterplot smoothing; MIR, mortality/incidence ratio; RTMs, radiotherapy treatment machines. |
In models considering RCSs, we found no density of RTM where the effect reaches a plateau (ceiling effect), but rather it seems that below a density of 30 RTM per 10,000,000 inhabitants, there is no association between RTM and cancer survival (Figure S3). Only in cervix and colorectal cancer in men, there was a weak evidence for the model including cubic splines with three knots to be superior to a linear model (P=0.10) and thus limited evidence for a threshold effect.
Negative controls and bias assessment
In determining the effect of potential bias in these findings, we found no statistically significant bias when the observed covariates were taken into account. Especially, the small magnitude of a potential bias becomes apparent when those estimates are compared with the effect estimates in analyses where a significant relation between RTMs and cancer mortality was found (Figure 3). Taking ovarian and kidney cancer as negative controls into account, we found no evidence for bias in the former case, while there was some evidence in lung cancer when kidney cancer served as a negative control in men (Figure S4).
In models where the negative control variable was not included as a covariate, we found the strongest change in the effect size in colorectal cancer in men (42.9%) and women (19.6%; Figures S5 and 3; model 2).
Analysis of effect sizes in relation to the proportion of cases treated with radiotherapy
For women, we found a statistically significant association between the proportion of cases receiving radiotherapy and the estimated cancer type-specific effect size (P=0.02; Figure 4). Here thyroid cancer was identified as an outlier (Cook’s distance =1.5). However, a similar relation could not be confirmed for men (Figure 5). In the sensitivity analysis adjusted for the median of cancer survival, we found a minor decrease in the P-value (P=0.01), while the β remained virtually unaltered (results not shown).
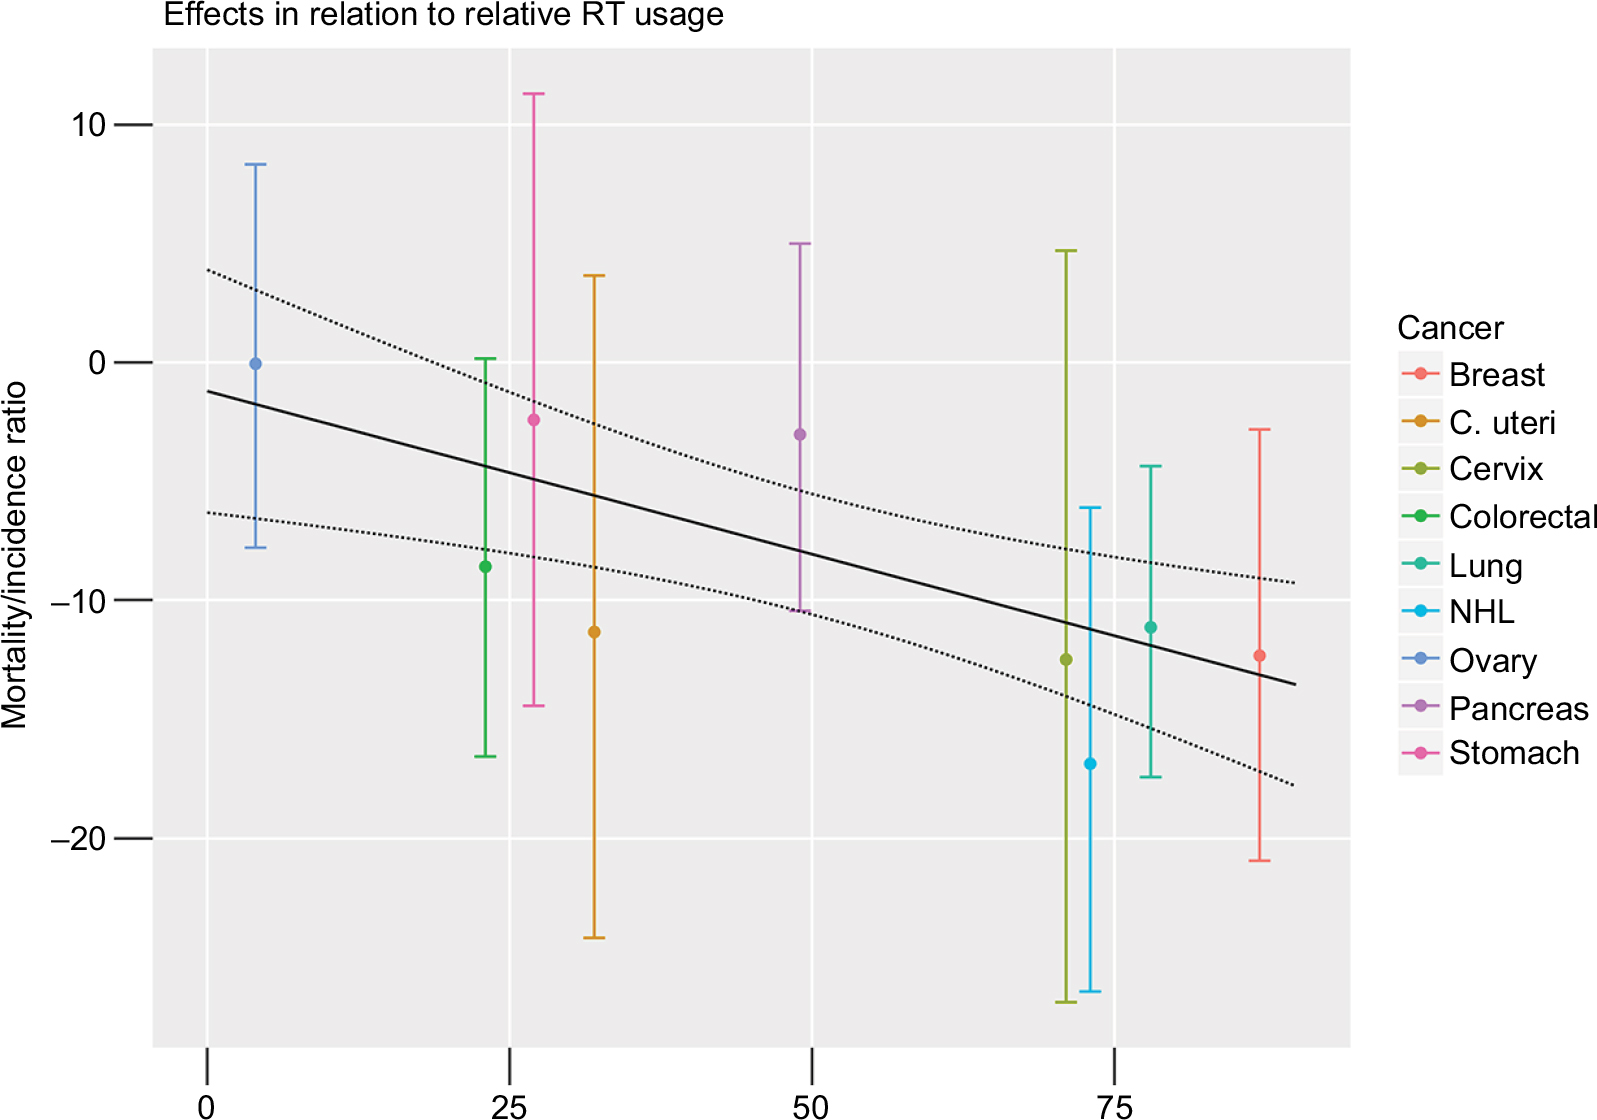 | Figure 4 Linear regression of effect size (association between the mortality to incidence ratio and RTMs) on the cancer type-specific proportion of patients receiving radiotherapy in women. Note: The proportion of patients receiving radiotherapy is based on Wong et al.9 Abbreviations: C. uteri, corpus uteri; NHL, Non-Hodgkin Lymphoma; RT, radiotherapy treatment; RTMs, radiotherapy treatment machines. |
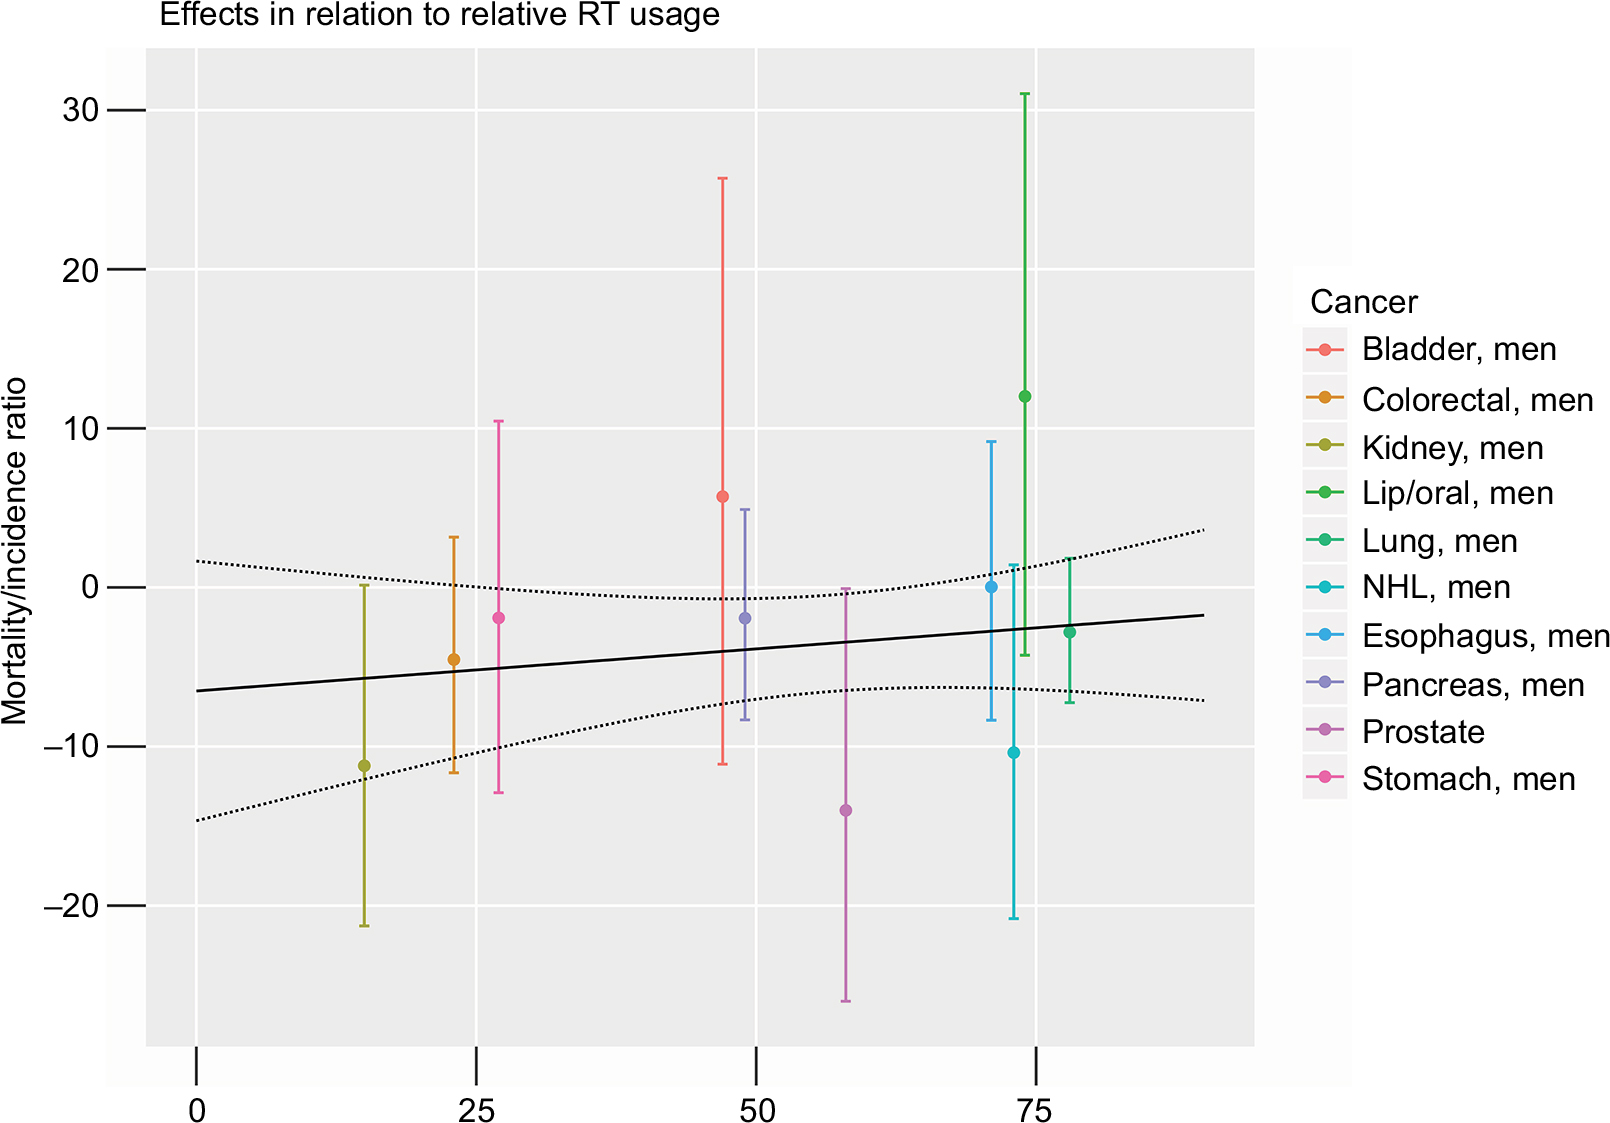 | Figure 5 Linear regression of effect size (association between the mortality to incidence ratio and radiotherapy treatment machines) on the cancer type-specific proportion of patients receiving radiotherapy in men. Note: The proportion of patients receiving radiotherapy is based on Wong et al.9 Abbreviation: NHL, Non-Hodgkin Lymphoma; RT, radiotherapy treatment. |
Sensitivity analysis of countries with low income
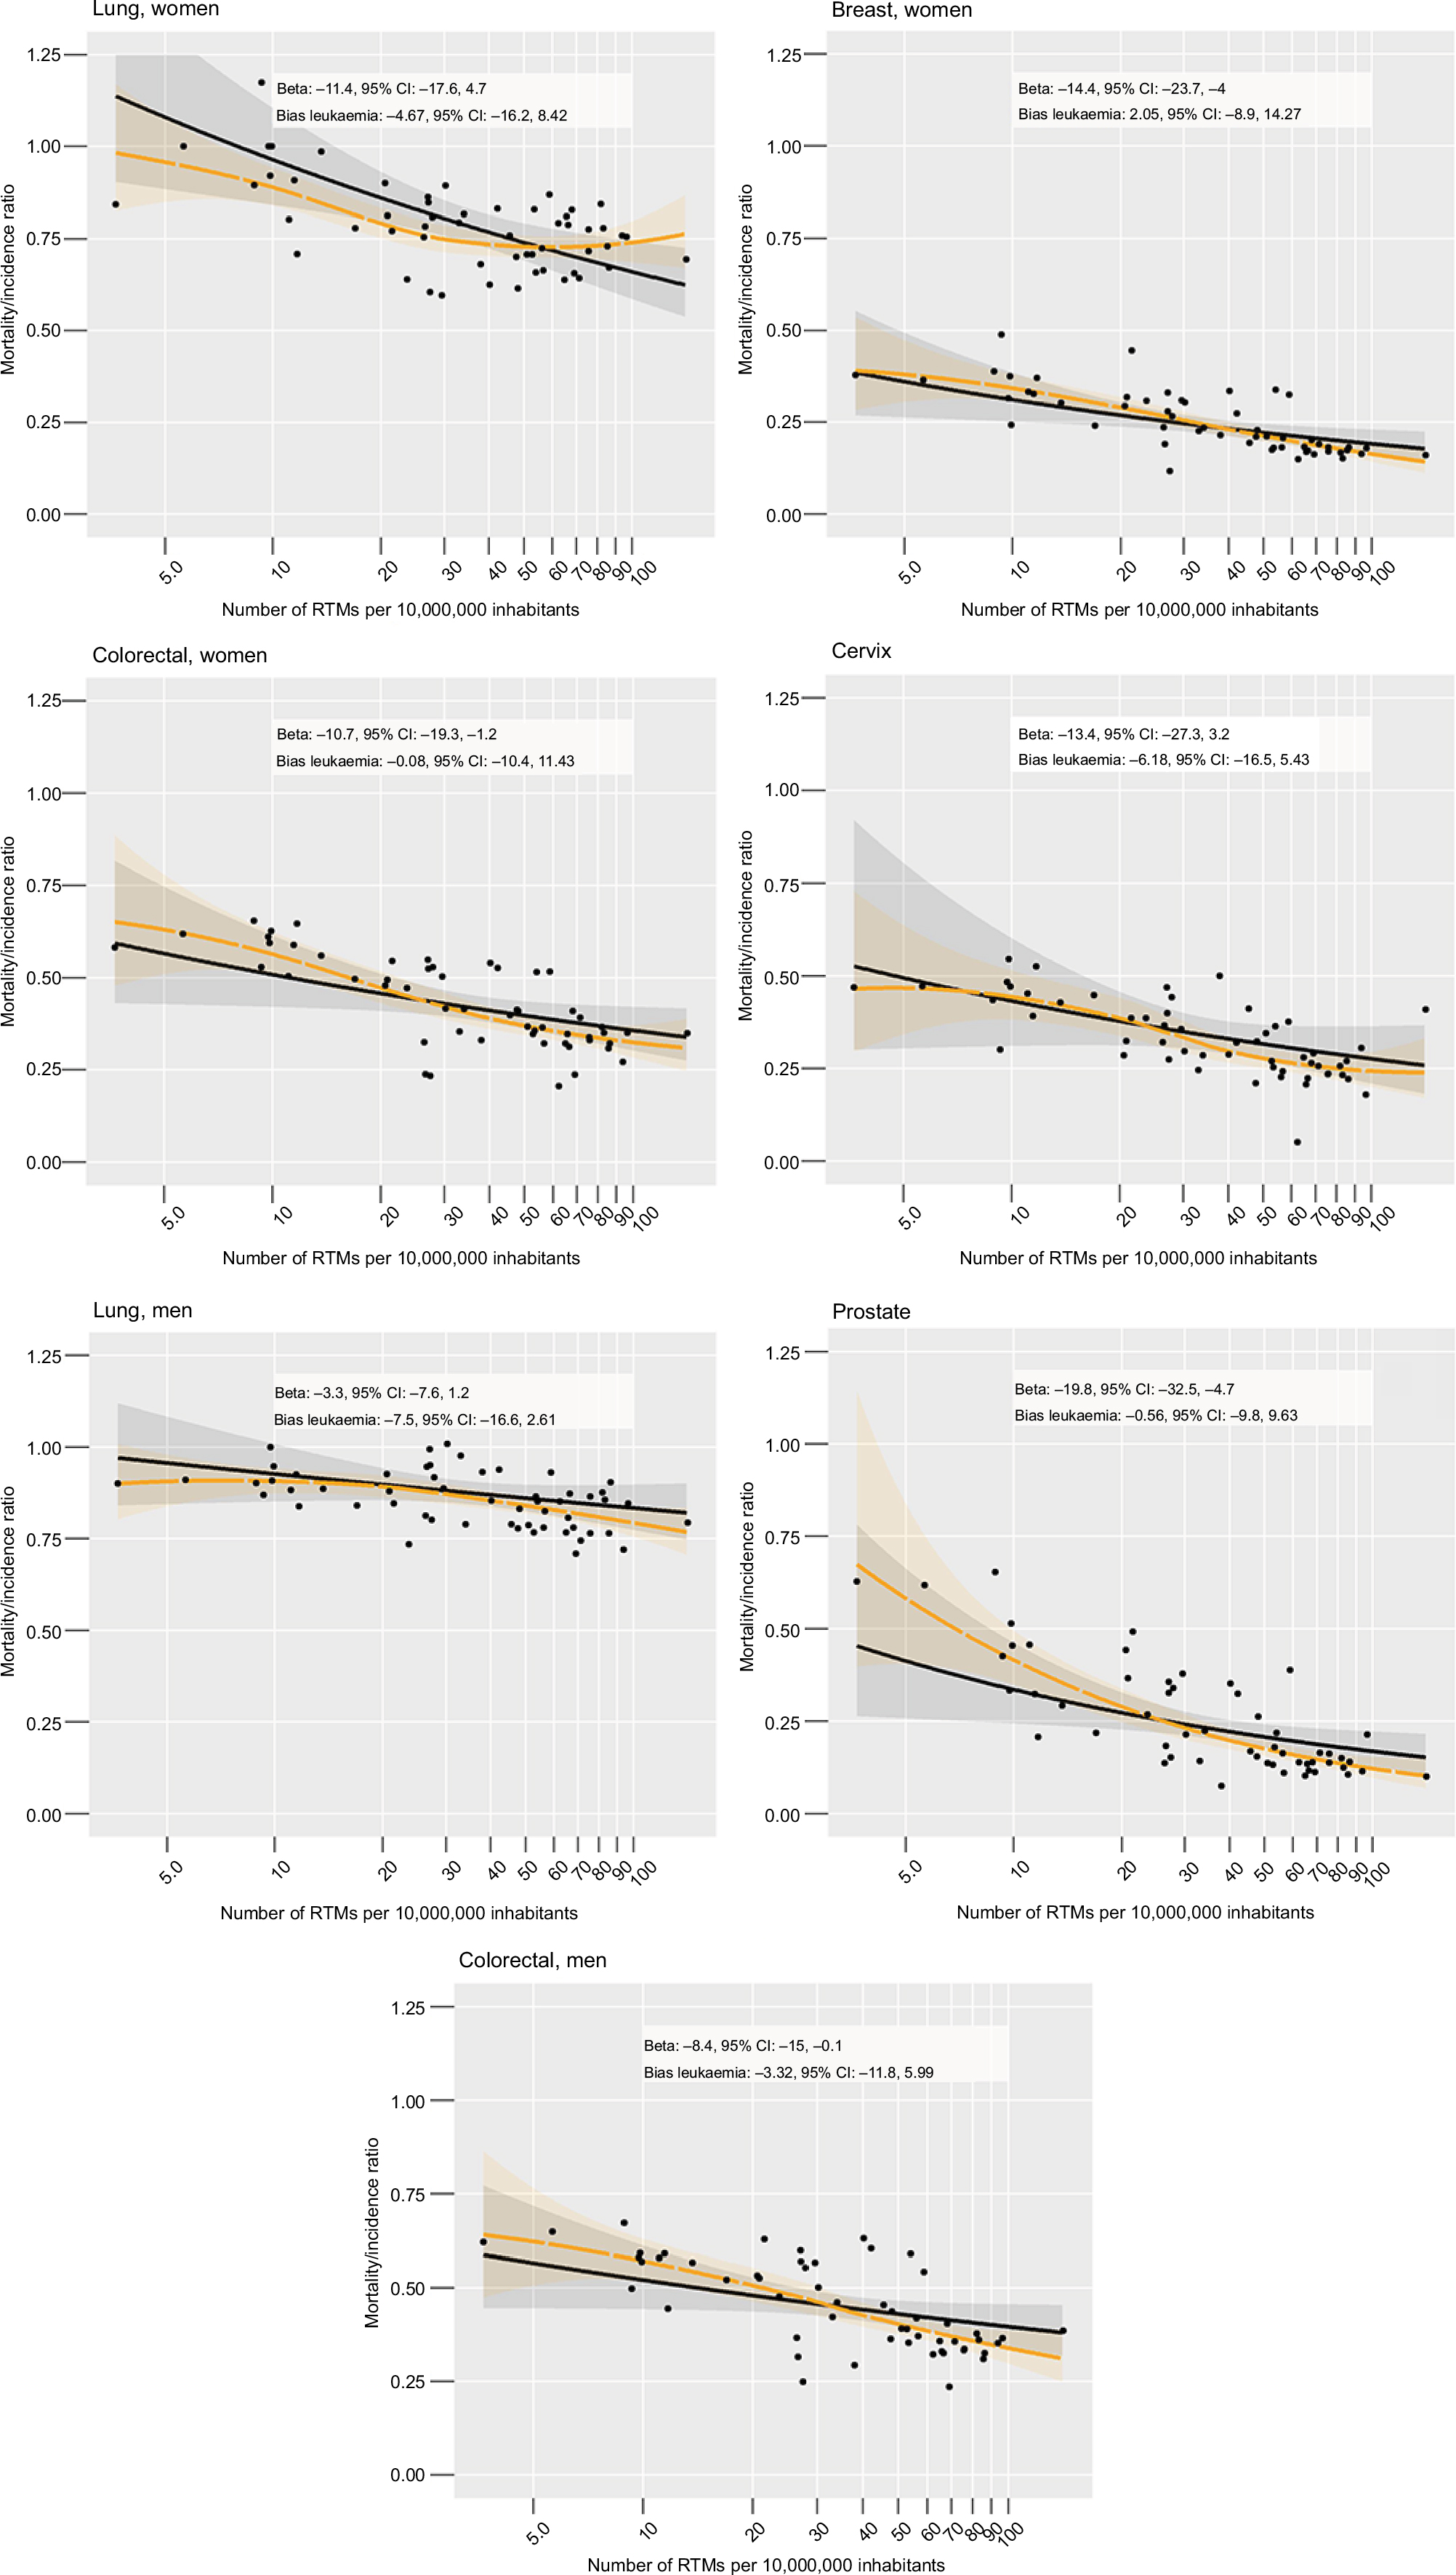
In countries with a low income (GDP ≤$4,035), we found no apparent effect of the population density of RTMs on cancer survival in the cancer types taken into account (Figure S6). The maximum density in these countries was <22 RTMs per 10,000,000 inhabitants. In the analysis of countries with poor data quality, we found an association between RTM density and cancer survival in women suffering from lung cancer, while effect estimates appeared to be generally weaker when compared to the analysis of high-quality regions affirming the previous sensitivity analysis (Figure S7). In analyses where RTM density was not log-transformed, we found similar relations, but again no evidence for a ceiling effect when models were covariate-adjusted (Figure S8).
Discussion
In summary, we found an inverse correlation between RTMs in the population and the cancer mortality/incidence ratio for prostate cancer and female breast and lung cancer. Focusing on potential confounders, we found no evidence for unobserved confounding in the respective analyses, but a dose–response relation for females giving rise to the conclusion that serious bias is unlikely to confound findings of those analyses.
Radiotherapy plays an important role either as a primary (prostate or lung cancer),22 an adjuvant (breast or lung cancer),23 or a neoadjuvant (rectal cancer)24 modality in the curative treatment of the mentioned cancer types.
In prostate cancer, where we found an association between RTM density and cancer survival, Widmark et al25 showed that high-risk patients have a threefold survival benefit from radiotherapy when added to androgen deprivation therapy. On the other hand, in the ProtecT trial, low-risk patients had no apparent survival benefit from radiotherapy when it was compared to active monitoring.26 Thus, the effect of a higher RTM density is likely to be confined to high-risk patients. The prevalence of high-risk cases or cases with regional disease (positive lymph nodes) was found to be around 10%–15%.27 However, it remains questionable whether patients who cannot receive radiotherapy because of a shortage of machines receive active monitoring, which is, in terms of quality, comparable to the approach of the ProtecT trial. Thus, if not rigorously pursued, failure to apply radiotherapy might still result in an adverse survival even for low-risk patients. Finally, because we took the ratio of mortality to incidence as the outcome into account, we can identify small absolute risk differences. With this approach, the long survival time observed in prostate cancer has weaker effect on associations as in time-to-event analyses.
In a recent study, Zubizarreta et al17 estimated the demand for radiotherapy by using an incident-based approach founded on the CCORE-EBEST9 (used also in the present study to estimate the demand) tool. They revealed that the need for RTMs was almost fulfilled in Europe and Latin America and that there was even a surplus in North America, all dominated by high-income countries. In our analyses, almost all countries belonged to the high-income (n=39) or high-middle-income group (n=11) according to the definition by Zubizarreta et al.17 Still we found evidence that points toward a mortality effect of the number of RTMs in the population. Thus, the clinical outcome of cancer-related mortality needs also to be considered when the question of a demand for RTMs is addressed. Even more, as re-irradiations were not considered in their study. Computation might underestimate the need, especially in high-income countries where disease progression/recurrence and retreatment are of increasing clinical relevance.28 Focusing on Europe, Rosenblatt et al29 described unmet needs for RTMs in several countries (again based on incident cases), which might eventually result in an adverse survival prospect when our results are considered.
As part of the ESTRO QUARTS project (quantification of radiation therapy infrastructure and staffing needs), Bentzen et al estimated the required RT capacities for different states in Europe.30 Taking differing national incidences into account and using a benchmark of around 450 treatment courses/year per linear accelerator, a gap between the actual provision and the calculated RT necessities was revealed. Discrepancies were highest for England, Czech Republic, Poland, and Slovenia with a supply of <60% compared with the evidence-based necessity. In a recent publication regarding European RT infrastructure, the projected needs for 2020 were evaluated.12 A general deficit of 25.6% was found regarding RT units and 18.3% for radiation oncologists. The establishment of new national or even European guidelines for the provision of RT services might help to ensure future quality in cancer care.
Considering the clinical manifestation of cancer, a recent study based on European countries showed how the optimal utilization of radiotherapy varies depending on incident cancer stages.10 This might to some extent explain the significant association between RTM density and cancer mortality found in our study even after adjusting for unmet demand, which did not consider cancer stages. Still, the variation in the optimal utilization due to the stages was of secondary importance when compared to tumor frequency and as a whole varied only by 3% between countries.10
In lung cancer, we observed a considerable difference in the association of cancer survival and the number of RTMs between men and women. This difference might be explained by a better response to chemotherapy and radiotherapy in women as it was found by previous studies.31,32 In contrast to women, men were more likely to receive a mere symptomatically treatment in a population-based cohort.33 Thus, in an ecological study, a potential survival advantage due to radiotherapy might be weaker in men than in women.
Furthermore, a higher population density of RTM might yield a higher quality of treatment by, eg, applying more advanced technology such as intensity-modulated radiation therapy due to a more competitive situation between centers.
Infrastructure is an important issue that is, however, difficult to address in ecological studies and was thus widely ignored by previous studies. In the present study, we adjusted for the country-specific infrastructure score. Analyzing data on an individual patient level, Baade et al34 determined a possible association between distance from radiotherapy facilities and survival outcomes of patients diagnosed with rectal cancer.34 Focusing on the region of Queensland (Australia), they found that patients living between 200–399 km away from the next RT center had a 30% greater risk of dying from their disease compared with those living within a range of 50 km. Thus, this study shows that regional access might contribute to the clinical outcome even in high-income countries, indicating that the fulfillment of the region-wide demand is not sufficient, but a slight surplus might actually be needed in order to reach all patients. This would explain the significant effect in our data even after adjusting for the estimated unmet demand. In the same light, an analysis of spatial effects by another study found a decreasing likelihood of receiving radiotherapy with an increasing travel distance to the next RT facility.35
Gatta et al1 established an interesting connection between total national expenditure on health (TNEH), the numbers of technical equipment, and cancer survival in the European Union.1 While European countries with high TNEH also had the highest numbers of CTs, MRIs, and RT devices, the number of such devices was also correlated with relative cancer survival, but correlation was stronger for diagnostic equipment (especially MRI; R=0.7) than for RT devices (R=0.3). However, their data suffered from a considerable amount of missing data, while the descriptive approach to statistical analyses does not allow for causal inferences.
Finally, nonlinear models and the analysis of low-income countries indicated that a minimum density of 20–30 RTMs per 10,000,000 inhabitants is required before the potential beneficiary effect of radiotherapy comes into effect and can be assessed on a population-based level.
Limitations
In the current data, we could not identify a saturation effect, which is the point where additional RT centers cease to reduce cancer-related mortality. From the visual assessment, it might be argued that the crude effect is somewhat mitigated above an RTM density >40/10,000,000 inhabitants, but the need for covariate adjustment makes it impossible to confirm this effect statistically. Indeed, it is very probable that such a point exists, but is not depicted by the data that are available. Rather, nonlinear models considering cubic splines indicated that there is no effect below a density of 30 RTMs per 10,000,000 inhabitants, but such nonlinear analysis suffers especially from the limited amount of available data.
In a similar light, the restricted sample size of 53 countries that could be considered for the analyses might lead to an overfitting of the regression model. However, judging from the increasingly complex regression models (models 1–3), estimates changed most strongly between models 1 and 2, while CIs increased only slightly between model 2 and the full model.
In general, with the limited amount of data, the accuracy of the effect estimation is considerably restrained resulting in wide CIs. Still, we found evidence for an association between the number of RTMs in the population and the incidence-related cancer mortality in the linear regression models.
As it was mentioned earlier, the main problem when such an association is examined results from unobserved confounders. Although we adjusted for several confounders that are relevant, we cannot fully exclude the possibility that important confounders remain missing or that the negative control might be imperfect. On the other hand, by choosing DALYs as a confounder, we might be overly conservative as DALYs might affect the number of RTMs and mortality simultaneously (acting as a confounder), but this inverse relation, that is, RTMs affecting DALYs, seems also reasonable which would likely result in an underestimation of our effect estimates.
Although the DIRAC database might be the most advanced data set on radiotherapy institutions on a global scale, it might still suffer from an incomplete acquisition. If this is related to the density of recorded RTMs, and to the outcome, a bias might occur that has the potential to overestimate or underestimate the effect (reverse correlation to outcome and RTM density or correlations in the same direction, respectively).
Due to the limited sample size, we cannot assess complex models, eg, by including interaction terms in the regression model. Considering the effect of population age, it might be reasoned that the effect of RTM density on cancer survival differs in relation to population age. However, the impact of “population age” might be weaker in ecological studies than the effect of “age” in studies with individual patient data.
Although we adjusted for the availability of a prostate cancer prevention program, we cannot assess its quality. Thus, the quality and population coverage of such a program or cultural aspects might still have a stronger impact than the density of RTMs, if negatively correlated.
Another source of bias might be the overdiagnosis due to screening programs in prostate cancer; if this is also related to the outcome, it might again function as a confounder. Changing treatment paradigms such as hypofractionated radiotherapy might alter the impact of covariates in the model. In this particular case, we would expect an improvement of unmet demand, while a possible survival benefit from a lower demand is conditioned on the availability and density of RTMs in the population.
In men, we could not confirm a relationship between the optimal proportion of subjects to receive RT and the estimated effect sizes as it was the case for women. Apart from the aforementioned clinical treatment response, this might be due to the more important impact of lifestyle risk factors in men (in types such as lung, esophagus, and oral cancer) that might contribute to the prognosis, making it difficult to compare countries with different lifestyle-related risk profiles. Finally, this might result in a subordinate impact of treatment facilities and is supported by only one statistically significant association between RT centers and cancer survival in men found for prostate cancer. In addition, radiotherapy is commonly applied in female breast cancer with an estimated proportion of >80%. However, there was no entity among the most common cancer types in men that has an equally high proportion of cases that receive radiotherapy, again lowering the statistical power.
As a mere ecological study, the current study fails to estimate effects on an individual patient level, and we cannot claim that these effects can be transferred to an individual patient level. In addition, with such a limited case number, the power to detect significant effects is low, and as mentioned, we face the problem of unobserved confounders. However, by applying several approaches to deal with unobserved confounding, we found evidence that a lower number of RTMs might lead to a disadvantageous survival prospect, at least for women. Finally, individual patient-based data are needed and should be addressed in further studies in order to understand the public health impact of our findings more fully.
Conclusion
We found evidence for an inverse association of RTM density in the population and the cancer mortality/incidence ratio for few cancer types, which were prostate cancer and female breast and lung cancer.
Acknowledgment
We acknowledge the financial support within the funding programme Open Access Publishing by the German Research Foundation (Deutsche Forschungsgemeinschaft [DFG]).
Disclosure
The authors report no conflicts of interest in this work.
References
Gatta G, Trama A, Capocaccia R. Variations in cancer survival and patterns of care across Europe: roles of wealth and health-care organization. J Natl Cancer Inst Monogr. 2013;2013(46):79–87. | ||
Verdecchia A, Francisci S, Brenner H, et al. Recent cancer survival in Europe: a 2000-02 period analysis of EUROCARE-4 data. Lancet Oncol. 2007;8(9):784–796. | ||
Stevens W, Philipson TJ, Khan ZM, Macewan JP, Linthicum MT, Goldman DP. Cancer mortality reductions were greatest among countries where cancer care spending rose the most, 1995-2007. Health Aff. 2015;34(4):562–570. | ||
Maruthappu M, Watkins JA, Waqar M, et al. Unemployment, public-sector health-care spending and breast cancer mortality in the European Union: 1990-2009. Eur J Public Health. 2015;25(2):330–335. | ||
Philipson T, Eber M, Lakdawalla DN, Corral M, Conti R, Goldman DP. An analysis of whether higher health care spending in the United States versus Europe is ‘worth it’ in the case of cancer. Health Aff. 2012;31(4):667–675. | ||
Delaney G, Jacob S, Featherstone C, Barton M. The role of radiotherapy in cancer treatment: estimating optimal utilization from a review of evidence-based clinical guidelines. Cancer. 2005;104(6):1129–1137. | ||
Hanna TP, Shafiq J, Delaney GP, Vinod SK, Thompson SR, Barton MB. The population benefit of evidence-based radiotherapy: 5-year local control and overall survival benefits. Radiother Oncol. 2018;126(2):191–197. | ||
Norlund A, SBU Survey Group. Costs of radiotherapy. Acta Oncol. 2003;42(5–6):411–415. | ||
Wong K, Delaney GP, Barton MB. Evidence-based optimal number of radiotherapy fractions for cancer: a useful tool to estimate radiotherapy demand. Radiother Oncol. 2016;119(1):145–149. | ||
Borras JM, Barton M, Grau C, et al. The impact of cancer incidence and stage on optimal utilization of radiotherapy: methodology of a population based analysis by the ESTRO-HERO project. Radiother Oncol. 2015;116(1):45–50. | ||
Barton MB, Frommer M, Shafiq J. Role of radiotherapy in cancer control in low-income and middle-income countries. Lancet Oncol. 2006;7(7):584–595. | ||
Datta NR, Samiei M, Bodis S. Radiotherapy infrastructure and human resources in Europe – present status and its implications for 2020. Eur J Cancer. 2014;50(15):2735–2743. | ||
Ferlay J, Soerjomataram I, Dikshit R, et al. Cancer incidence and mortality worldwide: sources, methods and major patterns in GLOBOCAN 2012. Int J Cancer. 2015;136(5):E359–E386. | ||
United Nations World Population Prospects: 2017 Revision, 2017, United Nations, accessed 24 August 2018, https://esa.un.org/unpd/wpp/Download/Standard/Population/ | ||
Steyerberg EW S. Clinical Prediction Models a Practical Approach to Development, Validation, and Updating. Statistics for Biology and Health. New York: Springer; 2009. | ||
Textor J, Hardt J, Knüppel S. DAGitty: a graphical tool for analyzing causal diagrams. Epidemiology. 2011;22(5):745. | ||
Zubizarreta E, van Dyk J, Lievens Y. Analysis of global radiotherapy needs and costs by geographic region and income level. Clin Oncol. 2017;29(2):84–92. | ||
Lipsitch M, Tchetgen Tchetgen E, Cohen T. Negative controls: a tool for detecting confounding and bias in observational studies. Epidemiology. 2010;21(3):383–388. | ||
Tchetgen Tchetgen E. The control outcome calibration approach for causal inference with unobserved confounding. Am J Epidemiol. 2014;179(5):633–640. | ||
Hill AB. The environment and disease: association or causation? J R Soc Med. 2015;108(1):32–37. | ||
R Development Core Team. R: a language and environment for statistical computing. Vienna, Austria: The R Foundation for Statistical Computing, 2016. | ||
Grimm P, Billiet I, Bostwick D, et al. Comparative analysis of prostate-specific antigen free survival outcomes for patients with low, intermediate and high risk prostate cancer treatment by radical therapy. Results from the Prostate Cancer Results Study Group. BJU Int. 2012;109(Suppl 1):22–29. | ||
Early Breast Cancer Trialists’ Collaborative Group (EBCTCG); Darby S, McGale P, et al. Effect of radiotherapy after breast-conserving surgery on 10-year recurrence and 15-year breast cancer death: meta-analysis of individual patient data for 10,801 women in 17 randomised trials. Lancet. 2011;378(9804):1707–1716. | ||
Pumprla J, Howorka K, Groves D, Chester M, Nolan J. Functional assessment of heart rate variability: physiological basis and practical applications. Int J Cardiol. 2002;84(1):1–14. | ||
Widmark A, Klepp O, Solberg A, et al. Endocrine treatment, with or without radiotherapy, in locally advanced prostate cancer (SPCG-7/SFUO-3): an open randomised phase III trial. Lancet. 2009;373(9660):301–308. | ||
Hamdy FC, Donovan JL, Lane JA, et al. 10-Year outcomes after monitoring, surgery, or radiotherapy for localized prostate cancer. N Engl J Med. 2016;375(15):1415–1424. | ||
Punnen S, Cooperberg MR. The epidemiology of high-risk prostate cancer. Curr Opin Urol. 2013;23(4):331–336. | ||
Yamazaki H, Fushiki M, Mizowaki T; the Kansai Cancer Therapist Group. A surveillance study of the current status of reirradiation and patterns of practice. J Radiat Res. 2017;58(1):71–78. | ||
Rosenblatt E, Izewska J, Anacak Y, et al. Radiotherapy capacity in European countries: an analysis of the Directory of Radiotherapy Centres (DIRAC) database. Lancet Oncol. 2013;14(2):e79–e86. | ||
Bentzen SM, Heeren G, Cottier B, et al. Towards evidence-based guidelines for radiotherapy infrastructure and staffing needs in Europe: the ESTRO QUARTS project. Radiother Oncol. 2005;75(3):355–365. | ||
Roengvoraphoj O, Eze C, Niyazi M, et al. Prognostic role of patient gender in limited-disease small-cell lung cancer treated with chemoradiotherapy. Strahlenther Onkol. 2017;193(2):150–155. | ||
Barrera-Rodriguez R, Morales-Fuentes J. Lung cancer in women. Lung Cancer. 2012;3:79–89. | ||
Radzikowska E, Głaz P, Roszkowski K. Lung cancer in women: age, smoking, histology, performance status, stage, initial treatment and survival. Population-based study of 20 561 cases. Ann Oncol. 2002;13(7):1087–1093. | ||
Baade PD, Dasgupta P, Aitken JF, Turrell G. Distance to the closest radiotherapy facility and survival after a diagnosis of rectal cancer in Queensland. Med J Aust. 2011;195(6):350–354. | ||
Lin CC, Bruinooge SS, Kirkwood MK, et al. Association between geographic access to cancer care and receipt of radiation therapy for rectal cancer. Int J Radiat Oncol Biol Phys. 2016;94(4):719–728. |
Supplementary materials
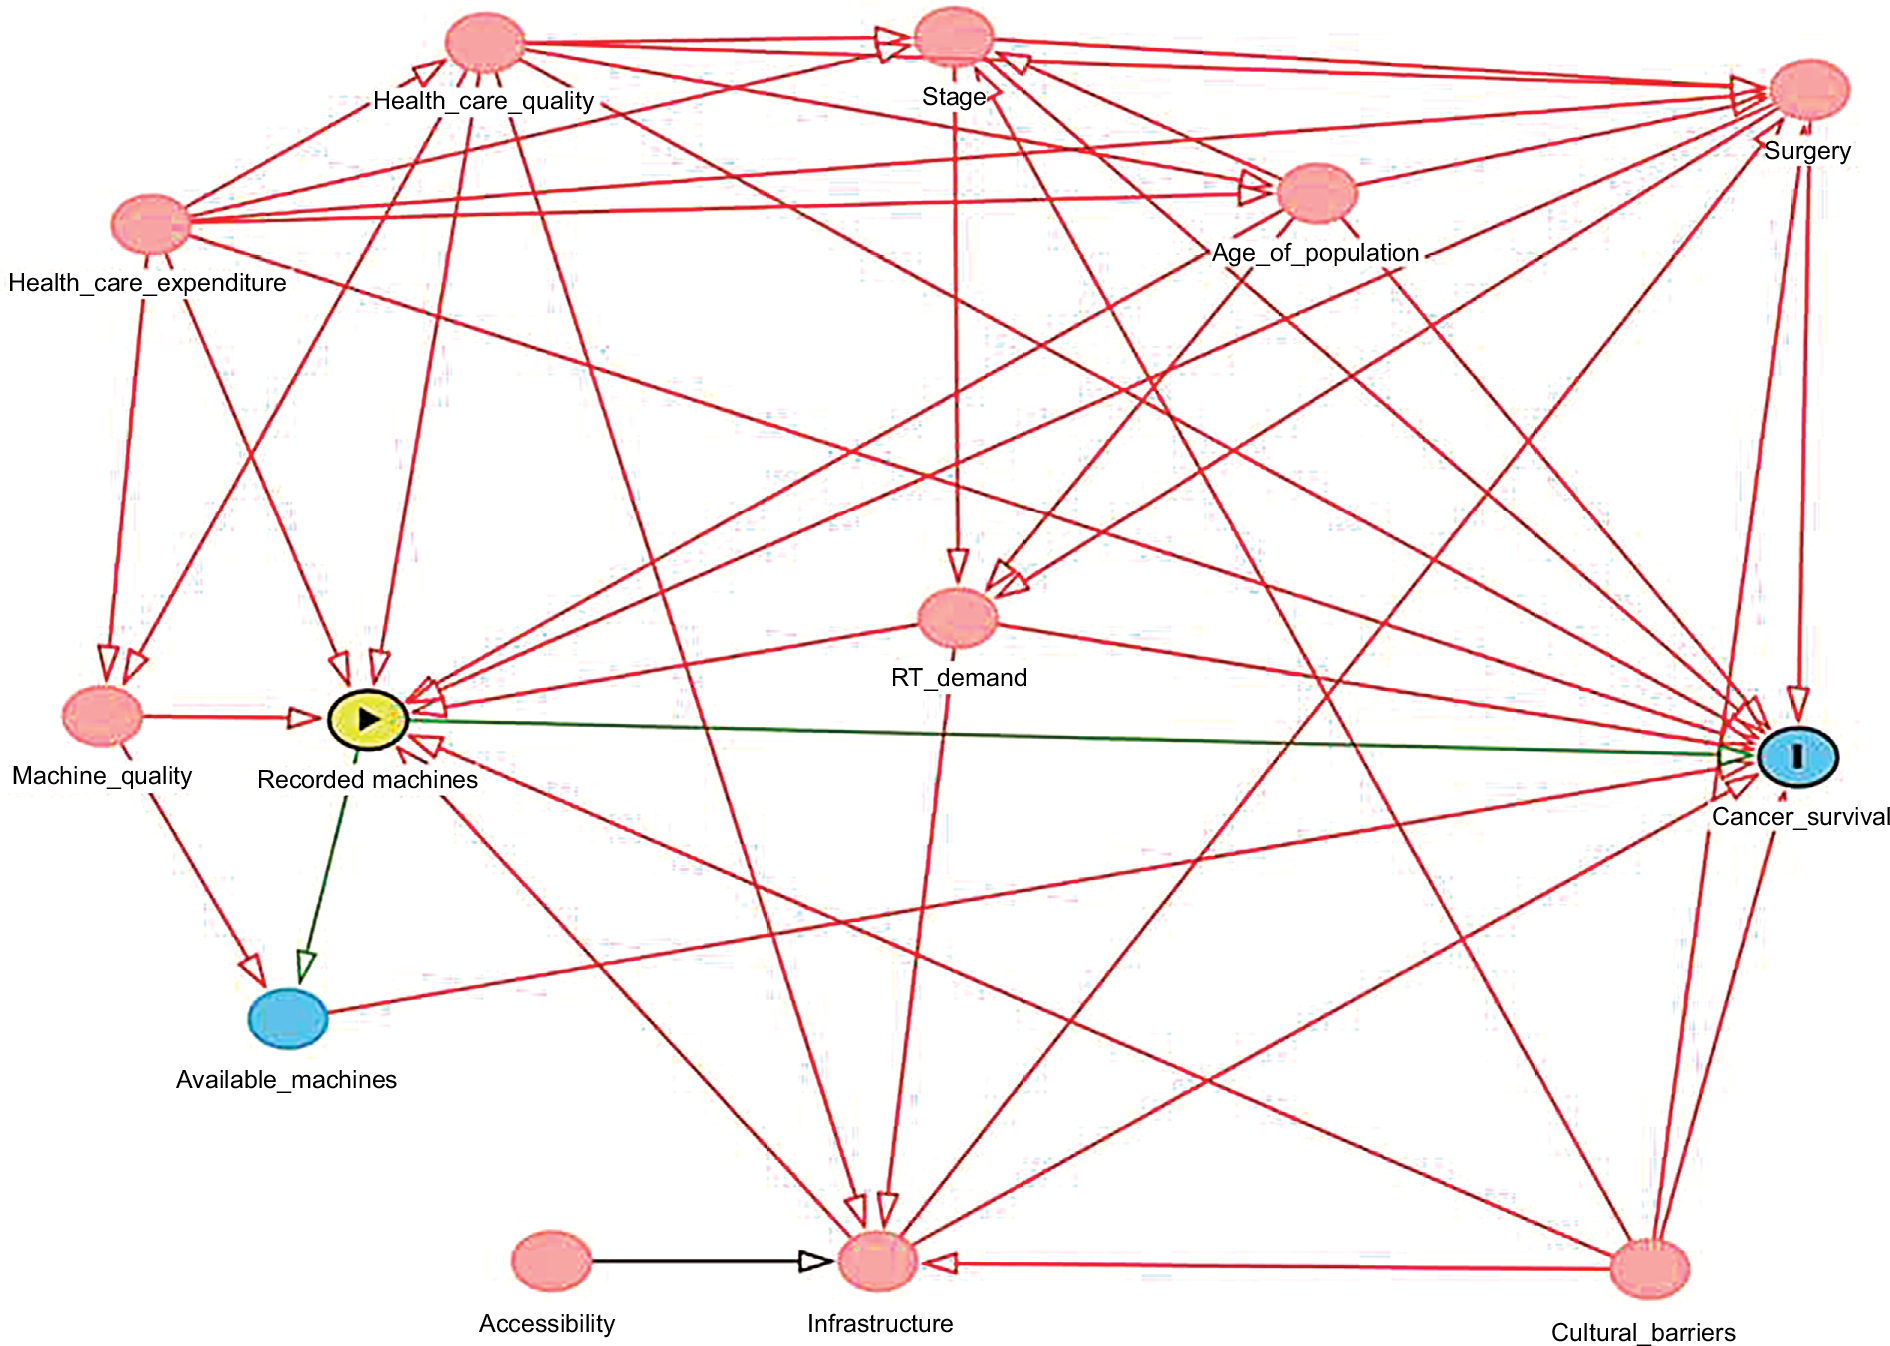 | Figure S1 Directed acyclic graphs used for covariate adjustment. Abbreviation: RT, radiotherapy treatment. |
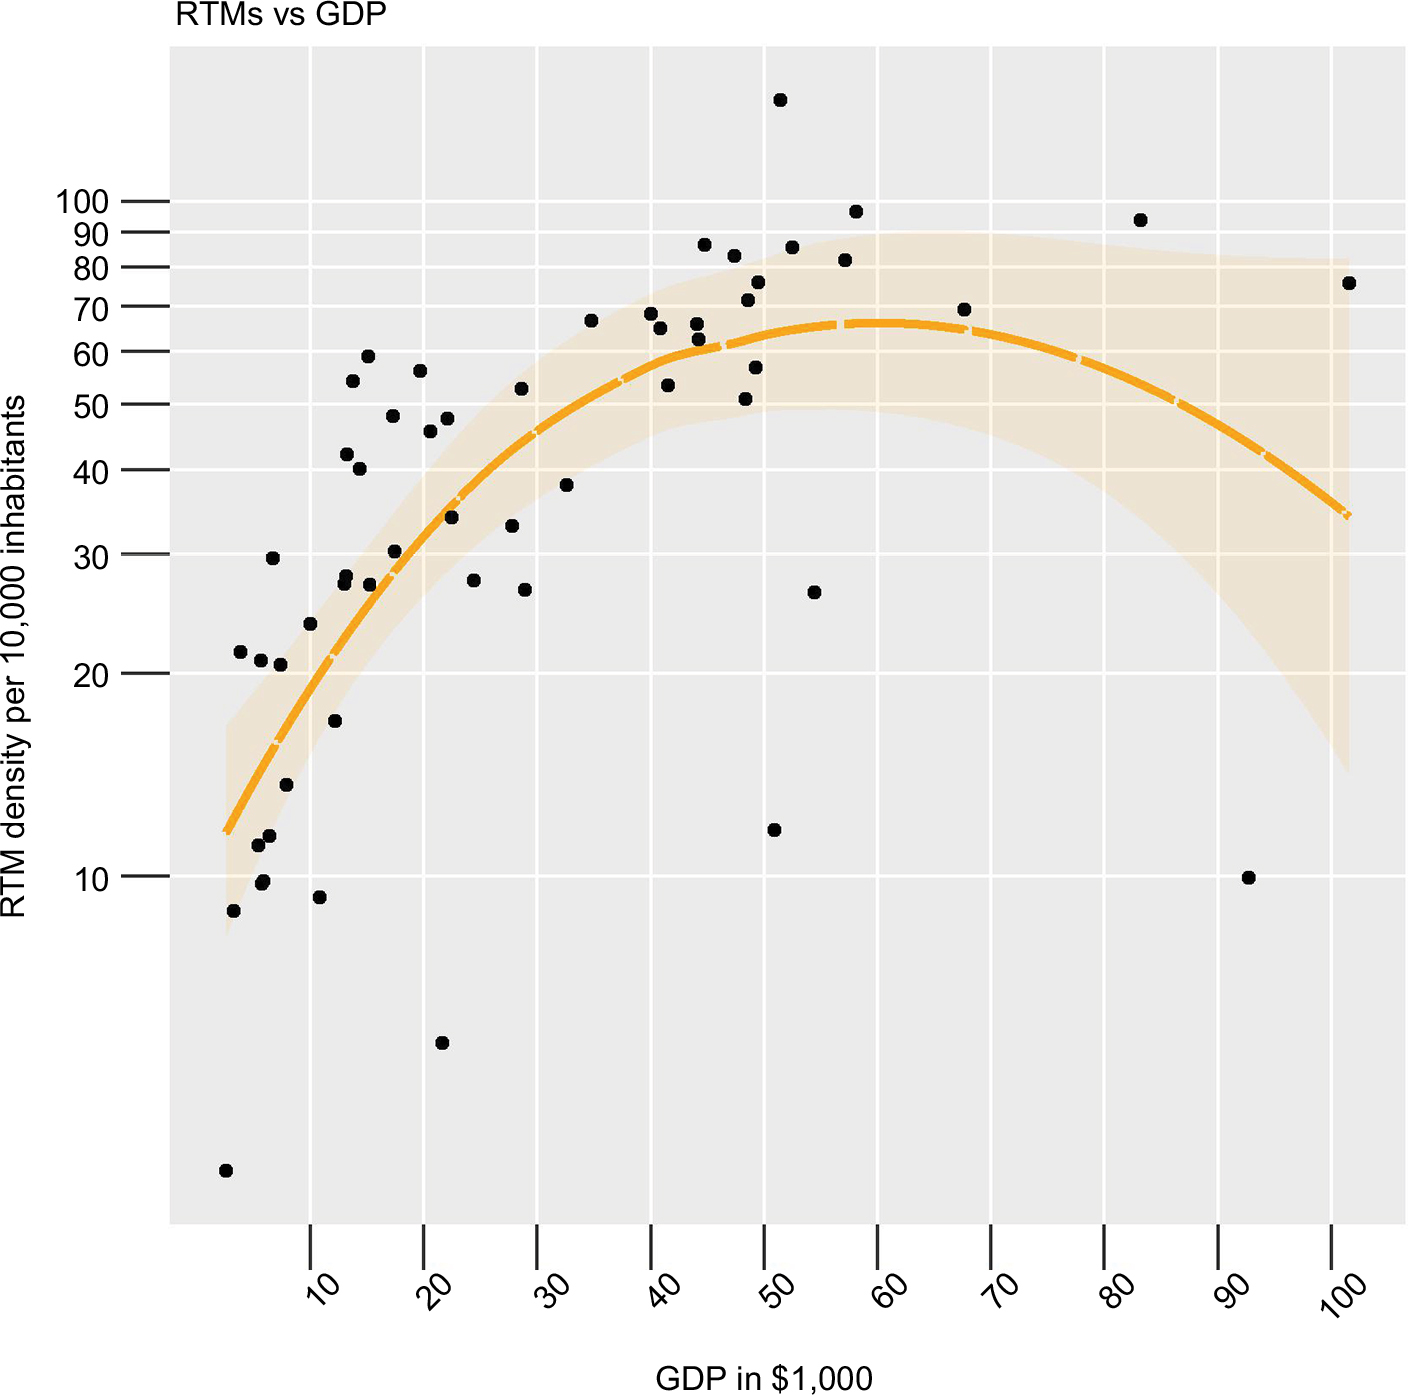 | Figure S2 Nonlinear association between GDP per capita and RTM density. Abbreviations: GDP, gross domestic product; RTMs, radiotherapy treatment machines. |
 | Figure S3 Observed estimated associations between the MIR and RTMs per 10,000,000 inhabitants considering nonlinear models. Notes: Gray band: 95% CI. Black line: predicted effects as estimated from the adjusted model considering restricted cubic splines. Yellow lines and band: estimates of the LOESS procedure1 with respective 95% CI. Abbreviations: LOESS, locally weighted scatterplot smoothing; MIR, mortality/incidence ratio; RTMs, radiotherapy treatment machines. |
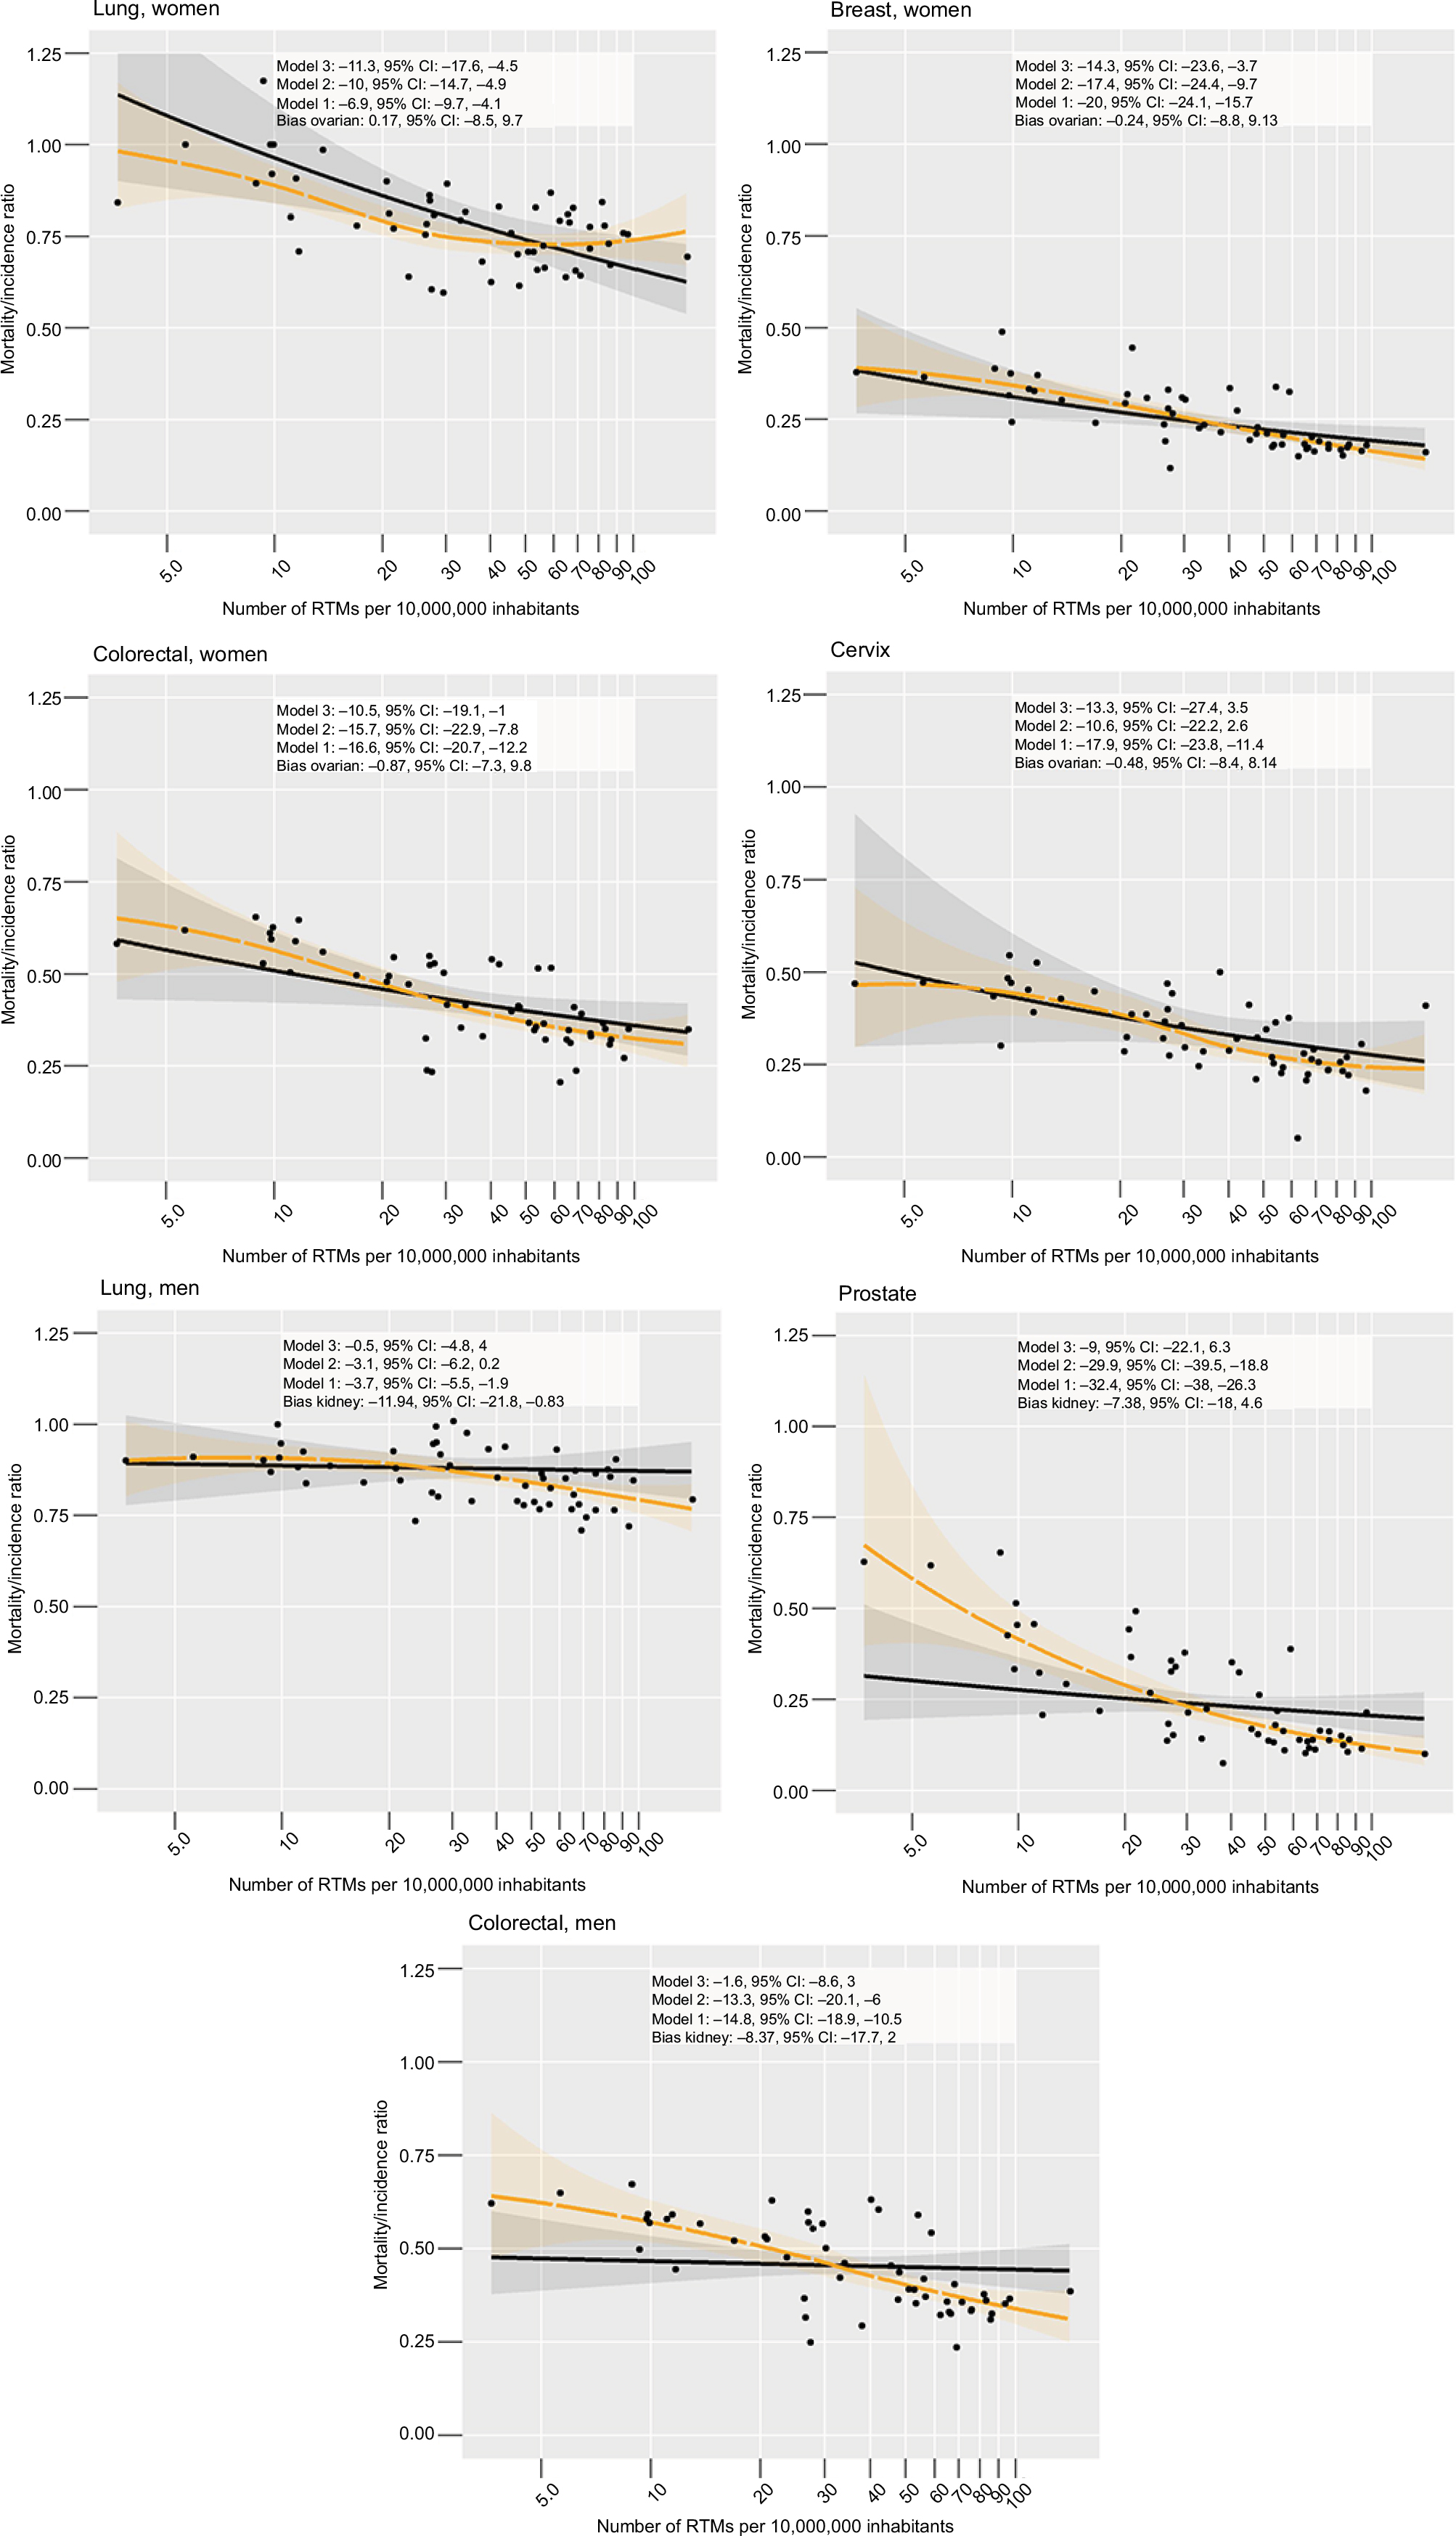 | Figure S4 Observed estimated associations between the MIR and RTMs per 10,000,000 inhabitants considering ovarian (women) and kidney cancer (men) as negative controls. Notes: Gray band: 95% CI. Black line: predicted effects as estimated from the adjusted model considering restricted cubic splines. Yellow lines and band: estimates of the LOESS procedure1 with respective 95% CI. Abbreviations: LOESS, locally weighted scatterplot smoothing; MIR, mortality/incidence ratio; RTMs, radiotherapy treatment machines. |
 | Figure S5 Observed estimated associations between the MIR and RTMs per 10,000,000 inhabitants without adjustment for negative controls. Notes: Gray band: 95% CI. Black line: predicted effects as estimated from the adjusted model considering restricted cubic splines. Yellow lines and band: estimates of the LOESS procedure1 with respective 95% CI. Abbreviations: LOESS, locally weighted scatterplot smoothing; MIR, mortality/incidence ratio; RTMs, radiotherapy treatment machines. |
 | Figure S6 Observed estimated associations between the MIR and RTM per 10,000,000 inhabitants in countries with a low GDP (≤$4,035 per capita). Notes: Gray band: 95% CI, Black line: predicted effects as estimated from the adjusted model considering restricted cubic splines. Yellow lines and band: estimates of the LOESS procedure1 with respective 95% CI. Abbreviations: GDP, gross domestic product; LOESS, locally weighted scatterplot smoothing; MIR, mortality/incidence ratio; RTMs, radiotherapy treatment machines. |
 | Figure S7 Observed estimated associations between the MIR and RTM per 10,000,000 inhabitants in countries with restricted data quality (GLOBOCAN label 3 or better, or “C” or better). Notes: Gray band: 95% CI. Black line: predicted effects as estimated from the adjusted model considering restricted cubic splines. Yellow lines and band: estimates of the LOESS procedure1 with respective 95% CI. Abbreviations: LOESS, locally weighted scatterplot smoothing; MIR, mortality/incidence ratio; RTMs, radiotherapy treatment machines. |
 | Figure S8 Observed estimated associations between the MIR and RTM per 10,000,000 inhabitants (RTM density not log-transformed). Notes: Gray band: 95% CI. Black line: predicted effects as estimated from the adjusted model considering restricted cubic splines. Yellow lines and band: estimates of the LOESS procedure1 with respective 95% CI. Abbreviation: LOESS, locally weighted scatterplot smoothing; MIR, mortality/incidence ratio; RTMs, radiotherapy treatment machines. |
Reference
Steyerberg EWS. Clinical Prediction Models a Practical Approach to Development, Validation, and Updating. Statistics for Biology and Health. New York: Springer; 2009. |
 © 2018 The Author(s). This work is published and licensed by Dove Medical Press Limited. The full terms of this license are available at https://www.dovepress.com/terms.php and incorporate the Creative Commons Attribution - Non Commercial (unported, v3.0) License.
By accessing the work you hereby accept the Terms. Non-commercial uses of the work are permitted without any further permission from Dove Medical Press Limited, provided the work is properly attributed. For permission for commercial use of this work, please see paragraphs 4.2 and 5 of our Terms.
© 2018 The Author(s). This work is published and licensed by Dove Medical Press Limited. The full terms of this license are available at https://www.dovepress.com/terms.php and incorporate the Creative Commons Attribution - Non Commercial (unported, v3.0) License.
By accessing the work you hereby accept the Terms. Non-commercial uses of the work are permitted without any further permission from Dove Medical Press Limited, provided the work is properly attributed. For permission for commercial use of this work, please see paragraphs 4.2 and 5 of our Terms.